


1 Introduction
Accumulating research has found that gain and loss frames affect unethical and selfish behavior, with the overall conclusion that a loss frame appears to foster more unethical, deceptive behavior than a gain frame (Reference Brewer and KramerBrewer & Kramer, 1986; Reference Cameron, Miller and de CremerCameron & Miller, 2009; Reference Grolleau, Kocher and SutanGrolleau, Kocher & Sutan, 2016; Reference Kern and ChughKern & Chugh, 2009; Reference Neale and BazermanNeale & Bazerman, 1985; Reference Pettit, Doyle, Lount and ToPettit, Doyle, Lount Jr. & To, 2016; Reference Robben, Webley, Weigel, Wärneryd, Kinsey, Hessing, Martin, Elffers, Wahlund, Van Langenhove and LongRobben et al., 1990; Reference Schindler and PfattheicherSchindler & Pfattheicher, 2017). For example, one study found that people cheated more on their taxes when facing a balance due (loss) than a refund (gain; Reference Robben, Webley, Weigel, Wärneryd, Kinsey, Hessing, Martin, Elffers, Wahlund, Van Langenhove and LongRobben et al., 1990). In a similar vein, another study found that participants playing a game in an experiment cheated more when their performance was tied to losing status than gaining status (Reference Pettit, Doyle, Lount and ToPettit et al., 2016). Barring the fact that losing money (or status) is obviously different from gaining it, research on gain/loss frames typically examines cases that ceteris paribus contain the same prospect, yet that prospect takes on a different meaning when it is framed as a gain or as a loss (for a review, see Reference KühbergerKühberger, 1998). Take for example the decision to acquire a business by unethical means: Study participants were more likely to engage in corporate eavesdropping when they had a 75% chance of losing the acquisition than when they had a 25% chance of gaining the acquisition (Reference Kern and ChughKern & Chugh, 2009). Why does loss framing provoke this unethical behavior? Decades of research have found that people are more risk-seeking in a loss frame, and more risk-averse in a gain frame (Reference Kahneman and TverskyKahneman & Tversky, 1984) – and unethical behavior is generally viewed as a risky choice (Reference Gino and MargolisGino & Margolis, 2011).
That said, nearly all of the studies that have tested the effects of gain/loss frames on unethical behavior have examined behavior in situations in which there is virtually no implied possibility of detecting unethical behavior. In fact, most studies are designed in such a way to precisely make participants feel as though detection is outright impossible. For example, participants are asked to shred materials that might evidence their unethical behavior (Reference Gino, Ayal and ArielyGino, Ayal & Ariely, 2009); or researchers use aggregate measures of dishonesty, such as the dice-under-a-cup task, which preclude measuring whether an individual cheats, but can detect dishonesty at the group-level (Reference Fischbacher and Föllmi-HeusiFischbacher & Föllmi-Heusi, 2013). In past studies, with few exceptions (e.g., Reference Robben, Webley, Weigel, Wärneryd, Kinsey, Hessing, Martin, Elffers, Wahlund, Van Langenhove and LongRobben et al., 1990), there is very little risk of getting caught should a participant decide to cheat, steal, etc. Thus, while theoretically, risk should explain the relationship between gain/loss frames and unethical behavior, risk of getting caught has not been highly salient in previous research.
Another caveat of past research is that it has tended to focus on unethical behaviors that have a solely self-serving advantage for the individual. However, a wide range of anecdotal evidence and recent reports suggest that individuals pursue unethical behavior with an ardor that goes beyond mere self-serving behavior. For example, among police, it is not uncommon for members to “plead the fifth” and remain silent to fellow members’ transgressions. Likewise, in business and politics, unethical behavior may manifest in cronyism or nepotism; and often this behavior is enacted for the benefit of others (Reference Padgett and MorrisPadgett & Morris, 2005). For instance, when accountants misrepresent an organization’s performance, it is sometimes for its shareholders’ or clients’ benefit (Reference Deis and GirouxDeis & Giroux, 1992). Likewise, in academia, it is perhaps not uncommon for dissertation advisors to gush about their students on the job market in recommendation letters, although their students may not merit such cajolery.
These examples suggest that unethical behavior is more nuanced than a matter of self-serving motives (Reference Hildreth, Gino and BazermanHildreth, Gino & Bazerman, 2016; Reference Levine and SchweitzerLevine & Schweitzer, 2015). However, researchers have generally treated unethical behavior as self-interested behavior, leaving us largely uninformed about unethical behavior that is motivated to help others in addition to the self.
In this regard, we carried out the following large-scale field study to test what effect frames will have on unethical behavior when the risk of detection is relatively high – choosing as our context one that contains not solely a high level of risk detection, but also, punishment for unethical behavior (when it is detected). Specifically, we examined 2,917 games across eleven seasons in the National Football League (NFL) of the U.S. Furnishing our measure of unethical behavior, we tabulated every instance a penalty was called against a player, and we coded whether that player’s team was currently winning (in a gain frame) or losing (in a loss frame). In this vein, we can measure whether unethical behavior (in the form of breaking the rules) is more likely when an alleged wrongdoer’s team is winning or losing, in a context where the risk of detection is relatively high and the transgression can benefit others and the self.
Besides testing the effect of gain and loss frames on misbehavior, our context enables something more. In football, there is an offense and a defense – and the players’ motives on each are not unlike the goals of regulatory focus (Reference HigginsHiggins, 1998). The offense tries to score points, akin to a promotion focus (where the focus is on acquiring gains); and the defense tries to avoid points from being scored, akin to a prevention focus (where the focus is on avoiding losses). More than just a superfluous operationalization, regulatory focus has itself been shown to affect unethical behavior – with results that are at odds with the findings in the literature on gain/loss frames. For example, Reference Gino and MargolisGino and Margolis (2011) found more cheating among participants primed with a promotion focus than a prevention focus, despite the former being associated with gains and the latter with losses. Likewise, Solgos (2015) found that a promotion focus leads to more cheating than a prevention focus, in particular because a promotion focus is associated with an eagerness for taking chances to attain a positive outcome, whereas a prevention focus is associated with caution and vigilance, which inhibit the temptation for cheating.
In fact, despite that most research has found that loss frames foster unethical behavior, some research on gain/loss frames has found a different pattern. For instance, despite the opening example describing that participants are more likely to cheat during a game to avert losing status than to gain status (Reference Pettit, Doyle, Lount and ToPettit et al., 2016), other research has found the opposite, whereby unethical behavior was found to be higher among study participants aiming to ascend in status than warding off a loss in status (Reference Vriend, Jordan and JanssenVriend, Jordan & Janssen, 2016). In additional support for the role of gain frames provoking unethical behavior, the main reason for cheating among college students is “to get ahead” (Simkin & McLeod, 2009, p. 447); likewise quoted for bankers who confess to making illegal trades (Reference Tenbrunsel and ThomasTenbrunsel & Thomas, 2015, p. 4).
Research on goal pursuit is also consistent with this idea that gain frames motivate more unethical behavior than loss frames: Research has shown that people who have yet to meet their goals are more likely to engage in unethical behaviors, precisely to attain their goals (Reference Ordóñez, Schweitzer, Galinsky and BazermanOrdóñez, Schweitzer, Galinsky & Bazerman, 2009; Reference Schweitzer, Ordóñez and DoumaSchweitzer, Ordóñez & Douma, 2004). In this vein, research has concluded that the more people are focused on individual gains, the more they are willing to deceive or cheat (Reference Schweitzer, DeChurch and GibsonSchweitzer, DeChurch & Gibson, 2005). In further support, research has found that participants who surpassed someone else’s task performance were more likely to behave dishonestly in the dice-under-a-cup task, in part because beating another person led participants to feel more entitled to rewards (Reference Schurr and RitovSchurr & Ritov, 2016). Relatedly, winning a lottery has also been found to increase dishonest behavior, compared with losing a lottery (Reference Siniver and YanivSiniver & Yaniv, 2018); and along these lines, research has also found that positive affect increases people’s dishonest behavior (Reference Vincent, Emich and GoncaloVincent, Emich & Goncalo, 2013).
Thus the answer to the question, do people cheat more when they have something to gain, or when they have something to lose, is ambiguous considering the mixed findings in the separate literatures on gain/loss frames and regulatory focus. To reconcile the findings, we investigated both gain and loss frames and crossed each with both types of regulatory focus to explore their separate and (heretofore untested) interactive effects on misbehavior, in a context that contains a high risk of detecting misbehavior. In particular we examined behavior that is committed with the purpose of helping oneself and one’s organization (team) to achieve its goals.
Given the substantial value and broad theoretical importance of unethical behavior, our work can be seen as an attempt to illuminate novel methodological and theoretical aspects of the connection between gain/loss frames, regulatory focus, and unethical behavior as well as a replication attempt of past work. In particular, while theoretically and separately, gain/loss frames and regulatory focus should affect people’s propensity for unethical behavior, it is typical for both frames and regulatory focus to co-exist: Someone can be in a gain frame or a loss frame, and simultaneously have a promotion focus or a prevention focus. This raises the question of how frames and regulatory focus work in tandem to affect unethical behavior. From an empirical and theoretical standpoint, it is noteworthy that no research has yet investigated how these two effects work jointly on influencing unethical behavior, despite the fact that both make predictions about individuals’ unethical behavior. We undertake this important theoretical task.
In a nutshell, we propose that gain/loss frames and regulatory focus work together to modulate unethical behavior in a way that corresponds to regulatory fit (Reference HigginsHiggins, 2000). When promotion focus is paired with a gain frame, or when prevention focus is paired with a loss frame, people experience regulatory fit – “feeling right” about what they are doing – compared to when promotion focus is paired with a loss frame, or when prevention focus is paired with a gain frame. Generally, when people experience regulatory fit and “feel right,” they feel more engaged, such that when there is a mismatch between gain/loss frame and regulatory focus, promotion focused people feel dejected in a loss frame, and prevention focused people feel quiescent in a gain frame (Reference Idson, Liberman and HigginsIdson, Liberman & Higgins, 2000). Germane to the current research, the “feel right” feeling that characterizes regulatory fit produces an experience that one’s current behavior is moral or correct (Reference Camacho, Higgins and LugerCamacho, Higgins & Luger, 2003). That is, more than just a pleasant feeling, regulatory fit is considered a feeling tied to “the use of means that are socially accepted or agreed on or match general moral principles” (p. 499). In other words, regulatory fit is tied to ethical behavior, which is often defined as behavior that is consistent with generally accepted norms of moral behavior (Reference Treviño, Weaver and ReynoldsTreviño, Weaver & Reynolds, 2006).
It is thus theoretically plausible that regulatory misfit could provoke unethical behavior. Several lines of research hint at this idea. In one study, Reference Spiegel, Grant-Pillow and HigginsSpiegel, Grant-Pillow, and Higgins (2004) found that participants who experienced regulatory fit were more likely to hand in an assignment on time, suggesting that among participants who experience regulatory misfit, students were less concerned about breaking the rules and missing the deadline. In other research, participants experiencing regulatory misfit judged both decisions and their organization’s procedures as less fair than participants experiencing regulatory fit (Reference Camacho, Higgins and LugerCamacho et al., 2003; Reference Roczniewska, Retowski and HigginsRoczniewska, Retowski & Higgins, 2018); and along these lines, research has shown that a sense of unfairness motivates unethical behavior (Reference Skarlicki and FolgerSkarlicki & Folger, 1997).
On balance, then, the evidence for gain/loss frames on unethical behavior is quite mixed. Some studies have found that loss frames foster unethical behavior, and some have found the opposite pattern – that gain frames foster unethical behavior. Quite possibly, one reason for these mixed findings is regulatory fit. In particular, when people experience regulatory misfit (such as when a prevention focused person is in a gain frame), they might be more prone to unethical behavior. In this vein, the primary objectives of our research are to test the effects of frames and regulatory focus on unethical behavior in a large-scale field study in order to provide more conclusive evidence. Viewed this way, our research attempts to replicate previous research on frames and regulatory focus, and extend it in three important ways: first, by studying unethical behavior in a context that contains a relatively high risk of getting caught; second, by examining a relatively unstudied form of unethical behavior – one that is both self-serving and benefits others; and third, by documenting the effects of regulatory misfit in influencing unethical behavior. The latter objective will help determine whether the previous research on gain/loss frames and unethical behavior has yielded equivocal results because the research has not accounted for an individual’s character and traits that are relevant to predicting unethical behavior.
2 Study Overview
To conduct our investigation, we examined 2,917 games across eleven seasons of the NFL (2002–2012). We analyzed these particular seasons because our data are from a publicly available website that contains every play-by-play description for these seasons, and only these seasons. By play-by-play, we mean that the data contain every instance that something notable happened during a game, like a tackle, a kick, a pass, an incomplete pass, etc. In total, this amounts to 473,899 plays. Because our investigation is on the impact of gain/loss frame and regulatory focus, we excluded plays that occur: (1) when teams are tied, since tied teams are in neither a gain nor a loss frame; (2) when one team punts to another, since during a punt, ball-possession changes from one team to the other, therefore it is not obvious which team possesses the ball; and (3) when penalties are called on both teams during a play, because the play-by-play descriptions data do not follow a consistent, decipherable pattern in these cases. Following these exclusions, our data contain 332,239 plays, including 27,350 penalties.
For each penalty, we recorded whether a player committed it when his team was winning or losing, and whether the player was on offense or defense. Respectively, these classifications furnish our measures of frame and regulatory focus. To conduct our main test, we carried out a fixed-effects Poisson regression model.Footnote 1 Following it, we carried out a series of robustness checks which account for factors that might plausibly alter a tendency to cheat and break the rules (e.g., player fatigue, penalty severity, so-called “good penalties”, player position, etc.); we also examined coach- and referee-decisions. In all, we find that our effects are robust to each of the extraneous factors that might plausibly affect when a player breaks the rules.
3 Preliminary Results
Before conducting our main analysis, we compared the proportion of penalties to total plays among gain- and loss-framed teams, promotion- and prevention-focused players, and in the respective four cells that interact frame with focus. These descriptive statistics enumerate the raw probability that a player commits a penalty according to frame and focus. Table 1 shows the results. We found a marginally significant main effect of gain/loss frame: the odds of a penalty are 2.33% higher while losing versus winning (95% confidence interval [CI] = [-0.09%, 4.75%], z = 1.86, p = .062). And we found a significant main effect of regulatory focus: the odds of a penalty are 35.7% higher for promotion- versus prevention-focused players (95% CI = [33.26%, 38.15%], z = 24.47, p < .001). Taken together, this pair of results provides modest-to-strong support for the separate findings in the literature that show that loss frames and promotion focus are, respectively, related to more cheating behavior than gain frames and prevention focus. Furthermore, these results extend the prior work by evidencing the effects in a field setting where cheating is carefully monitored (though, notably, the effect is smaller for frame than focus).
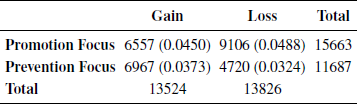
Crucially, we found a significant interaction between gain/loss frame and regulatory focus, which reveals a strong crossover effect, χ2(3) = 682.38, p < .001. Among the 332,239 plays, we found that promotion focused players attempt to cheat more when losing (9,106/186,619) versus winning (6,557/145,620). In contrast, these results flipped among prevention focused players; they attempt to cheat more when winning (6,967/186,619) versus losing (4,720/145,620). Thus, in a relatively strong way – the effect sizes (odds ratios) are 1.16 (95% CI = [1.12, 1.20], z = 7.63, p < .001) and 1.09 (95% CI = [1.06, 1.12], z = 5.08, p < .001), respectively – we found that among prevention focused players, the odds of cheating are 16% greater when in a gain frame than in a loss frame; whereas among promotion focused players, the odds of cheating are 9% greater when in a loss frame than in a gain frame.
4 Main Results
It is possible that our preliminary results are due to an omitted, confounding variable associated with specific games that affect players’ tendency for committing fouls. This might include the personnel features of a game, such as the teams, coaches, and referees; or the temporal features of a game, such as the weather, time-of-day, or time-in-season; or physical features, such as the stadium or city. To account for these potential omitted variables which could bias our results, we estimated a Poisson regression model with game-level fixed-effects. This analysis allows us to test if the crossover effect is robust across game-level effects. For example, if, say, coach-decisions or weather are surmised to produce the crossover effect, then by including game-level fixed-effects, our analysis accounts for the unobserved heterogeneity among coaches and weather – which rules out the possibility that the crossover effect can be attributed to coach-decisions or weather.
Specifically, the model estimates the number of penalties in game j under frame f and focus s, such that:

Where we adopt the standard log-link function for λjfs, such that: ![]()
Here, Promotion jfs is an indicator equal to one when the penalized player is on offense, and zero otherwise; Gain jfs is an indicator equal to one when the penalized player’s team is winning, and zero otherwise; Plays jfs is the count of plays per cell; {β1, β2, β3, β4} are parameters to be estimated; and {β0j} is a vector of estimated game-specific fixed-effects controlling for any omitted variable that is constant within a game.
Because our outcome is the count of penalties, Plays jfs is a critical control in this model. It is possible that more plays occur under certain game conditions, making it reasonable to expect more penalties in these situations even in the absence of any psychological effects. Encouragingly, under the rules of football, this cannot affect our main effects related to frame and focus, because the counts associated with the main effects are consistent across offense and defense; i.e., each play involves both an offense and a defense, and one team is losing if the other is winning. However, it is possible that the crossover effect may simply reflect the volume of plays and not the propensity for cheating behaviors. Congruent with this hypothesis, we observe that the offense is losing on 56.2% of plays analyzed. Plays jfs allows us to control for the discrepancy in the number of plays per condition.
The results of the fixed-effects Poisson regression are available in Table 2. We estimated three models to test for the separate effects of frame (Model 1), regulatory focus (Model 2), and their interaction (Model 3). As expected, the number of penalties is positively related to the number of plays; the resulting parameter estimate for Plays jfs is positive and significant in each model. While controlling for Plays jfs and game-level fixed-effects, we find differences associated with both frame and regulatory focus: penalties are more likely while losing versus winning (b = -0.022, t = 1.83, p = .067) in Model 1, and penalties are more likely for promotion- versus prevention-focused players (b = 0.293, t = 24.42, p < .001) in Model 2. In lock-step with the preliminary analysis, this pair of findings replicates the separate findings that show that loss frames and promotion focus are, respectively, related to more cheating behavior than are gain frames and prevention focus.
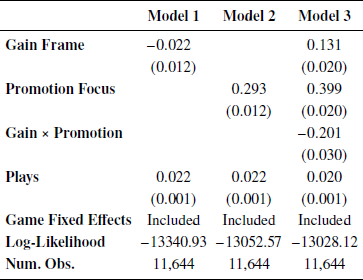
It bears noting that the effect of frame in both the preliminary analysis and Model 1 is marginally significant. Evidently, the effect of frame has a small impact on unethical behavior, which is perhaps expected considering the research shows that both gain and loss frames will increase unethical behavior. In our analysis, the estimated effect of frame reflects the difference between gain and loss frames. To the extent that both frames impact unethical behavior in the same direction, the difference in their influence is the net effect of one frame’s impact over the other. Such, then, is the small effect of loss frame on unethical behavior: the effect of loss frame may not be small per se; rather, the net effect between loss frame and gain frame is in favor of a slightly stronger loss frame than gain frame.
Of import, the interaction (Model 3) between gain/loss frame and regulatory focus is significant, revealing a crossover effect. We found that prevention focused players attempt to cheat more when winning versus losing (b = 0.131, t = 6.40, p < .001). In contrast, these results flipped among promotion focused players; they attempt to cheat less when winning versus losing (b = -0.070, t = 3.87, p < .001). Here, the effect size is the sum of the main effect of gain frame (b = 0.131, t = 6.40, p < .001) and the interaction between gain frame and promotion focus (b = -0.201, t = 6.81, p < .001). The corresponding standard error is calculated via the delta method.
Notably, by incorporating fixed-effects at the game-level, the crossover effect cannot be due to any omitted variable or combination of omitted variables that are fixed within games. For example, games are played on different days of the week, at different times (from morning to evening), during different weather (from sunny to snowy), in different cities and stadiums, etc. The crossover effect that we document here is significant irrespective of these factors which could, conceivably, influence unethical behavior (e.g., in previous research, time-of-day, weather, and jersey-color have been found to relate to committing unethical behaviors; Reference Kouchaki and SmithKouchaki & Smith, 2014; Reference Frank and GilovichFrank & Gilovich, 1988; Reference RansonRanson, 2014).
To better understand the impact of gain/loss frame and regulatory focus, we exponentiate the parameter estimates from Model 3 to transform them into incident rate ratios. These ratios indicate the expected percentage change in the rate at which penalties are committed in the corresponding condition. For example, we expect penalties to increase by 2.0% (exp(0.020) ≈ 1.02) for each additional play, all else held constant. Turning to the impact of frame and focus, when prevention focused players are in a gain frame versus a loss frame, we expect the penalty rate to increase by 14.0% (exp(0.131) ≈ 1.140). In contrast, promotion focused players commit 6.7% (exp(-0.07) ≈ 0.93) fewer penalties when in a gain frame versus a loss frame. Thus, promotion focused players commit more penalties in a loss frame, while prevention focused players commit more penalties in a gain frame.
5 Discussion and Robustness Checks
In sum, we found a crossover effect between frame and focus. Among defensive players, the probability of cheating increases by 14.0% while in a gain- versus loss-frame; whereas among offensive players, the probability of cheating decreases by 6.7% while in a gain- versus loss-frame. The sizes of these effects are surprising. The players in our data face high stakes and receive high incentives; they are experienced professionals yet they could appear to behave in tune with the whims of regulatory fit. Frankly, it is precisely among highly paid and highly experienced professionals whom we ought not to expect evidence of biased decision making (Reference Levitt and ListLevitt & List, 2008). Which is to say that despite players’ extensive training and experience, and despite the well-defined rules of the game, and despite the high risk of detecting misbehavior, players appear to behave in unison with the socio-situational effects of regulatory fit. Moreover, we find that the crossover effect is robust to game-level fixed-effects. By including game-level fixed-effects in our regression, our results preclude many alternative explanations, in the form of factors that distinguish one game from another game, such as differences between coaches or weather.
However, a major downside of our field data is that we cannot directly measure players’ regulatory focus which limits what we can confidently conclude about the role of regulatory fit in our findings. Other explanations may be possible. For example, players could be making a deliberate trade-off between the risk of getting caught and the acquired benefit of cheating. In the spirit of understanding the findings further, we examined several unique game-factors and -situations which could shed further light. The primary benefit of these additional analyses is to assess the generalizability of the crossover pattern. We tested if the same crossover pattern would emerge in different cases, such as when a team is down by more than one possession, or in the final two minutes of a game, or when a passing play is likely (in addition, we looked at game-factors, like team-quality, player position, etc.). If the crossover pattern surfaces across situations, then we can be more confident that the crossover pattern (irrespective of what causes it) is indeed robust. A secondary benefit of these analyses is that the results could permit speculation as to the theory, be it regulatory fit or an alternative theory. Crucially, as we demonstrate next, the crossover findings are consistent after accounting for other possible factors that vary within a game.
5.1 Costs and Benefits of Cheating
In many sports, penalties may provide the penalized team with a strategic advantage. For example, losing basketball teams will frequently foul their opponent to stop the clock in the closing seconds of a basketball game. In contrast, the NFL, which oversees the rules and regulations under which the games in our data were played, has gone to considerable lengths to ensure that penalties are unlikely to provide a strategic advantage to the penalized player’s team. For example, teams have the right to decline the consequences of any penalty committed against them during a play. Therefore, if Team B receives a penalty and benefits from the penalty (akin to committing a strategic foul), then Team A has the right to decline the penalty, thus annulling the benefit Team B receives. This is unlike the rules in basketball, in which a team may benefit despite committing a foul. In this vein, “beneficial penalties” that are strategic to commit do not generally exist in football.
However, if “beneficial penalties” did exist and were driving our effect, one might reasonably expect that our findings would hold for just a small subset of penalties. This is because it is unlikely that all, or even many, types of penalties are strategically advantageous. To test this alternative explanation, we examined whether our findings hold for individual types of penalties. Table 3 contains the five most frequently called penalties on both the offense and the defense, respectively. These ten penalties amount to 91.7% of all penalties. Many of these penalties can only be called on either the offense or the defense (i.e., defensive offside cannot be called on the offense), so we cannot examine the role of regulatory focus at this level. However, we can still examine the impact of frame for the respective penalties on offensive and defensive players. To do this, we ran separate χ2 analyses for each of the penalties. The resulting proportions and p-values are available in Table 4. Our preceding main analysis revealed that the gain frame has a positive impact on defensive penalties and a negative impact on offensive penalties. Of the ten comparisons, nine are in the direction of the crossover pattern (the likelihood of this happening by chance is 0.0098 percent), including five comparisons that are significant (p < 0.05) and two that are marginally significant (p < 0.10). In general, our findings are robust to the type of penalty committed, indicating that the results are not attributable to a few strategically committed examples.

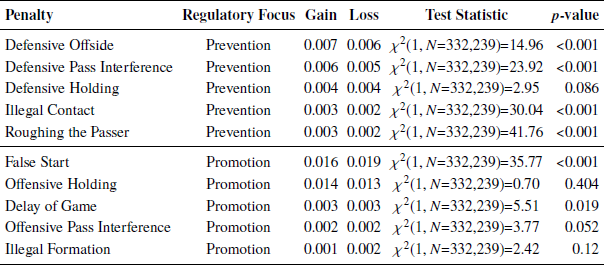
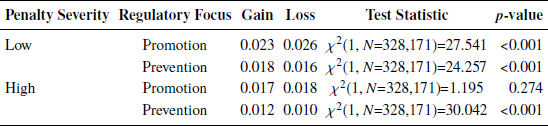
Similarly, if players are committing penalties with strategic intent, we would expect that they are evaluating the potential benefits of each infraction with respect to their costs, and would likely opt for a lower cost infraction all else equal. Thus, if strategic behavior were driving our findings, we would expect that our findings hold for small- but not large-cost penalties. The most direct cost of a penalty is the yardage assessed. For 85.2% of the penalties in our data, we can determine the assessed yardage from the play description (for the remaining 14.8% the yardage was not noted in the description, nearly always because the penalty was declined). Among these plays, the median was five yards for a penalty. We subset the data based on whether the assessed yardage exceeded five yards or not, and ran separate χ2 analyses by group. The resulting proportions and p-values are available in Table 5. Again, all findings are directionally robust, and three of the four are statistically significant at p < 0.001. Thus, it does not appear that players are strategically evaluating the benefits of an infraction vis-à-vis the potential costs.
Another situation that could provide evidence of strategic intent is a game’s point-differential. When a team is down by one possession, the game is closer than if the score is separated by two or more possessions. Possibly, the benefit to cheating would be higher in closer games, because the score can change more easily; a currently losing team can become the winning team in just one play. We subset the data based on whether the current point-differential exceeds 8 points or not. We chose 8 points because this is the differential at which the losing team can become the winning team in just one possession. A score-differential of more than 8 points would require at least two possessions. Our results are robust to such a split. The crossover pattern is significant in both instances: when the score-differential is currently 8 points or lower vs. greater than 8 points (Table 6).

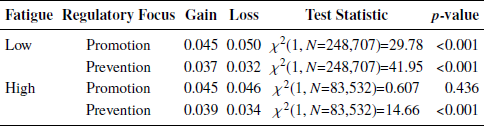
Finally, if players were making strategic decisions with respect to the expected costs and benefits of committing a penalty, then this trade-off may look different among more-fatigued players compared to less-fatigued players (Reference Lambourne and TomporowskiLambourne & Tomporowski, 2010). In football, the offense earns a new set of four downs each time they move the ball forward ten yards. This can lead to the offense and defense remaining on the field for many consecutive plays and could produce fatigue, though not necessarily disparately by offense and defense.Footnote 2 To control for this type of fatigue, we created a variable, Fatigue, which is equal to one when the current series of plays has lasted longer than the average in our data (6.3), and zero otherwise. We ran separate χ2 analyses by group (the results are presented in Table 7). All findings are directionally robust to differences in fatigue, and three of the four differences are statistically significant at p < 0.001.
The above findings, coupled with the carefully refined rules of the game, does not definitively rule out the potential for making strategic trade-off decisions, in the form of committing strategic penalties. How the crossover effect evidences among transgressions that are more or less planned (i.e., intentional vs. less intentional) is an interesting and still open question – in part because it is not obvious whether regulatory misfit would only influence misbehavior that is, say, unplanned. Research has found that misbehavior, in the form of dishonesty, has both intentional and unplanned (automatic) origins (Reference Köbis, Verschuere, Bereby-Meyer, Rand and ShalviKöbis, Verschuere, Bereby-Meyer, Rand & Shalvi, 2019). And in the fast-paced game of football, cheating may stem from both planning and impulse. Due to the richness of our data, we can provide additional empirical speculation on whether fouls that are committed intentionally are more or less consistent with the crossover pattern.
One penalty-type in particular, intentional grounding, is a foul that is intentionally committed. In our data, the effect is notably stronger for intentional grounding, χ2(1, N = 332,239) = 17.788, compared with most of the penalties that comprise the top ten (as shown in Table 4, the preceding effect of intentional grounding exceeds six of the top ten penalties). Notably, there are likely cross-penalty differences in intentionality. However, as Tables 4 and 5 show, the crossover effect is robust across penalty-type and -severity, which suggests that if some penalty-types are inherently more intentional, then regardless if committing a penalty is planned or impulsive, the crossover effect is observed all the same.
5.2 Other Game- and Situation-Factors
In addition to players’ strategic intent, there exist many other factors that might explain, or at least contribute to, our findings. In order to demonstrate that the crossover pattern is robust across such factors, we carried out the following robustness checks.
5.2.1 Coach Decisions
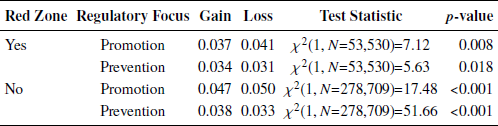
We examined two in-game scenarios that stem from coach decisions. First, we explored whether the offense was in the red zone (i.e., within 20 yards of the end-zone). Certain plays become infeasible when the offense is near the end-zone (e.g., long passing plays would end up out of bounds), and this limits what decisions coaches typically make. In our data, 16.1% of plays occur in the red-zone. To explore whether our findings generalize across plays, we subset our data based on regulatory focus and whether the play occurred in the red zone or not. We then ran separate χ2 analyses on each of the subsets. The results are available in Table 8. All findings were statistically significant (p < 0.05) in the the form of the crossover pattern. Thus, our effects do not depend on whether a play occurred in the red zone.
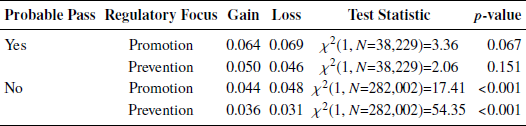
Second, we explored a subset of plays in which the offense is considerably more likely to pass the ball, and the defense is likely to be aware of this tendency. This occurs on third (and some fourth) down plays where there are seven or more yards to go for a first down. In our data, probable passing plays represent 11.5% of all plays. We subset the data based on regulatory focus and this criterion, and ran separate χ2 analyses. The results are in Table 9. Our findings are directionally consistent across all conditions. Specifically, the findings are statistically significant (p < 0.001) when it is not a probable passing play, and marginally statistically significant for promotion focused players on probable passing plays.
5.2.2 Referee Decisions
NFL referees are evaluated on a weekly basis in a process that considers both the penalties they called and those they may have missed. For each referee, every play in every game is evaluated. Through this process, they are graded and ranked among the other NFL referees. Those with the highest ranks are awarded prestigious positions, such as the opportunity to referee the Super Bowl. Those in the lower third are put on performance improvement plans, and in the absence of observed improvements they are fired. As a result, the referees have an incentive to be correct and consistent in their play calling.
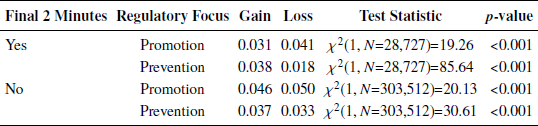
However, no system is perfect, and referees may be subject to biases. For example, Reference Green and DanielsGreen and Daniels (2014) documented an “impact-aversion” bias among baseball umpires. Not wanting to make a mistake that could alter the outcome of a game, Green and Daniels found that baseball umpires make calls that are measurably less pivotal (i.e., less “game-changing”), in the form of favoring a ball-call over a strike-call in situations that allow play to continue. In football, impact-aversion could manifest in calling fewer penalties following the “two minute warning” in which there are two minutes left in a game. Calling a penalty at the end of a game has the potential to alter the final outcome. Accordingly, referees may behave differently and make different decisions during the final two minutes of a game. In our data, 8.6% of plays were executed in the final two minutes of a game. We again subset the data based on regulatory focus and this criterion, and ran separate χ2 analyses. The results are available in Table 10. All findings were consistent with the crossover pattern and statistically different from zero (p < 0.05).
5.2.3 Team
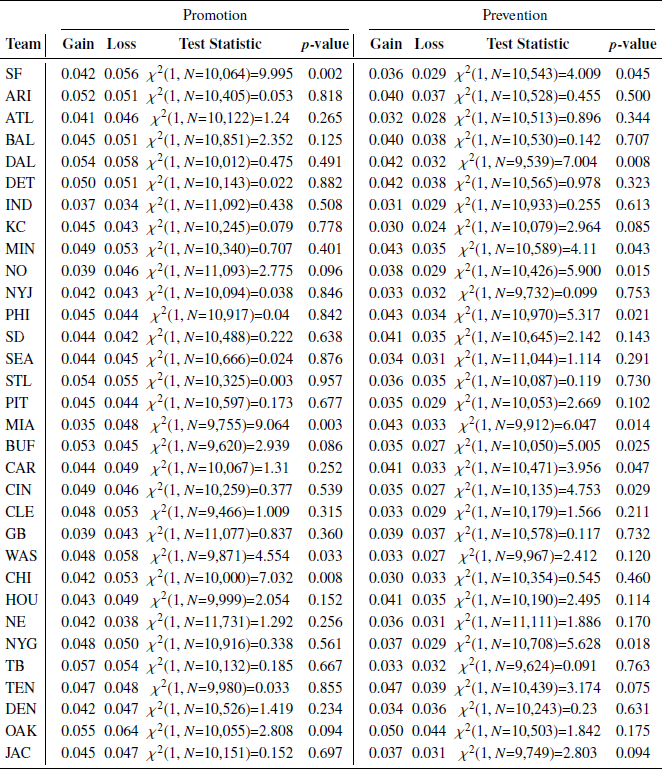
Although our game-level fixed-effects factor in the Poisson regression already controls for team, we conducted a separate analysis to test the extent that the crossover effect is consistent across teams. We conducted 64 separate χ2 analyses, one for each team in our data. The resulting team-specific estimates are available in Table 11. Across the 64 analyses, the effects are in the direction of the crossover pattern for 52 analyses (the likelihood of this happening by chance is 1.78 × 10⁻⁷ percent). Of the 52 analyses, 14 are statistically significant (p < 0.05). None of the 12 results that were in a counter-direction were statistically significant. Thus, we do not have evidence that runs counter to our core results for any of the NFL’s 32 teams.
5.2.4 Team Quality
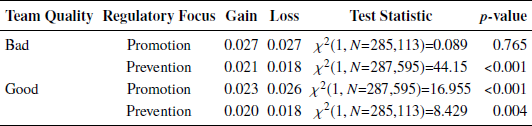
In order to look at teams in more detail, we assessed the crossover effect among “good” and “bad” teams (i.e., team quality), based on the total number of wins a team has at the end of each season. NFL teams generally play 16 regular season games, followed by a four round sudden death playoff among the top 12 teams. By considering only the number of wins (vs. percentage of wins or number of losses), we avoid penalizing teams that make the playoffs (i.e., have more opportunities for losses). We define a low-quality team (a “bad” team) as a team with fewer wins than losses, and a high-quality team (a “good” team) as a team with more wins than losses, at the season-level. We subset our data based on this criterion and ran separate χ2 tests for each group. The resulting proportions are presented in Table 12 along with the corresponding p-values from the χ2 tests. Directionally, all findings are robust to differences in team quality. Further, three of the four differences are statistically significant at p < 0.01.
We conducted a second test of team quality, one that compares which team has more wins by the end of the season. This provides a test of relative team quality. With this test, we assigned team quality such that the “better” team in each game had more wins while the “worse” team had fewer, as measured at the end of the season. Note, this is different from the preceding analysis because it assigns relative team quality within each game. For example, a 12–4 team has net-8 wins (and would be classified as a “good” team in the preceding analysis) but it would be classified as the “worse” team in this analysis when facing a team with 13 or more wins. By assessing the relative quality of the competing teams, we are better able to capture the impact of being a “better” or “worse” team within each game. As with the previous measure of team quality, all four findings are directionally robust, with three of the four differences as statistically significant at p < 0.05 (Table 13).

5.2.5 Player Position
To explore whether our findings generalize across player positions, we subset our data to focus only on penalties committed by each of the top five penalized positions on offense and defense (listed in Table 14), and ran separate χ2 analyses on each. For the ten positions, we find that all but one are in the direction of the crossover pattern (the likelihood of this happening by chance is 0.0098 percent), with significant differences for six of the ten positions. Thus, it appears that our results generalize across player positions.

5.2.6 Season
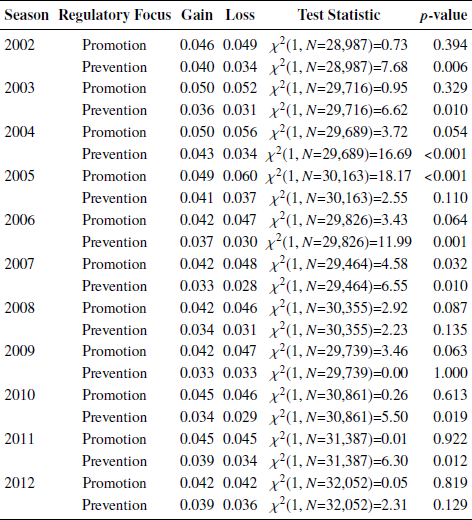
As with team, the game-level fixed-effects factor in the Poisson regression already accounts for season. However, in a separate analysis, we examined whether our results are driven by one or a few seasons, or if our results tend to apply more generally, by subsetting the data by season. The resulting season-specific estimates are available in Table 15. Across all 22 comparisons, all effects were in the direction of the crossover pattern (the likelihood of this happening by chance is 2.38 × 10⁻⁷ percent); nine of the 22 tests were significant (p < 0.05). Thus, our effects appear robust across seasons.
6 General Discussion
In the ongoing exploration of the impact of self-regulatory mechanisms on affect, behavior, and cognition, the effects of gain/loss frames and regulatory focus on unethical behavior have emerged as a prominent topic of research. Yet to date, research on unethical behavior has been limited to people making mainly risk-free (detection-free) choices. For contrast, our investigation illuminates how fairly people behave in an interactive context when their deception can be found out, punished, and responded to (in kind). In addition, our study included both gain/loss frames and regulatory focus, which may help disentangle past, mixed findings. Constituting the largest dataset combining gain/loss frames and regulatory focus ever assembled, our data replicated past separate effects of loss frame and promotion focus – and revealed the heretofore undocumented circumstances when both frames and foci could significantly foster unethical behavior.
Only a small handful of studies have investigated unethical behavior in natural conditions (e.g., Reference Griffin, Kruger and MaturanaGriffin, Kruger & Maturana, 2019; Reference Millar, White and ZhengMillar, White & Zheng, 2019; Reference Rajgopal and WhiteRajgopal & White, 2015). Our study contained 27,350 transgressions in a sports context, which allowed us to demonstrate that cheating may be less prevalent when there is regulatory fit, compared to misfit. Still, our study has its limitations, discussed next.
6.1 Limitations
We did not manipulate gain/loss frame nor regulatory focus. We presumed these variables in our data. These variables have high face validity to the extent that past research has tested and manipulated frames and regulatory focus in precisely the same way that we have coded them in our research. In research on gain/loss frames, it is not uncommon to test an athlete’s or a gambler’s current state of contest-winning versus -losing in terms of gain and loss frame, respectively (Reference Bartling, Brandes and SchunkBartling, Brandes & Schunk, 2015; Reference Berger and PopeBerger & Pope, 2011; Bucciol, Hu & Zarri, 2018; Reference De Martino, Kumaran, Seymour and DolanDe Martino, Kumaran, Seymour & Dolan, 2006). Furthermore, past work on regulatory focus in the sports psychology literature supports our operationalizing the offensive and defensive players as respectively promotion- and prevention-focused (Reference Converse and ReinhardConverse & Reinhard, 2016; Reference KrawietzKrawietz, 2013; Reference Memmert, Plessner, Hüttermann, Froese and UnkelbachMemmert et al., 2015; Reference Plessner, Unkelbach, Memmert, Baltes and KolbPlessner, Unkelbach, Memmert, Baltes & Kolb, 2009; Reference Unkelbach, Plessner, Memmert, Forgas, Baumeister and TiceUnkelbach, Plessner, & Memmert, 2009; Reference Yen, Chao and LinYen, Chao & Lin, 2011). As Reference Shao, Grace and RossShao, Grace, and Ross (2015) put it, “A person exhibiting a high promotion/low prevention focus may be considered to be playing on the offense while a person exhibiting a high prevention/low promotion focus may be considered to be playing on the defense” (p. 615).
Although it is encouraging that past research has documented a connection between offensive and defensive positions and promotion and prevention foci, we have also conducted tests at the player-position level which provides its own support. We found that for the top five fouling positions on both offense and defense, nine are in the direction of the crossover pattern (with six being significant). As noted, the likelihood of this happening by chance is 0.0098 percent. Although we cannot verify in our data that offensive and defensive players are respectively promotion- and prevention-focused, these results show that the fouls committed by offensive and defensive players are generally consistent with the fouls we would predict among promotion- and prevention-focused players.
However, because we did not manipulate these variables, our conclusions could appear ambiguous on grounds of causality and theory. First, one might counter-argue that regulatory misfit is not, as we argue, influencing unethical behavior; but rather, the direction of the bona fide effect could be in reverse, as though unethical behavior is influencing regulatory misfit. However, unlike most correlational field studies, questions about reverse causality are untenable in our research. Consider that in our data, both frame and regulatory focus cannot be altered after a player commits a penalty; therefore, our findings would struggle to be re-interpreted as a case whereby unethical behavior is influencing regulatory misfit. Even if one considers that our data include only misbehaviors that were detected (vs. undetected) – which we acknowledge leaves open the possibility that the frame could change after cheating (because undetected cheating could subsequently change the score and therefore frame) – it still would not be possible to argue that unethical behavior is influencing regulatory misfit, because when undetected cheating leads to a change in frame, it can only change from losing to winning – it cannot change from winning to losing (i.e., after a player cheats, his team’s points cannot drop below the pre-cheating score; the score can only stay the same, or increase if the cheating is undetected). Therefore, in order for unethical behavior to affect regulatory misfit, both frames must be allowed to change – e.g., when the frame cannot change from winning to losing, this renders it impossible for a promotion focused player’s regulatory fit to change from fit to misfit. Quite simply, since the frame cannot change in our data after committing a penalty, neither can regulatory fit, which renders regulatory fit unmalleable to changes in ethical behavior – at least in our data. Theoretically, it is still possible for unethical behaviors to influence regulatory (mis)fit – but in our research it is not a plausible candidate interpretation of the findings.
Second, other theories besides regulatory fit could explain the crossover pattern that we observe. Since our data are field data, it can only go so far with ruling in regulatory fit. That said, it is encouraging that we have a lot of data, and are thus able to provide some comment or light on potential explanations and boundary conditions. One alternative explanation is that players could be making deliberate cost-benefit (or risk-reward) trade-off decisions. In light of the crossover pattern, this would imply that for offensive players, the perceived reward of cheating is greater than its cost when losing, whereas for defensive players, the perceived reward of cheating is greater than its cost when winning. From a cost-benefit perspective, in football (and most sports), the benefit to cheating may in fact be greater than its cost when currently losing, especially close to the end of a game. This is because most sports’ outcomes are binary; teams post a win or a loss (and it typically matters less by how much a team wins or loses). Therefore, if a team is already down, there is little cost to cheating to get ahead. At worst, the losing team will lose by more points if caught, but the final outcome will be the same regardless if a team unsuccessfully cheats or plays fair.
This line of thinking could explain offensive players’ behaviors, but it struggles to explain defensive players’ behaviors since the trade-off decision reverses for defensive players; they cheat more when winning – which is a costly strategy because a team can quickly lose its lead if caught cheating. What could otherwise explain why defensive players cheat while winning? It could be a piqued concern for not wanting to “blow the lead”. When a team that is currently winning loses its lead, it is most likely because the opposing team scored on its defense. This could place blame on the defense; their primary role is to stop points from being scored, and this role is crucial when the opposing team’s offense could change the score in their favor – as though the stakes are higher for stopping points while currently winning compared to stopping points while currently losing. This could be the case because for a currently winning defense, the score could qualitatively and unfavorably change when scored on (from currently winning to currently losing), whereas for a currently losing defense, the game’s victor-loser status is unchanged when scored on.
While theoretically possible, our robustness checks can speak a little to whether blame-aversion or deliberate cost-benefit decision making are observed in our data. For one, we find that defensive players commit more fouls while winning in both cases in which the game-score is separated by one possession or by multiple possessions. For a one-possession game-score, the current victor-loser game status can change in one play, which should place more pressure or blame on the defense when it is scored on, compared with a multiple-possessions game-score. As Table 6 shows, the defense fouls more in both cases; in fact, the effect is bigger for multiple possessions, for which there is theoretically less blame.
Relatedly, we can also speculate a little on whether the effects are due to making strategic or deliberate cost-benefit decisions. If players are making a deliberative trade-off and this is driving our results, then one might expect our findings to hold only when the underlying penalties are of lower cost. In contrast, we found our results to be robust across a range of penalty types and with respect to the yardage assessed (the most direct cost of a penalty). Further, if strategic decisions are driving our results, this trade-off may look different among more-fatigued players compared to less-fatigued players (Reference Lambourne and TomporowskiLambourne & Tomporowski, 2010). In our data, we observed the same pattern among low- and high-fatigued players. We also observed the effect among both intentional fouls (intentional grounding) and other fouls. We cannot assess if the other fouls were intentional or not, but we do see evidence of the crossover pattern across a range of fouls. Assuming that fouls are more or less intentionally committed, the data do not clearly locate a role for strategic decision making in our findings. All told, the robustness checks demonstrate the breadth and generalizability of the finding, but they can only speak a little to the prevalence of the theory, which leaves open the role of regulatory fit, and other possible theories as well.
Of relevance, it may be argued that fouls in sports are qualitatively different from committing unethical behaviors, perhaps because of how frequently fouls occur in sports. Yet in keeping with a straightforward definition of cheating (from the Oxford English Dictionary: “to act dishonestly or unfairly in order to gain an advantage, especially in a game, a competition, an exam, etc.”), it follows that rule-breaking in sports qualifies as cheating. This behavior not only violates the rules but is committed to gain an advantage. Still, what is considered unethical is subjective. For self-serving reasons, fouling players (and their fans) may not consider the fouls as cheating, but fouled players (and their fans) may feel differently and classify the fouls as cheating (Reference Hastorf and CantrilHastorf & Cantril, 1954). On the discussion of whether rule-breaking in sports is unethical, the sport ethicist, Warren Reference FraleighFraleigh (1984), argues that any rule-breaking behavior in a sports contest committed by a player to gain advantage is committing a moral violation. For instance, Fraleigh writes that breaking the rules is “a moral concern because it is an exploitation of those who competed in good faith” (p. 73). Despite Fraleigh’s conclusion, cheating in sports is not the same as cheating in other domains like school or work or taxes. Therefore it is an open question whether our results would apply to other kinds of unethical behavior, including other kinds of cheating behavior. People may hold divergent perceptions of cheating behavior according to whether cheating happens in sports versus other domains.
Although what is considered cheating may not be widely agreed on, a benefit to conducting research on fouls in sports contests is observability. As put by Reference Balafoutas, Chowdhury and PlessnerBalafoutas, Chowdhury, and Plessner (2019):
… contrary to many situations in business, politics, or other domains of public and economic life in which individuals can conceal their behavior (or are legally obliged to do so), behavior in sports is observable and very well documented. Most sports events are nowadays televised and recorded, and either the full events or at least informative summaries thereof are widely available to the public. This feature is of particular importance for the analysis of unethical behavior. (emphasis added; p. 2)
Thus, on account of the observability of unethical behaviors in sports, we are able to replicate past findings while also uncovering something new to the research: the putative crossover effect between frame and regulatory focus on unethical behavior. To our knowledge, our work is the first to examine fouls in sports from a moral- and decision-theoretic perspective, in a large-scale field study to boot. In this vein, our work also complements a burgeoning area of research on testing behavioral science phenomena in non-laboratory settings, like football (e.g., Reference Harlow and OswaldHarlow & Oswald, 2016; Reference Massey and ThalerMassey & Thaler, 2013). Notably, data drawn from football games have led to the discovery of well-established findings in psychology, such as motivated thinking and BIRGing (Reference Cialdini, Borden, Thorne, Walker, Freeman and SloanCialdini et al., 1976; Reference Hastorf and CantrilHastorf & Cantril, 1954).
6.2 Directions for Future Research
Despite the benefits of our field study, future laboratory studies would help clarify the effect of regulatory (mis)fit on influencing (un)ethical behavior. Without a control condition, an open question is whether regulatory misfit provokes unethical behavior, or whether regulatory fit fosters ethical behavior. It would be informative to measure unethical behavior with a control condition and compare it with manipulated regulatory misfit and fit conditions. In this regard, the results could reveal a possible downside to regulatory fit. Some researchers have theorized that the same basic variables that predict motivation will also predict unethical behavior (Reference Hirsh, Lu and GalinskyHirsh, Lu & Galinsky, 2018). And because regulatory fit has been shown in research to foster motivation (Reference HigginsHiggins, 2005), it could therefore potentially provoke unethical behavior (compared to a control condition).
Future laboratory research might also employ manipulations of high- and low-risk of detecting misbehavior, as well as manipulations of misbehavior that are self- and other-serving. Such methods would allow for greater insight into other-serving misbehaviors that are easily detected and punishable – the kinds of misbehaviors that are rarely explored in research on unethical behavior. While this is an oversight of most research on unethical behavior, it is also a promising area for future research, since punishable (vs. non-punishable) behaviors resemble more the kinds of misbehaviors that occur outside of the laboratory. In the present research, we have studied and highlighted these behaviors; however, we could not conduct comparisons between them and self-serving behaviors that are relatively free of detection and punishment.
Finally, we are reminded of the work by Frank and Gilovich (1998) that found that professional football and hockey players who wear black uniforms commit more penalties than players who wear non-black uniforms. Most importantly, their findings were attributed to both self-perception and social perception processes, meaning the effect is based on players’ own behaviors, as well as the biased judgments of others (the referees who were calling the penalties). In our research, we have discussed the present findings in terms of self-perception. In particular, we did not find evidence (in our analysis) that referees’ decisions precipitate the crossover effect (we found the effect was consistent in situations in which referees would be more or less likely to call a penalty; moreover we found the effect was robust to game-level fixed-effects, which account for games’ referees). But quite possibly, the findings could be helpfully propped up by both self- and social perception. It remains to be seen, but future research could assess whether regulatory (mis)fit is understood and judged by others in this way – which is to say that, just as experiencing regulatory (mis)fit influences one’s propensity for (un)ethical behavior, so too might it lead observers to render a more or less punitive judgment upon someone experiencing regulatory (mis)fit. In particular, research might also consider the extent that status-judgments (e.g., judgments of high-profile actors) interact with judgments of unethical behavior, in juxtaposition to regulatory fit, considering judgments of unethical behavior are influenced by transgressors’ status (Reference Polman, Pettit and WiesenfeldPolman, Pettit & Wiesenfeld, 2013).
Beyond replicating past research, our study found a heretofore untested and significant crossover effect. We found that promotion focus was associated with more misbehavior in a loss (vs. a gain) frame, whereas prevention focus was associated with more misbehavior in a gain (vs. a loss) frame. This crossover effect is consistent with regulatory fit theory. When there is fit between frame and regulatory focus, people feel right about what they are doing, which produces a sense of “moral rightness” (Reference Camacho, Higgins and LugerCamacho et al., 2003, p. 499). In line with this view, we found unethical behavior is highest when one’s frame is mismatched (misfit) with one’s regulatory focus. This highlights the importance of taking a social-personality psychological approach to the study of ethical decision making. As evidenced by past research, unethical behavior has been traditionally modeled in social-situational terms (e.g., by changing the frame), or in person-dispositional terms (e.g., by examining personality variables) but rarely both. Going forward, in order to better understand unethical behaviors – between individuals, or between groups – researchers should account for the person-situation framework, such as regulatory fit, for understanding unethical decision making. This will help facilitate the goal of generating ways to deter unethical decision making (e.g., Reference Van Swol, Polman, Ahn and Docan-MorganVan Swol, Polman & Ahn, 2019).
While the present findings suggest evidence for the robustness of regulatory fit effects, the mechanisms underlying regulatory fit effects are still elusive. It is plausible that regulatory misfit may reduce cognitive resources, precisely what are needed to keep one’s moral compass on course (Reference Gino, Schweitzer, Mead and ArielyGino, Schweitzer, Mead & Ariely, 2011). In a related vein, it could be argued that, depending on the regulatory focus, different moral reasoning structures are accessible, and that the applicability of the accessible moral reasoning depends on boundary conditions (Reference Cornwell and HigginsCornwell & Higgins, 2016, 2015), such as frame. Thus, as a result of a (mis)fit between frame and regulatory focus, different rules for behavior may be generated.
7 Conclusion
Going forward, researchers should account for regulatory fit. Seminal work on motivation and persuasion has demonstrated the importance of regulatory fit (Reference Higgins, Freitas, Ostroff and JudgeHiggins & Freitas, 2007). Work on unethical behavior is apt to benefit from a similar perspective. Such approaches would dovetail with a broader trend that regulatory fit leads to better quality of life outcomes (Reference Langsam, Freitas, Higgins, Lenderking and RevickiLangsam, Freitas & Higgins, 2005). As we have shown here, when it “feels right,” people play by the rules (literally).


 Open access