





1. Introduction
The growing intensification of changes on social-ecological systems (SES) has dramatically changed the Earth’s biosphere (Folke et al., Reference Folke, Polasky, Rockström, Galaz, Westley, Lamont, Scheffer, Österblom, Carpenter, Chapin, Seto, Weber, Crona, Daily, Dasgupta, Gaffney, Gordon, Hoff, Levin and Walker2021). The contemporary understanding of ‘crisis’ has accordingly evolved from a series of isolated discrete events to a prolonged and volatile turmoil unfolding across multiple scales and dimensions (Revault d’Allones, Reference Revault d’Allones2016). The global financial crisis in 2007/2008, COVID-19 pandemic, the Russian invasion of Ukraine, three events that have severely impacted our social, energy, and economic systems through their rapid and far-reaching spread, are prime examples of this shift. Moreover, crises now seem to interweave and amplify one another. This complex situation has led scholars, practitioners, and policymakers to increasingly use the concept of ‘polycrisis’. Defined as the convergence of crises across multiple systems, leading to greater harm than each crisis would cause in isolation (Morrin & Kern, Reference Morin and Kern1993; Lawrence et al., Reference Lawrence, Homer-Dixon, Janzwood, Rockstöm, Renn and Donges2024a; Mark et al., Reference Mark, Holder, Hoyer, Schoonover and Aldrich2024a), polycrisis questions the current notion of risk (Keys et al., Reference Keys, Galaz, Dyer, Matthews, Folke, Nyström and Cornell2019; Wassénius & Crona, Reference Wassénius and Crona2022) and calls for a change of paradigm in scientific theory (Jacobs, Reference Jacobs2024), methods (Hopper et al., Reference Hopper, Rattray, Schuermann and Power2023), and models (Koasidis et al., Reference Koasidis, Nikas and Doukas2023).
Characterizing polycrisis dynamics, by essence complex and non-linear, is the first step in that direction. Yet, and as highlighted by the polycrisis community in its Research and Action Roadmap (Lawrence et al., Reference Lawrence, Shipman, Janzwood, Arnscheidt, Donges, Homer-Dixon, Otto, Schweizer and Wunderling2024b), it requires navigating across space and time, as crises have become capable of spreading across sectors and scales (Brosig, Reference Brosig2025). To fill this gap, we here adopt an SES approach to decompose polycrisis dynamics into two interrelated processes: shocks – sudden events with noticeable impacts, and creeping changes – slow processes that have a potential significant impact on society or the biosphere. Leaving the exploration of creeping changes for future work, we map out the temporal trends, distribution, and co-occurrences of shocks across 175 countries, from 1970 to 2019. We believe that this analysis, being done simultaneously but with a different methodology (only using one dataset of shocks, but a longer time frame of study) by Mark et al. (Reference Mark, Rodrigues, Holder, Hoyer, Schoonover and Aldrich2024b), is a starting point to unpack and better understand the causal architecture of the polycrisis, as previously suggested by Homer-Dixon et al. (Reference Homer-Dixon, Walker, Biggs, Crépin, Folke, Lambin, Peterson, Rockström, Scheffer, Steffen and Troell2015). Specifically, we contend that our work should serve as a basis for identifying response diversity strategies (Walker et al., Reference Walker, Crépin, Nyström, Anderies, Andersson, Elmqvist, Queiroz, Barrett, Bennett, Cardenas, Carpenter, Chapin, de Zeeuw, Fischer, Folke, Levin, Nyborg, Polasky, Segerson and Vincent2023).
This paper is structured as follows. Section 2 reviews the existing literature on shocks, both theoretically and empirically. Section 3 presents the materials, data, and methods used to build the database of shocks. Section 4 discusses the obtained results in terms of temporal trends, distribution, and co-occurrences of shocks and underlines limitations of the study while suggesting perspectives for future research. Section 5 concludes.
2. Literature review
2.1. Polycrisis processes: creeping changes and shocks
The thin layer of the Earth hosting life, the biosphere, comprises complex adaptive SES characterized by cross-scales feedbacks that amplify or dampen change (Fischer et al., Reference Fischer, Gardner, Bennett, Balvanera, Biggs, Carpenter, Daw, Folke, Hill, Hughes, Luthe, Maass, Meacham, Norström, Peterson, Queiroz, Seppelt, Spierenburg and Tenhunen2015). SES are currently subject to a wide range of changes, taking the form of shocks and creeping changes. Creeping changes refer to slowly evolving variables that threaten society or the biosphere, and which unfolds over extended periods and across various locations (Boin et al., Reference Boin, Ekengren and Rhinard2021). They are characterized by a lack of clear onset, long incubation periods, often ambiguous, or insufficient responses and are typically foreshadowed by precursor events. Antimicrobial resistance exemplifies a creeping change, with the burden increasing gradually and often unnoticed across nearly all critical pathogen–drug combinations between 1990 and 2021, quietly escalating into a major threat to public health and healthcare systems (Naghavi et al., Reference Naghavi, Vollset, Ikuta, Swetschinski, Gray, Wool, Aguilar, Mestrovic, Smith, Han, Hsu, Chalek, Araki, Chung, Raggi, Hayoon, Weaver, Lindstedt, Smith and Murray2024). Creeping changes create locked-in trajectories, also referred to as evolutionary ‘Anthropocene Traps’ (Søgaard Jørgensen et al., Reference Søgaard Jørgensen, Jansen, Avila Ortega, Wang-Erlandsson, Donges, Österblom, Olsson, Nyström, Lade, Hahn, Folke, Peterson and Crépin2023), which gradually erode resilience, weaken adaptive capacity, and increase hidden vulnerabilities (Miller et al., Reference Miller, Osbahr, Boyd, Thomalla, Bharwani, Ziervogel, Walker, Birkmann, Van Der Leeuw, Rockström, Hinkel, Downing, Folke and Nelson2010).
Shocks refer to abrupt, often non-linear disturbances that rapidly disrupt a system’s stability (Miller et al., Reference Miller, Osbahr, Boyd, Thomalla, Bharwani, Ziervogel, Walker, Birkmann, Van Der Leeuw, Rockström, Hinkel, Downing, Folke and Nelson2010). Examples of shocks include coral bleaching events in the Great Barrier Reef, large-scale wildfires such as those in Australia in 2019–2020, sudden transmission of coronavirus, etc. Shocks significantly disrupt SES, triggering reorganization, adaptation, and even long-term transformation. These events often damage critical ecosystem services, leading to direct impacts on human livelihoods and well-being while increasing vulnerability to future disturbances. For instance, extreme weather can not only cause immediate losses but also degrade the ecosystem’s capacity to respond – by depleting resources, breaking key social or ecological networks, and weakening institutional support. Such situations demand urgent action to strengthen system resilience. However, responses to shocks may prove inadequate or even harmful, leading adaptation to be maladaptive and locking systems into trap situations (Magnan et al., Reference Magnan, Schipper, Burkett, Bharwani, Burton, Eriksen, Gemenne, Schaar and Ziervogel2016). A stark example is the post-tsunami clean-up in Sri Lanka in 2004, which accelerated salinity intrusion into freshwater aquifers, leaving communities to rely on water deliveries and low groundwater quality for months to over a year (Renaud et al., Reference Renaud, Birkmann, Damm and Gallopín2010).
Creeping changes and shocks interact and, through direct or indirect mechanisms, destabilize SES systems, with the potential of bringing them to cross thresholds upon which their behaviours change radically. For instance, gradual increases in sea surface temperature are pushing fish towards higher latitudes, while sudden market pressures can trigger overfishing in some regions. Together, these factors can drive fish stocks to ecological tipping points, beyond which their populations may collapse (Cooper et al., Reference Cooper, Willcock and Dearing2020; Cottrell et al., Reference Cottrell, Nash, Halpern, Remenyi, Corney, Fleming, Fulton, Hornborg, Johne, Watson and Blanchard2019; Free et al., Reference Free, Mangin, Molinos, Ojea, Burden, Costello, Gaines and Hewitt2020).
2.2. Current research frontiers on shocks
Research on shocks is rich, rapidly increasing and demonstrates a wide array of approaches. On a theoretical level, considerable attention has been devoted to several categories of shocks: natural hazards (Ward et al., Reference Ward, Blauhut, Bloemendaal, Daniell, De Ruiter, Duncan, Emberson, Jenkins, Kirschbaum, Kunz, Mohr, Muis, Riddell, Schäfer, Stanley, Veldkamp and Winsemius2020), conflicts (Diehl et al., Reference Diehl, Goertz and Gallegos2021), infectious diseases (Baker et al., Reference Baker, Mahmud, Miller, Rajeev, Rasambainarivo, Rice, Takahashi, Tatem, Wagner, Wang, Wesolowski and Metcalf2021), and food systems, particularly fisheries (Hodbod & Eakin, Reference Hodbod and Eakin2015; Kaplan-Hallam et al., Reference Kaplan-Hallam, Bennett and Satterfield2017). Significant progress has also been made in recent years towards unpacking the interrelations among different types of shocks, both within categories (such as multiple interacting hazards; Renaud et al., Reference Renaud, Birkmann, Damm and Gallopín2010; Wang et al., Reference Wang, He and Weng2020) and across domains – for instance, the links between climate change and conflicts (Koubi, Reference Koubi2019).
On an empirical note, several attempts have been carried out to map shocks and their co-occurrences. R. O. Biggs et al. (Reference Biggs, Peterson and Rocha2015), for instance, assess the evolution of regime shifts, impacts, key drivers, underlying feedbacks, and management options over 300 case studies. Cottrell et al. (Reference Cottrell, Nash, Halpern, Remenyi, Corney, Fleming, Fulton, Hornborg, Johne, Watson and Blanchard2019) build on the work of Gephart et al. (Reference Gephart, Deutsch, Pace, Troell and Seekell2017) to estimate the frequency of food production shocks (crop, livestock, aquaculture, and fisheries) and show a notable increase in all major sectors across land and sea over the past 53 years. Fisher et al. (Reference Fisher, Moore, Jardine, Watson and Samhouri2021) evaluate how a specific climate shock (marine heatwave) modifies flows of users between fishery resources using a network analysis. Carper et al. (Reference Carper, Alizadeh, Adamowski, Inam and Malard2021) quantify shock-response assessment regime over a period of 30 years (1989–2019) in the Rechna Doab basin (northeastern Pakistan). d’Errico et al. (Reference d’Errico, Pinay, Jumbe and Luu2023) combine several datasets to study how different shocks (natural disaster, livelihood-related, health shocks) reduce households’ resilience between 2014 and 2020. Hoyer et al. (Reference Hoyer, Bennett, Reddish, Holder, Howard, Benam, Levine, Ludlow, Feinman and Turchin2023, Reference Hoyer, Holder, Bennett, François, Whitehouse, Covey, Feinman, Korotayev, Vustiuzhanin, Preiser-Kapeller, Bard, Levine, Reddish, Orlandi, Ainsworth and Turchin2024) developed the Crisis Database (CrisisDB), comprising 168 societal crises (population decline or collapse, downward mobility or extermination of elites, uprisings, civil war, state fragmentation, external conquest, ruler assassination or deposition, etc.) spanning multiple time periods and regions, by systematically collecting historical information about the events characteristics. Finally, Shaban et al. (Reference Shaban, Kourtit, Nijkamp and Das2024) analyse the extent to which contextual social-ecological conditions of entrepreneurial uncertainty, agricultural shocks, and poorly designed responses from institutions interact with tragic behaviours by farmers.
2.3. Gaps and opportunities
While research on shocks has been prolific, less attention has been devoted to their co-interaction in an integrated approach. A result is that empirical methods and data that help understand how components of the global system absorb, transmit, and link together shocks are still missing (Kaplan-Hallam et al., Reference Kaplan-Hallam, Bennett and Satterfield2017; Beauchamp et al., Reference Beauchamp, Hirons, Brown and Milner-Gulland2020; Viña & Liu, Reference Viña and Liu2022). We propose that the SES approach offers a unifying framework, owing to its long-standing focus on shocks (D Biggs et al., Reference Biggs, Biggs, Dakos, Scholes and Schoon2011), methodological openness, and conceptual maturity (Cumming & Peterson, Reference Cumming and Peterson2017). Recent work on undesirable resilience and socio-technical lock-ins (Dornelles et al., Reference Dornelles, Boyd, Nunes, Asquith, Boonstra, Delabre, Denney, Grimm, Jentsch, Nicholas, Schröter, Seppelt, Settele, Shackelford, Standish, Yengoh and Oliver2020) further strengthens the SES approach’s relevance for enhancing adaptive capacity under extreme change (Thonicke et al., Reference Thonicke, Bahn, Lavorel, Bardgett, Erb, Giamberini, Reichstein, Vollan and Rammig2020), particularly in conflict-prone settings (Goldstein et al., Reference Goldstein, Neimark, Garvey and Phelps2023; Méndez et al., Reference Méndez, Fajardo-Ortiz and Holzer2022; Rist et al., Reference Rist, Norström and Queiroz2024). Altogether, the SES approach paves the way for a resilience-based transformations approach to shocks, including aspects linked to peacebuilding and transformative justice (Olsson & Moore, Reference Olsson and Moore2023).
3. Methodology
3.1. Main stages of the research process
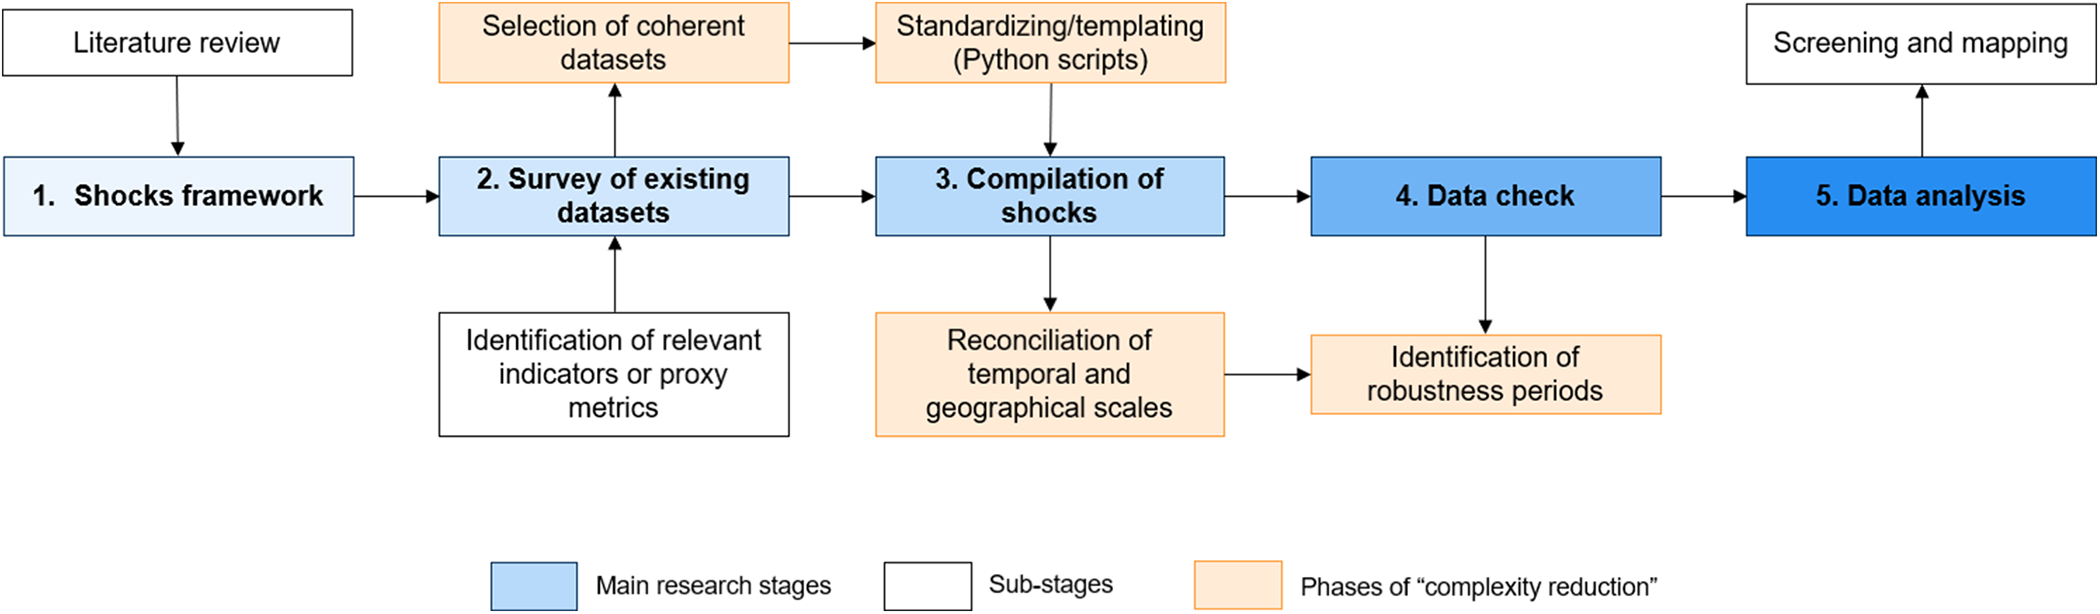
The approach used in this study involved five successive key stages (Figure 1). First, we reviewed relevant literature to identify a framework of shocks (‘what is a shock and what is not, in regard to Anthropocene changes’, ‘what categories of shocks exist in SES’, etc.). This inductive step was carried out by the research team and allowed us to classify shocks in six categories depending on their core mechanism: climatic, geophysical, ecological, economic, technological, and conflict. The framework developed reflects a conceptual classification that inherently involves some degree of subjectivity, meaning that a different research team would likely have produced a distinct one. Yet, we believe this shock framework encompasses major dynamics of shocks that have been tracked and measured over the years, with limited overlap between categories. Second, we surveyed existing regional or global datasets on shocks and, relying on a set of criteria and pre-identified relevant indicators or proxy, we selected a set of six datasets (see below for further detail). Third, we standardized each one to comply with a formal and shared template, where geographical and temporal scales were reconciled with Python scripts. More specifically, we used the package country_converter (Stadler, Reference Stadler2017) on country data, then split former states into the corresponding current states (e.g., USSR before 1991) and we filtered out countries that were missing observations in at least one category (although providing a full pre-filtered dataset in the supplementary materials). Fourth, we assessed the robustness period of each dataset, identifying potential bias in each, before expressing the data in a single csv file. Following our data check, we deemed the magnitude and impact of shocks (casualties, U.S. dollars, etc.) inconsistent across datasets, and as such, excluded them from the present analysis (only the number of shocks is presented). Fifth, we analysed the results and explored the temporal trends, distribution, and co-occurrences of shocks over time through statistical analysis.
Main stages of the research process.

3.2. Datasets description
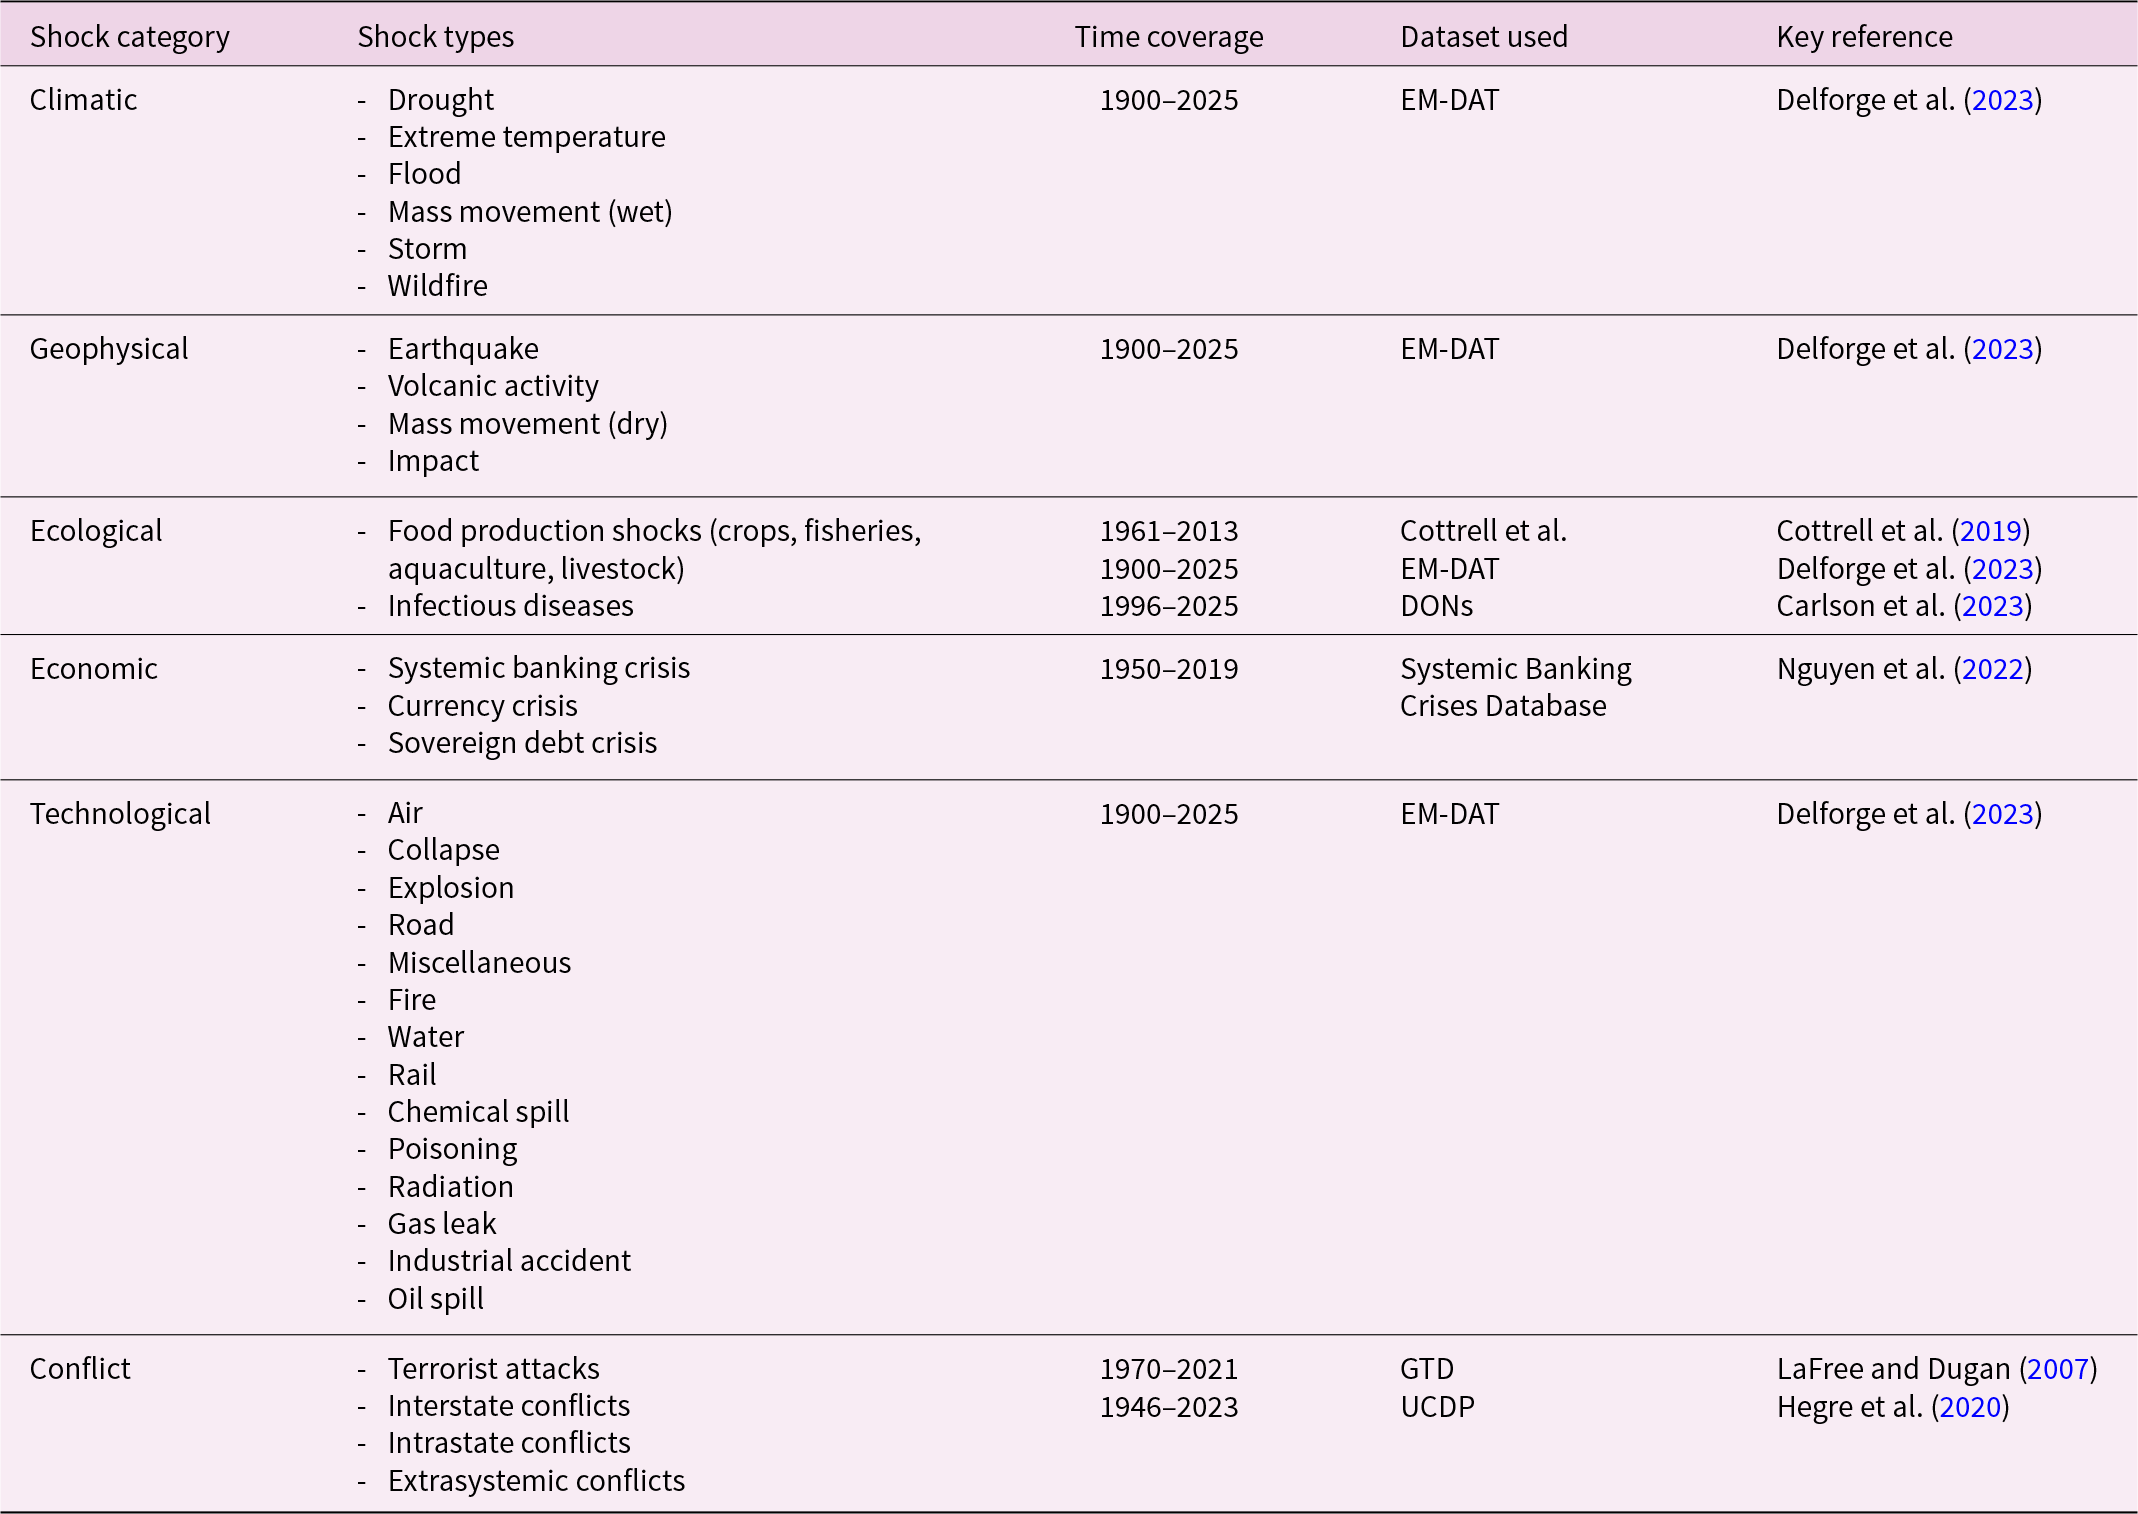
The six datasets collected, standardized, and compiled as well as selected indicators per shock category are presented in Table 1.
Indicators, time coverage and scope of the compiled datasets, per shock category

For climatic shocks, EM-DAT was selected due to its extensive coverage of shocks and prominent use in the field of natural disasters (Delforge et al., Reference Delforge, Wathelet, Below, Sofia, Tonnelier, van Loenhout and Speybroeck2023). EM-DAT compiles over 26,000 disasters (10 deaths or above, 100 people affected or above, call for international assistance issued, or state emergency declared) from 1900 to the present day. It has been used widely, with, among others, linking to geocoded locations (Rosvold & Buhaug, Reference Rosvold and Buhaug2021), infectious diseases outbreaks (Franzke & Czupryna, Reference Franzke and Czupryna2021), human displacement (Mester et al., Reference Mester, Frieler and Schewe2023), and social-ecological variables (Nones et al., Reference Nones, Hamidifar and Shahabi-Haghighi2023). Only six types of shocks – drought, extreme temperature, flood, wet mass movement, storm, and wildfire – were classified as climatic, as they are majorly driven by climatic factors.
For geophysical shocks, we also relied on EM-DAT but extracted only a selection of disasters (earthquake, volcanic activity, dry mass movement, meteorite impact) which are mainly of geophysical origin.
For ecological shocks, we employed the dataset of Cottrell et al. (Reference Cottrell, Nash, Halpern, Remenyi, Corney, Fleming, Fulton, Hornborg, Johne, Watson and Blanchard2019) for production shocks in different food sectors (i.e., crops, livestock, capture fisheries, and aquaculture) and combined the Disease Outbreak News (DONs) dataset (Carlson et al., Reference Carlson, Boyce, Dunne, Graeden, Lin, Abdellatif, Palys, Pavez, Phelan, Katz and Mendez2023) with EM-DAT for the epidemiological shocks (EM-DAT is used from 1970 to 1996 and DONs from 1996 to 2019). Reason for those two shocks to be classified together is that they mostly originate from ecological disturbances.
For economic shocks, we employed the dataset of Nguyen et al. (Reference Nguyen, Castro and Wood2022), which comprises 151 systemic banking crises, 414 currency crises, and 200 sovereign debt crises. This dataset, which builds on the one of Laeven and Valencia (Reference Laeven and Valencia2020), has the advantage to be more systematic but also covers more countries over a longer period of time.
For technological shocks, we relied on EM-DAT, which comprises air shocks (e.g., plane crash), chemical spill, industrial collapse (e.g., bridge failing), miscellaneous collapse (e.g., house collapse), industrial explosion, miscellaneous explosion, industrial fire, miscellaneous fire, gas leak, industrial accident (general), miscellaneous incident (general), oil spill, poisoning (e.g., pollution of a water course), radiation, rail (e.g., train accident), road (e.g., truck accident), and water (e.g., cruise ship accident).
For conflict shocks, we used the updated version of the Global Terrorism Database (GTD) of LaFree and Dugan (Reference LaFree and Dugan2007) as well as the Uppsala Conflict Data Program (UCDP) version 24.1 of Hegre et al. (Reference Hegre, Croicu, Eck and Högbladh2020). GTD is an open-source dataset on terrorism, which covers more than 200,000 cases of domestic and international terrorist incidents from 1970 through 2020. The UCDP is a continuously updated dataset on armed conflicts and organized violence (state-based non-state or one-sided violence) hosted by the Department of Peace and Conflict Research at Uppsala University.
3.3. Statistical analysis
Once the shocks were compiled in a common format and single file, we carried out a statistical analysis in several steps. First, we estimated the temporal trends of the shocks by unpacking the gross number of shocks. Second, we analysed the distribution of shocks to uncover regional dynamics. However, the total number of shocks is not comparable across categories. For instance, the number of terrorist attacks recorded is two orders of magnitude greater than any other shock, and thus the world total would only reflect the Conflict category. Thus, we followed a normalization process to avoid excess representation of one category over the others. The normalization consists in dividing each shock by the mean over the study period of the world total, to get a result around 1.
 \begin{align}
\underline{n}=mean(n_{world,y})&=\frac{\sum\limits_{1970 \le y \le 2019}(n_{world,y})}{\left|\left\{y|n_{world,y}\ne 0\right\}\right|}, \ {\rm with} \nonumber\\ {\underline{n}_{world,\,y}} &= \sum\limits_{c\ in\ Countries}\ n_{c,\,y}
\end{align}
\begin{align}
\underline{n}=mean(n_{world,y})&=\frac{\sum\limits_{1970 \le y \le 2019}(n_{world,y})}{\left|\left\{y|n_{world,y}\ne 0\right\}\right|}, \ {\rm with} \nonumber\\ {\underline{n}_{world,\,y}} &= \sum\limits_{c\ in\ Countries}\ n_{c,\,y}
\end{align}As we do not record 0s in the database, the mean is computed only on non-zero values, which has the final effect of giving less weight to sparse shocks, like meteorite impacts. We then divide by the number of shocks per category catSize to get similar sizes. The normalized shock is given by:
 \begin{equation}{\hat n_{c,y}} = \frac{n_{c,y}}{\underline{n}*catSize}\end{equation}
Third, we analysed the co-occurrences of shocks by summing up all pairs of shocks that appeared in a country during the same year. This allowed us to estimate the relative frequency of multi-shock occurrences. It depicts temporal co-occurrence of shocks in the same country in the same year but does not necessarily imply an actual causation or other kind of relationship between them. More precisely, the study of co-occurrence has been done generating circos plots, where we initially segmented our data annually and then identified all unique pairs of concurrent shocks within each country. For instance, if country ‘A’ experienced shocks ‘1’, ‘2’, and ‘3’ in 1991, we would form the pair combinations ‘1-2’, ‘2-3’, and ‘1-3’, indicating simultaneous occurrences. Similarly, if country ‘B’ encountered shocks ‘1’, ‘2’, and ‘4’, we would increment the count for the already identified pair ‘1-2’ and introduce new pairs ‘1-4’ and ‘2-4’. This process was repeated for all countries and for each year to compile the frequencies of concurrent shock pairs. The circos plot visually represents these connections, where the thickness of the lines indicates the frequency of co-occurrence across different countries and over time.
4. Results and discussion
4.1. Temporal trends, spatial distribution, and co-occurrences
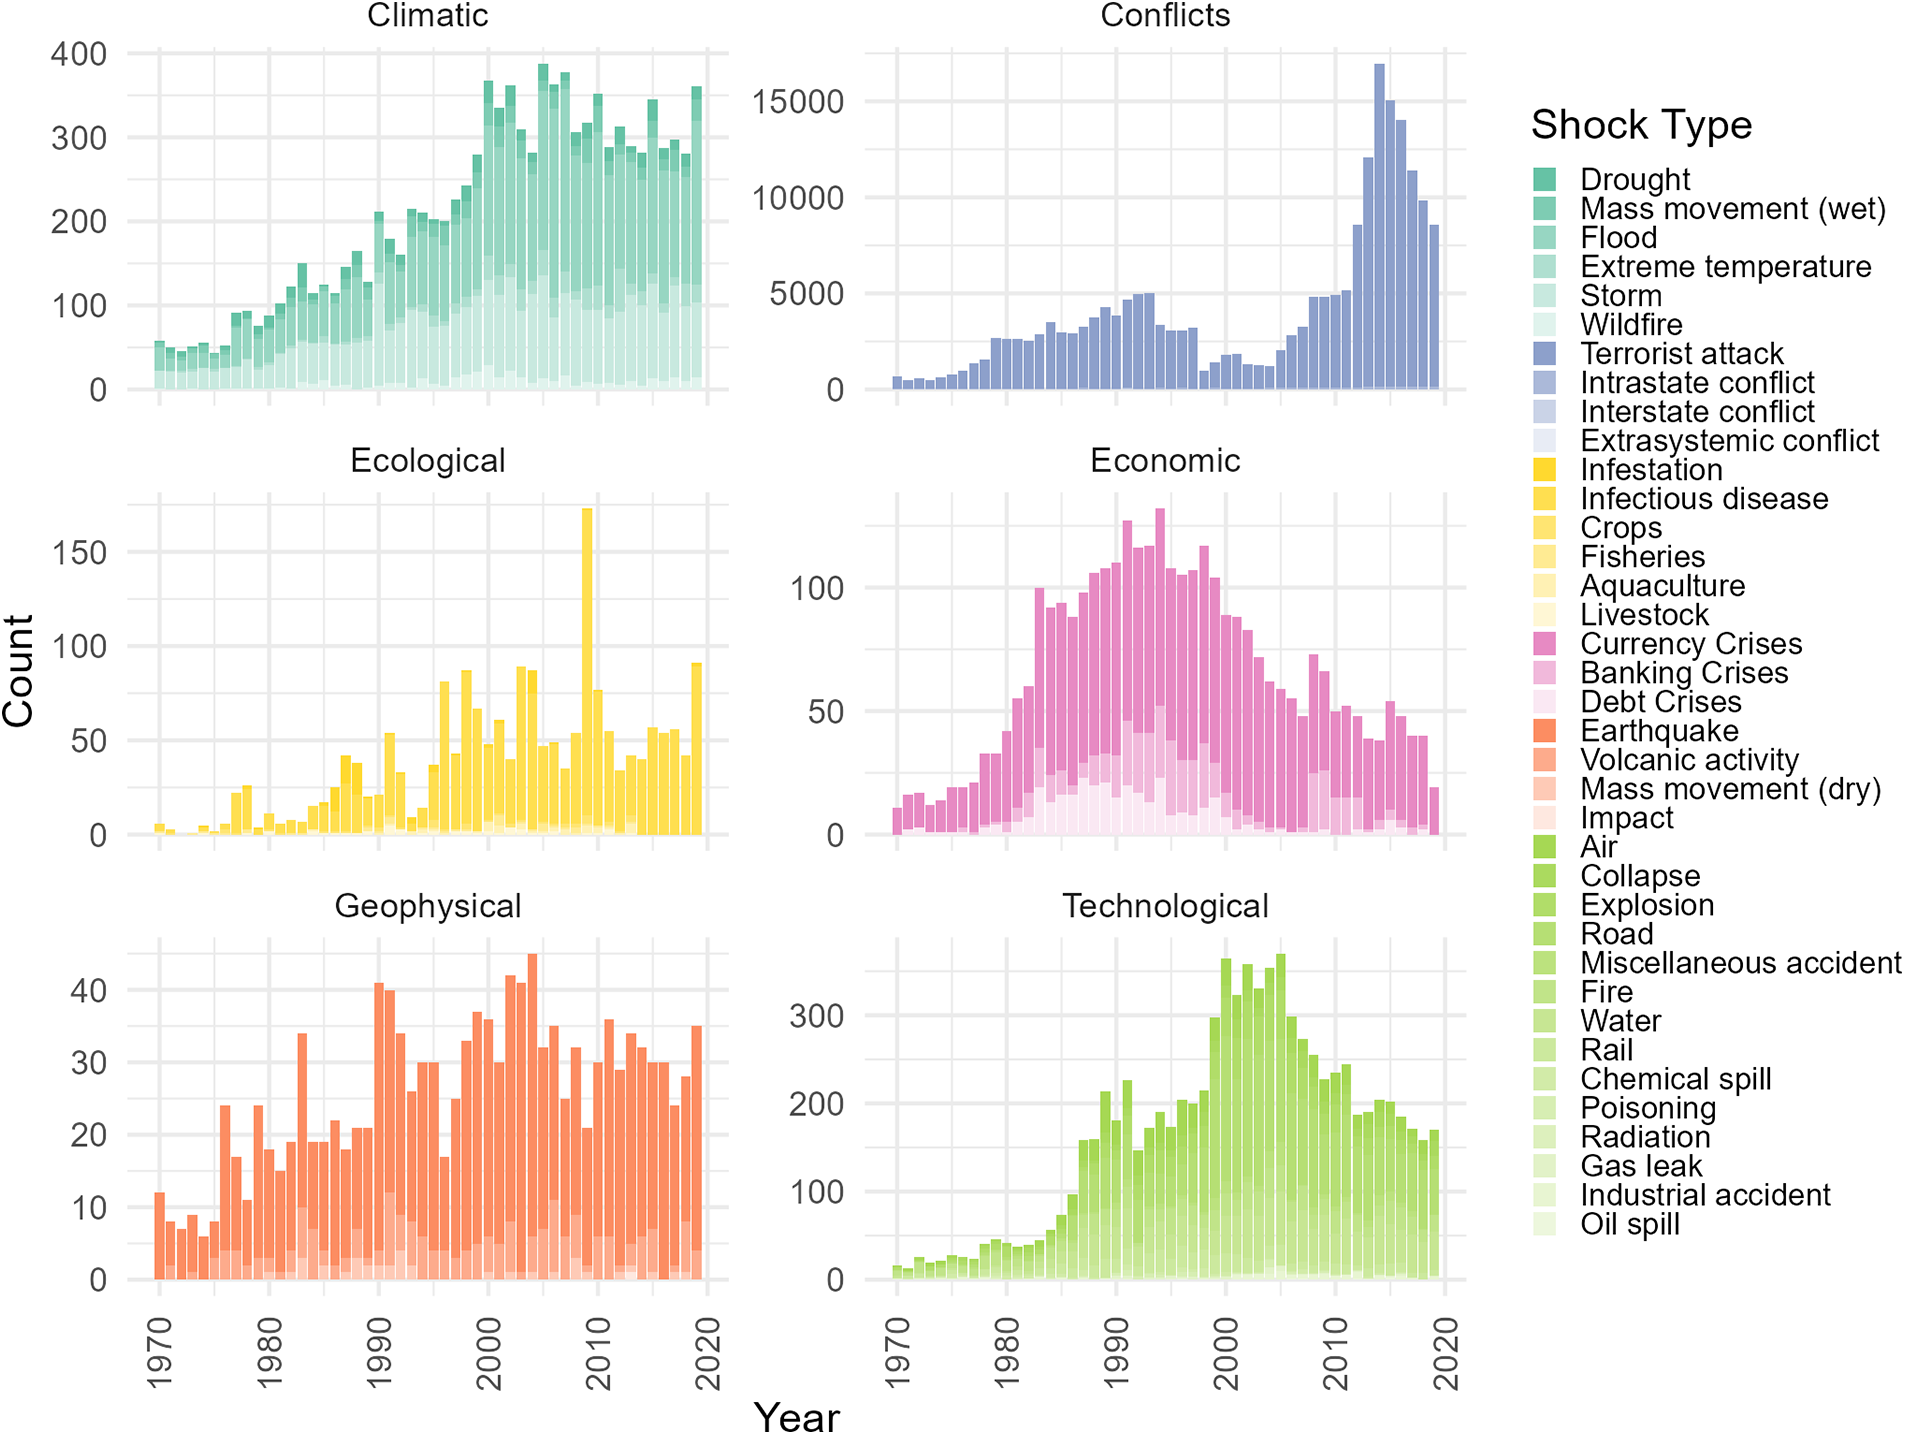
The total gross number of shocks shows different dynamics depending on the category of shock considered (Figure 2). For example, climate-related shocks increase steadily from 1970 onwards until they reach an apparent plateau in the early 2000s, which may be linked to the more robust and systematic selection of events from that time onwards for EM-DAT (see Section 5.3). Conflict-related shocks follow a different pattern, with a slow increase between 1970 and 1980, a rising plateau between 1980 and 1995, a decline between 1995 and 2005 before what appears to be an exponential increase from 2005 onwards followed by a strong decrease since 2010. Ecological shocks vary considerably, with a first period from 1970 to 1985 being mild, before becoming increasingly severe (except the mid-1990s drop), and peaking in 2009 with almost 160 shocks. Economic shocks follow a bell-shaped curve, with a peak over 100 shocks between 1987 and 1999, and are majorly driven by currency crises. Geophysical shocks show an increasing trend from 1975 to 2000 and a stagnation after, with important variations in between years. Technological shocks seem to follow a step function with a first stable period around 25 shocks per year from 1970 to 1980, a higher step around 150 shocks from 1985 to 2000, and an even higher step from 2000 to 2006 around 300 shocks, before falling to approximately 200 shocks per year in the 2010s.
Number of shocks per category from 1970 to 2019, global scale. Note that food production shocks (crops, fisheries, aquaculture, livestock) data stop in 2013.

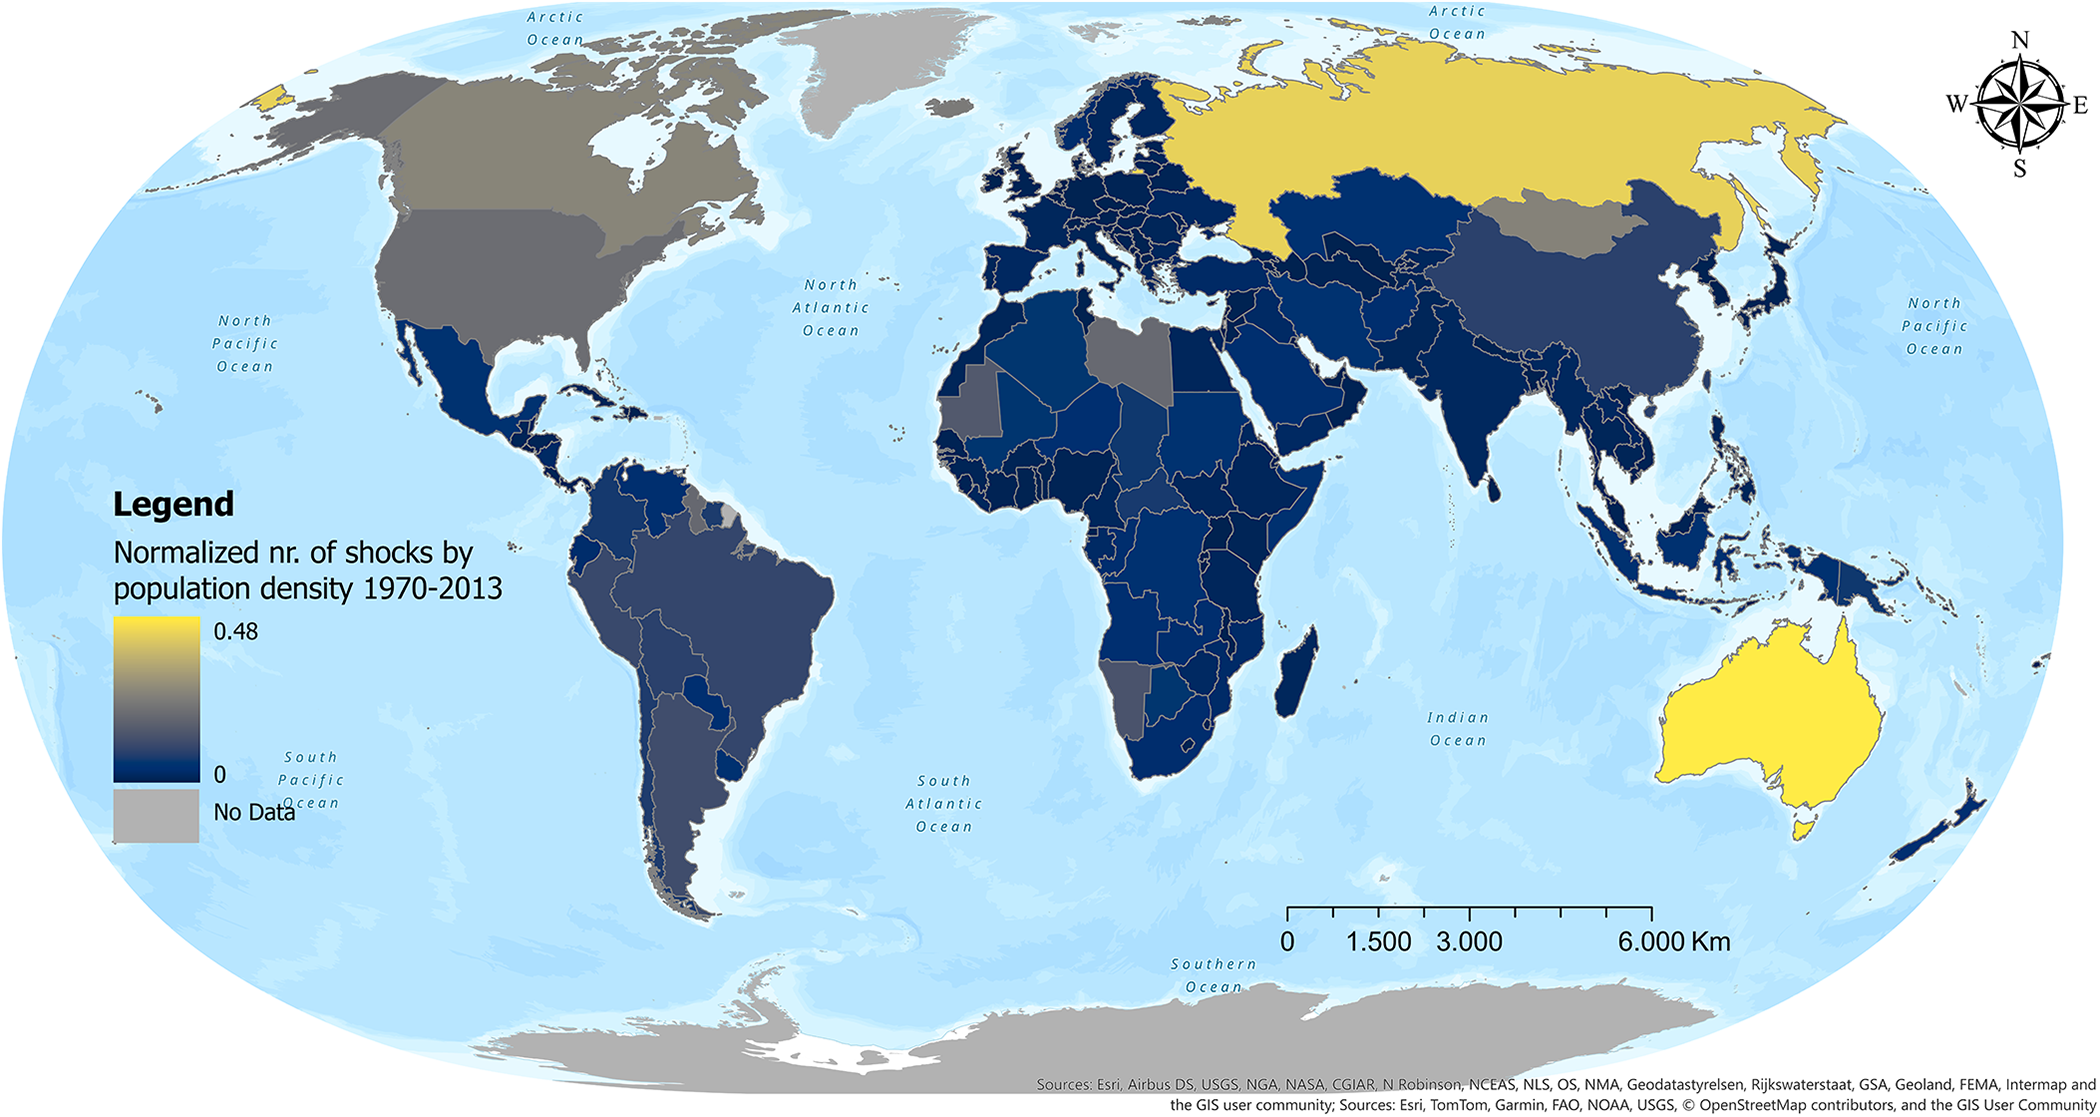
In terms of geographical distribution, our analysis reveals a pronounced unevenness in the incidence of normalized shocks relative to population density (Figure 3). Patterns indicate that the number of normalized shocks to population density appears highest in countries that are geographically expansive yet sparsely populated (e.g., Russia, Australia). In such contexts, the total number of shocks – once normalized – becomes comparatively small relative to the overall land area and population distribution, resulting in higher ratio values (i.e., fewer shocks per unit of population density). By contrast, regions with denser populations (such as much of Europe and parts of Asia) display lower ratio values, signifying that shocks occur more frequently when measured against the size and density of the population. Intermediate values in North America, Libya, Mauritania, Namibia, and Mongolia likely arise from the interplay of moderately low population densities, significant land masses, and region-specific factors (including economic conditions and reporting practices). Meanwhile, lower ratios in parts of Africa and South America may be associated with greater concentrations of shocks in relation to the population, although underreporting and uneven data coverage could also influence these figures.
Normalized number of shocks per country’s population density from 1970 to 2019 including six categories: climatic, geophysical, ecological, economic, technological, and conflict. Higher values (lighter colours) mean lower incidence of shocks.

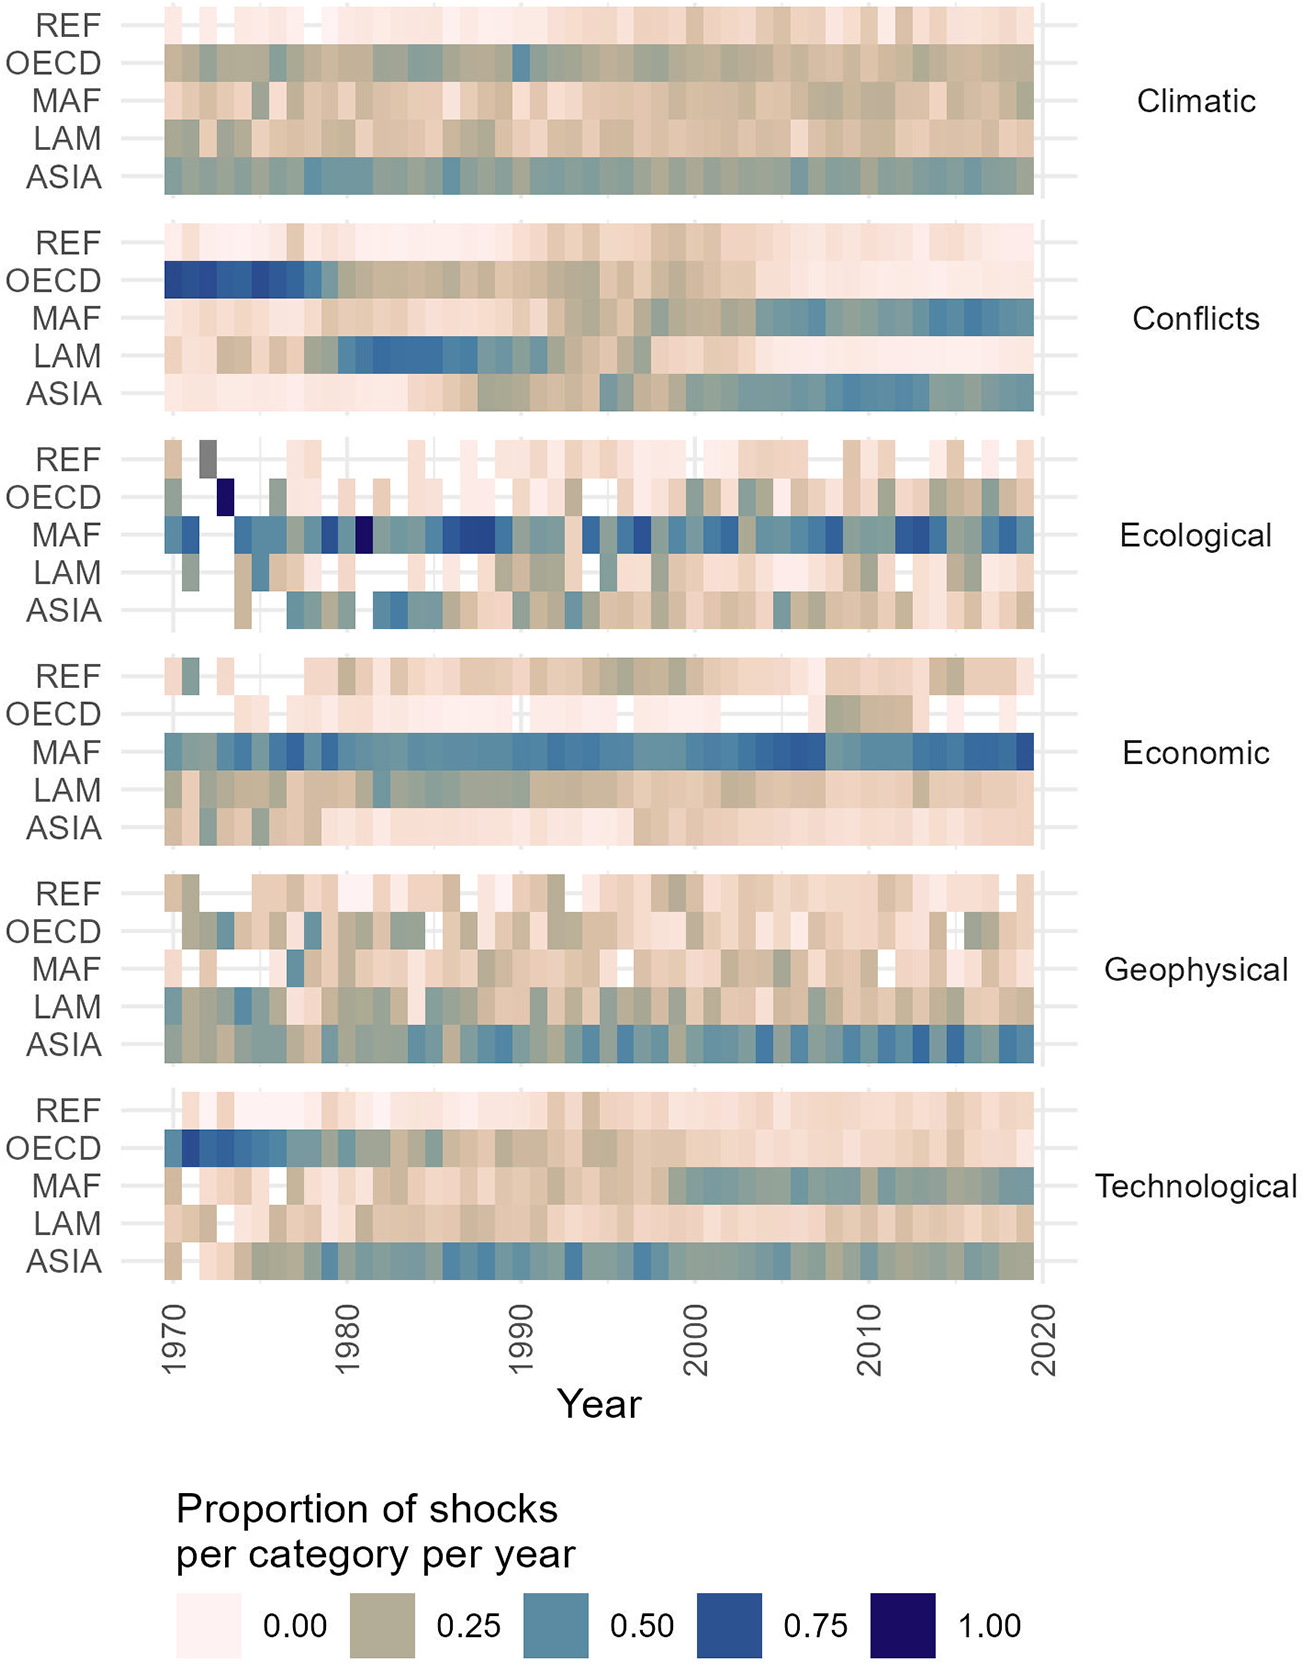
Over time, the distribution of shocks reveals disparate dynamics between regions (Figure 4). Climatic shocks, for instance, affect mostly OECD and Asian countries. Conflicts seem at first mostly based in OECD (1970–1980), before being mostly present in LAM (1980–1990) and then in MAF and ASIA (2000–2019), simultaneously. Ecological shocks appear majorly in the MAF from 1970 to 2019 and to a lesser extent in ASIA from 1975 to 1985. Economic shocks are driven by MAF and seem absent in OECD countries until the Global Financial Crisis (2007–2008). Geophysical shocks emerge in every region, but Asian countries gradually take over as the leading one. Technological shocks concern first OECD countries (1970–1980) before ASIA takes the lead (1980–2000) and until MAF countries reach a similar proportion of shocks per year.
The share of shocks per category per year in each region. REF = the reforming economies of Eastern Europe and the former Soviet Union, OECD = the Organisation for Economic Co-operation and Development 90 countries and the European Union member states and candidates, MAF = the Middle East and Africa, LAM = Latin America and the Caribbean, ASIA = Asian countries except the Middle East, Japan, and the former Soviet Union states.

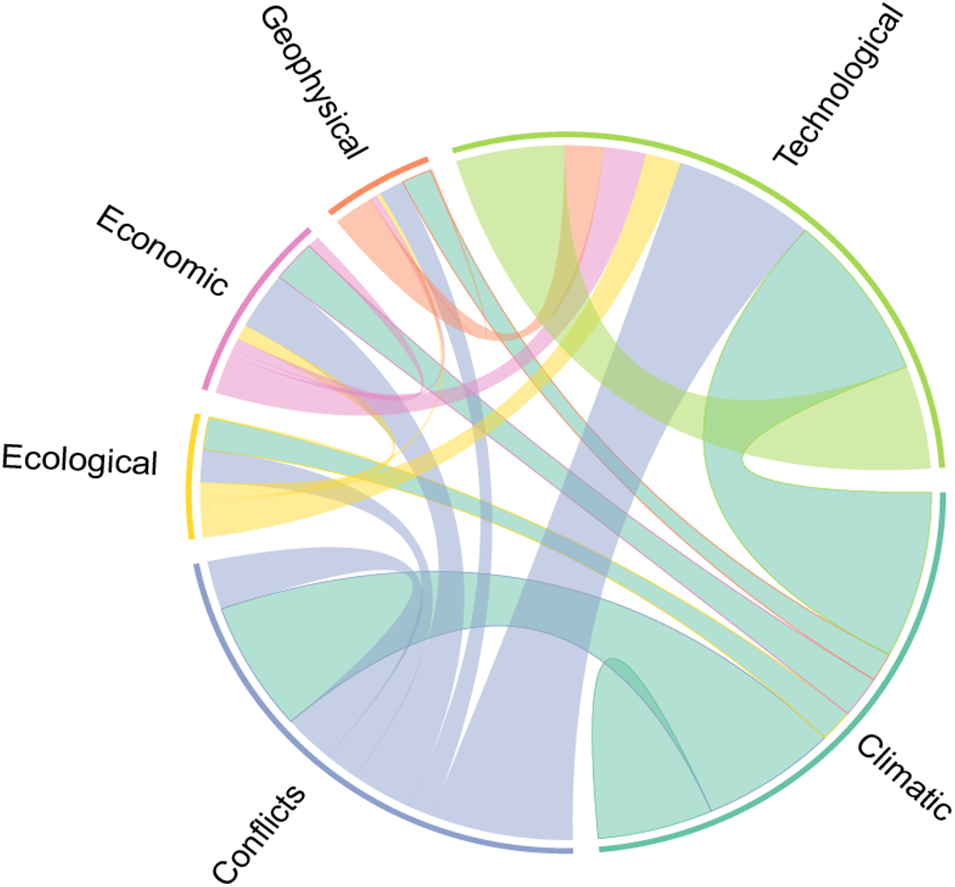
Figure 5 shows the co-occurrences among shocks categories, revealing those that are more co-occurring to others. Four most frequent pairs appear: Climatic–Technologic, Climatic–Conflicts, Conflicts–Technological, and Technological–Technological. We also observe that while many of the shocks are intra-category (e.g., intra-state conflict and terrorist attack), there are many connections across categories (e.g., infectious disease and drought). This interconnectedness depicts only temporal co-occurrence of shocks in the same country in the same year but does not necessarily imply an actual causation or other kind of relationship between them.
Multi-shock circos plot per shock category (1970–2019). Connections between coloured segments denote shock interactions, with line thickness indicating the relative frequency of multi-shock occurrences.

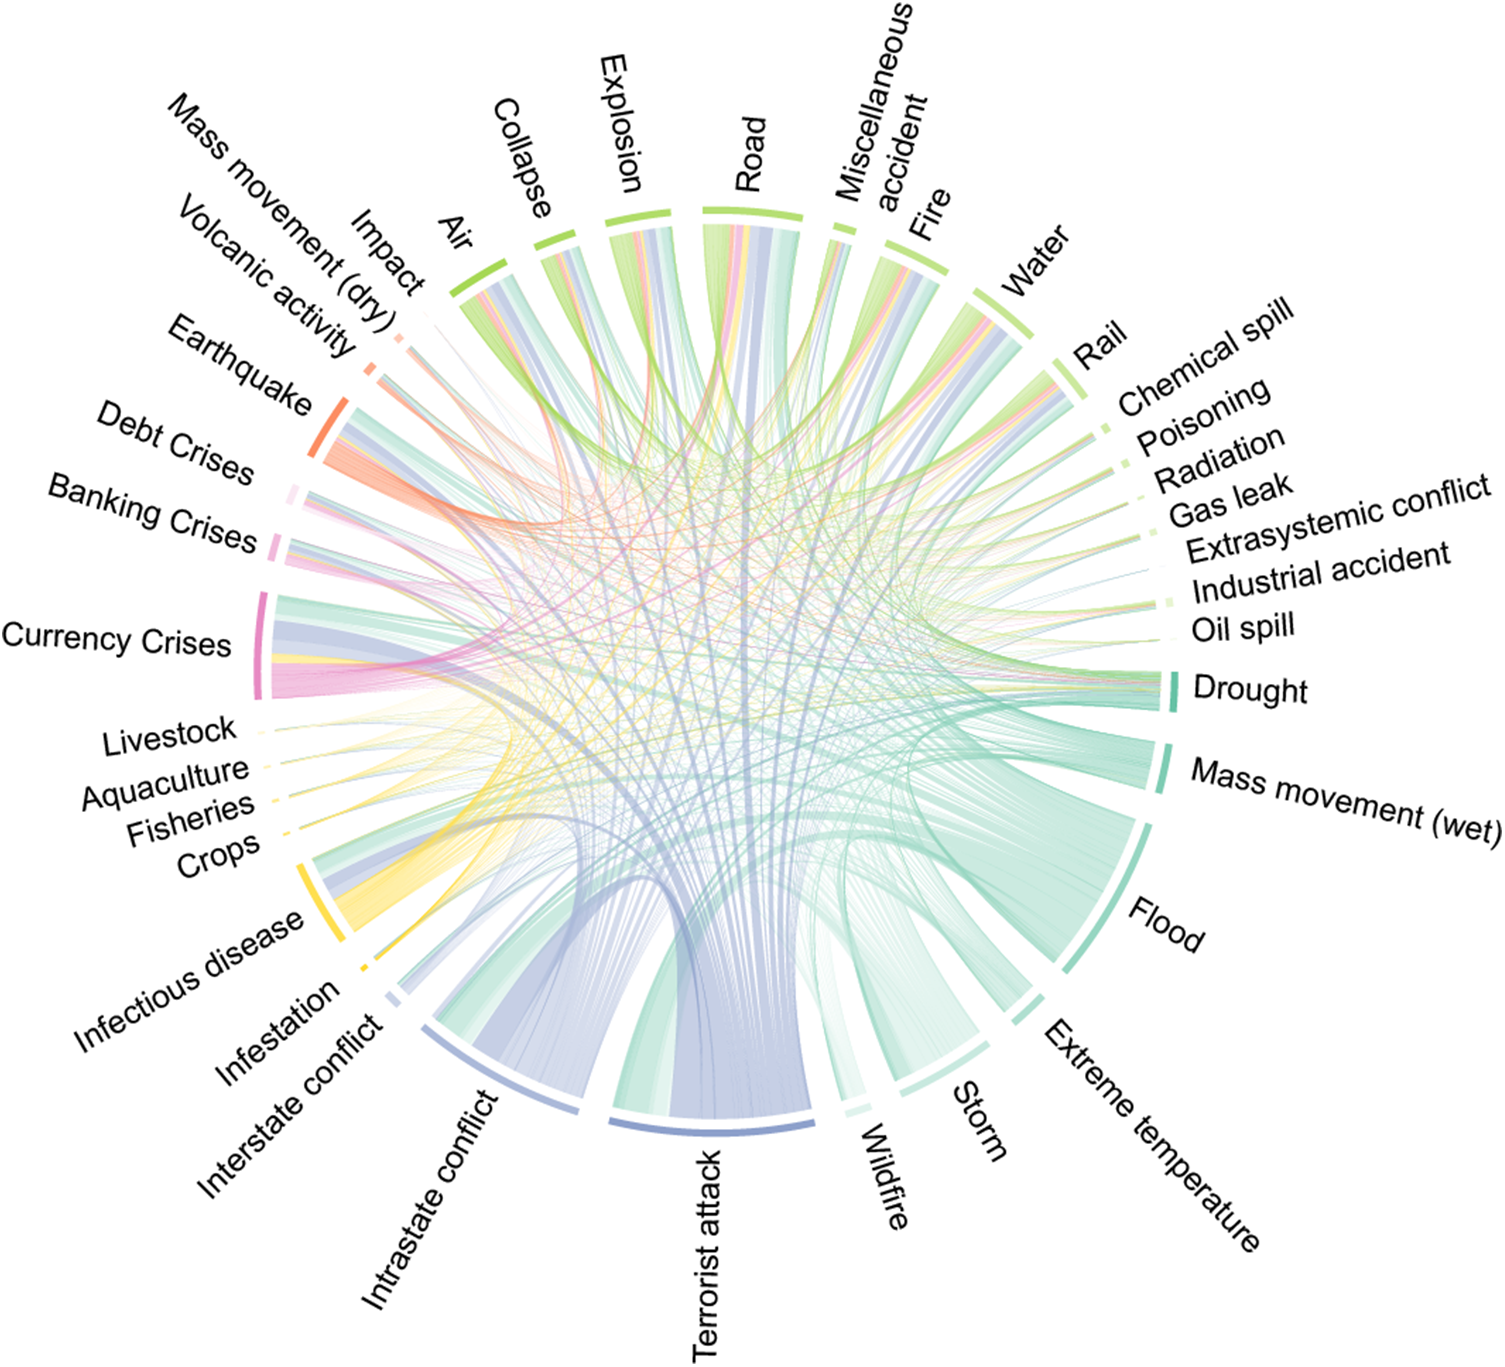
Figure 6 shows the co-occurrences among shocks, revealing those types of shocks that are more co-occurring to others, like floods, terrorist attacks, intrastate conflicts, and currency crises. If no pair of shock types appears to be disproportionately represented, three most frequent pairs are still found in the co-occurrence analysis: Terrorist attack-Intrastate conflict, Flood-Terrorist attack, and Terrorist attack-Currency Crises, being terrorist attacks always present in these observations of co-occurrences as it is also the type of shock with the highest number of observations. The top three most frequent observations not accounting for any pair that contained terrorist attacks are: Flood-Currency Crises; Intrastate conflict-Currency Crises; and Flood-Storm.
Multi-shock circos plot per shock type (1970–2019). Connections between coloured segments denote shock interactions, with line thickness indicating the relative frequency of multi-shock occurrences.

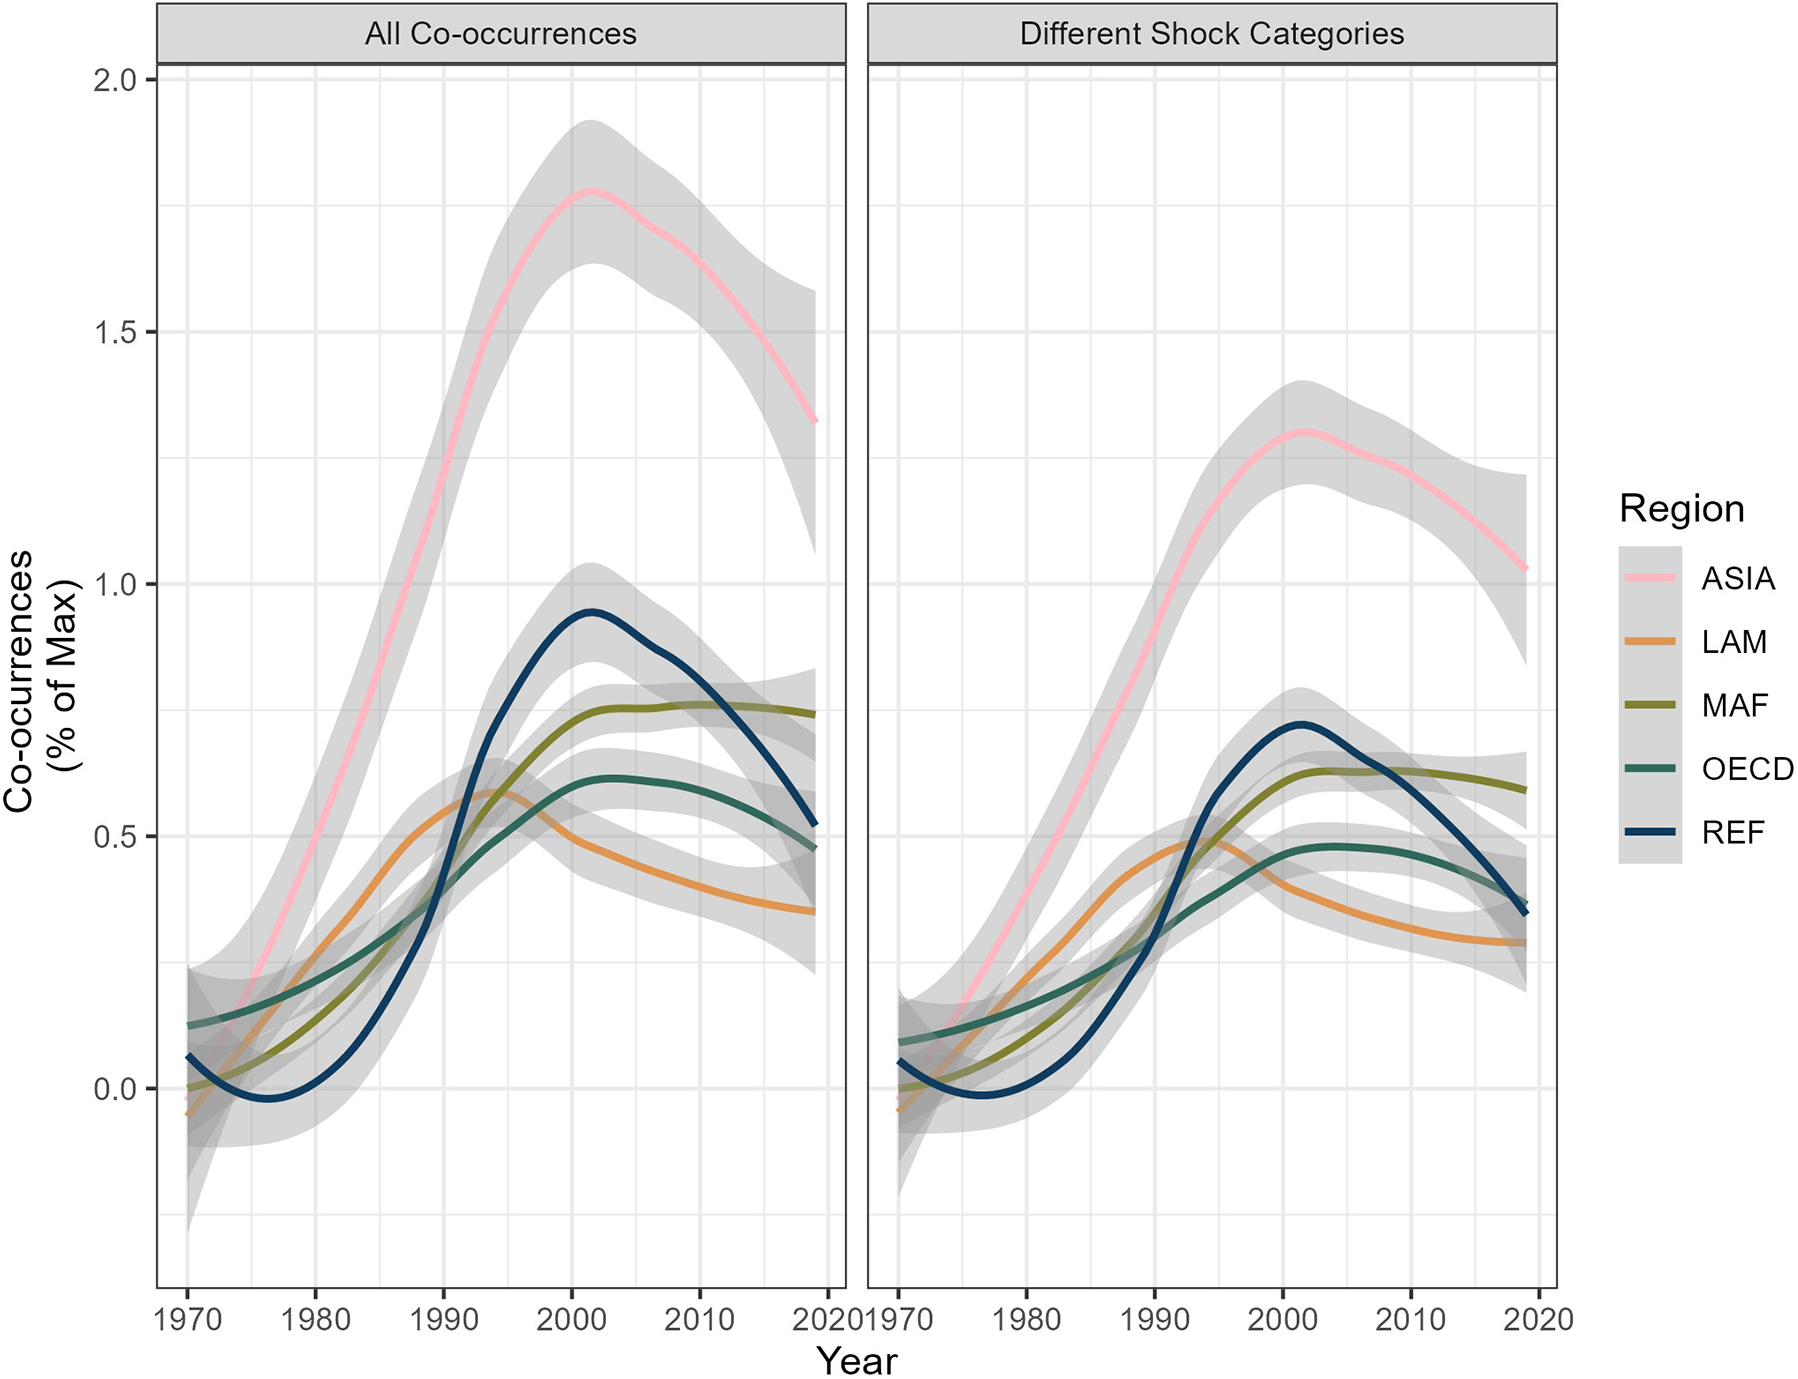
The co-occurrence of shocks per region over time (Figure 7, left) shows that shocks have become more co-occurring from 1970 to 2000 globally. Yet, various dynamics can be observed. The ASIA region, for instance, undergoes a rapid and significant increase in co-occurrence, nearing 1.75% of the theoretical maximum in 2000. In contrast, co-occurrences in the LAM, MAF, OECD, and REF countries are increasing more slowly (particularly REF, which only emerged late from 1980) and peak at a lower magnitude (0.5-1% of the theoretical maximum). Trends after 2000 remain divided in two groups of regions (high co-occurrence for ASIA, and medium for the rest), with co-occurrence falling steadily in all regions, except MAF where it stagnated. We believe that these trends can be explained by a more systematic reporting of events after 2000 in EM-DAT, as supported among others by Joshi et al. (Reference Joshi, Roberts and Tryggvason2024b), which would imply that a higher number of events are screened and hence co-occurrence would stagnate. Moreover, we find the co-occurrence of shocks between categories appears less numerous than the co-occurrences between shocks but still follows similar trends (Figure 7, right). This indicates that shocks are not also co-occurring within their category but also outside their category.
Co-occurrence of shocks by region and over time, for all shocks and all categories (left), for shocks in different categories and all categories (right). Estimates for co-occurrence of shocks in different categories show the sum of synchronous shocks that belong to the same category (e.g., the pair flood-mass movement [wet] would not be accounted for as both shocks belong to different categories). REF = the reforming economies of Eastern Europe and the former Soviet Union, OECD = the Organisation for Economic Co-operation and Development 90 countries and the European Union member states and candidates, MAF = the Middle East and Africa, LAM = Latin America and the Caribbean, ASIA = Asian countries except for the Middle East, Japan, and the former Soviet Union states. The theoretical maximum for co-occurrences corresponds to a state in which all countries experience one of every shock type per year.

4.2. Implications for polycrisis theory and practice
Our findings make several contributions to the field of polycrisis. Most centrally, this study challenges a prevailing assumption – found in works such as Jacobs (Reference Jacobs2024) – that shocks have been growing steadily more numerous and co-occurring over time. While our results confirm a clear rise in co-occurrence between 1970 and 2000, they also reveal a subsequent plateau and, crucially, a marked divergence in regional trajectories. Much of the polycrisis literature continues to adopt a global or Euro-Atlantic analytic frame (Nicoli & Zeitlin, Reference Nicoli and Zeitlin2024; Zeitlin et al., Reference Zeitlin, Nicoli and Laffan2019), often overlooking how crises manifest unevenly across space. Our findings suggest that regional differentiation is not incidental but constitutive of polycrisis dynamics, and that any effort to theorize, anticipate, or navigate polycrisis must account for this spatial heterogeneity. Additionally, our analysis highlights the need to move beyond viewing shocks as a singular or undifferentiated phenomenon. Distinct categories – such as climatic, technological, and conflict-related shocks – tend to cluster in patterned, context-specific ways, highlighting the need for a more refined typology of shock interrelations within polycrisis.
This work also intersects with and extends the field of multi-hazard research. Like polycrisis, multi-hazard study engages with the interplay of interrelated shocks. Yet its focus on physical hazards has emphasized cascading or compound effects, within sector-specific or localized settings (Ward et al., Reference Ward, Daniell, Duncan, Dunne, Hananel, Hochrainer-Stigler, Tijssen, Torresan, Ciurean, Gill, Sillmann, Couasnon, Koks, Padrón-Fumero, Tatman, Lund, Adesiyun, Aerts, Alabaster and De Ruiter2022). Our study complements recent methodological advances – such as those by Lee et al. (Reference Lee, White, Adnan, Douglas, Mahecha, O’Loughlin, Ramos, Roberts, Martius, Tubaldi, Van Den Hurk, Ward, Zscheischler and Patelli2023) and Jäger et al. (Reference Jäger, de Ruiter, Tiggeloven and Ward2024) – by offering an empirically grounded analysis that encompasses a broader array of shocks. This study thus helps bridge the conceptual divide between multi-hazard and polycrisis approaches and points towards the common development of a polycrisis management paradigm – one that builds on the institutional knowledge and practice-based insights of the multi-hazard community, while embracing the polycrisis perspective for its ability to capture systemic feedbacks. That way, ongoing challenges identified in the practice and implementation of multi-hazard risk reduction – such as limited cross-sectoral coordination, data gaps, and insufficient attention to long-term, systemic drivers of vulnerability (Trogrlić et al., Reference Trogrlić, Reiter, Ciurean, Gottardo, Torresan, Daloz, Ma, Fumero, Tatman, Hochrainer-Stigler, De Ruiter, Schlumberger, Harris, Garcia-Gonzalez, García-Vaquero, Arévalo, Hernandez-Martin, Mendoza-Jimenez, Ferrario and Ward2024) – could be mitigated.
4.3. Limitations and future developments
The present study is limited both by its method and the data it relies on. Methodologically, the decision to normalize shocks was made to ensure a comparable number of shocks over all categories. We here decided to rely on a simple normalization, which we believe is the most explicit and as such, most understandable by a wide range of readers, yet there are plethora of available methods and indices that can be explored in the future with the dataset. In addition, the grouping of countries in REF, OECD, MAF, LAM, and ASIA regions is rich from a socioeconomic perspective (in terms of colonizing history, power structures, cultural values, etc.) but is debatable from a biophysical (temperature, precipitation, etc.) perspective. Moreover, because the current version of the dataset aggregates shocks at the national level, transboundary events – such as regional floods or droughts – may be double-counted. This limitation, widely recognized in the hazards literature (Li et al., Reference Li, Zahra, Madruga de Brito, Flynn, Görnerup, Worou, Kurfalı, Meng, Tiery, Zscheischler, Messori and Nivre2024; Rosvold & Buhaug, Reference Rosvold and Buhaug2021), can only be addressed with geocoding events in future iterations of the database.
All the compiled datasets are subject to several biases. The first one is the temporal bias, as systematic reporting and monitoring become more reliable over time. This issue has been extensively discussed for EM-DAT and similar datasets as DesInventar (Jones et al., Reference Jones, Kharb and Tubeuf2023; Panwar & Sen, Reference Panwar and Sen2019). More precisely, these datasets show underreporting data for several event categories such as earthquakes and hydro-meteorological disasters (Alimonti & Mariani, Reference Alimonti and Mariani2023; Joshi et al., Reference Joshi, Roberts, Tryggvason and Lund2024a). Second, the threshold bias, which de facto evicts all events that do not meet the criteria thresholds defined by the original study’s authors. Third is the hazard bias, meaning that our analysis is naturally limited to the shock types we have included, but misses some others, such as social unrest, migration, political crises, and trade conflicts (Wyatt et al., Reference Wyatt, Robbins and Beckett2023). Fourth is the geographic bias, as Global North countries have more available reporting on disasters than Global South countries (Mahecha et al., Reference Mahecha, Guha-Sapir, Smits, Gans, Kraemer, Sillmann, Sippel and Russo2020). Fifth is the accounting bias, as the impact data for disasters (in casualties or U.S. dollars) are highly challenged as a large proportion of data between 1990 and 2020 are missing (Jones et al., Reference Jones, Guha-Sapir and Tubeuf2022). Sixth and final is the systemic bias, when previous biases interact, compounding their effects.
We tried to limit those biases by having a comprehensive and transparent method, in which we (i) carried out an initial survey of existing datasets to select the best ones according to robustness and coverage criteria (systemic bias); (ii) compared the results from the selected datasets to other more specific datasets (threshold and hazard bias); (iii) standardized each dataset according to a common template (systemic bias); (iv) checked robustness periods of each dataset through literature review and did not use data which were deemed not robust – such as EM-DAT before 1970, as supported to by Jones et al. (Reference Jones, Kharb and Tubeuf2023) and Lee et al. (Reference Lee, White, Adnan, Douglas, Mahecha, O’Loughlin, Ramos, Roberts, Martius, Tubaldi, Van Den Hurk, Ward, Zscheischler and Patelli2023); (v) explored the sensitivity of the co-occurrence analysis to the exclusion of shock categories, and (vi) disregarded impact data. We believe that this protocol, still improvable, is the first step towards a comprehensive assessment of national and international shocks.
Future development of the present work could include the integration of more fine-grained data (potentially combining regional and spatially explicit datasets), the addition of creeping changes, or the identification of emerging typologies of shocks combining the database with case studies. A more in-depth sensitivity analysis based, for example, on MYRIAD-Hazard Event Sets Algorithm (MYRIAD-HESA) of Claassen et al. (Reference Claassen, Ward, Daniell, Koks, Tiggeloven and de Ruiter2023) and an exploration of how the use of impacts and drivers affects the robustness of the database could also be carried out in the future to better assess the robustness of our findings. In addition, future work could explore weighting shocks by severity (e.g., fatalities, economic losses, or damages incurred), though such efforts would require careful consideration of known biases and inconsistencies in impact reporting, particularly across shock types and regions. Finally, future iterations of the database – with improved temporal and spatial resolution – will enable more precise analyses of temporal relationships between shocks, including trends in shock frequency and potential sequencing patterns across regions and shock types.
5. Conclusion
This study offers a first empirical overview of the temporal and spatial dynamics of national-level shocks across 175 countries from 1970 to 2019, highlighting their evolving co-occurrence patterns as an entry point into the study of polycrisis. Our findings indicate that while shocks became increasingly co-occurring until 2000 – particularly within and between climate, conflict, and technological categories – this trend has since plateaued or diverged across regions. Such regionally heterogeneous trajectories challenge the assumption of a globally uniform escalation of crisis entanglement and call for greater attention to the spatial specificity of polycrisis processes. Our analysis also highlights the importance of disaggregating shocks by category and context, revealing that certain combinations recur more frequently and may signal structurally embedded vulnerabilities. These insights speak to broader debates within polycrisis, multi-hazard, and resilience research and stress the need for frameworks capable of capturing both systemic interdependencies and localized dynamics. Ultimately, we hope this work contributes towards building a common empirical foundation for navigating polycrisis, informing both theoretical developments and practical approaches to adaptive governance.
Supplementary material
The supplementary material for this article can be found at https://doi.org/10.1017/sus.2025.10008.
Acknowledgements
The authors are grateful to the Beijer Young Scholars 2024–2026 at the Beijer Institute of Ecological Economics of the Royal Swedish Academy of Sciences, the Ecological Loss and Damage group (Lund University), the Department of Earth Sciences (Uppsala University), as well as participants to the ‘Polycrisis in the Anthropocene’ workshop (Potsdam, 27–28 May 2024) and the ‘3rd International Conference Natural Hazards and Risks in a Changing World’ (Amsterdam, 12–13 June 2024) for fruitful discussions or comments on our work. We also sincerely thank the colleagues who have made their data available to us, Giulia Rubin who carefully reviewed the manuscript, and two anonymous reviewers who provided very constructive feedback.
Author contributions
Louis Delannoy: Conceptualization, formal analysis, methodology, project administration, supervision, visualization, writing – original draft, writing – review & editing. Alexandre Verzier: Data curation, investigation, methodology, visualization. Bernardo A. Bastien Olvera: Formal analysis, validation, visualization, writing – original draft, writing – review & editing. Felipe Benra: Validation, visualization, writing – original draft, writing – review & editing. Magnus Nyström: Writing – review & editing. Peter Søgaard Jørgensen: Conceptualization, supervision, writing – review & editing.
Financial support
L.D. and P.S.J. thank the Erling-Persson Family Foundation for funding the research. P.S.J. also acknowledges funding from the IKEA foundation, the Marianne and Marcus Wallenberg Foundation, the Marcus and Amalia Wallenberg Foundation, the European Union (ERC, INFLUX, 101039376), and the Swedish Research Council Formas (2020-00371). M.N. was funded by a grant from the Swedish Research Council (No. 2020-04586). Views and opinions expressed are, however, those of the author(s) only and do not necessarily reflect those of the European Union or the European Research Council. Neither the European Union nor the granting authority can be held responsible for them.
Competing interests
The authors declare that they have no known competing financial interests or personal relationships that could have appeared to influence the work reported in this paper.
Data availability statement
Data for the number of national shocks (gross and normalized) per country and per year as well as code for producing figures can be accessed from the following repository: https://github.com/LouisD-KVA/Polycrisis-shocks.
Declaration of AI use
We have used AI-assisted technologies for spellchecking, code checking, and as inspiration for rewording individual sentences. After using these tools, the authors reviewed and edited the content as needed and take full responsibility for the content of the publication.


 Open access

