Introduction
Four months on from the referendum and data on the state of the economy remain sparse. The most striking feature of this post-referendum landscape is the evolution of the price of sterling, which has depreciated substantially since the referendum. At the time of writing, sterling now trades at US$1.22; a 31 year low. The €–£ rate is at €1.12, a 5-year low. On a nominal broad, trade-weighted basis, sterling is at an 8 year low.
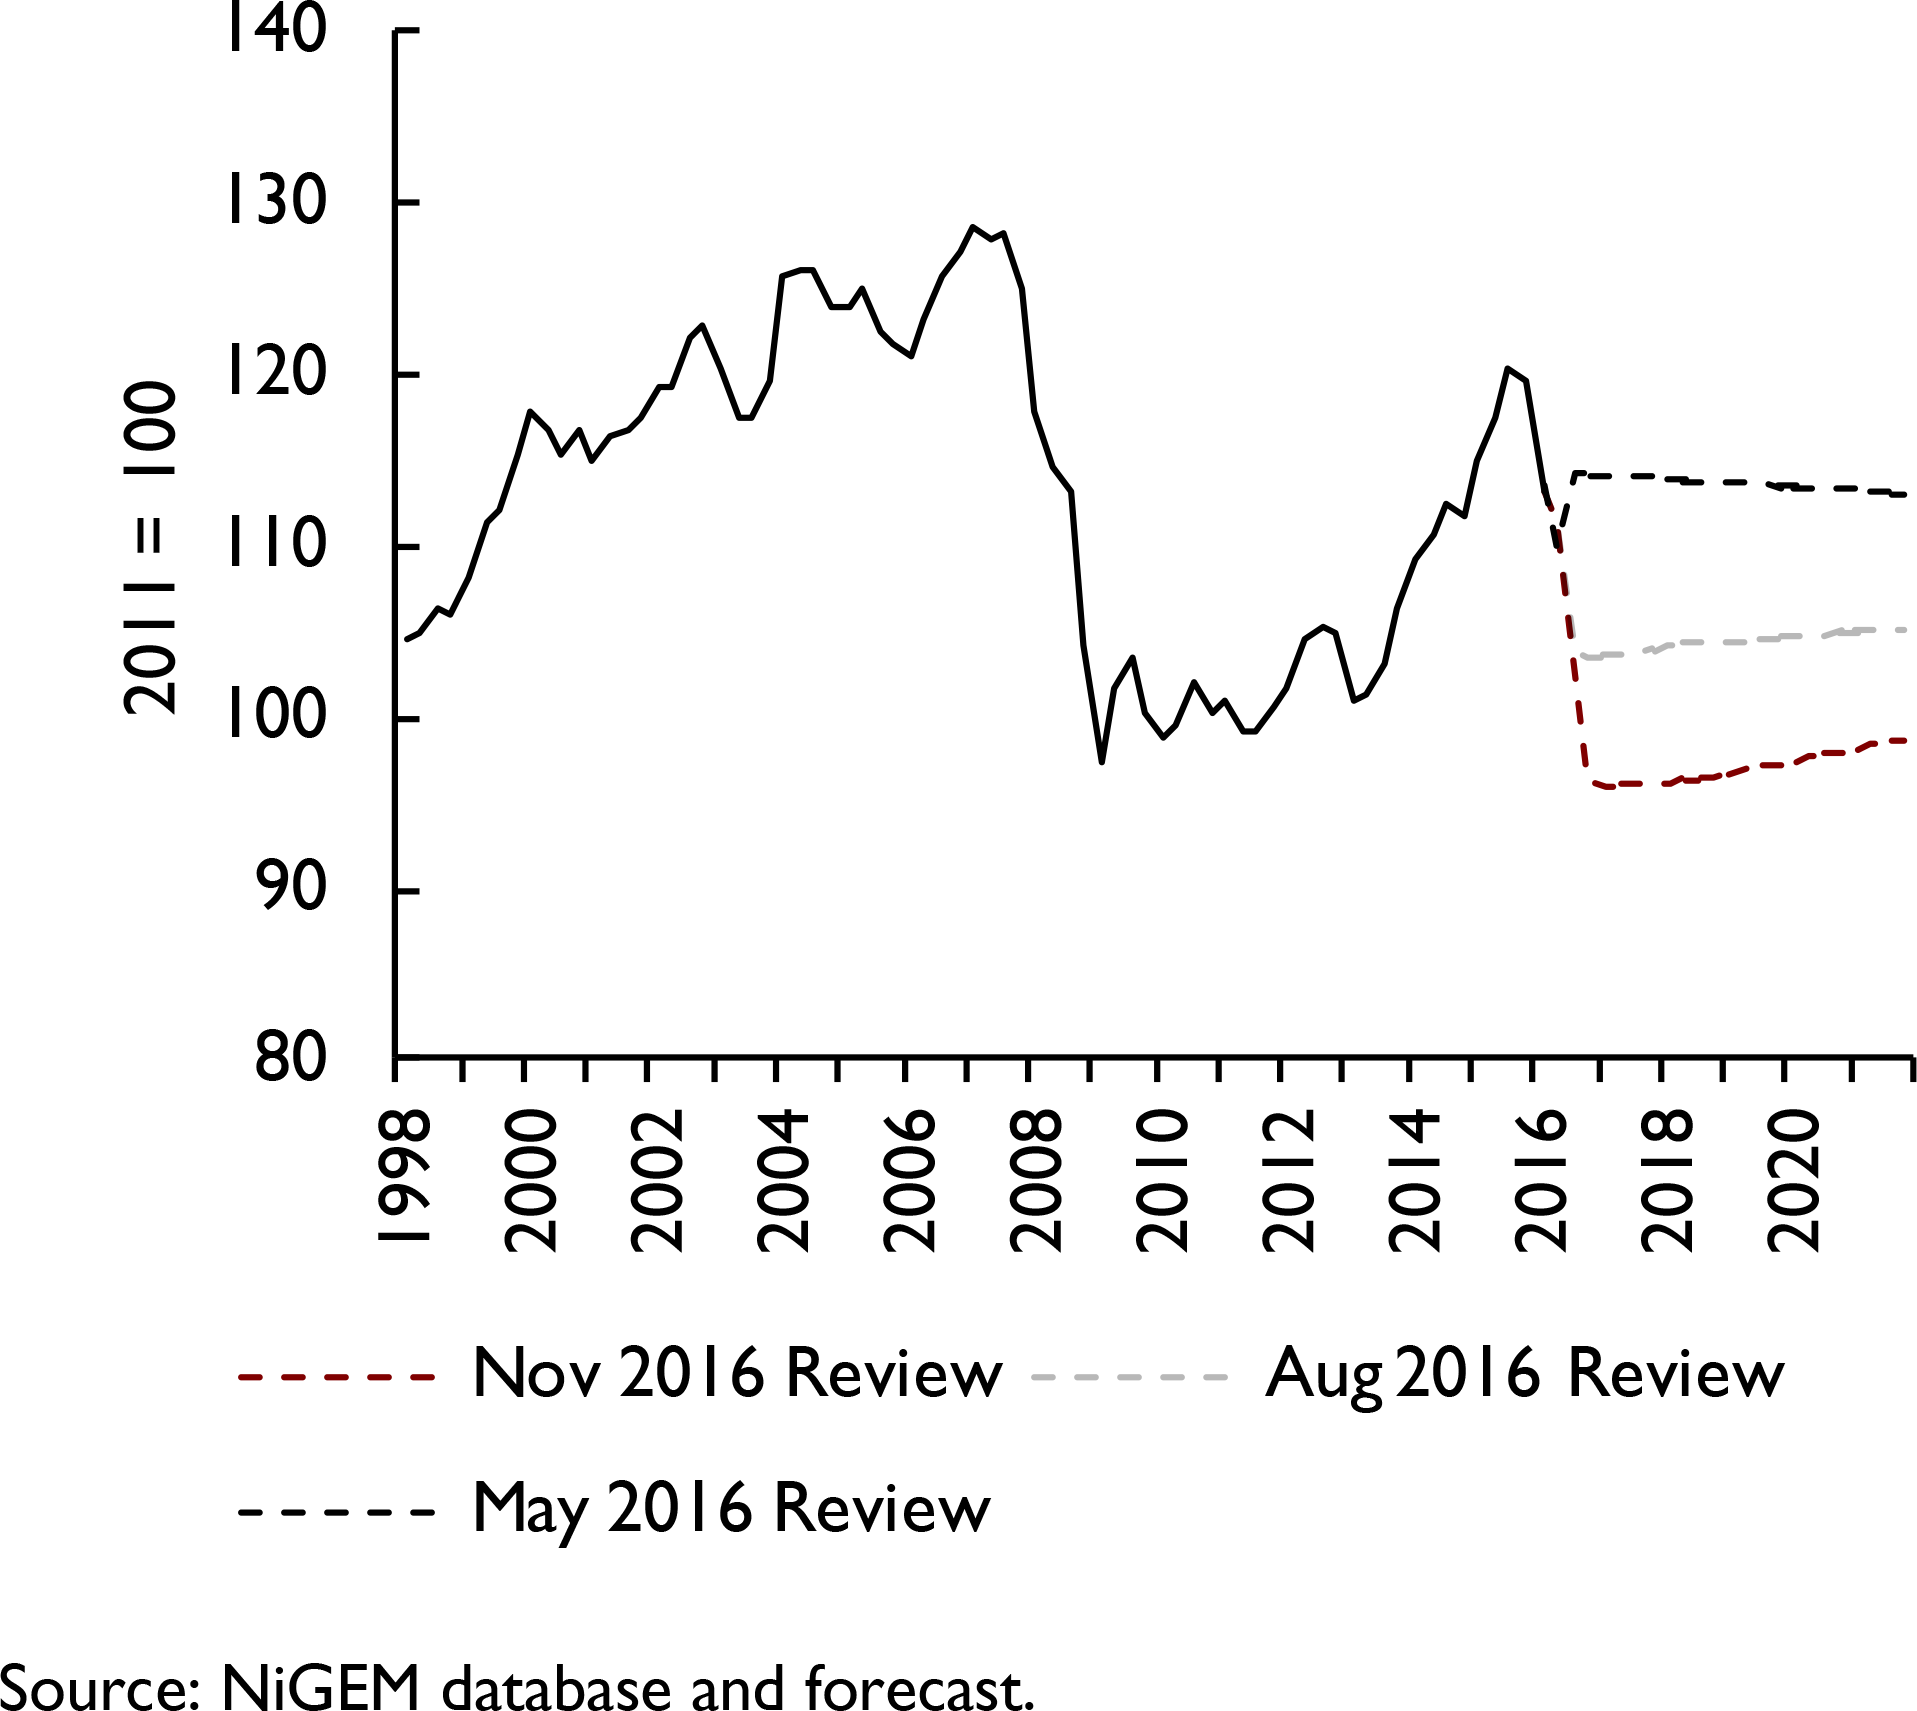
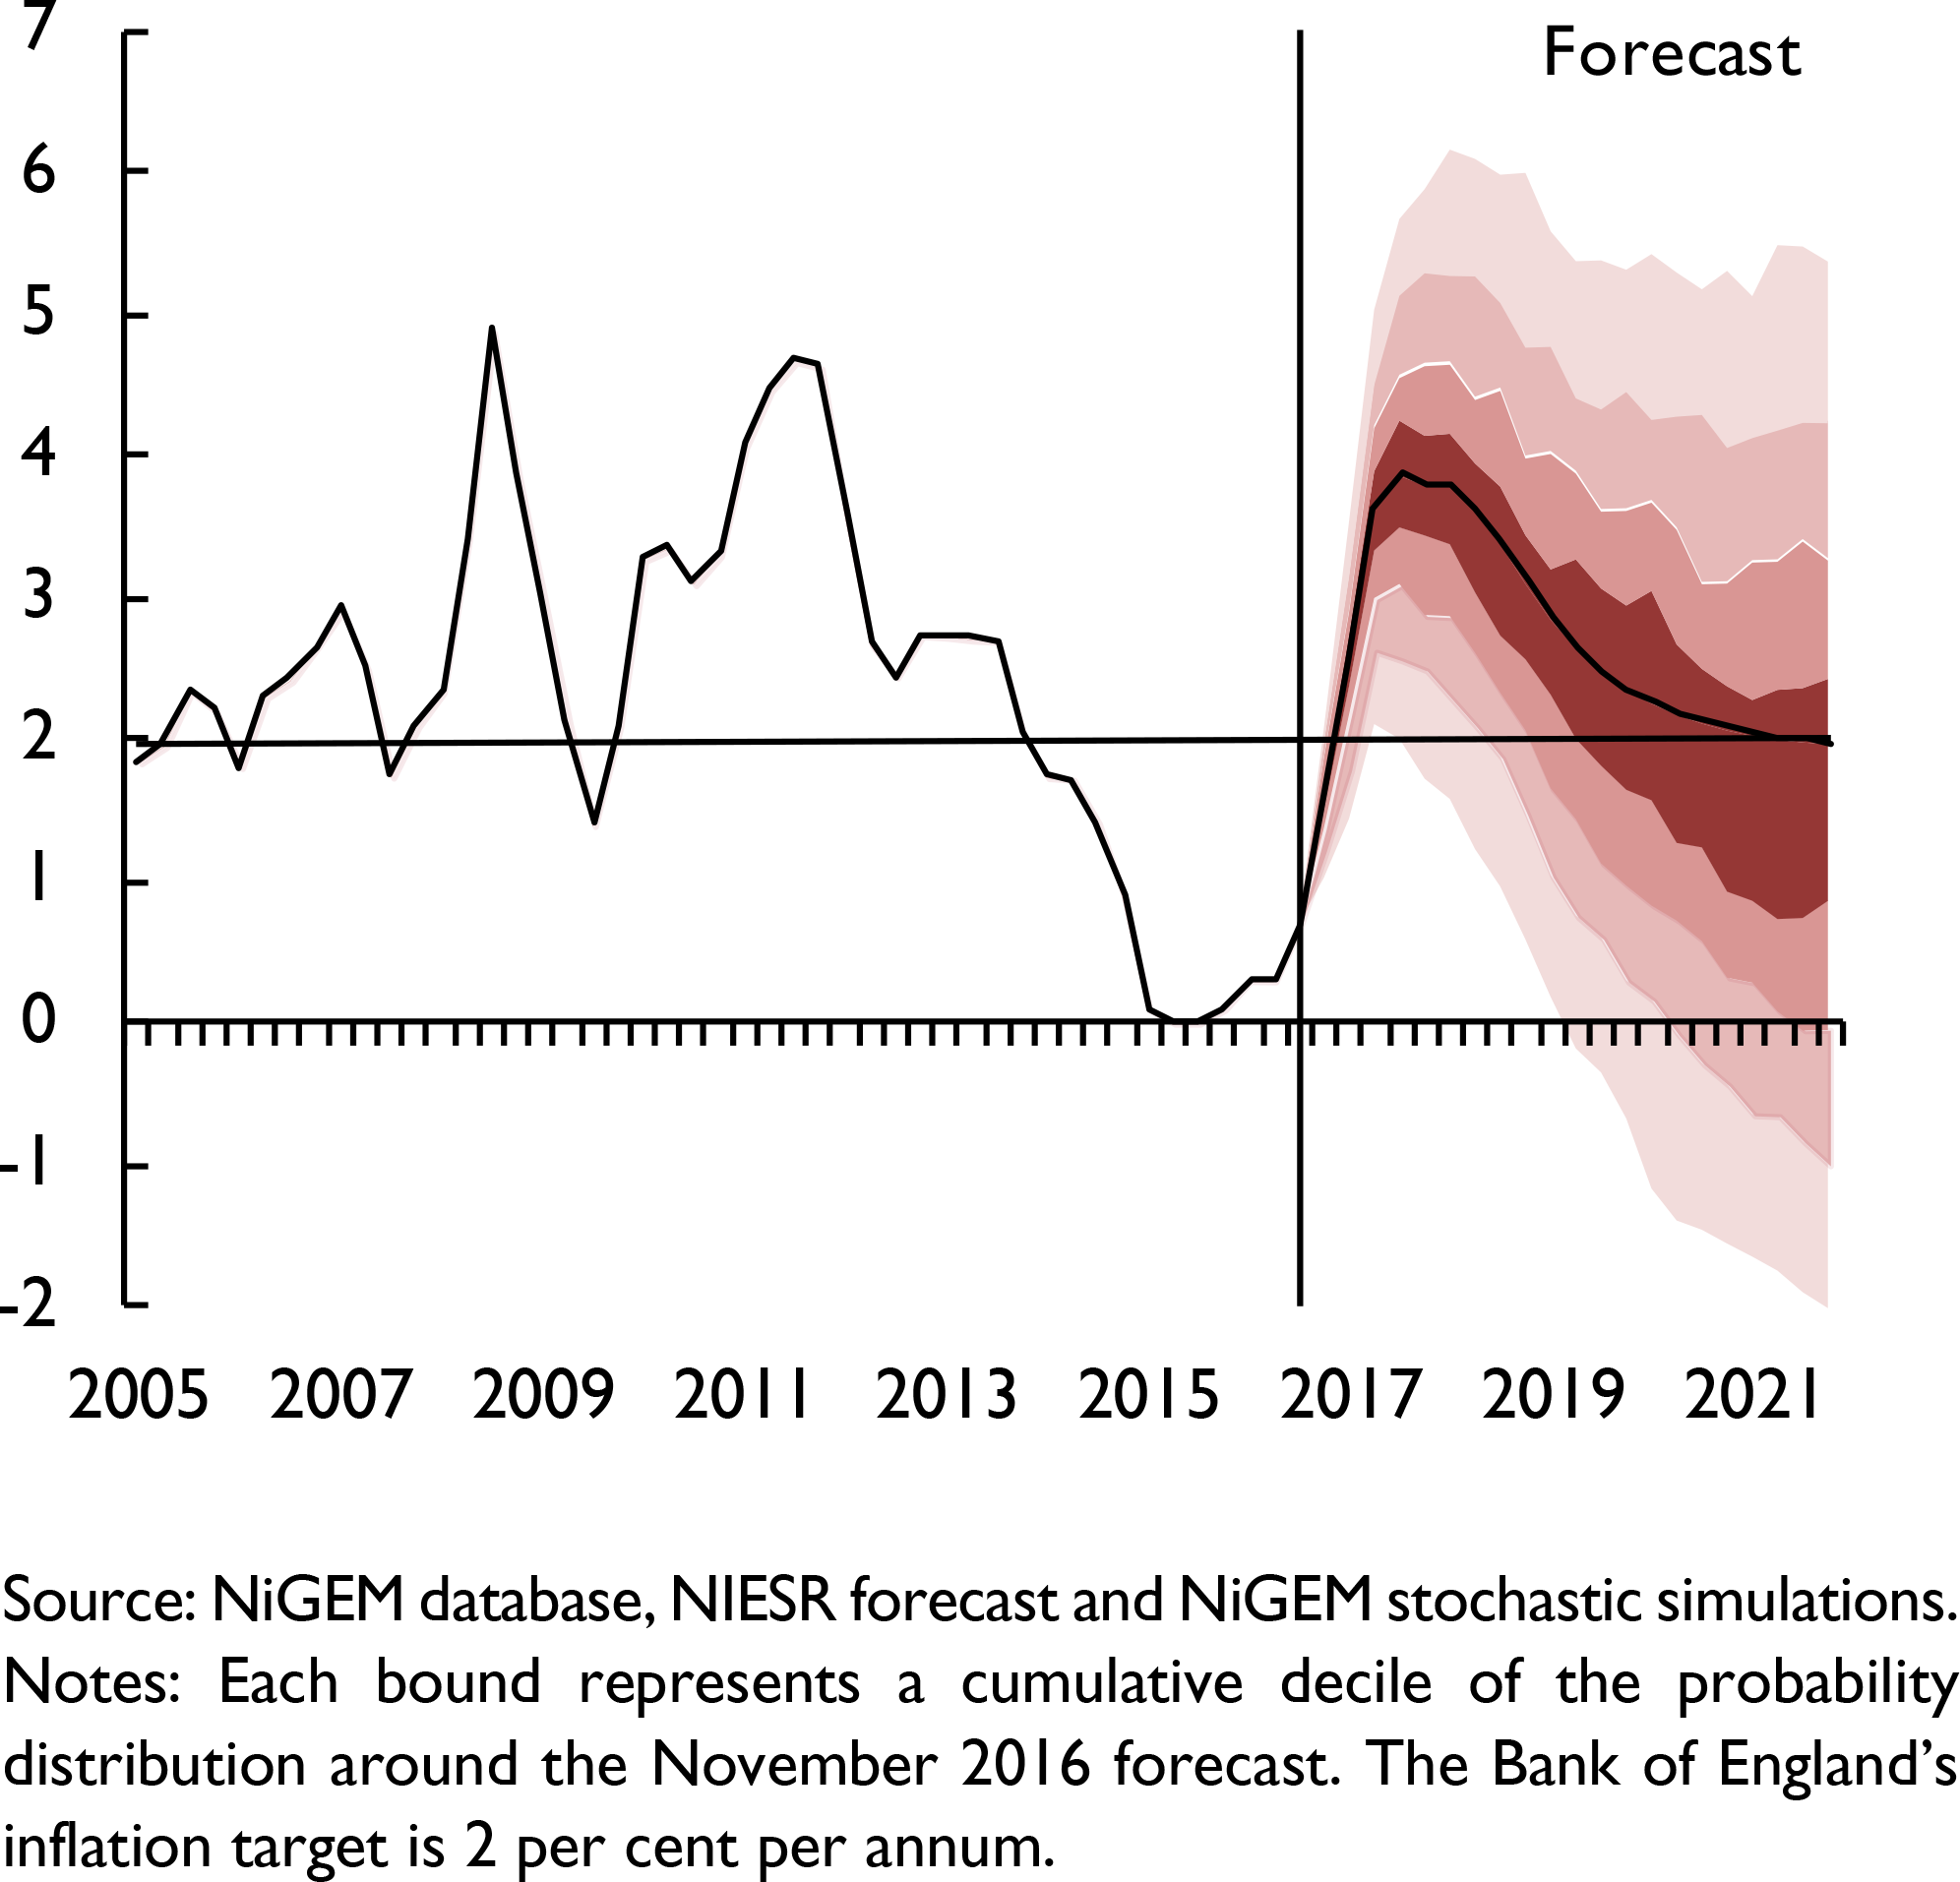
In fact sterling has depreciated over much of the course of this year. As figure 1 shows, on a trade-weighted basis, sterling is now around 20 per cent below its level at the end of 2015. Pass-through from this earlier spell of depreciation is already apparent in consumer price data, but it is over the course of the next year or two that we expect the post-referendum depreciation to pass through into consumer prices. We expect consumer price inflation to overshoot the Bank of England's target, reaching close to 4 per cent per annum at the end of 2017.
Effective exchange rate, trade-weighted
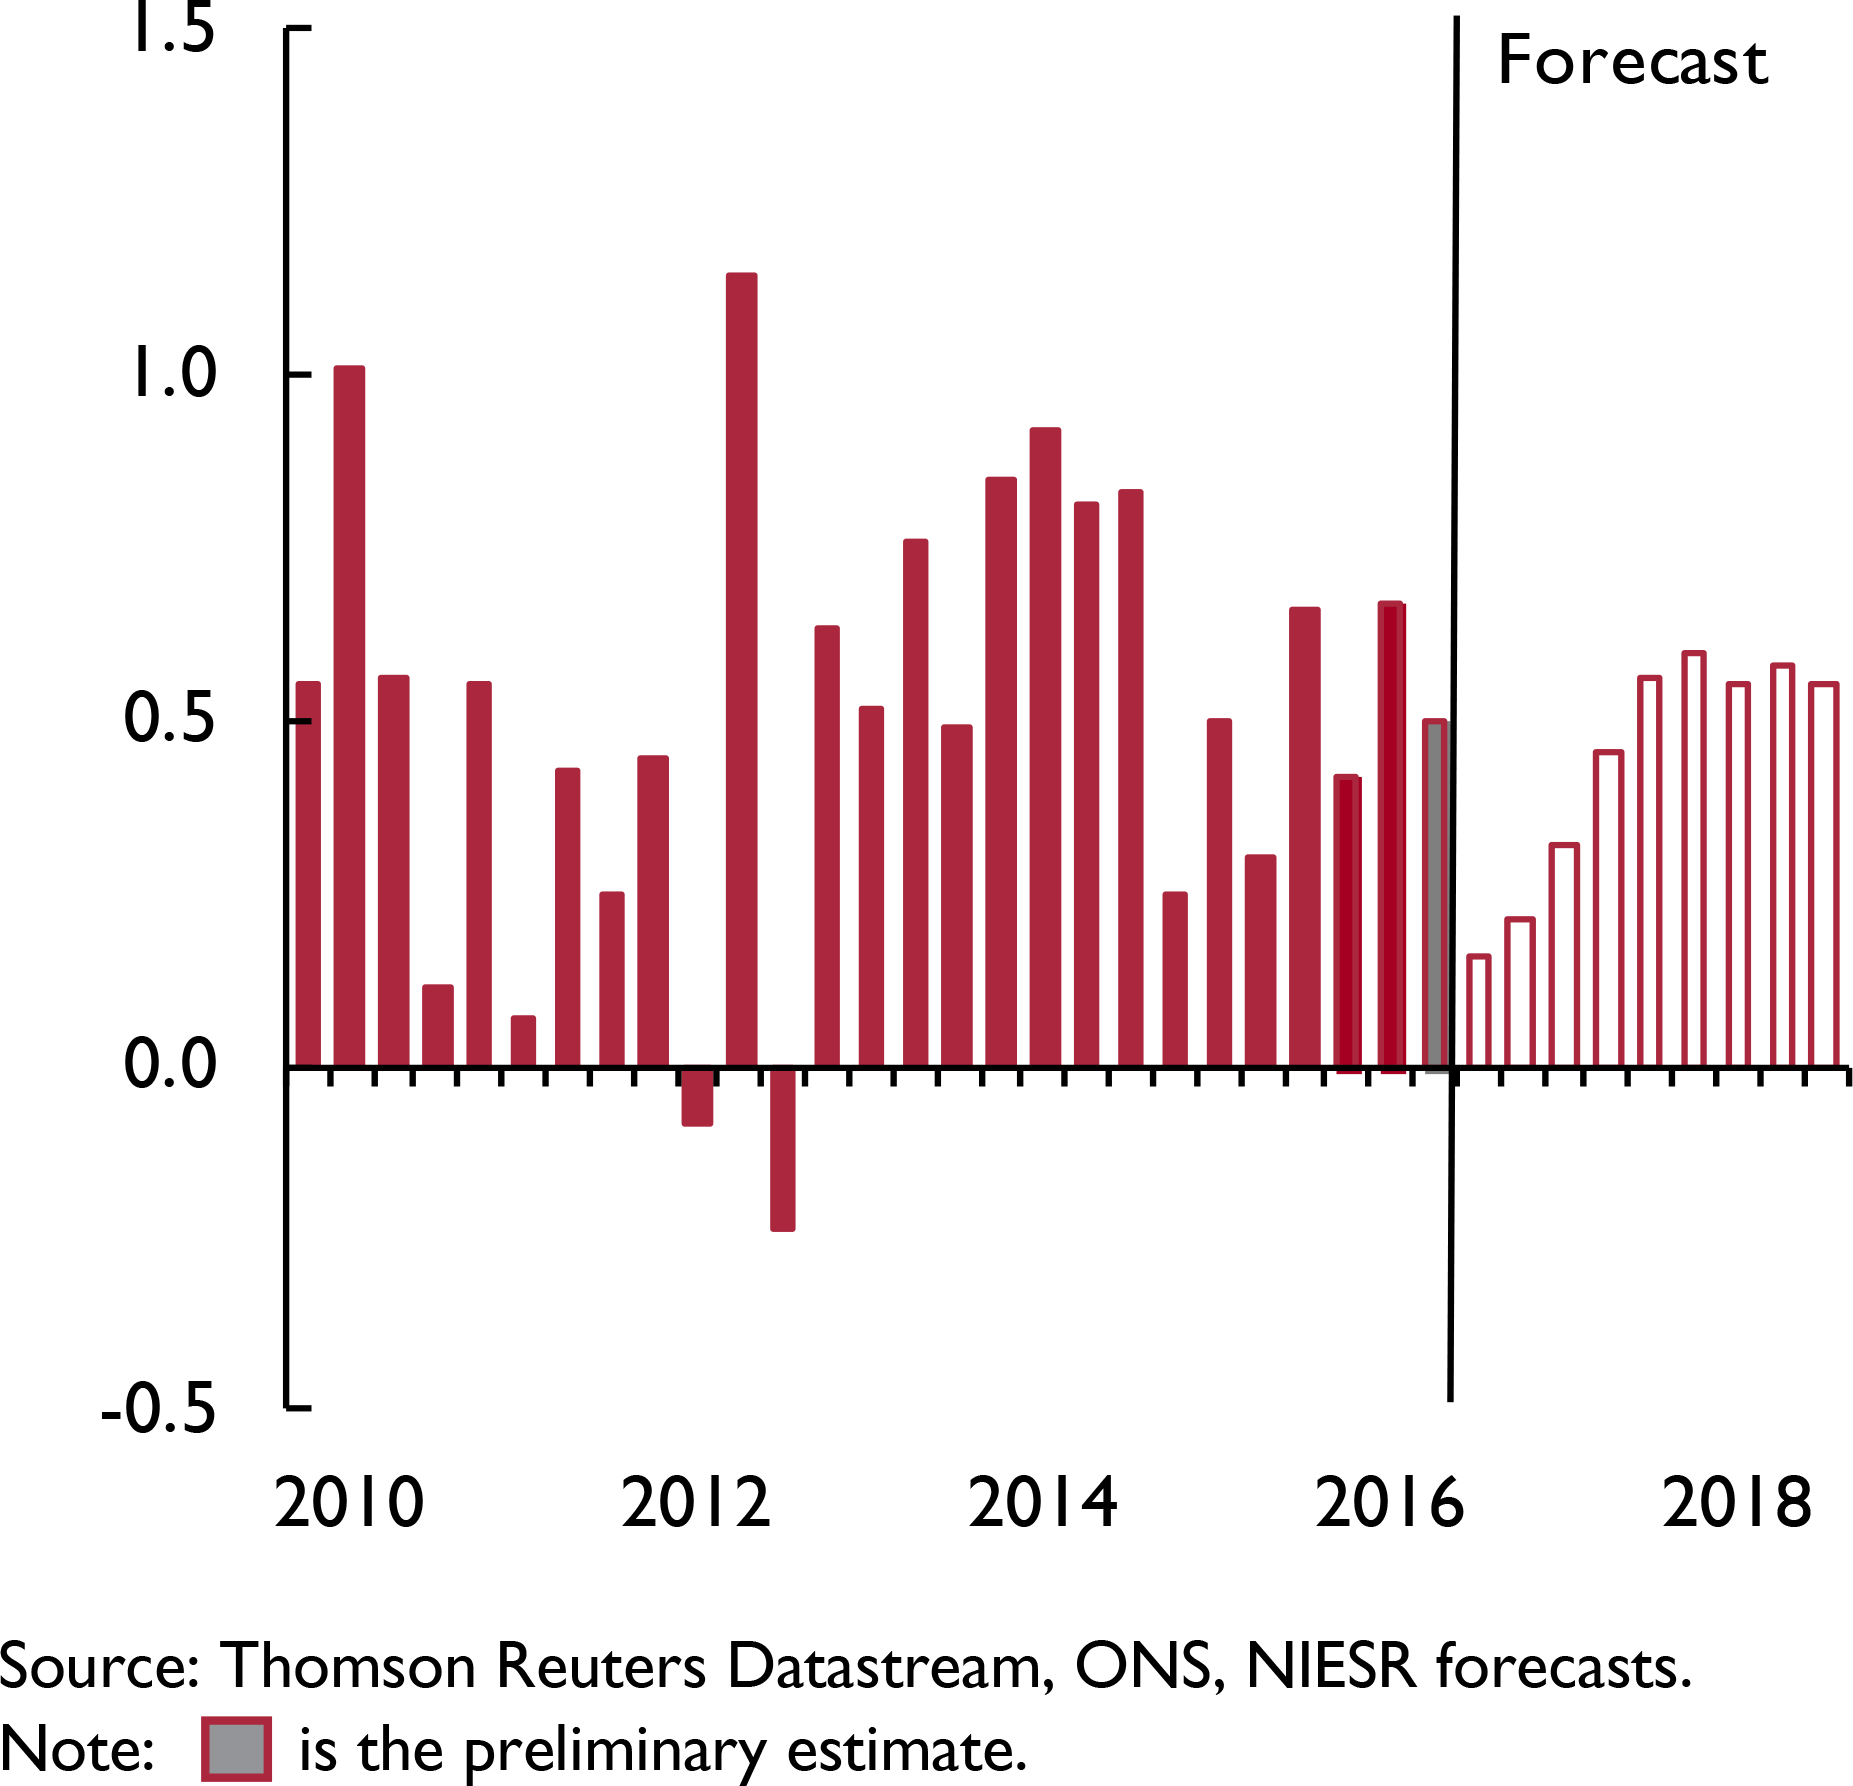
The ONS’ preliminary estimate of GDP suggests the economy expanded by 0.5 per cent per quarter in the third quarter of 2016 (figure 3). Three months ago we had expected a 0.2 contraction in output for that quarter. That the economy has proved more robust is welcome, but it does little to change the overall outlook of a slowing economy. Indeed we highlighted in our last Review how the focus should be on a slowing economy, with an elevated risk of recession; a description which remains relevant.
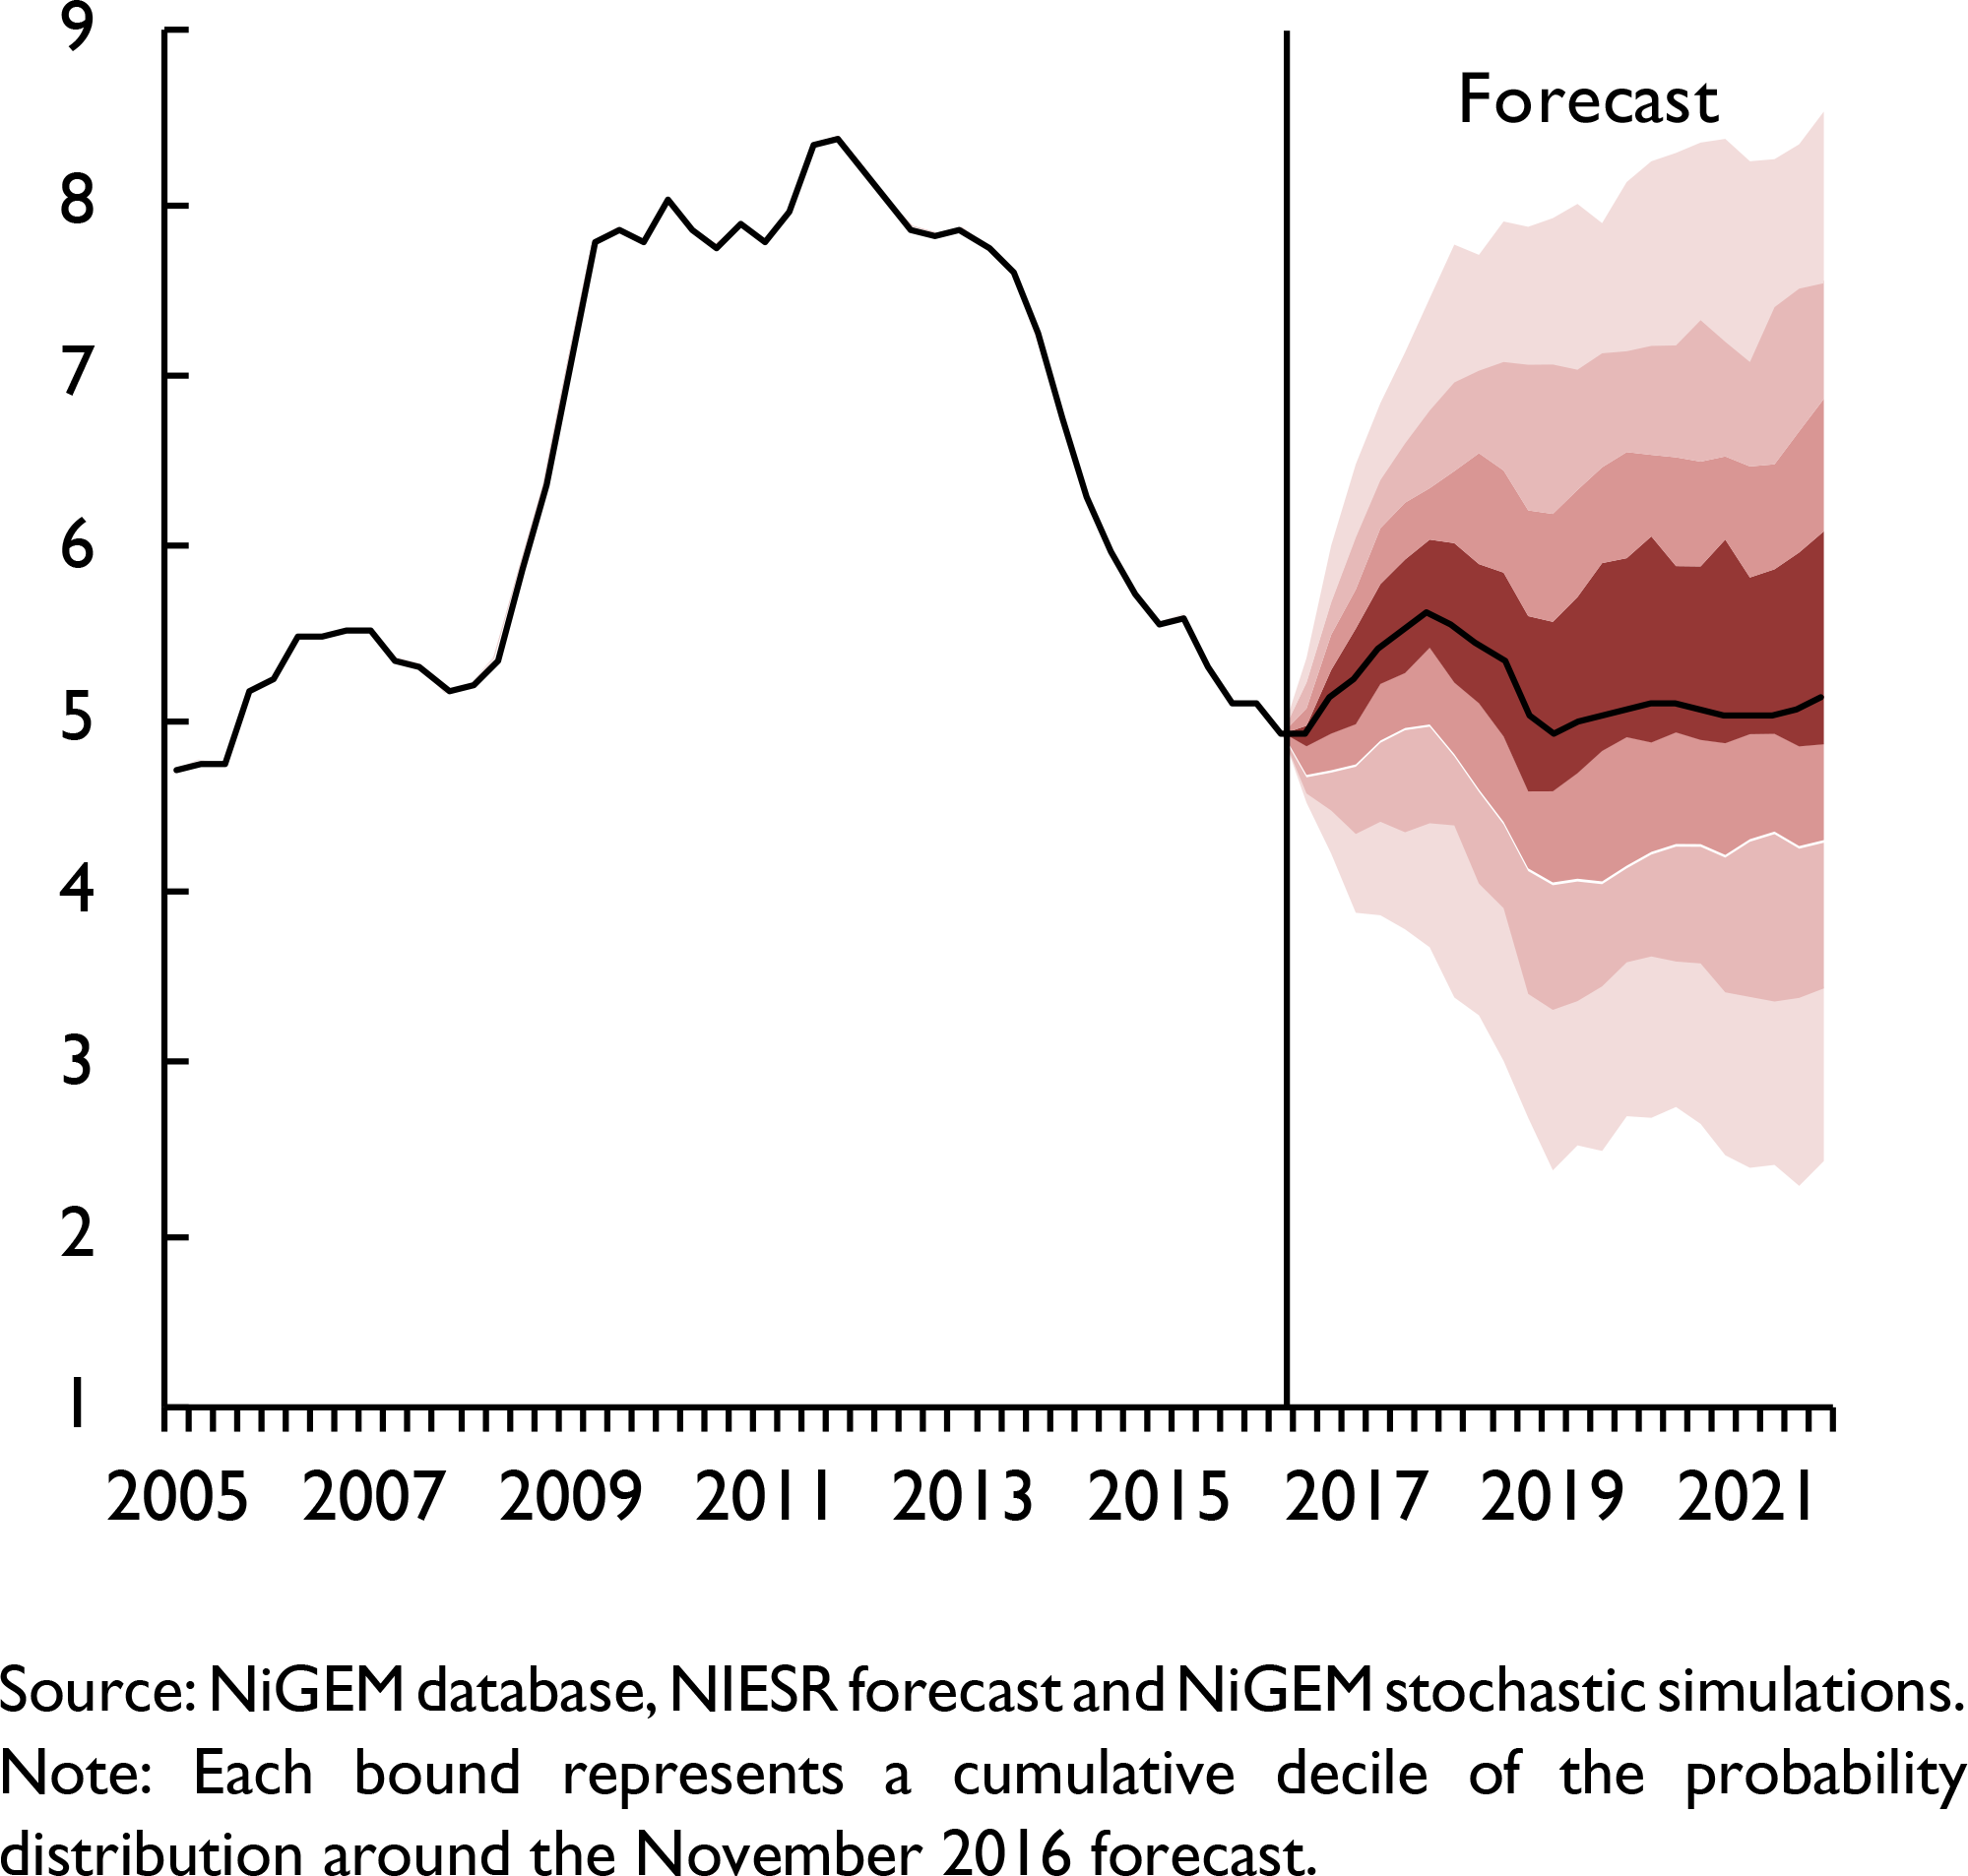
CPI inflation rate fan chart (per cent per annum)
Real GDP growth (per cent per quarter)
The robust consumer spending that is currently supporting overall economic performance is expected to slow over the course of 2017. The sharp rise in the rate of inflation due to the depreciation of sterling will weigh on real disposable incomes growth. Real disposable incomes are expected to grow by around 0.2 per cent in 2017, but this figure is flattered by population growth. Per capita real income is forecast to decline by ½ per cent in 2017. Much of this real income adjustment comes via a drop in real consumer wages.
Welcome positive outturns for GDP growth in the near term give little to no guidance as to what will be the long-run impact from leaving the EU. We assume, following Reference Ebell, Hurst and WarrenEbell et al. (2016), the permanent negative effect from leaving the EU in the long run is around 2 per cent of GDP. Even within this assumption, there are inherent risks. As new research by Monique Ebell, in this Review, shows, it may be difficult for the UK to replace lost trade flows with the EU via a new trade deal with the EU and other countries.
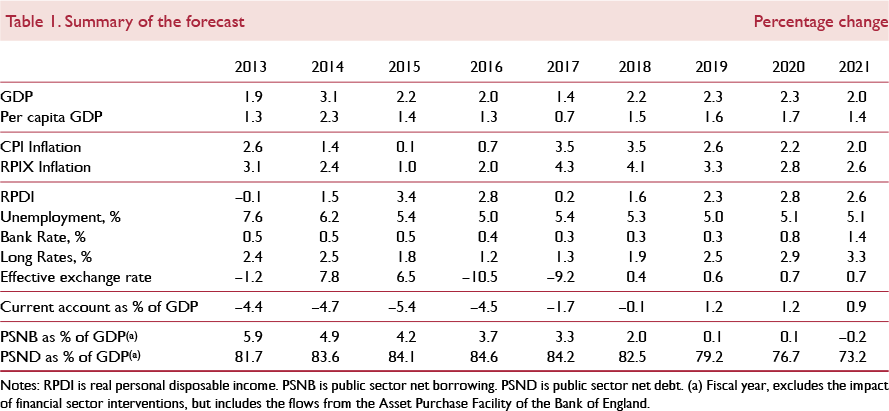
We expect GDP growth of 2 per cent this year, slowing to 1.4 per cent in 2017 (figure 4). On the face of it, these are upward revisions of 0.3 percentage point in each year. Our projection for quarter-on-quarter growth over the course of this year and next remains broadly in line with the figures published three months ago. The lifting of growth rates for 2016 and 2017 are due to revisions to historic data and the outturn for the third quarter of 2016. This is a common issue faced by economic forecasters: the past, not just the future, is uncertain. As more information becomes available to the ONS, the estimate for the third quarter of 2016 will be revised, as is the case with any estimate.
GDP growth fan chart (per cent per annum)

Employment continues to rise over the forecast period, but at a slower pace than growth in the labour force. This continued labour market flexibility is expected to ensure that the rise in unemployment is relatively modest (figure 5). The corollary of this reasonable growth in employment demand and slowing aggregate demand is that productivity levels increase at a modest pace. The undershooting of productivity growth over the forecast horizon remains one of the key risks to the UK outlook. While exiting the EU dominates the domestic policy agenda at present, the UK's productivity puzzle remains unresolved.
Unemployment rate fan chart (per cent of labour force)
Our approach to introducing the shock from the vote to leave the EU remains broadly unchanged from that published in our August Review. This shock manifests as a rise in risk premia on sterling and across a range of domestic instruments that feed into household and corporate spending decisions. Risk premia have increased in the third quarter of this year and we assume they rise further to reach 50 basis points in the fourth quarter of this year.
To offset this tightening of monetary and financial conditions, the Bank of England loosened monetary policy through a 25 basis point cut to Bank Rate and a further round of quantitative easing (QE). Reference MeaningMeaning (2016) suggests that the overall package is broadly equivalent to a 50 basis points reduction in Bank Rate. If the monetary transmission mechanism remains unimpaired then this should offset the rise in risk premia within our forecast. However, such policy changes can do little to offset the drag on spending decisions that stems from heightened uncertainty post-referendum.
Uncertainty is an oft discussed concept and is one of the key elements of the manifestation of the shock that is driving the slowdown in the economy over the coming year. But such a phenomenon is unobservable, and we use statistical techniques to extract an index that we think represents uncertainty (or perhaps caution) that weighs on the decisions of economic agents. Reference Baker, Carreras, Kirby, Meaning and PiggottBaker et al. (2016) reports the business investment equation that we use in this forecast. Increases in the uncertainty index weigh on business investment decisions, depressing demand in the short term. Uncertainty remains elevated (see Box A) and is the key factor behind of the deterioration in business investment through the rest of this year and into 2017. We expect business investment volumes to decline by 1½ per cent this year, and 3½ per cent in 2017. This heightened period of uncertainty is only temporary and we assume a return to the long-run average over the next two years. With this dissipation in uncertainty comes a rebound in business investment growth, which is expected to rise by just under 4 per cent in 2018 and by just under 5 per cent in 2019.
Post referendum developments in uncertainty measures: an update
The run-up to the referendum on the UK's membership of the EU and the period immediately following saw a surge in various measures of uncertainty in the UK economy. This is important in shaping the UK's economic prospects since the consensus among economists is that firms tend to delay investment plans in response to elevated uncertainty. Reference BloomBloom (2009) finds that heightened uncertainty leads firms to delay investment and hiring and results in diminished productivity growth as relocation of resources from low to high productivity firms is hindered. This box is an update to ‘Recent developments in uncertainty measures’, Box F in our August Review (NIESR, 2016). See this analysis for further discussion on the impact of uncertainty on the macroeconomy.
Our quarterly composite uncertainty index peaked at just over 1 standard deviation in the second quarter of 2016 (figure A1). This compares to a peak of over 4 standard deviations at the height of the financial crisis. In the third quarter, the index subsided to one third of its level in the previous quarter. This fall was largely driven by a significant drop in sterling 3-month option implied volatility, but FTSE 100 volatility also fell over the same period (figure A2). While the CBI uncertainty measure rose slightly, it remains below its long-run average level.Footnote 1 The only component to show a significant increase in uncertainty in the third quarter is the text-based economic policy uncertainty index.Footnote 2 This may, however, merely reflect an increase in media attention to policy uncertainty, perhaps self-referentially, rather than a true increase in uncertainty. This also highlights the deeper question of what these measures are capturing – be it fear, perceptions of uncertainty, or a combination of these and other factors.
NIESR uncertainty index, quarterly

Measures of uncertainty

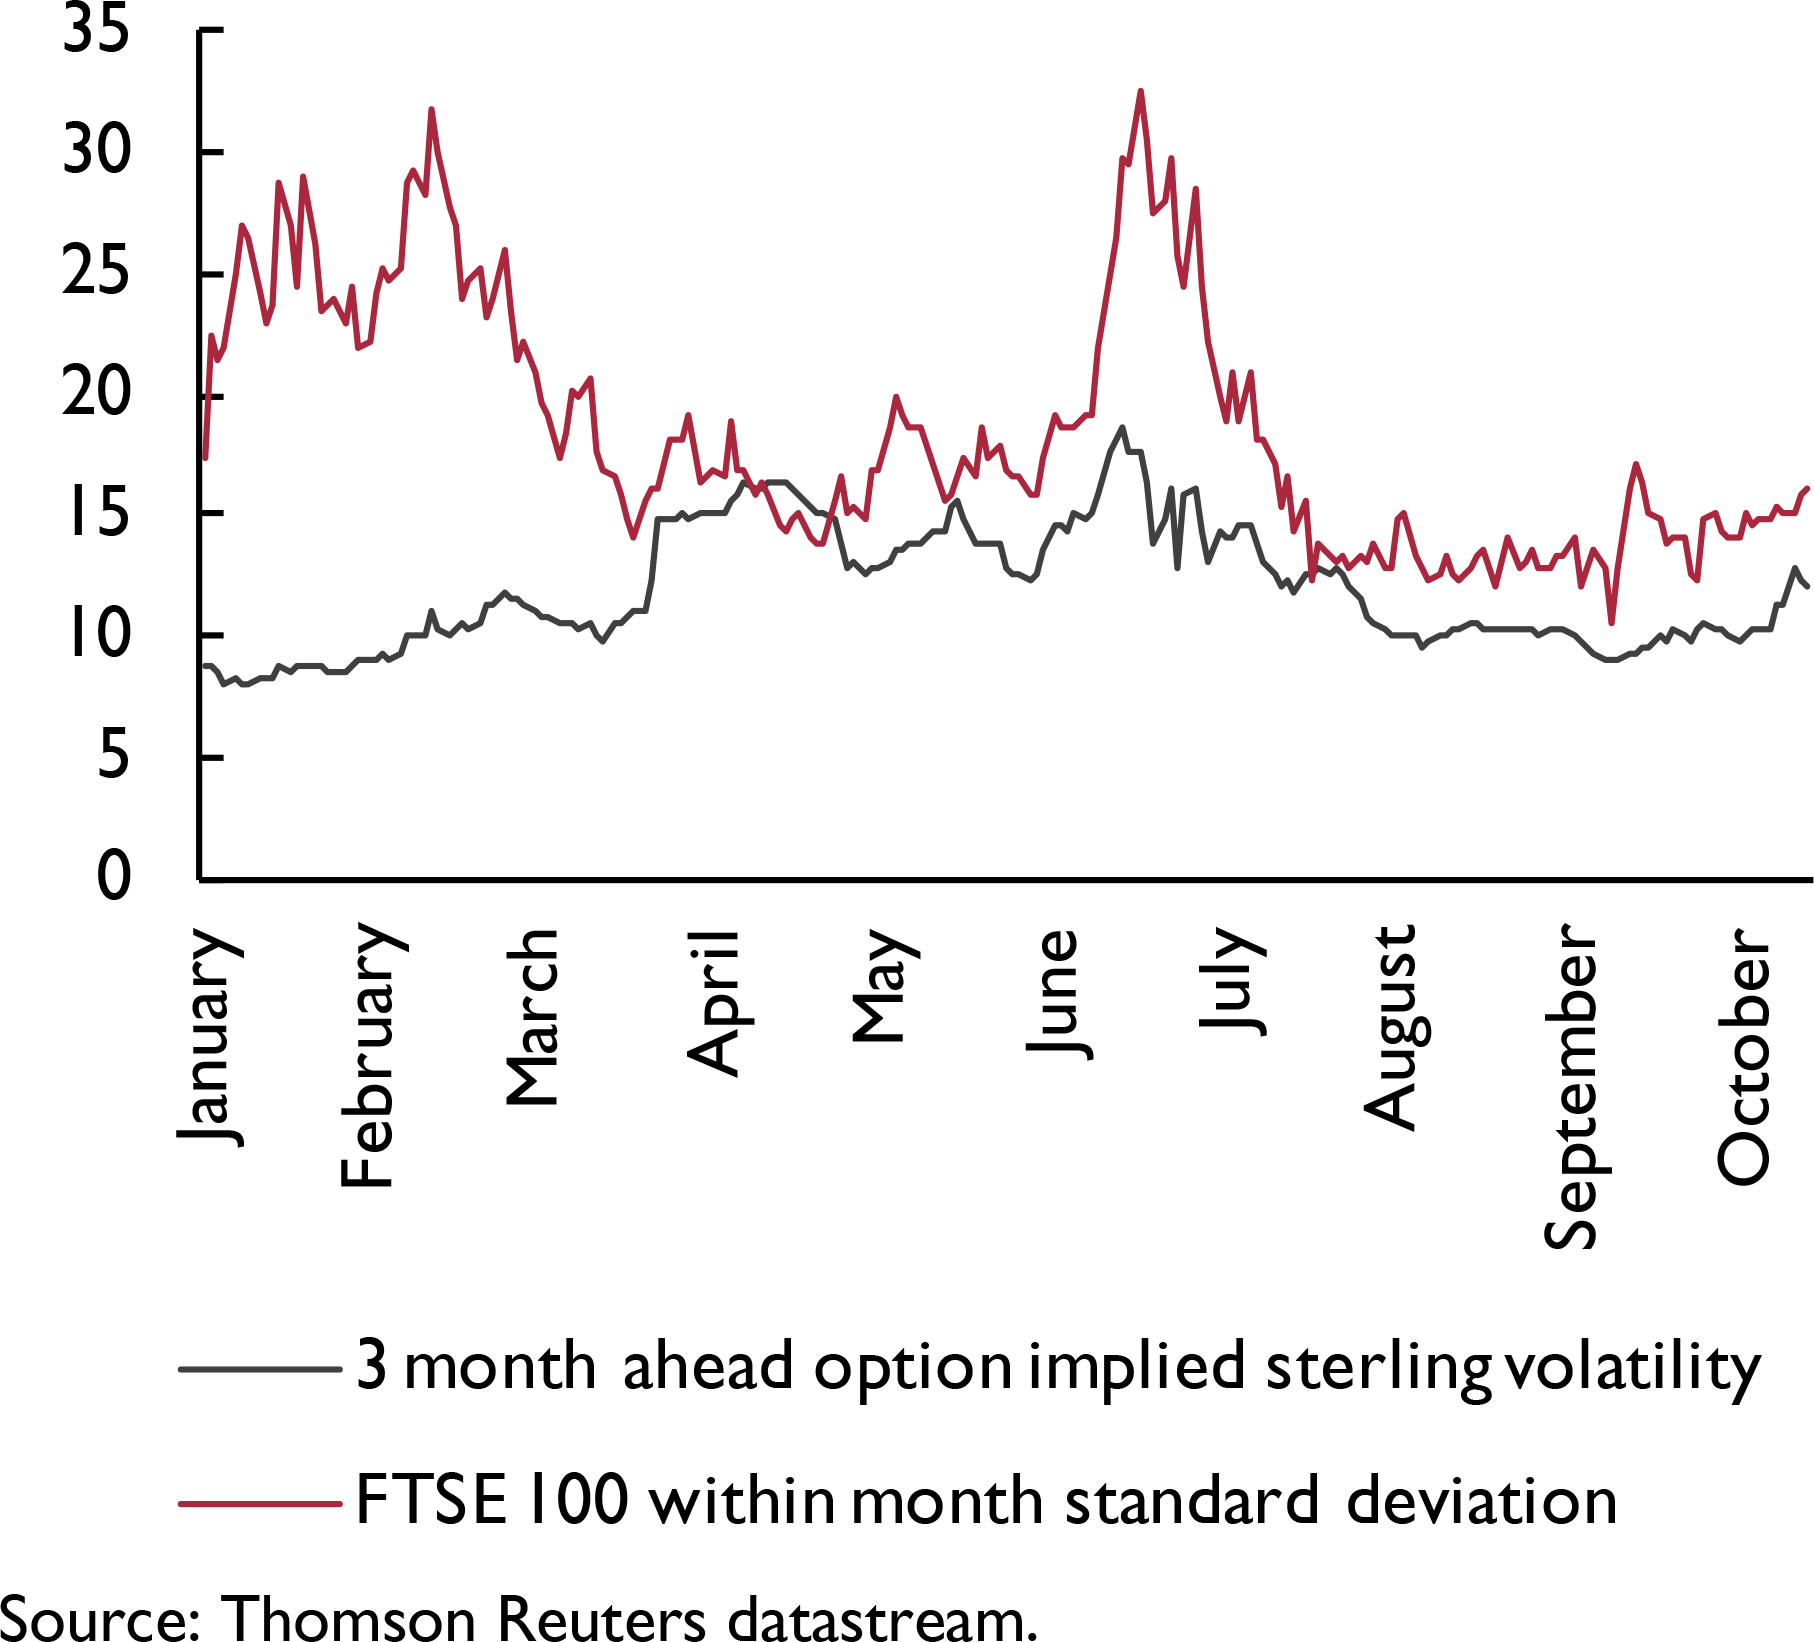
Data on FTSE volatility and sterling 3-month option implied volatility, which are available at a daily frequency, show increases in October 2016 following Theresa May's announcement that Article 50 will be triggered before next April (figure A3).
FTSE 100 volatility and sterling volatility in 2016, daily frequency
The uncertainty measures that our index is derived from are volatile and thus we cannot infer from the recent fall that uncertainty is on a downward trajectory. The exact timing of spikes in measures of uncertainty is unpredictable. Inevitably any path we assume for the future evolution of our uncertainty index will be far smoother than the reality of outturns. It is not inconceivable that uncertainty rises over the coming months, as we converge on and immediately after the triggering of Article 50, especially in the absence of information on the government's negotiating strategy or objectives.
Notes
1 The CBI uncertainty measure is the ‘Uncertainty about demand’ score from the question ‘What factors are likely to limit your capital expenditure authorisations over the next twelve months’ in the Confederation of British Industry's (CBI) Quarterly Industrial Trends and Service Sector surveys.
2 More information on this index can be found at http://www.policyuncertainty.com/index.html.
Over the past three months UK sovereign bond premia have started to rise across a range of maturities (figure 4). With interest rate expectations relatively stable, this increase in premia could well be related to an increase in expectations for future inflation rates that the MPC will ‘look through’. Bond market inflation expectations across a range of time horizons have risen by around 30 basis points over the course of the past month. This brings inflation expectations back into line with their long-run average. The key question then is whether expectations continue to drift upwards.
The limited signs of an immediate slowdown allow the opportunity for more thought to be given to the overall fiscal framework, debt management and possibly some regional re-distribution. As noted in the Commentary a credible fiscal policy framework would seek to avoid the perception of fiscal dominance. Providing clear guidance over the approach to the long-run sustainability of the public finances, while adjusting the framework to remove the dramatic inflexibility that is inherent in a target for a surplus at a fixed point in time would be a welcome step. This is especially the case if we are going have fiscal space to be able to respond to future crises and given the continuing size of the fiscal backstop required to support banks.
Changes to monetary policy have implications for the public finances. This is an obvious statement; monetary policy influences the cost of financing of the sovereign as it does other sectors of the economy. However, the effect on the sovereign is directly affected by purchases of gilts by the Bank of England not just through the lowering of the cost of external finance, but also through the treatment of the coupons the Bank receives on its holdings of gilts. We note in Box D that the monetary policy changes announced in August are expected to lower the financing needs of the sovereign by approximately £4 billion per annum in each of the next five years. We had already priced some of this impact into our forecast for the public finances, most notably the lowering of Bank Rate and the implications for the return of gilt coupons received by the Bank of England, as a major holder of sovereign debt, and returned to the Exchequer. However, we did not assume any QE in our previous forecast, just noting it as an upside risk. Around £2 billion per annum of the saving can be attributed to the effect of QE on the yield curve
Monetary conditions
In August the Bank of England announced a range of policy measures designed to loosen monetary conditions and stimulate demand. Bank Rate was cut from ½ to ¼ per cent and the Asset Purchase Facility's (APF) government bond buying scheme was set to expand by £60 billion over six months, from £375 billion to £435 billion. In addition, the APF would also begin the purchase of £10 billion of bonds issued by private non-financial corporations that make a material contribution to the UK economy. Finally, the Term Funding Scheme was introduced to offer term funding to UK banks at close to Bank rate with the aim of ensuring the efficient pass-through of the cut in Bank Rate to wider market rates.Footnote 1
A simple simulation exercise using the National Institute's Global Econometric Model, NiGEM, suggests that these policy measures taken together are broadly equivalent to a 50 basis point cut in Bank Rate and could stimulate the level of UK GDP by as much as 2/3 of a per cent, Reference MeaningMeaning (2016).
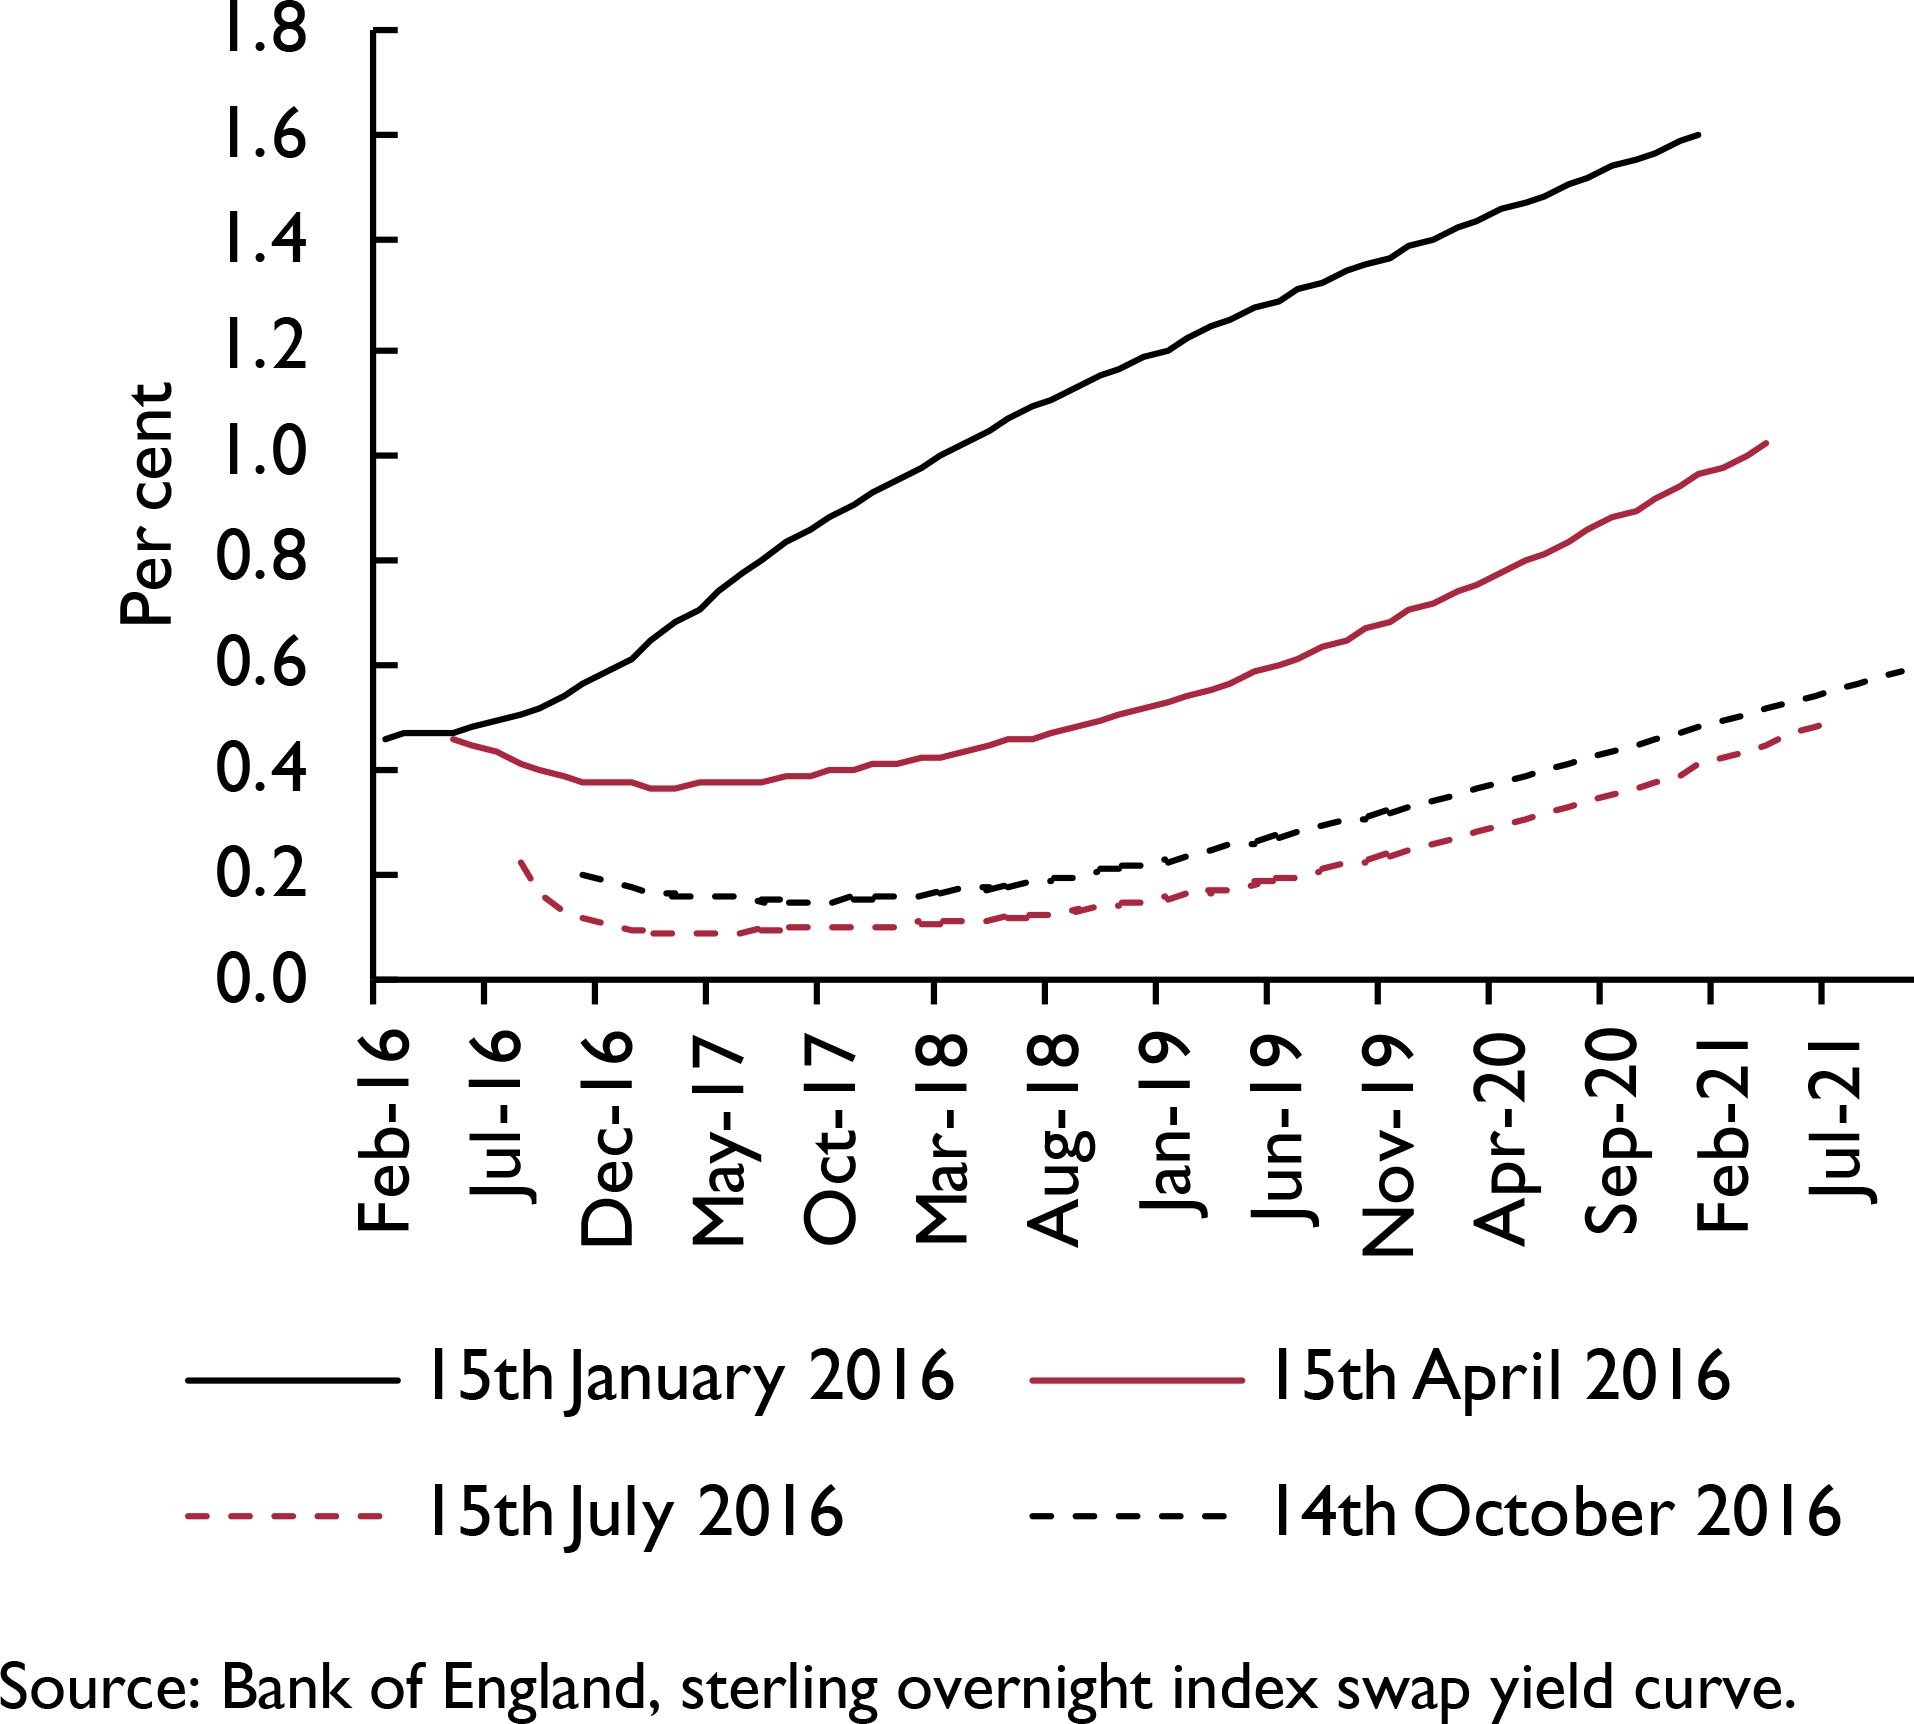
Since August, market expectations of Bank Rate have tightened, largely as a result of a more inflationary outlook, figure 7. As recently as late September, the path implied by the instantaneous forward OIS curve indicated a cut in Bank Rate to 0.1 per cent in the first half of 2017, consistent with the profile that stood behind our August forecast. However, the same market indicators now suggest rates are expected to be held at their current level for a prolonged period, starting to rise from early 2020. Our own view is that this period of static rates is excessive and this forecast is conditioned on Bank Rate of ¼ per cent until mid-2019, rising gradually to reach 1½ per cent by the end of 2021.Footnote 2 This represents a marginally tighter path for the short-term nominal interest rate over the near-term, but one that is slightly looser over the medium term. Alongside this is the additional monetary stimulus implied by the balance sheet measures announced in August which broadly offset the relative tightening in our near-term interest view, and complement the relative loosening further out. Importantly though, with a more inflationary outlook over the next 1–2 years, real rates will be significantly lower than we had previously forecast. Assuming a less than proportional movement in the real natural rate of interest, this in itself imparts a monetary loosening. A key question is therefore; what has happened to the natural rate of interest?Footnote 3
UK sovereign bond premia

Interest expectations
The difficulty that faces the MPC is how best to manage the undesirable trade-off that the outlook for the UK economy presents. Inflation is expected to rise, but this is likely to be in large part a result of the dramatic move in sterling in recent months The MPC has appeared to suggest that they are willing to look through such inflation, and should a temporary exchange rate shock be the sole factor pushing inflation above target then this would certainly be the correct decision, considering the lags in policy transmission. The fact that increases in nominal bond yields since September have been driven more by inflation expectations than a strong coincident rise in expectations of Bank Rate would tentatively suggest that markets at least find this commitment credible.
The more important question then is one of underlying price pressures and the medium-term outlook. Should demand prove to be weaker than currently forecast, then loosening policy to offset this will be particularly problematic in a period of above target inflation. Conversely, should demand prove to be stronger than we expect, this will combine with the existing inflationary effects and cause a significant and sustained period of inflation which threatens the anchor on inflation expectations.
It is also important that policymakers have a clear understanding of the nature of the shock that has hit the economy following the UK's decision to leave the EU. Should the demand shock be less, or the supply shock greater than expected, then much less of a negative output gap will open up, indicative of policy having been set in too accommodative a fashion with inflation overshooting in the medium to longer run. On the other hand, if the period of high inflation and uncertainty sap more demand from the economy than we currently forecast, then the disinflationary pressure once the exchange rate factor drops out will prove the current policy expectation to be too strict.
Exchange rates
Since August sterling has depreciated significantly. At the time of writing it stands at around $1.22, down 7½ per cent in the past three months and €1.11, down 5 per cent; the broad trade-weighted effective exchange rate is 6 per cent lower than in our August forecast. Our previous assumptions for sterling exchange rates in the third quarter of 2016 were consistent with the eventual data outturns. However, the further falls during October were far in excess of what we had expected at the time of our August forecast and so we have revised down the outlook for sterling in the fourth quarter of 2016 from broadly flat across all measures to depreciations of 7, 5½ and 6 per cent against the dollar, the euro and the trade-weighted basket, respectively. This lower level is expected to persist over the forecast horizon with sterling averaging $1.22 and €1.11 for 2017 and $1.23 and €1.11 in 2018.
Within our global econometric model, exchange rate movements are determined by a simple uncovered interest rate parity condition, adjusted for a premium which captures, among other things, unconventional monetary policy and a currency specific risk premium. Simulations, using NiGEM, suggest that the changes in markets’ expectations of interest rate differentials in the UK compared to her major trading partners over the past three months would actually imply an appreciation of sterling of between ½ and 1 per cent.Footnote 4 The cause of the depreciation must therefore lie outside this channel. According to further simulation analysis, the Bank of England's expanded asset purchase programmes, announced in August, can explain approximately 2 percentage points of sterling's fall against both the euro and the dollar, leaving between 3½ and 6½ percentage points unexplained by announced monetary policy changes and our UIP condition.
The most plausible candidate would appear to be market concerns around the UK's decision to leave the EU. Recent movements in sterling have been highly correlated with news associated with the referendum and subsequent negotiations. Forward-looking options-implied sterling volatility measures have risen again since August, though not to the levels seen in the immediate aftermath of the referendum result itself. This suggests markets continue to expect a prolonged period of heightened volatility in sterling over the exit negotiations and are likely looking for compensation for this increased risk through a lower price. To some extent it may also be a reassessment of the UK's longer-term growth outlook, although this would be partly represented in the change in policy expectations. A backward looking measure of exchange rate volatility puts the current episode into context. Figures 8 and 9 show the standard deviation of sterling against the US dollar and the euro/DM over a rolling one month window. In both cases the volatility in sterling following the vote to leave the EU was in excess of anything observed in the historic series, meaning it was greater than during the Global Financial Crisis of 2008 or in the aftermath of the UK's exit from the ERM in September 1992.
Exchange-rate volatility ($–£)

Exchange-rate volatility (€–£)

Given the correlation with news on the referendum, it is possible that when Article 50 is triggered in March 2017, sterling may fall further. This represents a considerable downside risk to our forecast for sterling, but the precise timing and magnitude of this shock(s) is difficult to know. Thus, our central case is for a slowly declining risk premium attached to sterling, dissipating over the next three years as the UK's EU negotiations conclude.
Impact on the inflation forecast from changes to key assumptions
The forecast presented in this chapter is underpinned by a number of key judgements and assumptions which are updated as new information becomes available. These may be changes in the stance of policy, or similarly in certain variables for which we set a specific path rather than allow the structure of the model endogenously to determine their evolution. This box aims to quantify what the impact of these changes to assumptions is for the outlook for consumer price inflation.
Changes in monetary policy assumptions can be decomposed into two elements; movements in the ‘traditional’ short-term nominal interest rate, as well as asset purchases and other balance sheet measures. To gauge the impact of the former, we shock the paths for policy rates in the UK, US and EMU that underpinned our August forecast with our current projections. As discussed in the Monetary Conditions section of this chapter, our near-term expectation of Bank Rate has tightened relative to our August forecast, but we now expect rates to be held at their current level for longer, and so over the medium term policy is actually marginally looser.Footnote 1 Expectations of interest rate developments in the US and EMU have changed very little in the past 3 months (see Appendix A in World Chapter of this Review).
In August, the Bank of England announced a package of balance sheet measures which included purchases of government bonds, corporate bonds and the supply of term funding to banks and building societies. Our analysis suggests that this lowered long-term interest rates by around 20 basis points, almost entirely through a reduction in the term premium in sovereign bonds (Reference Lloyd and MeaningLloyd and Meaning, 2016). We introduce this reduction in the sovereign bond premium as a permanent shock. There is also evidence that the monetary loosening implied by these balance sheet policies lowered the sterling exchange rate, and so we widen the exchange rate premium sufficiently to reduce the effective exchange rate by around 1½ per cent.
The large depreciation in sterling in the third quarter of 2016 was largely expected and built in to our forecast assumptions in August. However, we had previously expected the exchange rate to stabilise in the final quarter of the year. In actuality, sterling has continued to fall and, as discussed in the exchange rate section of this chapter, this can largely be attributed to a widening of the relative risk premium in the UIP condition. We therefore calibrate a widening of the exchange rate risk premium such that, when combined with monetary developments, it elicits a depreciation consistent with the recent fall in sterling. We then isolate this exchange rate risk premium effect, holding monetary conditions constant.
We use the short-term projections from the Energy Information Administration of the US Department of Energy, updated with daily spot prices as the assumption for oil price developments over the next couple of years. This assumption has changed little since August. This is reflected in the marginal impact observed when we introduce the updated path to the August baseline (figure B1).
Impact of changes in key assumptions on the rate of inflation (percentage points difference from base)

Finally, we introduce all the shocks simultaneously. The simulations show a significantly more inflationary future than we expected even three months ago. The combined scenario suggests the rate of inflation will average around 0.7 percentage point higher in 2017 than in our August forecast, suggesting a rate of inflation close to 4 per cent per annum by the end of 2017. In 2017 this is likely to be largely driven by the further depreciation of sterling, which we expect to pass-through a bit more slowly than our simulation illustrates. Over the more medium term though, albeit more muted, the additional inflationary effect is derived from the loosening of monetary policy. By 2018, the exchange rate depreciation is actually detracting from the inflation rate and output growth.
Notes
1 It should be noted that this simulation exercise is based on the changes in the judgement based policy assumptions in the NIESR forecast. These differ from movements in market expectations as implied, for instance, by the instantaneous forward OIS curve. Over the past three months market expectations by the latter metric have tightened (see Monetary Conditions).
Prices and earnings
Consumer price inflation has continued its upward trajectory since November 2015 and reached 1 per cent in the twelve months ending in September 2016. This is the highest rate of CPI inflation since November 2014.
Core prices (excluding energy, food, alcoholic beverages and tobacco) rose by 1½ per cent over the same twelve months to September, up from 1.3 per cent in the twelve months ending in August and in excess of the long-run average over the period 2000–2007. The gap between the headline and core inflation rates, which had been relatively stable since the start of 2015, has almost halved since June, falling from 0.9 percentage points to just ½ percentage point in September. This is a sign that the significant negative pressure that had been exerted on the headline index following the fall of global oil prices is beginning to wane and, in fact, reverse.
Our projection for global oil prices is relatively unchanged from the forecast published in August, with a slightly milder contraction this year and a marginally faster rate of growth in 2017. As previously, our near- and medium-term forecast is built on the path implied by the Energy Information Administration's projections. We now expect oil to reach just over $49 a barrel by the end of this year, $3 a barrel more than in our August forecast, while by the end of 2017 it will be $56 a barrel.
Although the oil price has moved little in dollar terms, what ultimately matters for UK producers and consumers is the sterling price of oil. The dramatic currency depreciation in recent months, and the lower value of sterling against the dollar over our forecast horizon mean that in sterling terms, oil price inflation will be higher both this year and next, figure 10.
Sterling oil price forecasts

There is significant evidence of impending price pressures in the UK, especially when traced along the production chain. Producer input prices are the first link in this chain as they represent the prices of materials and other inputs utilised by UK producers. These have swung from significant contractions in the first half of this year, to annual increases in excess of 7 per cent since July, figure 11. Analysis by the ONS shows that the vast majority of this move comes from imported goods and crude oil. By raising the cost of production, increases in producer input prices may be passed on to Factory Gate, or Producer Output prices. These have seen a similar swing from contraction up to June 2016, to robust expansion of 1.2 per cent in the twelve months ending in September. Although this is more muted than the equivalent input price inflation, it is in line with the rates of growth the series recorded through 2013 and 2014 when headline inflation was at or above its target. What is more, the nature of the production chain would suggest that pass-through to output prices would be slower than that for input prices, and so it may be that inflationary pressure in this series continues to build.
Price inflation

The last step of the price pass-through chain is from producer output prices to the final goods prices paid by consumers, which feeds in to the CPI. The extent to which this happens will ultimately depend on how much firms absorb the higher costs in order to maintain market share. This in turn will depend on the strength of their margins and the degree of competition in the UK retail sector. We expect this final stage of pass-through to be incomplete, but considerable, and therefore have revised up our forecast for consumer price inflation to 0.7 in 2016 and 3½ in 2017 and 2018, before it returns to the Bank of England's 2 per cent target around 2020.
Anecdotal evidence suggests that many firms are hedged against currency swings, at least in the near term. While this may limit the immediate impact of the exchange rate shock, it is unlikely to be long-lasting, as many firms will only hedge a few months ahead. Therefore we expect it at most to be a delaying factor, pushing more of the price increases into 2017 than 2016.
Expectations of inflation look to have ticked up notably since mid-September. According to the forward inflation curve derived by the Bank of England, expectations for inflation at the end of 2019 rose by around 40 basis points between mid-September and mid-October. Similarly, the interest rate differential between two UK government bonds, both of which mature at the end of 2017, one of which is nominal and one of which is index-linked, widened by around 50 basis points over the same period. Household's expectations, as measured by the Bank of England's Inflation Attitudes Survey, picked up only slightly between May and August 2016, but this data is less timely than that taken from financial markets and we would expect to see an accelerated increase at the next data release in December.
This recent increase in expectations is very likely to have been influenced by the anticipated inflationary impact of the fall in sterling. What is more the MPC has communicated that they will look through, to a reasonable extent, the temporary inflation generated through this channel. However, inflation expectations have been broadly on an upward trajectory since the start of 2016, suggesting that underlying price pressures have been building for a number of months. It is therefore vital to watch developments across the range expectations measures at various horizons very closely in the coming months to gauge the extent to which this is a temporary phenomenon or a structural decoupling from the inflation target. The latter would obviously be more worrisome for monetary policymakers and, absenting a change in the stance of policy, would represent a significant upside risk for our medium-term inflation forecast.
The increased inflationary outlook will have consequences for real earnings growth. Nominal Average Weekly Earnings have been increasing by just over 2 per cent per annum since the start of this year, which while weak, when measured against a backdrop of muted price growth, represents a real rate of expansion consistent with the average over the period 2000–2007. However, if nominal earnings fail to react to offset fully the expected inflationary shock then real earnings will be eroded, making workers less well off. In our forecast, the flexibility of the UK labour market mitigates much of the adjustment, but real consumer wages and real average earnings are both lower, leading to lower real personal disposable incomes and a lower purchasing power for households.
Data from the latest Annual Survey of Hours and Earnings (ASHE) shows that median gross weekly earnings for full-time employees rose 2.2 per cent between April 2015 and April 2016. Further distributional analysis of this dataset demonstrates that the increases were largest in the lowest twentieth of the income distribution, where earnings grew 6.2 per cent compared with 2.5 per cent in the highest earning twentieth. This is almost certainly as a result of the introduction of the National Living Wage (NLW) that was introduced in April 2016, with the hourly earnings distribution showing a marked shift in the spike that had previously existed around £6.50, consistent with the then National Minimum Wage, to £7.20, consistent with the NLW, figure 12. In October the government accepted the Low Pay Commission's recommendation to increase the minimum wage for 21–24 year olds, who are not covered by the NLW, by 3.7 per cent to £6.95 an hour, and the Youth Development Rate, which affects 18–20 year olds, by 4.7 per cent to £5.55 an hour. At the time of writing, the Low Pay Commission is preparing its recommendation for the NLW for 2017 which is expected to call for a modest rise. Taken together, these changes should help to support hourly earnings growth at the lower end of the income distribution in 2017, but more by generating a clustering of earnings around the state–controlled minima, rather than by an effective shift of the entire distribution emanating from improvements in labour productivity.
Hourly earnings distributions

Components of demand
The ONS's preliminary estimate of GDP suggests that output grew by 0.5 per cent in the third quarter of 2016; this is broadly in line with our nowcast for the quarter, published at the start of October. Overall, growth seems to be largely unchanged following the referendum with increased activity in services offsetting declines in other industrial groups. Services increased by 0.8 per cent in the third quarter, while output in the other three main groups declined. Compared to the previous quarter, construction fell by 1.4 per cent, agriculture by 0.7 per cent and production by 0.4 per cent. Manufacturing, which is the largest component of production, fell by 1.0 per cent.
We expect output to grow by 0.2 per cent in the final quarter of 2016 with domestic demand forecast to subtract 0.1 percentage point from growth. Of this, 0.2 percentage point is due to a reduction in private sector investment while private consumption is forecast to add 0.2 percentage point. We project net trade to contribute 0.2 percentage point to growth. For the year as a whole we are forecasting growth of 2 per cent, falling to 1.4 per cent next year. Figure 13 shows the contributions of the components of GDP to our growth forecast. Business investment is expected to subtract 0.1 and 0.3 percentage point from GDP growth this year and next respectively as uncertainty surrounding the UK's exit from the EU causes many firms to postpone planned investment (see Box A in this chapter).
Contributions to GDP growth

Real consumer spending has been the main engine of growth between 2012–15, with an average rate of expansion of 2 per cent per year. As a result, real per capita consumption expenditure has expanded at an average rate of 1¼ per cent per annum over the same period and is now just 1 per cent below its pre-recession peak, see figure A4. After robust growth in the first half of 2016, we expect the pace of growth of real consumer spending to slow in the second half of this year and next, as rising import prices emanating from sterling depreciation are passed on to consumers. Underpinning our forecast is the assumption that sterling continues to depreciate until mid-2017 before gradually starting to recover. Real consumer spending is expected to contribute 1.8 out of 2 percentage points to GDP growth in 2016 and just 0.4 out of 1.4 percentage points in 2017. Our projections imply real per capita consumption expenditure will decline in 2017 and 2018.
Real government consumption has expanded every year since 1997. Demographics, however, play an important role. Indeed, real per capita government consumption expenditure declined between 2010–11 and 2013. Looking ahead, our forecast assumes that government spending evolves broadly as planned by the government and, in the absence of specific spending envelopes, is based on the assumptions outlined in the Office for Budget Responsibility (OBR)'s latest Economic and Fiscal Outlook, published alongside the March Budget. Thus, we expect government expenditure to moderate in the near future, consistent with the previous fiscal mandate of achieving a fiscal surplus by 2021–22; a mandate that in all certainty will be revisited in the upcoming Autumn Statement. We forecast government consumption to contribute 0.1 percentage point to GDP this year and next.
Trade elasticities and the depreciation of sterling
Sterling has depreciated by around 15 per cent, on a trade weighted basis, since the referendum. Key to understanding the impact of exchange rate devaluations on the economy is the evolution of the elasticities of trade. Knowledge of the price elasticity is crucial, as it measures the response of trade volumes to a change in trade prices. However, the context is of essence: weak global demand may impair the effect of exchange rate movements. A case that springs to the mind is the devaluation in sterling that took place during the Great Recession. Although research suggests that sterling depreciation of 2007–9 prevented a far worse drop in output, the dynamics of global demand, especially from the UK's major export markets, over this period appear to have dominated the evolution of trade volumes.Footnote 1 Thus, the picture would be incomplete without knowledge of the income elasticity, which measures how responsive trade volumes are to changes in income.
Tables C1 and C2 provide some recent estimates of price and income elasticities of export and import volume equations. Unless specified otherwise, all papers use combined goods and services trade data. Trade volumes appear to be price inelastic in the short run. For every percentage point decline in export prices, we see at most a 0.2 per cent increase in exports and no impact at all on the volume of imports in the short run. Given that the nominal exchange rate is one of the elements that shape the price of goods and services in international markets, this result extends to the exchange rate elasticity of trade volumes. Based on these estimates, we would only expect exports to rise in the short term by at most one-fifth as much as the exchange rate falls. In addition, while price elasticities become statistically different from zero in the long run, these remain in most instances well below one. As a result, any stimulus for exports from falling export prices or sterling depreciation would seem to be quite muted.
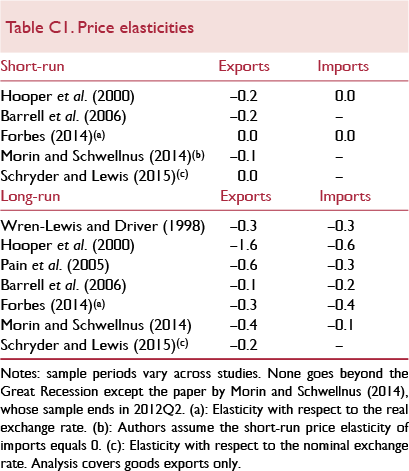
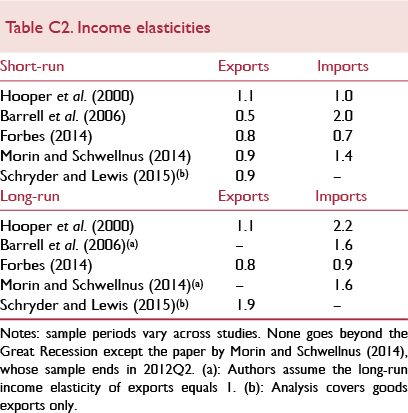
Although there is a significant amount of variation between the estimates, income elasticities appear to be close to or above unity, both in the short and long run; trade volumes are much more responsive to fluctuations in demand rather than prices. In the short run, exports are estimated to increase by between 0.5 and 1.1 per cent for every percentage point increase in income, while imports increase between 0.7 and 2.0 per cent. In the longer run, the estimated increases in trade associated with increases in income are somewhat larger. The literature has recently pointed to two channels that may have triggered a decline in both income and price elasticities.
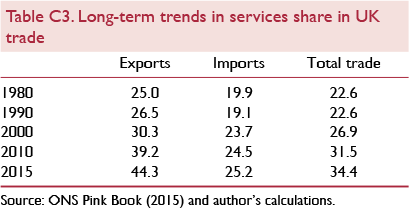
Trade volume growth has slowed down since the end of the Great Recession (for a concise summary of this literature see Reference Carreras and KirbyCarreras and Kirby, 2016). Investment, in particular, has been flagged as a key contributor (see Reference Bussiere, Callegari, Ghironi, Sestieri and YamanoBussiere et al., 2013).Footnote 2 Investment growth, globally, has been subdued since the onset of the Great Recession and, given it is the most import intensive component of total final expenditure, this compositional effect could explain the decline, in recent years, of the income elasticity of trade volumes.Footnote 3 The empirical literature has also brought to the fore the importance of distinguishing between goods and services trade in determining trade elasticities. This is particularly important for economies such as the UK, where services exports make up a particularly large share of trade. The share of services exports to total UK exports has been steadily increasing over the past decades (see table C3). Indeed, research suggests services exports are more price inelastic than goods exports.Footnote 4 This compositional effect could well mean that price elasticities of trade volumes could continue to decline in years to come, if services exports continue to rise in relation to those of goods.
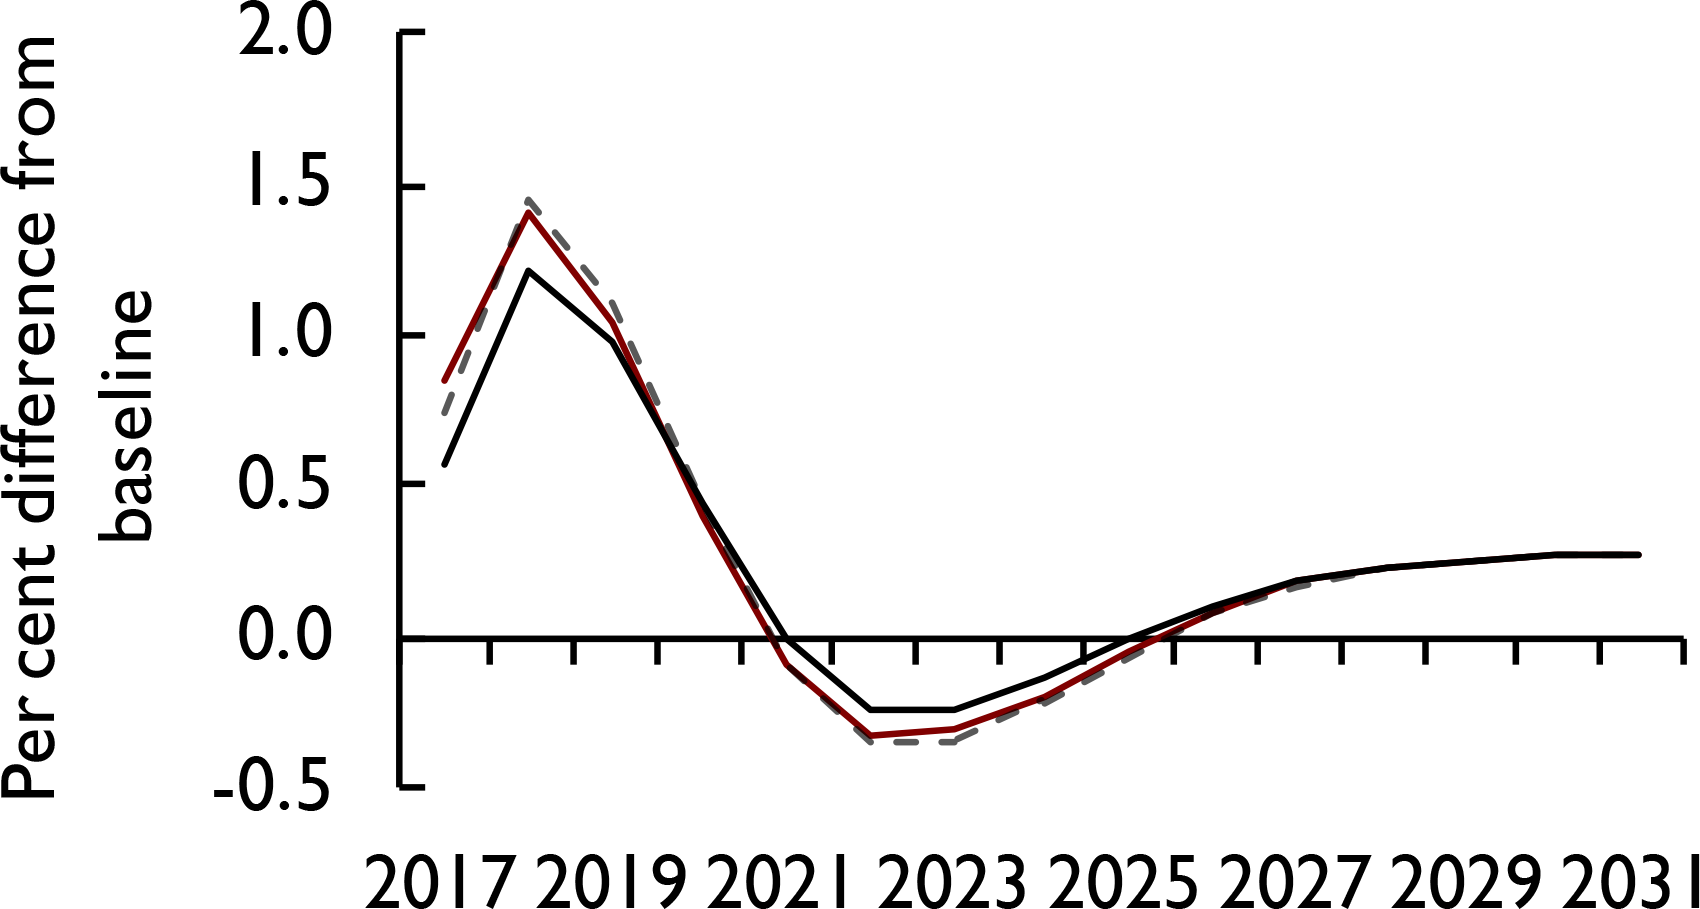
To illustrate the importance of these different estimates for the trade response to a depreciation of sterling, we run a series of illustrative simulations using NiGEM. The shock to sterling is the same in each case and has been calibrated to produce a depreciation of 10 per cent on impact, via a widening of the relative risk premium of sterling, and gradually dissipate over a span of 5 years.5,6Figures C1–C4 display the results.
Export volumes (goods and services)

Real GDP level
Consumer price inflation rate

Trade balance (per cent of GDP)

We consider three simulations. The benchmark simulation uses the ‘default’ parameters in NiGEM's UK trade equations. These set the value of the short-run price elasticity of export volumes to −0.25. We run a second simulation (reduced price elasticity label) where we lower this elasticity to −0.1, to reflect the effect of assuming export volumes are more price inelastic in the short run. We apply no changes to the import equation as the short-run elasticity of imports to real import prices is already set to 0 in NiGEM. In our third simulation (reduced exchange rate elasticity label), in addition to the adjustment introduced to the short-run price elasticity of exports, we adjust the nominal exchange rate pass-through to export prices. In the standard version of NiGEM, a 90 per cent pass-through is assumed. IMF (2015) estimates for a panel of countries suggest pass-through is more likely to be around 50 per cent and so we modify the relevant coefficient to reflect this.
Depending on the price elasticity and the degree of sterling pass-through to export prices, exports increase between 1.2 and 2.6 per cent on impact (figure C1). We observe that the impact from reducing the nominal exchange rate pass-through to export prices is much more powerful than the impact of reducing the short-term price elasticity of exports, although, in relative terms, the coefficient of the short-term price elasticity has been reduced by a greater factor. In terms of output, the various simulations suggest an impact effect between 0.6 and just above 0.8 per cent (figure C2), with a peak impact between 1.2 and 1.5 per cent, occurring after one year.
A depreciation of sterling not only affects the export side of the economy. Most relevant is the inflationary pressure derived from an increase in import prices due to the devaluation of sterling. The benchmark scenario suggests inflation would increase on impact by around 1.5 percentage points (figure C3), which acts to depress private consumption through an erosion of real incomes.
There is also an effect on import volumes. Import demand declines because consumption falls due to rising inflation and real import prices increase following the devaluation. Overall, the aggregate effect on the trade balance is illustrated in figure C4. Although initially the depreciation produces a worsening of the trade balance, after a lag it improves with a positive peak impact between 1.2 and 1.5 percentage points taking place two years after the onset of the shock (The Marshall-Lerner condition holds).Footnote 7
Thus, our estimates suggest that the size of the short-run price elasticity of trade volumes as well as the rate of pass-through of the exchange rate to import prices have a profound impact on trade volumes, but a somewhat muted impact on GDP given the sheer number of offsetting channels in operation following a shock on the exchange rate.
This box was prepared by Oriol Carreras and Simon Kirby.
Notes
1 See, for instance, Reference Kamath and PaulKamath and Paul (2011).
2 Every £1 of investment expenditure is estimated to contain £0.25 of import expenditure. This compares to £0.13 of import expenditure for every £1 of public consumption expenditure.
3 Investment pre-recession constituted around 16 per cent of GDP. While it has recovered from a 12 per cent share at the trough of the recession, it still constitutes only 14 per cent of output in 2015.
4 See for instance, Reference Wren-Lewis and DriverWren-Lewis and Driver (1998), Reference Pain and van WelsumPain and Welsum (2004), Reference Pain, Mourougane, Sédillot and Le FoulerPain et al. (2005) and Reference ForbesForbes (2014).
5 The impact on the real economy from a currency depreciation depends on the shock driving the currency move, for example, a risk premium, interest rate or productivity shock, but for the purposes of this exercise we use a change in the relative risk premium on sterling. See Reference Kirby and MeaningKirby and Meaning (2014) for a discussion of this issue.
6 The shock has been introduced as an endogenous residual on the UIP condition so that feedback effects from general equilibrium dynamics can still affect the exchange rate.
8 The Marshall-Lerner condition holds when an exchange rate depreciation reduces the external deficit, because the sum of import and export price elasticities (in absolute terms) is greater than one.
The moderation in the rate of expansion of government consumption expenditure becomes more apparent once we take into account the dynamics of the government consumption deflator. Government spending plans are set out in nominal terms. Since around two thirds of government expenditure is measured on an output only basis (Reference PopePope, 2013) – for example, number of pupils in schools – cuts in the nominal value of government expenditure materialise in the deflator, rather than in the volume measure of government consumption. As can be seen from figure 14, the government consumption deflator has been consistently below the GDP deflator since 2011 and we project it will remain so in the near future. This reflects a view that various measures to cut the deficit, such as caps on public sector wage growth, will not be fully reflected in the volume measure of government consumption and will emerge in the deflator.
General government and broad economy inflation rates

Net exports have deducted, on average, 0.6 percentage point from GDP growth between 2012–15, and have continued to do so during the first half of 2016, with a negligible contribution in the first quarter of 2016 and a deduction of 0.8 percentage point in the second quarter. Data from the ONS August Trade release shows that the deterioration of the trade balance in the three months to August 2016 is due to a worsening of the deficit in goods trade with non-EU countries, which explains £2.5 billion out of the £3.6 billion increase in the trade balance deficit. The weakness of the external sector is closely related to the anaemic growth of our largest trading partners, the EU. After eight years, the volume of goods exports to the EU is just below its pre-recession level in May 2016, figure A3.
Gains in price competitiveness derived from the recent sharp and sustained depreciation of sterling combined with a decline in demand for imports, due both to weak private consumption growth and higher import prices, will translate into an improvement of the trade balance. However, uncertainty derived from the recent UK referendum and general weakness in EU growth prospects are likely to weigh on demand from EU countries, dragging on the capacity to expand export volumes. As a result, we forecast imports to be the main channel through which sterling will operate to improve the trade balance. We expect net trade to make positive contributions to GDP growth during the second half of 2016 and continue to do so throughout the period between 2017 and 2020. Box C in this chapter provides further discussion of the effect of sterling devaluation on the UK economy. We forecast net trade to subtract 0.1 percentage point from growth this year before adding 1.7 percentage points next year.
Household sector
Real personal disposable income (real income henceforth) grew by 3.4 per cent in 2015. We have revised our forecast for real income growth downwards by 1.2 and 0.6 percentage points this year and next, to 2.8 and 0.2 per cent, respectively. Our revision is due to weaker than expected data outturns during the first half of the year and a faster rate of erosion of nominal incomes as consumer price inflation picks up following the recent devaluation of sterling. Nonetheless, we expect real income gradually to return to growth rates of around 2½ per cent from 2018 onwards, as meaningful productivity growth materialises and the pass-through of the negative terms of trade shock to consumer prices is completed. Our forecast for real income growth, when combined with our population projections, implies real income per capita growth of around 2 per cent between 2019 and 2022.
According to our preferred measure of house prices, the UK house price index published by the ONS and the Land Registry, house prices increased, on average, by an annual rate of 8.6 per cent in the three months to August 2016, compared to 8.3 and 7.5 in the three months to May and February 2016, respectively. This pattern of acceleration in the rate of inflation of house prices is in contrast to information from leading indicators such as the Halifax and Nationwide house price indices which suggest that house price growth has recently been subdued. According to Halifax, house prices increased, on average, by an annual rate of 5.7 per cent in the three months to September 2016 compared to 8.5 and 9.9 per cent in the three months to June and March 2016, respectively. The figures reported by Nationwide are 5.4 per cent in the three months to September 2016 compared to 4.9 and 5.0 per cent in the three months to June and March 2016, respectively.
Although historically the three measures of house prices have generated a similar picture of house price growth, in the past two years, a gap between the Halifax and Nationwide indices had appeared. This gap has recently disappeared, but a discrepancy between the UK house price index and those from Halifax and Nationwide has emerged, see figure 15. A crucial feature of the UK house price index that could explain the gap is that the index draws from mortgage and cash related transactions, while the Halifax and Nationwide indices only use mortgage related data. Nevertheless, given that the new UK house price index has been published for less than half a year it may still be too early to draw conclusions.
UK house price indices (annual growth rates)

Given the substantial increase in house prices during the first half of this year, we expect house price growth of 7.6 per cent in 2016. In contrast, we forecast house price inflation to be subdued in 2017, with prices growing at 1.6 per cent as real income growth moderates. Key to our view is a softening in housing demand. Nevertheless, this is a more optimistic forecast than the one we had pencilled in three months ago. Underpinning our forecast is a revision of the future path of Bank Rate. Compared to our August Review, we have pushed back the first increase in Bank Rate by one year, to mid-2019. Thus, income gearing –the share of income devoted to interest rate payments – is forecast to remain at historically low levels (figure A5), which should support demand for housing.
After a surge in activity in March 2016, partly driven by the April 2016 increase in Stamp Duty tax for buy-to-let properties and second homes, data on the volume of residential property transactions from HM Revenue and Customs show activity is still below the levels observed in the year up to February 2016. Data from the August 2016 Bank of England's Money and Credit Report portray a similar picture; mortgage approvals for house purchasing have experienced a sustained decline since the two-year peak of 73 thousand reached in January 2016. In August 2016, mortgage approvals had declined to 60 thousand, a level well below the peak of activity registered before the Great Recession.
Private consumption expenditure was the main engine of growth in the second quarter of 2016 contributing 1.9 out of 2.1 percentage points to the annual growth rate of output. Data from the September 2016 Retail Sales release, which provides a timely indicator and comprises around one third of total private expenditure, suggest that the rate of expansion of private expenditure will slow down in the upcoming quarter. Although retail sales volumes grew by 1.8 per cent in the three months to September 2016, the figure hides a very unequal monthly profile; retail sales growth, on a monthly basis, was very strong in July and August but flat in September. We maintain a view of a softening in private consumption expenditure growth over the next year, partly explained by the erosion of real incomes driven by the inflationary impact of sterling devaluation and negative wealth effects coming from a slowdown in house price inflation. We also expect an increase in precautionary savings derived from heightened economic uncertainty. Indicative of such an increase in precautionary savings is data from the Consumer Trends release, which show expenditure in durable goods has slowed down markedly in the second quarter of 2016, with growth of 0.4 per cent, relative to the previous quarter. This compares with an average quarterly growth rate of 2.3 per cent in 2015. Overall, we expect consumer spending to grow by 2.8 per cent this year and to slow down to 0.6 per cent in 2017.
Robust growth in real consumer spending in the first half of this year coupled with the slowdown in real income growth has brought us to revise our forecast for the saving ratio for 2016 to 5.2 per cent, down from our forecast in the August Review of 6.5 per cent. We expect the saving ratio to bottom out in 2017 at 5 per cent and to increase from then onwards, as real income growth outpaces consumption expenditure growth. Thus, our forecast suggests that the debt to income ratio will increase slightly, by 1½ percentage points, to 141½ per cent by 2017 before starting gradually to decline.
Supply conditions
The ONS has revised the methodology it uses to estimate gross fixed capital formation (GFCF) following the identification of some double counting relating to elements of purchased software from 1997 onwards. When this issue is amended in ONS Blue Book 2017 it will reduce the estimated level of GFCF by around 1.1 per cent per year, but leave the quarter-on-quarter GFCF growth profile broadly unchanged. Business investment volumes increased by 1 per cent in the second quarter of 2016, compared to the previous quarter, but were 0.8 per cent lower than the same quarter in 2015.
Output per hour worked

Heightened uncertainty in the run-up to the referendum on the UK's membership of the EU will have led many firms to delay investment decisions (see Box A). Our uncertainty index fell in the third quarter of 2016, after the result of the referendum became known, but remains above its long-run average. Sterling 3-month option implied volatility and FTSE 100 volatility have been trending upwards since the start of October, indicating that uncertainty in financial markets has picked up again in the fourth quarter. We expect uncertainty to remain elevated over the course of the next yearr and to start to dissipate as the outcome of negotiations relating to the UK's exit from the EU become known.
The Bank of England's Credit Conditions Survey indicates that credit conditions remain benign, with overall availability of credit to the corporate sector unchanged for the tenth consecutive quarter in the third quarter of 2016.
In light of the data outturns for the second quarter, and the reduction in uncertainty, we have revised our forecast for business investment upwards in the near term. Additionally, a revision of our path for interest rates is supportive of investment. We have pushed back the first Bank Rate increase by one year and project Bank Rate to be just below ½ per cent in 2019, which is ½ percentage point below what we had pencilled in three months ago. We expect business investment to fall by 1½ per cent in 2016 (previously 3.8 per cent) and a further contraction of around 3½ per cent in 2017 (previously 5 per cent). We forecast a return to growth of around 4 per cent in 2018.
Similarly, the decline in uncertainty and changing assumptions regarding the path for interest rates have led us to revise our forecast for housing investment upwards. We now expect housing investment to increase by 4.6 per cent in 2016 (previously 4.0 per cent) before contracting by around 1 per cent in 2017 (previously a contraction of 3 per cent). We expect robust growth of around 6 per cent in 2018.
The employment rate of 16–64 year olds was at 74.5 per cent in the three months to August 2016. This is the joint highest rate since comparable records began in 1971. The unemployment rate remained unchanged from the previous three-month period at 4.9 per cent, as both the number of unemployed persons and the number of employed persons increased. Labour Force Survey data show a net flow from unemployment to employment of 161 thousand persons, a net flow from inactivity to unemployment of 107 thousand persons and no net flow between employment and inactivity. Positive net flows from inactivity to unemployment are indicative of increasing optimism about labour market outcomes.
Currently there is uncertainty about what leaving the EU will mean for migration levels. The latest figures from the ONS show that net migration to the UK was 327 thousand, of which 180 thousand migrants came from the EU. The government has set a target for reducing total net migration to the tens of thousands. Although this target does not seem likely to be met in the near future, it is possible that leaving the EU will result in a reduction in net migration and thus the size of the labour force.
In previous Reviews we have stated that positive employment outcomes have come at the expense of labour productivity growth. However, output per hour has shown tentative signs of a return to significant growth in the first half of 2016. Whole economy output per hour increased by 0.6 per cent, quarter-on-quarter in the three months to June 2016, following growth of 0.5 per cent in the previous three-month period (figure 15).
The fiscal implications of recent monetary policy developments
Changes in monetary policy have implications for the funding costs faced by all economic agents, including the sovereign. We utilise the framework of Reference Kirby and MeaningKirby and Meaning (2015) to examine the fiscal implications from elements of monetary policy changes announced in August 2016: a 25 basis point reduction in Bank Rate to 0.25 per cent and, over a six month period, the purchase of £60 billion of gilts, expanding the stock of government bonds held by the Asset Purchase Facility (APF) to £435 billion.Footnote 1
As in Reference Kirby and MeaningKirby and Meaning (2015), we narrow our focus to the impact on the sovereign's long-term borrowing costs and the effect via the treatment of the net interest payments from consolidated public sector accounts. That is, we ignore the second round impacts that stem from the effect of QE on the broader economy.Footnote 2
First, the cut in Bank Rate and the announcement of the expansion of the asset purchase programme looks to have reduced yields on longer-term sovereign bonds by around 20 basis points. Reference Lloyd and MeaningLloyd and Meaning (2016) show that this has occurred predominantly through a reduction in the premia associated with these yields rather than a reduction in the expectations of the future path of short-term interest rates. This increases the market value of gilts relative to their nominal, or par, value and means that to raise a given quantity of cash, the Debt Management Office (DMO) needs to issue less nominal debt. Based on the DMO's latest projections of the UK government's future financing requirements, we calculate that the recent monetary policy measures will have lowered the nominal value of debt that has to be issued by around £7½ billion, or 1.77 per cent, over the next five years. As well as lowering the nominal debt stock in this way the government will also save the cost of the coupons that would have been due on the now unissued securities. Assuming that the average coupon rate on the unissued debt would have been equal to the average on debt issued since 2015, this would save the exchequer a further £400 million between now and 2020–21.
The design of the APF also means that it has wider fiscal implications than the channels outlined above, which could be said to be true of more standard monetary policy conducted purely through the manipulation of short-term interest rates. Following a change in policy in November 2012, the APF returns coupon payments to the Treasury, lowering the overall net interest payments of the public sector (ONS, 2012). Since then, almost £67 billion has been returned to the Treasury. The recent policy changes regarding the APF will have three major effects on the size of the payments between the APF and the Treasury:
1 They generate a new income for the APF by expanding the quantity of assets it holds which pay it a return;
2 They generate a new cost by increasing the size of the loan the APF requires from the Bank of England to fund its purchases of assets from the private sector;
3 They reduce the financing cost of the existing purchases.
Redistribution of gilt coupon payments received by the Asset Purchase Facility

Taking each in turn, the purchase of an additional £60 billion of gilts will yield only a modest increase in the flow of coupons from the APF to Treasury coffers. This is determined not just through the magnitude of the increase in gilts, but also through the fact that the APF is paying above par for bonds. Note the £60 billion of purchases is for bonds at market not nominal prices. Since 4 August bonds have been purchased for an average price of around 29 per cent above their nominal value. The average coupon rate, weighted by the quantity of nominal bonds, is 3.2 per cent. If we assume this wedge persists over the next six months then the £60 billion of purchases will equate to just over £46 billion in nominal terms, while if we assume the average coupon rate does not change then this implies the APF will accumulate £1,487 million of coupons annually from these additional purchases.
However, to finance purchases the Bank of England provided a loan to the APF, financed by the creation of central bank reserves, for which the APF is charged Bank Rate (Reference McLaren and SmithMcLaren and Smith, 2013). With Bank Rate now at 0.25 per cent, the APF will pay £150 million annually for the additional £60 billion, giving additional net payments to the Treasury of £1,337 million per annum.
Finally, the cut in Bank Rate lowers the financing rate on the pre-existing £375 billion loan owed by the APF from ½ per cent to ¼ per cent. At Bank Rate of 0.5 per cent the APF was paying £1,865 million in interest to the Bank of England each year.Footnote 3 This has now reduced to approximately £938 million per year, further lowering the financing needs of the Treasury by just under £1 billion per annum.
Taken together, our analysis suggests that the policy measures announced by the MPC in August are likely, all else equal, to have increased the net transfers between the APF and HM Treasury by around £2 billion per annum.
Impact of August 2016 monetary policy package on the public finances

Notes
1 The MPC also announced a £10 billion programme of corporate bond purchases and a £100 billion Term Funding Scheme to provide funding to banks and building societies. Both these schemes are operated as part of the APF, whose overall ceiling authorised by the Chancellor of the Exchequer is now £545 billion.
1 See Reference Haldane, Roberts-Sklar, Wieladek and YoungHaldane et al. (2016) for discussion of the myriad transmission mechanisms of QE.
1 The loan liability the APF is paying interest on is not precisely £375 billion at all times.
According to this measure, labour productivity is exactly equal to its previous peak just after the onset of the financial crisis. Productivity in services, which constitute a large proportion of the economy, largely mirrors trends in whole economy productivity. Production has fared much worse since the recession in terms of hourly productivity which declined rapidly throughout 2012 and much of 2013. Output per hour then remained fairly flat until 2016 when it grew by 0.7 per cent in the first quarter and 2.5 per cent in the second. This follows an increase of 0.6 per cent in the previous three-month period. Our forecast is conditioned on a return to meaningful productivity growth. The absence of such growth presents a downside risk to our forecast.
Public finances
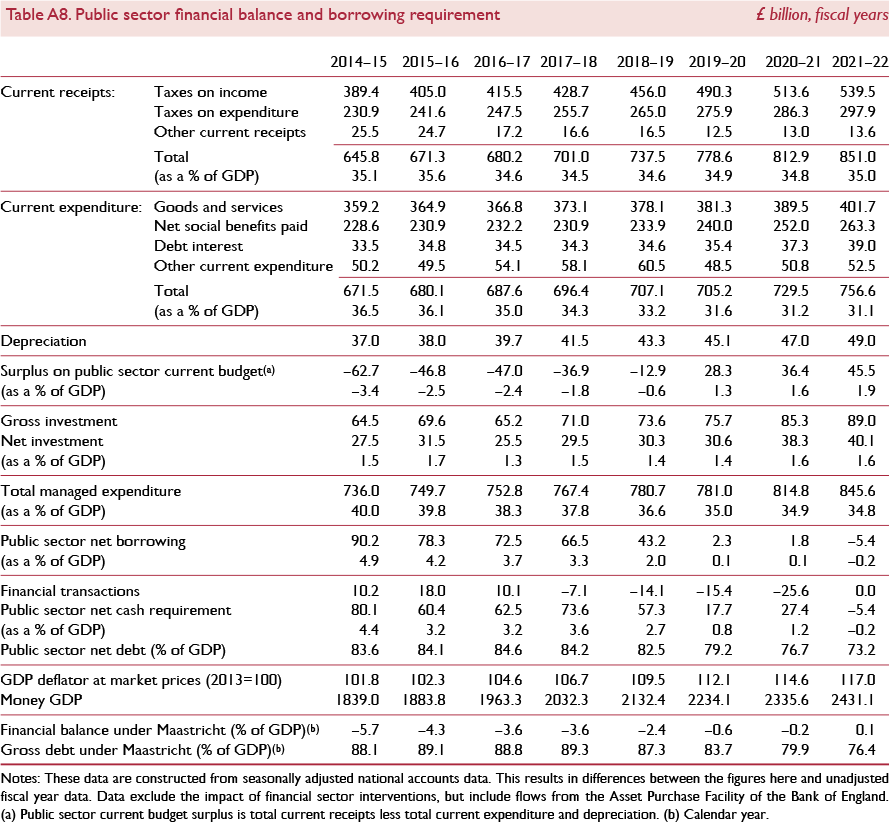
Our forecast for the public finances is broadly unchanged from that published three months ago. Even as the economy slows, we expect the magnitude of public sector net borrowing to shrink. Announced discretionary fiscal policy changes are included for the forecast period presented in table A8. Over the next five years this equates to a fiscal consolidation of just under 6 per cent of GDP. Our current assumption is that, upon exit, the UK government will no longer make a net contribution to the EU budget. This is an assumption we introduced into our August 2016 forecast which impacts on the period from the second quarter of 2019 onwards. Figure 17 shows the importance of this assumption for returning the public finances to a surplus. In the absence of the removal of net EU contributions and on the basis for the outlook for the magnitude and composition of nominal demand, we would expect the public sector to be a net borrower into 2020–21.
Public sector net borrowing
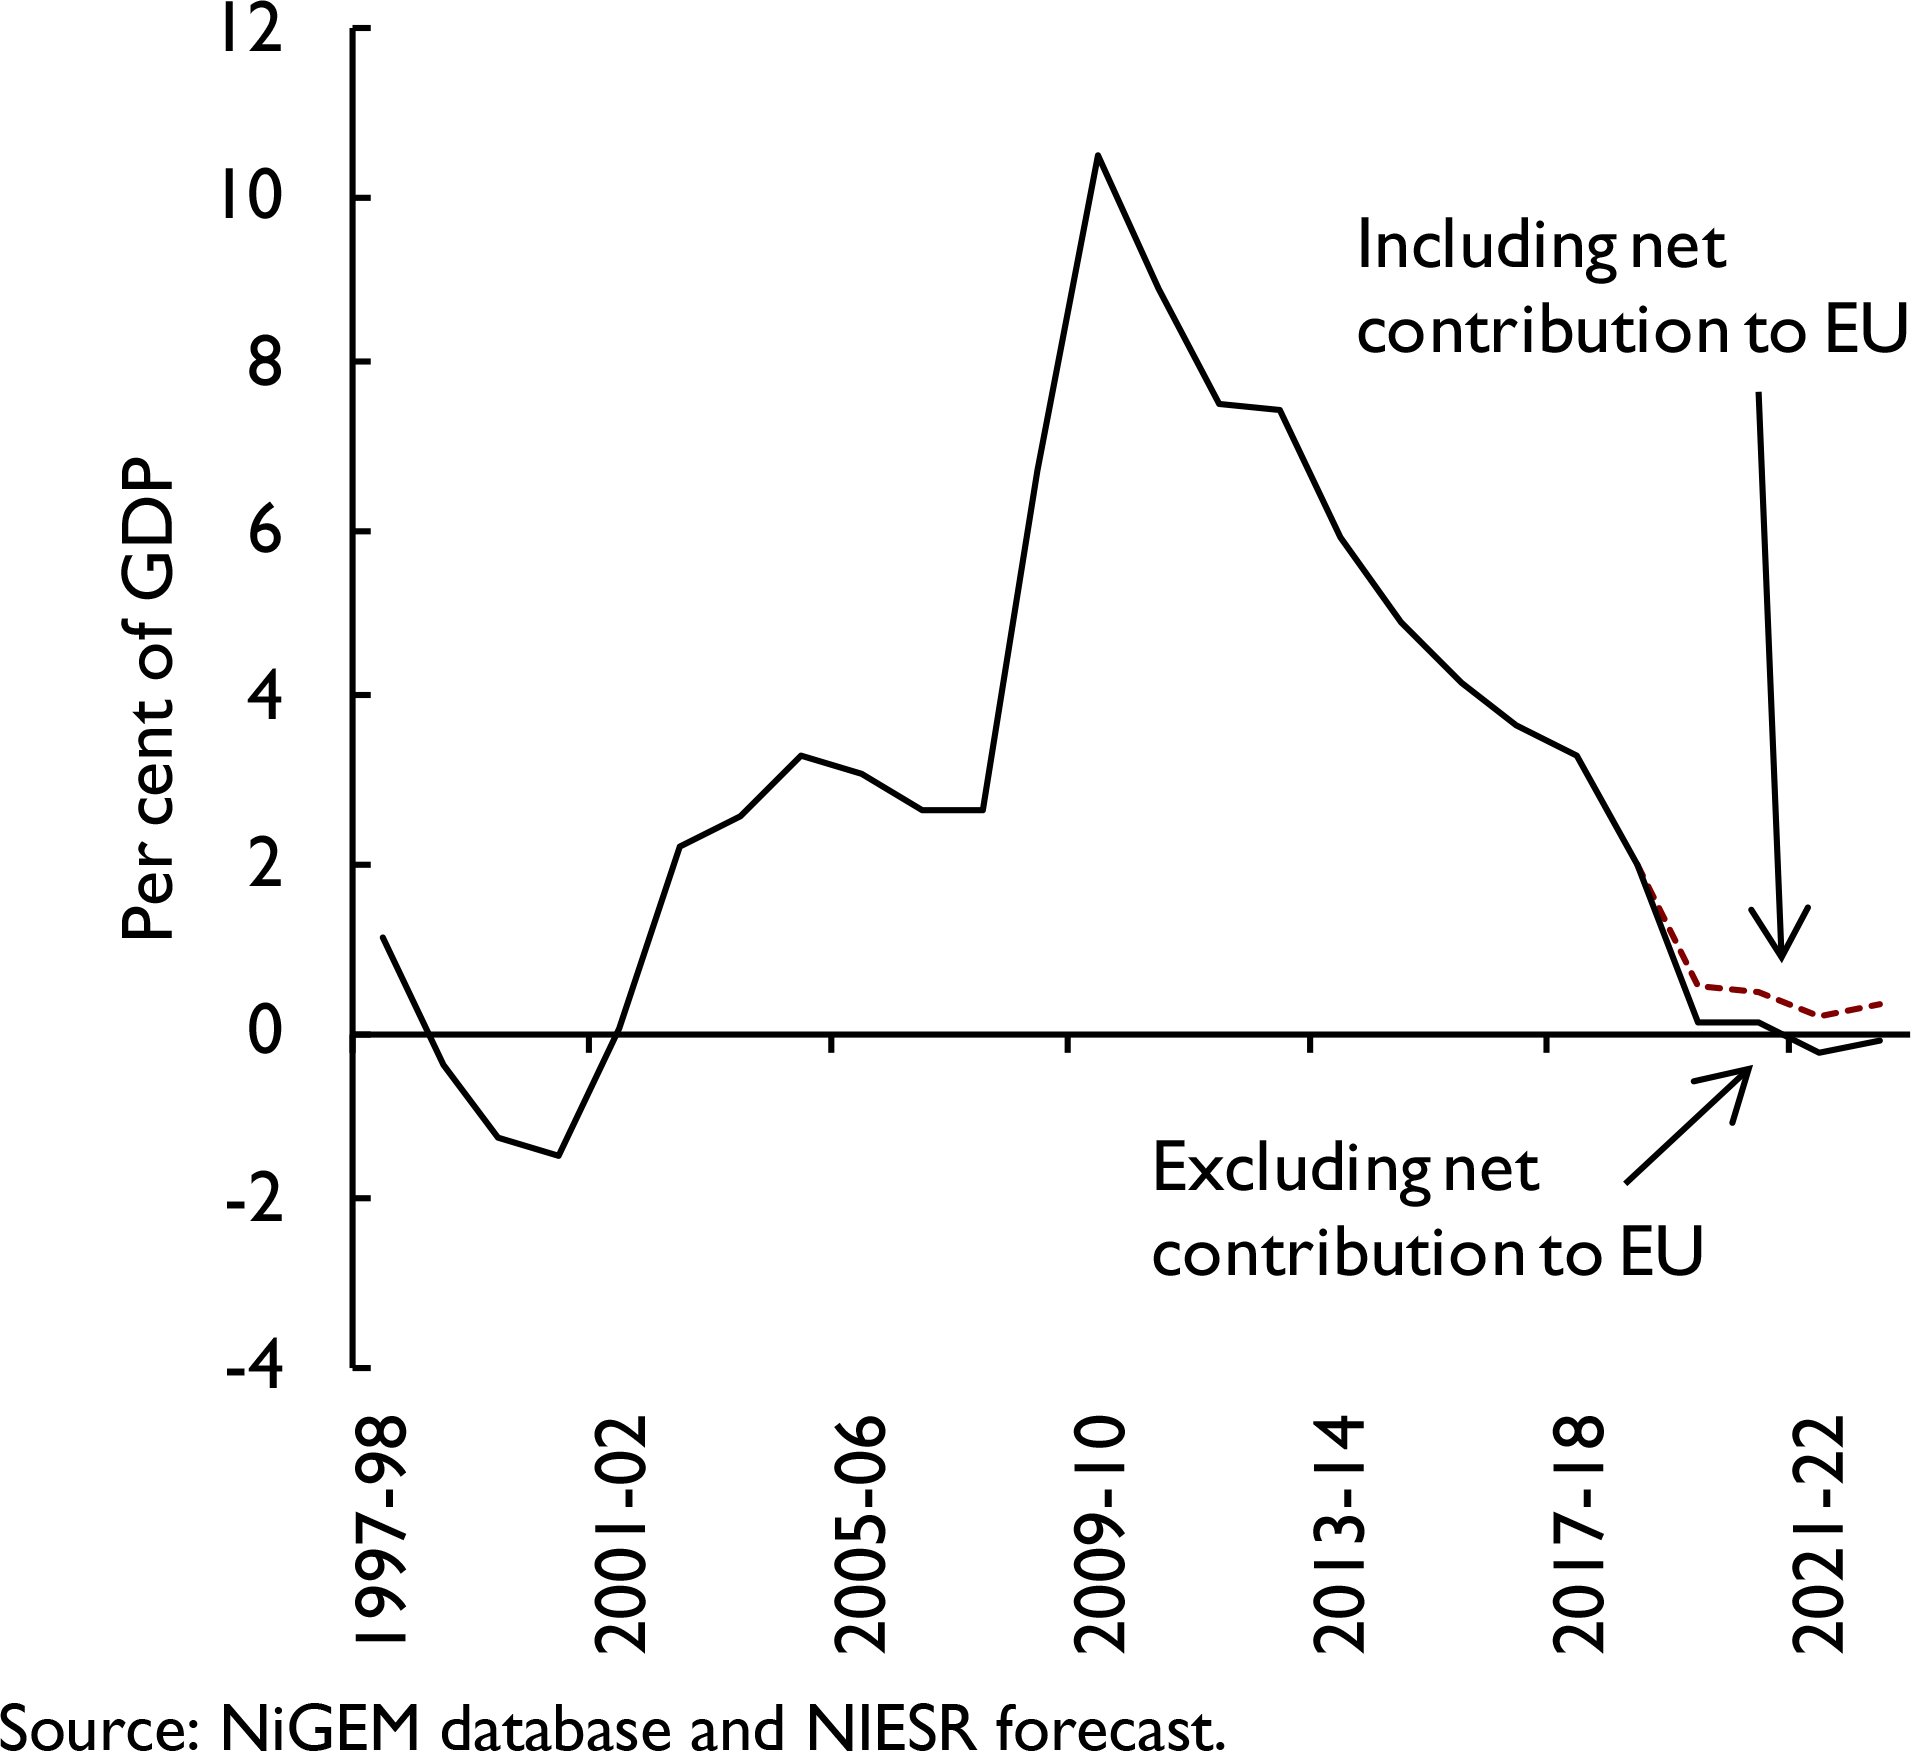
Even with this assumption about the EU budget contribution, we would not expect an absolute surplus to be achieved by 2019–20, as mandated by the current fiscal framework. However, it is only a marginal miss with borrowing at just 0.1 per cent of GDP. A modest amount of discretionary fiscal tightening would be enough to ensure the forecast, at least, remained on track. However, we do not think this is the appropriate time for more fiscal consolidation in the near and short term. Rather the Chancellor should allow the automatic stabilisers to function unhindered, and instead introduce a new fiscal framework, as discussed in the Commentary of this Review.
As we noted in our August Review, we expect borrowing to increase substantially over the next five years. In August this figure was around £60 billion, cumulative, which is then partially offset by the approximately £20 billion cumulative saving on the net contribution to the EU over the years 2019–20 and 2020–21. The cumulative borrowing figures presented here are of a similar order of magnitude. They would, however, be even larger but for the recent policy stimulus introduced by the Bank of England. The direct effects (ignoring the second round effects from increasing nominal GDP) are substantial, as Box D highlights. For the period 2016–17 to 2020–21 this sums to just under £19 billion, assuming Bank Rate follows the profile presented in table A1.
Gross general government debt is expected to peak next year, at around 89 per cent of GDP, even though it is only in 2020–21 when we expect to achieve a surplus. With borrowing needs as a per cent of GDP below nominal GDP growth over the course of the forecast, debt dynamics are such that in the four years after its peak, the debt to GDP ratio has improved by around 10 per cent of GDP.
Public sector net debt has a similar pattern. However, the introduction of more asset purchases by the Bank of England has implications for this series. The difference between the price the APF paid for gilts and their nominal value are treated as an increase in public sector net debt. The Bank of England has an indemnity from the Treasury for its asset purchases. Indeed the very act of returning gilt coupons collected by the APF to the Treasury means that liability stemming from the APF's gilt holdings will materialise as increased borrowing in the future. If this is when gilts are actively sold by the Bank, then the precise permanent increase in debt is unknown, given the uncertainty over the price they will receive for the sale of the bonds. If they hold the gilts to maturity, as we currently assume, then the precise permanent increase in debt is already known and included in the public sector net debt figures. It will feature in the gross government debt figures only when gilts are issued to meet the shortfall covered by the indemnity.
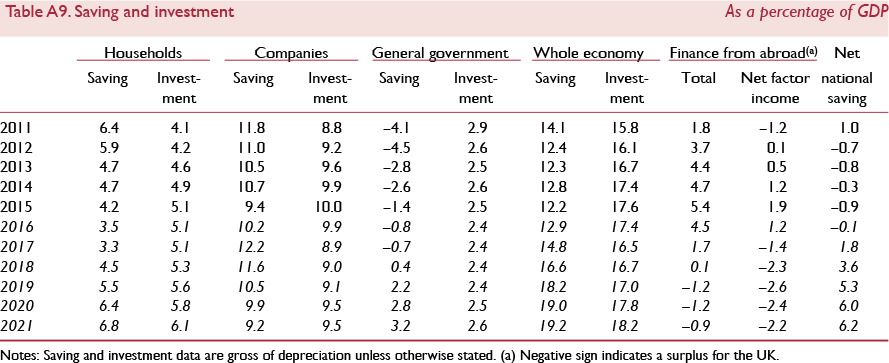
Saving and investment
Since the end of 2009, the United Kingdom's current account deficit has been widening, reaching a record high of 7 per cent in the final quarter of 2015. Since then it has narrowed slightly, but remains historically large. In the second quarter of 2016, the UK required 5.9 per cent of GDP in net financing from the rest of the world to implement domestic investment plans.
The main driver of the widening current account deficit has been the primary income account. Since 1955 it has run an average surplus of approximately 0.4 per cent of GDP. From the end of 2012 onwards, the balance on the primary income account switched into deficit, and reached its largest level of 3.2 per cent of GDP in the final quarter of 2015. Since then it has only marginally narrowed to 2.1 per cent of GDP in the second quarter of 2016.
In our August forecast we noted that the depreciation of sterling would have a significant effect on the balance of the primary income account and net investment position. The further 6 per cent depreciation in effective terms during the current quarter will exacerbate these effects. The revaluation has two components; first, there will be an improvement in the net international investment position (NIIP) as the value of the stock of foreign assets priced in sterling increases but the stock of liabilities in sterling remains the same; second, there will be an improvement in the current account balance through the primary income account as the return on foreign investments yields a greater sterling return.
In order to investigate the impact of the depreciation of sterling on the NIIP, we simulate a scenario using NiGEM which includes the major changes to our forecast since August. These include, changes to the path of monetary policy, the exchange rate premium and global oil price projections, as described in Box B.Footnote 5Figure 18 illustrates that changes in these key variables over the past three months causes an immediate revaluation effect that increases the NIIP by 10 per cent of GDP. A general equilibrium effect of this revaluation is that some of the improvement in the NIIP will appear on the household sector's balance sheet. This constitutes an improvement in household's net wealth and, all else equal, should increase consumption.
The effect of the sterling depreciation on the net international investment position (difference from baseline, per cent of GDP)

The results of the scenario are broadly consistent with the updates to our forecast since August. We expect the NIIP to increase to 11.3 per cent of GDP in the final quarter of this year, up from 3.9 per cent in the previous quarter. Thereafter, it declines gradually throughout our forecast period. By 2021 we forecast that it will be around 4½ per cent of GDP.
The equilibrium level of the NIIP is determined by the position of the current account as this is the flow onto stocks of assets and liabilities. When the current account is in surplus this implies a greater accumulation of assets than liabilities, and vice versa for a deficit. We can view the possible sources of these accumulations via decomposing the current account into its constituent parts: the balances on primary income, trade and secondary income. For the UK, the first two are the most important components.
We expect the currency depreciation to improve the position of the primary income account, through the revaluation process mentioned previously. Furthermore, there has also been a significant revision to this balance, emanating largely from credits, which were revised upwards significantly in the first quarter from a contraction of 8.1 per cent to broadly flat. The consequence of both of these leads us to revise our forecast for the primary income account upwards. It also brings forward the date at which it returns to surplus. We now expect the primary income account to return to surplus in the final quarter of this year, as opposed to around halfway through 2017, as in our August forecast. We predict that the combination of the upward revision to credits and the permanently lower exchange rate forecast act as a step change upwards on the primary income account and thus we expect that by 2021 it will, on average, be in surplus by around 2 per cent of GDP as opposed to 0.7 from our previous forecast.
The revaluation also has indirect effects on asset prices for the UK, most notably equities. The profits of many of the large firms listed on the UK stock index have profits which are denominated in foreign currency. As a result of the depreciation, these profits have increased in sterling terms, which in turn has led to an increase in the equity price of these firms. Since 23 June 2016, the FTSE 100 has increased by 10 per cent. As with the NIIP, the increase in equity prices may feed through to household's wealth and therefore support consumption.
The trade balance is also expected to improve as a result of the depreciation, as improved competitiveness leads to an increase in export volumes while the increase in import prices relative to domestic prices leads to a lower import volume growth as a result of substitution and income effects. However, as previously discussed, the wealth effects associated with the improvement in the NIIP and the increase in equity prices may partially offset some of the income effects. We expect the trade balance to improve from −2 per cent of GDP in 2016, until it is broadly in balance in 2020, and remains there in 2021.
Overall, given the expected paths for the primary income and trade balances, we expect a sharp improvement in the current account balance. We forecast that the deficit on the current account reduces from 4½ per cent of GDP in this year, to 1.6 per cent the next, before returning broadly to balance in 2018. From 2019 onwards we expect the current account to be in surplus. By 2021 we forecast that on average the UK will lend 0.7 per cent of GDP to the rest of the world.
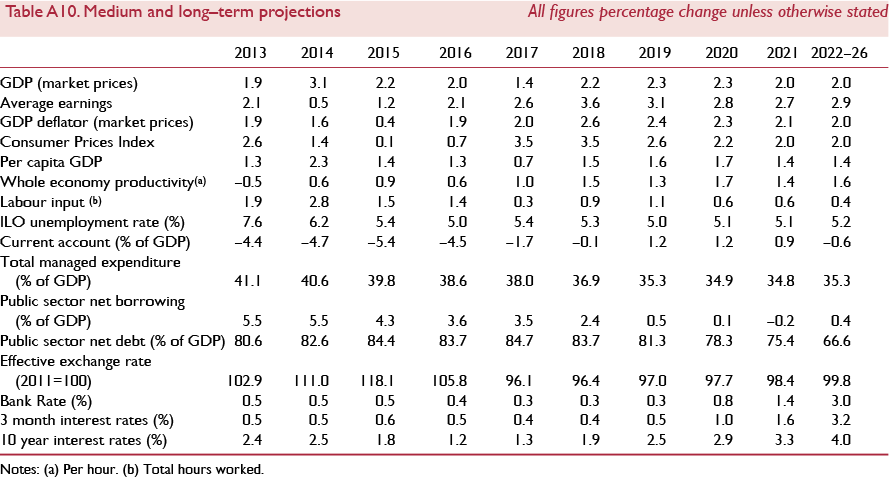
Medium-term projections
Table A10 outlines our view of the path the UK economy will take as it moves from its current disequilibrium towards its long-run equilibrium position. As with our forecast published in August, the exact nature of this long-run equilibrium is unclear and will be largely determined during the negotiation period over trade between the EU and the UK. As the exact details of the UK's negotiating position remain publicly unavailable, we have retained our assumption from our previous forecast that the UK government negotiates an EFTA-style trade agreement with Europe and that this is achieved within the allocated two-year period. However, as has been reiterated by Prime Minister May and Chancellor Hammond, the UK government will aim to negotiate a bespoke trade deal with the European Union, and therefore the equilibrium position is unlikely to match our forecasts exactly (see Reference Ebell, Hurst and WarrenEbell et al. (2016) for a comparison of the economic impact of alternative trade deals).
Furthermore, the path to this long-run equilibrium remains uncertain as shocks, which are by definition unpredictable, hit the economy and move it away from our forecast path. We chose to depict this uncertainty using fan charts; figure 4 shows that there is a 0.1 probability of average growth less than 0.3 and a probability of 0.2 for growth greater than 2 per cent in 2017.
The most significant difference between our current forecast and that published in August is the path of the exchange rate. In nominal effective terms, we expect a slightly larger depreciation this year of 10½ per cent rather than 8.6 per cent, with a further depreciation of 9.2 per cent in 2017 as opposed to 4 per cent in our August forecast. After 2018, we expect the effective exchange rate to appreciate by approximately ½ per cent per annum; however, this implies that on average from 2022 to 2026 the nominal effective exchange rate is approximately 5½ per cent lower than we had previously forecast.
We expect a slightly tighter monetary policy path throughout 2017 as we no longer forecast a further cut in bank rate. However, from 2018 onwards our monetary policy path is looser, as we now expect monetary policy to remain flatter for longer. We forecast the first interest rate rise to be in the second half of 2019, after which we expect that on average the interest rate will rise by ½ per cent per annum. Between 2022–6 we forecast that the interest rate will average approximately 3 per cent.
Both the exchange rate and interest rate paths have implications for consumer prices, which are now expected to be significantly higher throughout our forecast horizon. We forecast consumer price inflation will average 3½ per cent in 2017 and 2018, before gradually returning back towards the Bank of England's 2 per cent inflation target. We expect inflation to average 2 per cent per annum between 2022–6. However, a risk to the outlooks for both inflation and interest rates, throughout our forecast period, is the unanchoring of inflation expectations.
The fall in the exchange rate has immediate implications for the current account balance, both through the trade balance and the income account. We expect the trade balance to improve as the increase in the cost of imports leads to a contraction in import volumes in each year through to 2020. The depreciation leads to an improvement in competitiveness, which in turn leads to a moderate increase in export volumes. For further information about pass-through from the exchange rate to exports see Box C. This leads to a narrowing of the trade deficit until it reaches balance in 2020 of 0.1 per cent of GDP, after which it returns to deficit. Between 2022 and 2026 we expect the trade deficit to average around 1 per cent of GDP. Since 2013, the income side of the current account has been in deficit. We expect that as a result of the revaluation effect, investments in foreign currency yield a greater return in sterling terms and the primary income account returns to surplus in the fourth quarter of this year. We forecast the primary income balance to remain in surplus throughout our forecast horizon and to average 2.2 per cent between 2022 and 2026. The combination of the impacts on the trade and income accounts means that we expect the current account to achieve a surplus in the middle of 2018 and to peak at 1 per cent of GDP in 2019 and 2020. As the growth in import volumes recovers and the trade balance returns to deficit, the current account follows. Between 2022 and 2026 we expect the UK to require on average around 1 per cent of GDP of net financing from the rest of the world.
Our fiscal forecasts are broadly consistent with our previously published forecast; we expect public sector net borrowing to fall gradually throughout our forecast period from 3.6 per cent of GDP in 2016 and reach a broad balance by 2021. This implies, alongside the elevated inflation rate, that public sector net debt falls from 2017 onwards. We expect the public sector debt stock to average around 65 per cent of GDP between 2022 and 2026. Our fiscal forecasts are based on assumptions outlined in the Office for Budget Responsibility (OBR)'s latest Economic and Fiscal Outlook, published alongside the March Budget.
Productivity growth is a key determinant of our forecasts and without meaningful productivity growth we should not expect an increase in living standards over the long run. We expect growth of whole economy productivity to increase from 0.6 per cent in 2016 to 1½ per cent in 2018 after which it fluctuates around this level throughout our forecast period. Between 2022 and 2026 we forecast productivity growth of approximately 1½ per cent. This remains below the historical average; for example between 1972 and 2005, whole economy productivity grew on average by 2.3 per cent per annum. The overall effect on GDP is to moderate the pace of growth as the negative output gap closes. We forecast GDP growth of 1.4 per cent in 2017 as the economy transitions to its new relationship with the EU, after which we expect GDP growth to increase to 2.2 and 2.3 in 2018 and 2019 respectively, before returning towards its long-run equilibrium level of around 2 per cent between 2022 and 2026.
With elevated inflation over the next three years we also expect average earnings growth to rise, from 2.1 per cent in 2016 to 3.6 per cent by 2018. As the inflation rate falls back towards the Bank of England's target rate, growth in average earnings slows and between 2022 and 2026 we expect average earnings growth of around 3 per cent. This implies a contraction of ½ per cent in real consumer wages in 2017 followed by negligible growth in 2018, and then a moderate recovery. Between 2022 and 2026, we expect real consumer wage growth to average 0.9 per cent.
Our subdued forecasts for real wages indicate that we think that the labour market will be somewhat insulated from the expected slowdown in economic activity. We expect growth in labour input to production to decline to 0.3 per cent in 2017, followed by an increase to 0.9 and 1.1 per cent per annum in 2018 and 2019 respectively, as the economy recovers. Between 2022 and 2026, we forecast growth in labour input to average 0.4 per cent, unchanged from our forecast published in August. As a result we expect to see a slight increase in the unemployment rate to 5.4 per cent in 2017. Thereafter, it gradually declines back towards its equilibrium rate, which we estimate to be around 5 per cent, and remains there on average between 2022 and 2026.
Appendix – Forecast details
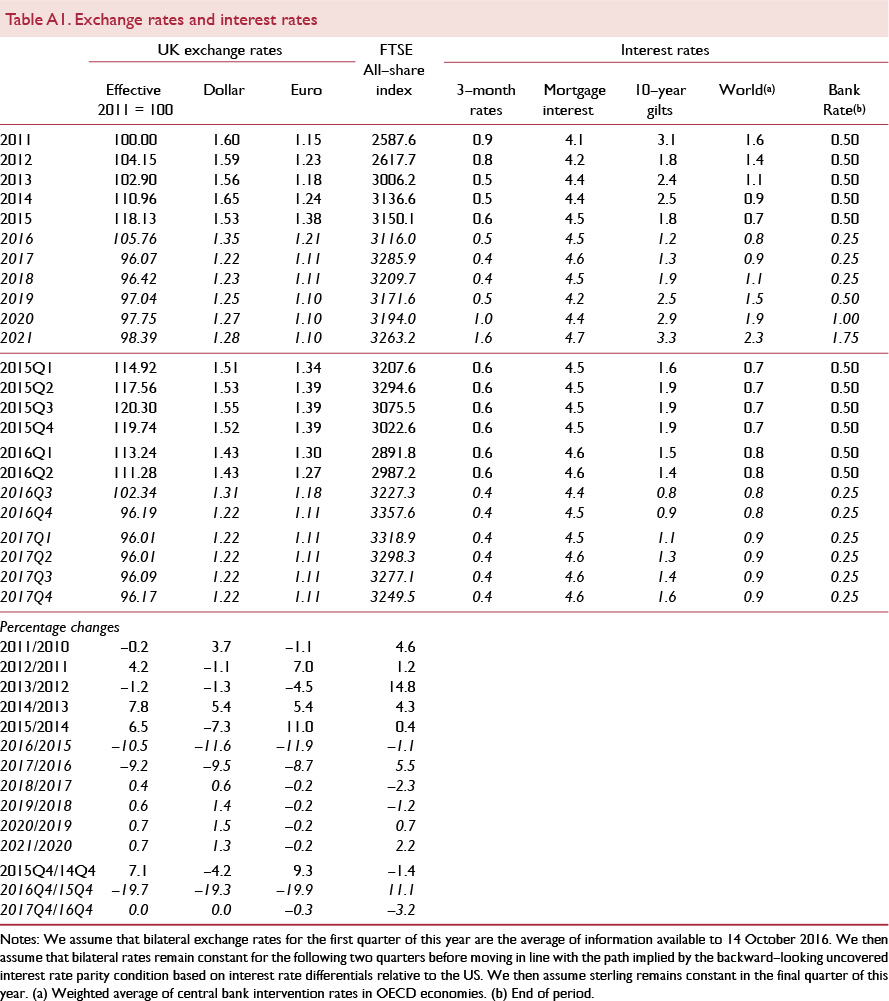
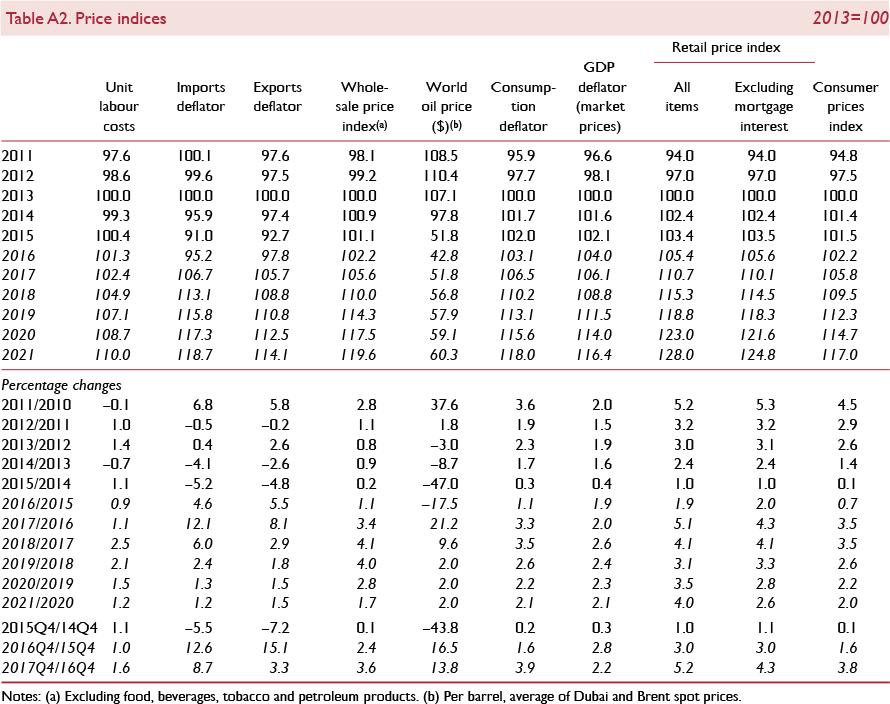
Household inflation expectations for the year ahead are stable

Private and public sector nominal wage growth
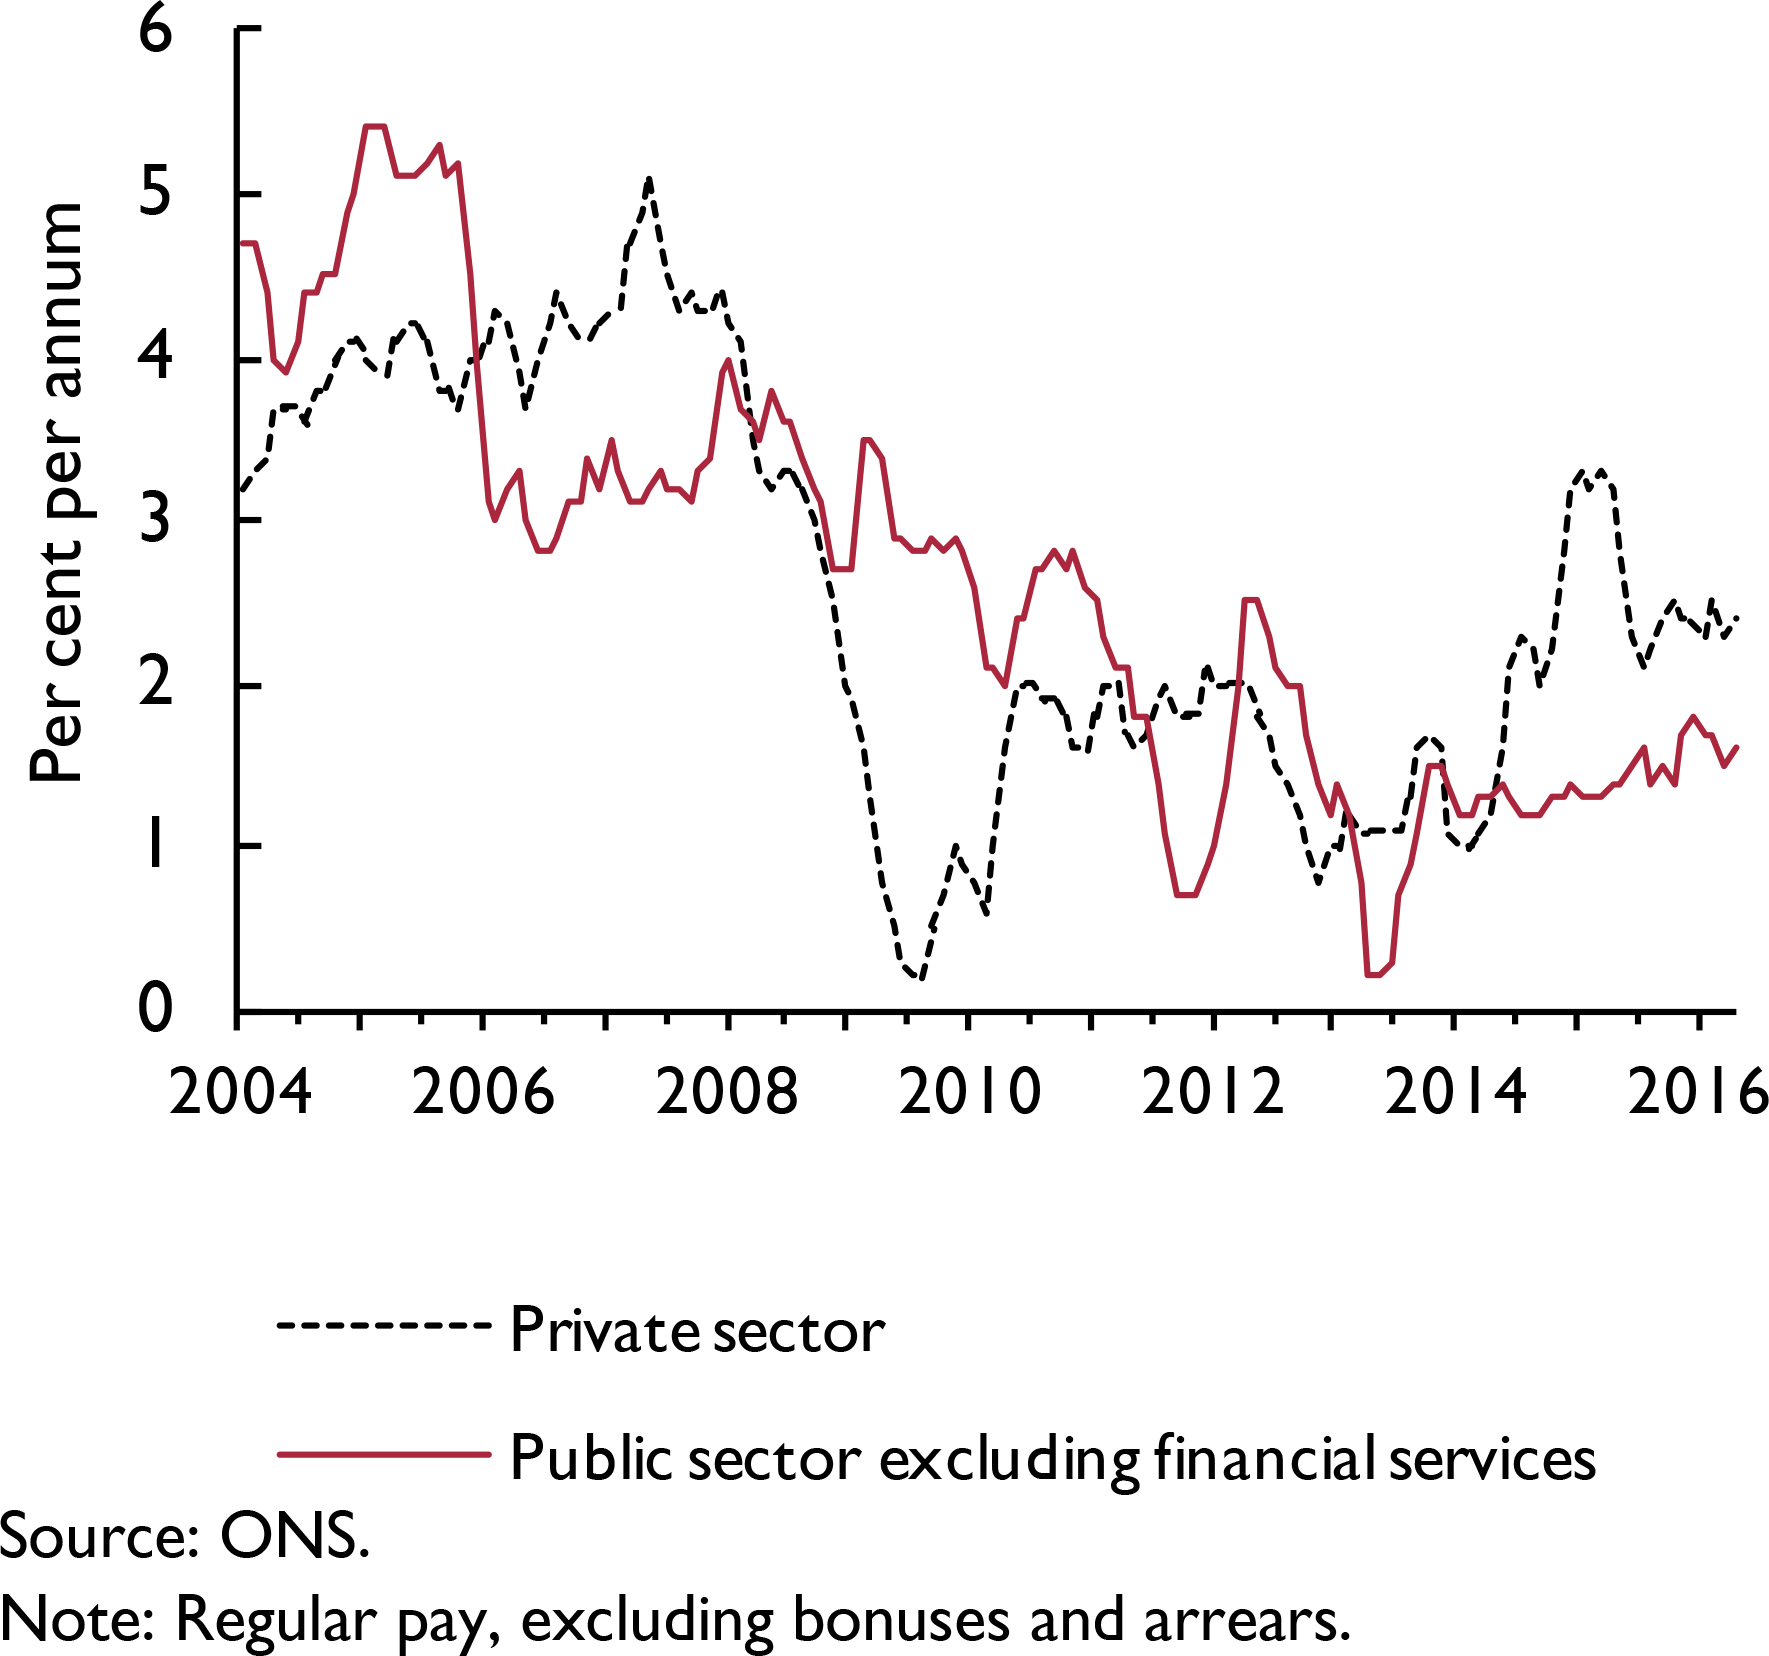
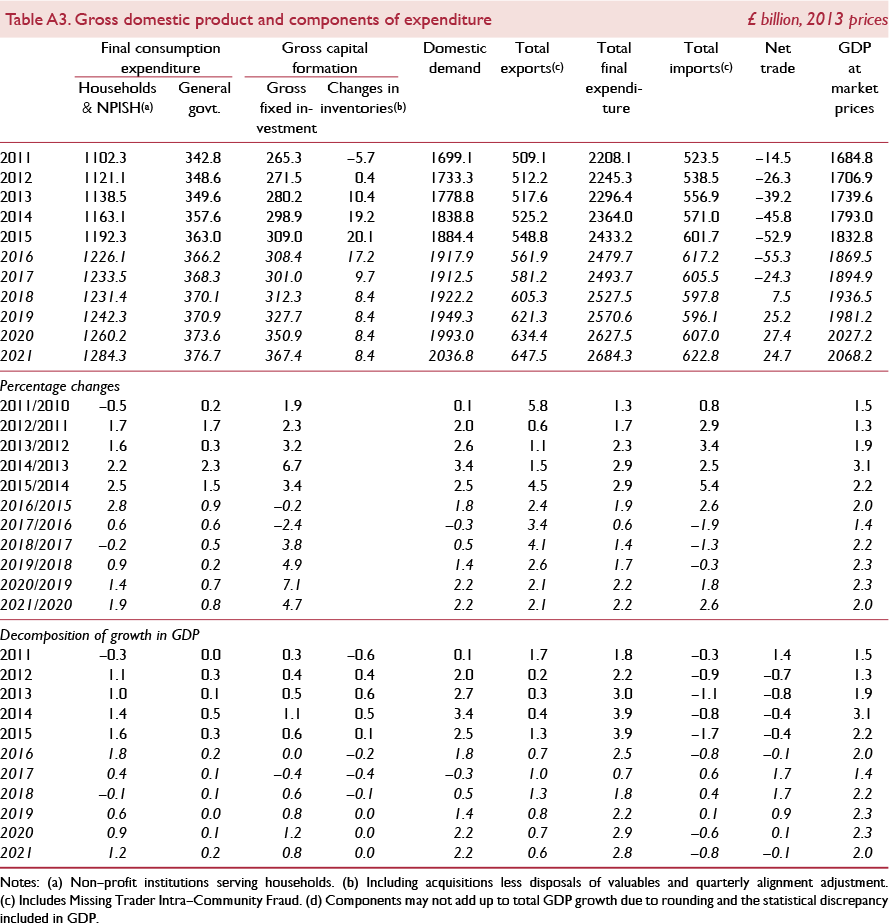
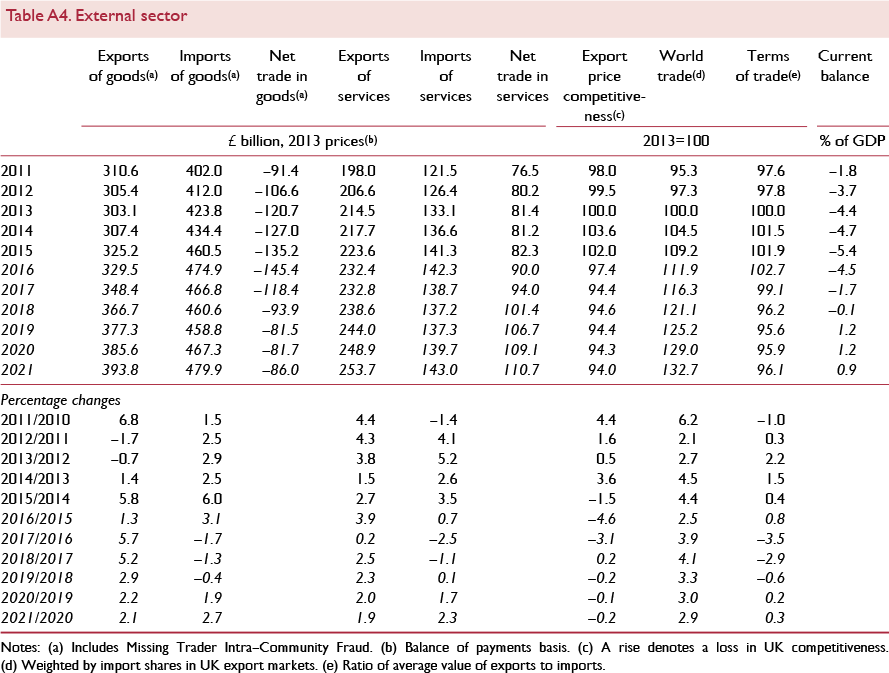
Goods exports volumes to the EU are close to levels last seen in 2007

Per capita consumer spending is expected to reach its pre–recession peak in 2021 (2007Q4=100)
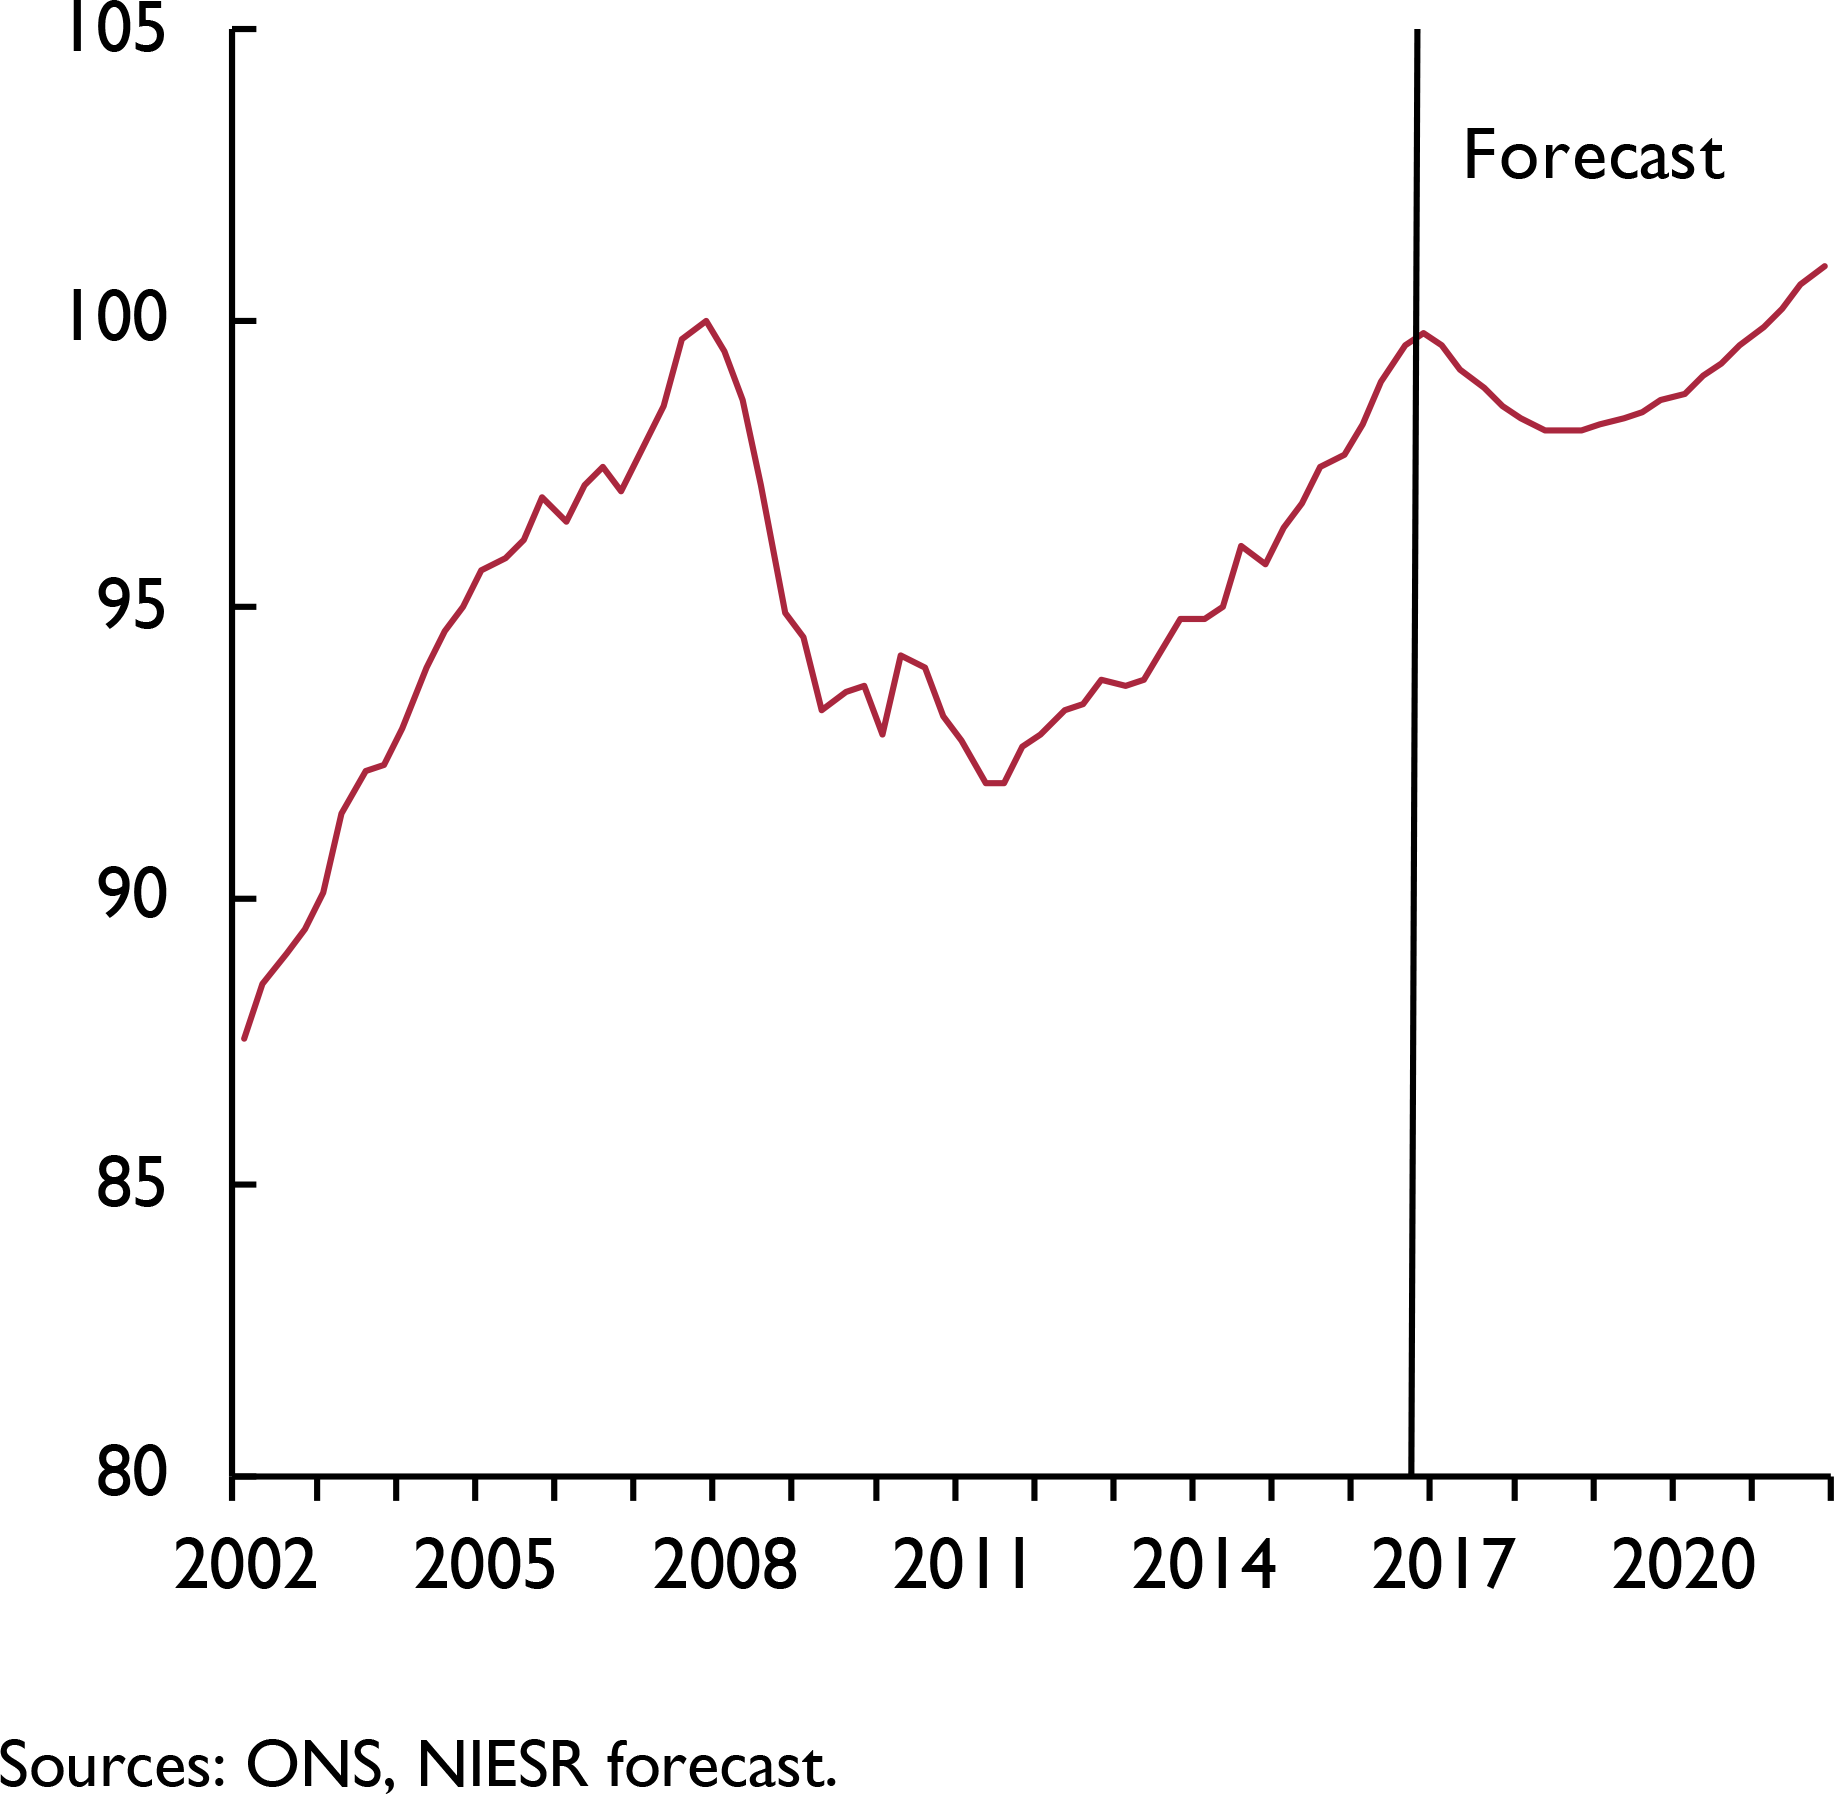
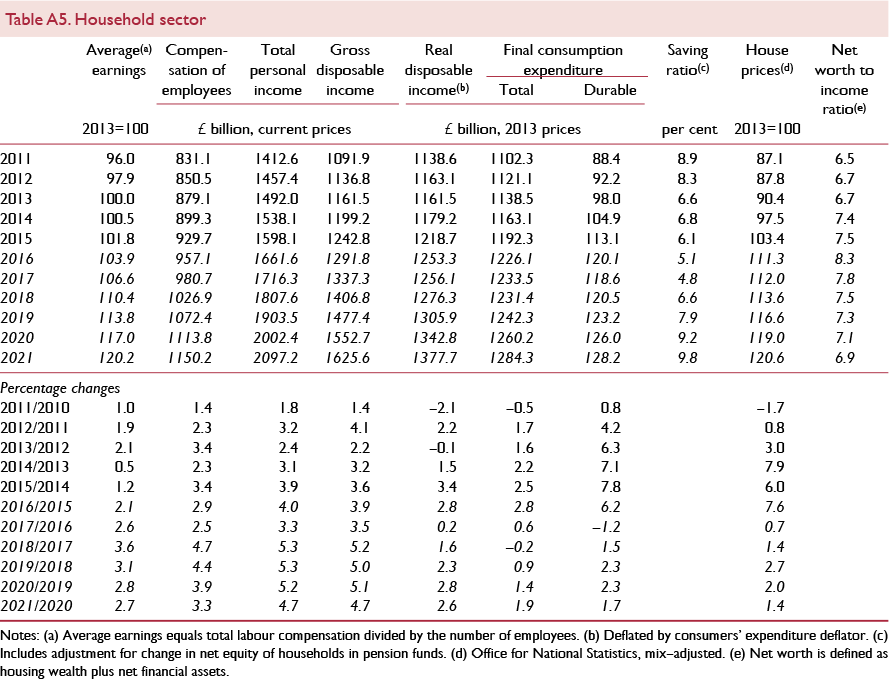
Household income gearing
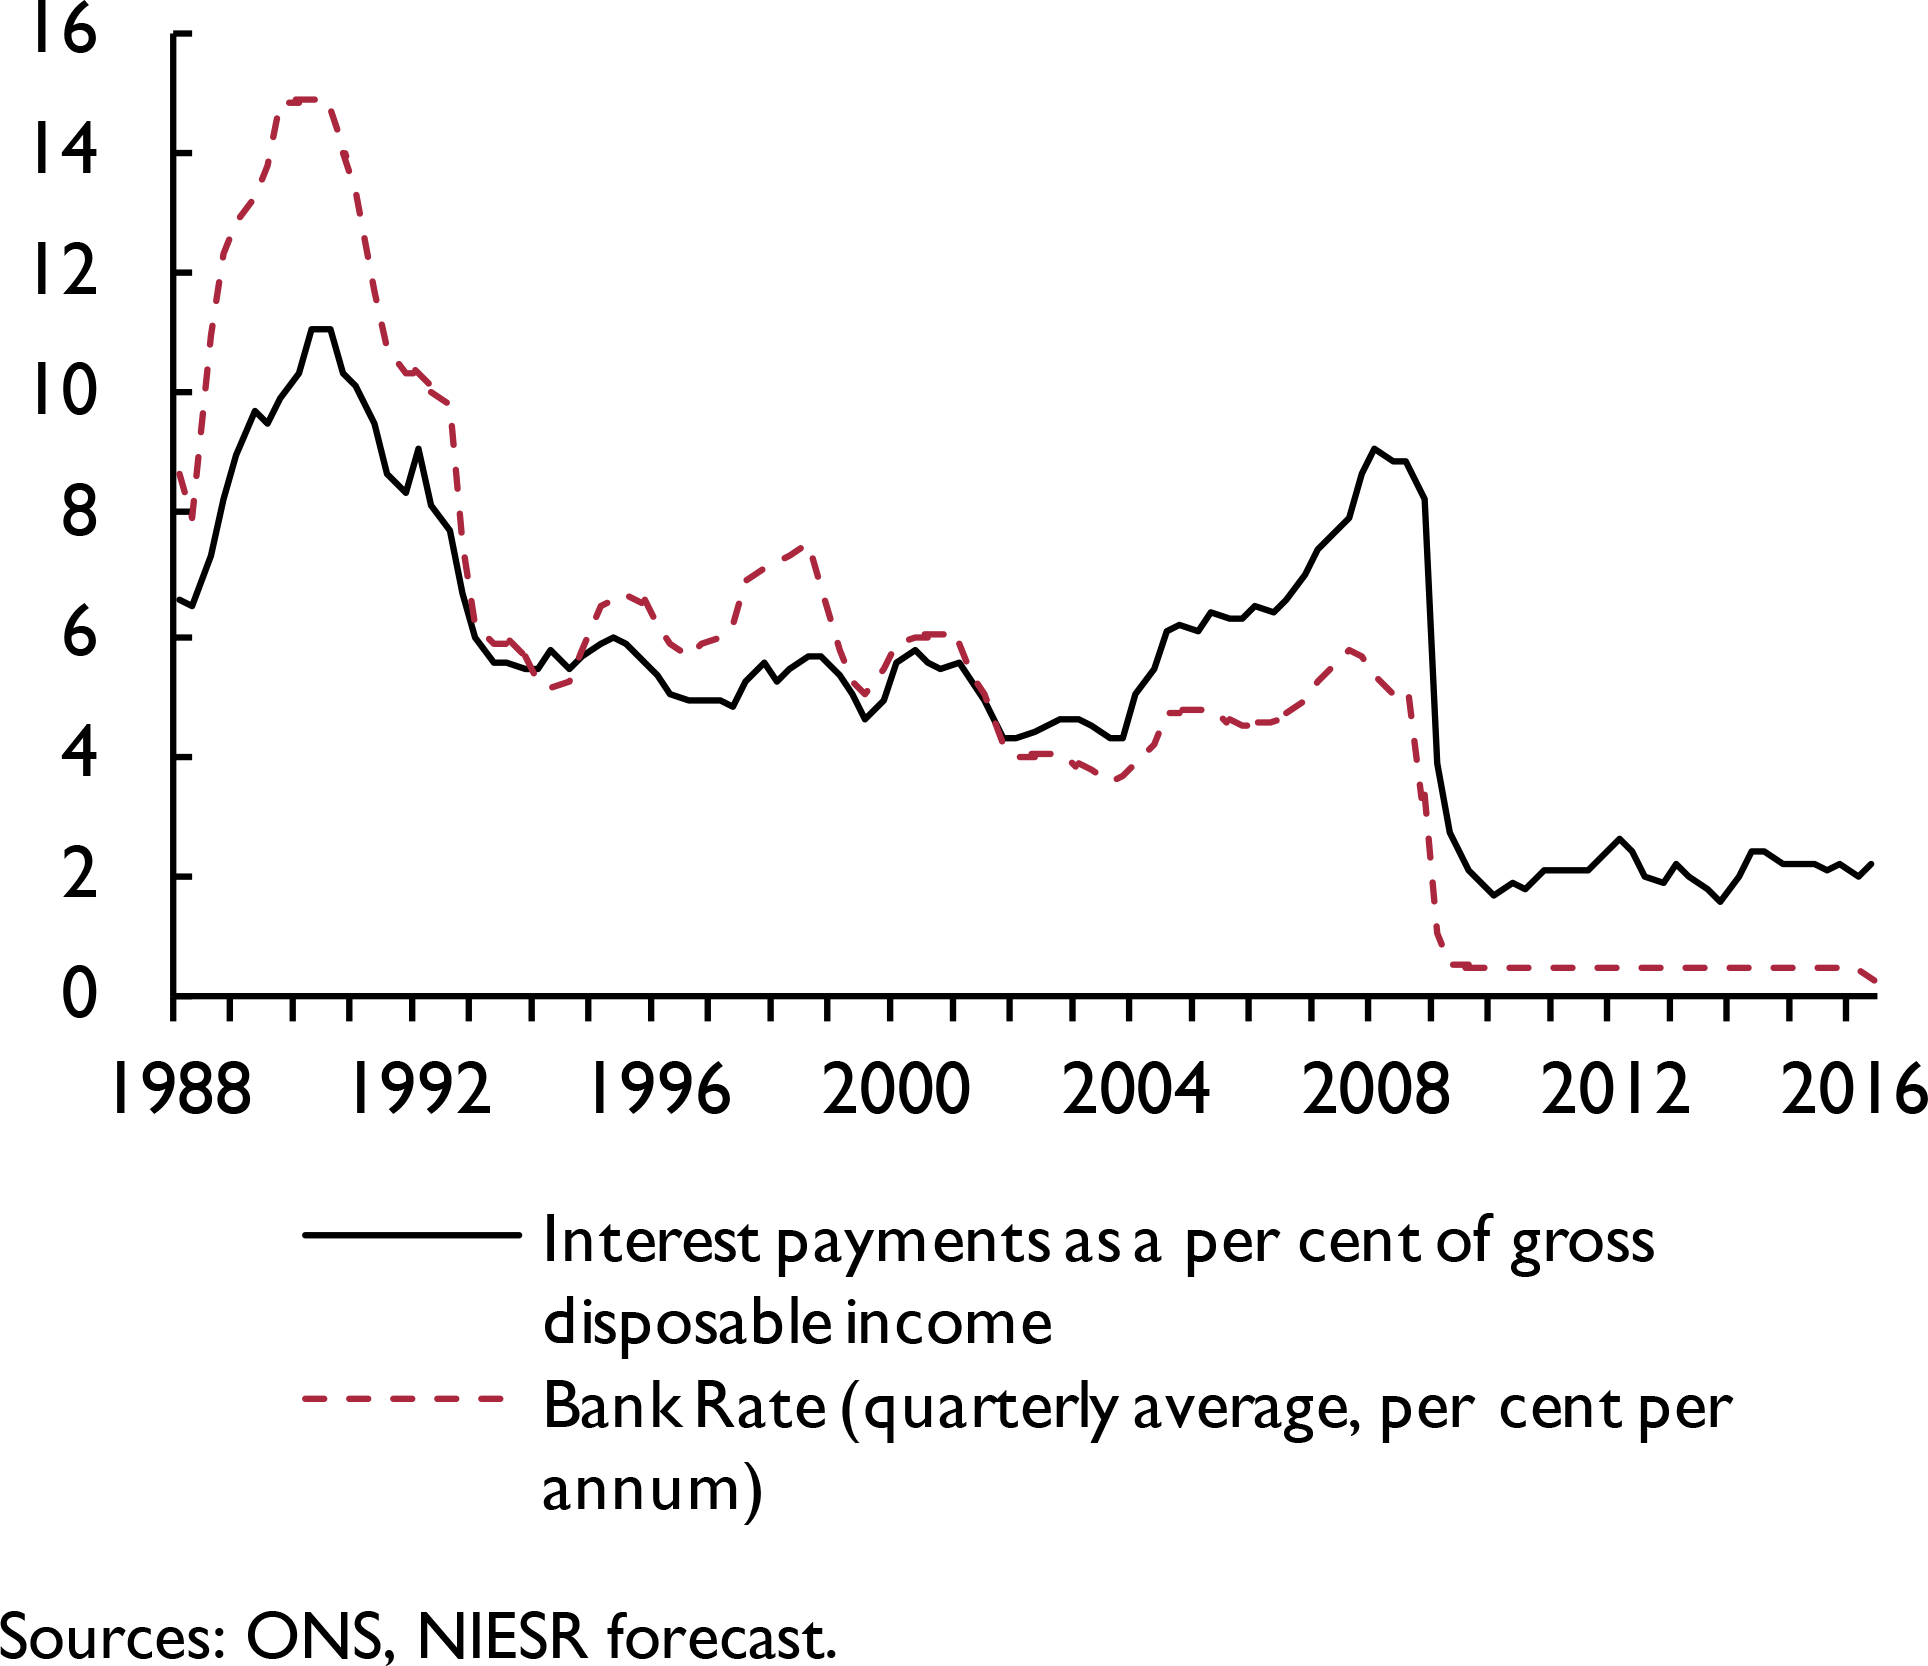
We expect households’ propensity to save to rise over the medium term (per cent of gross disposable incomes)

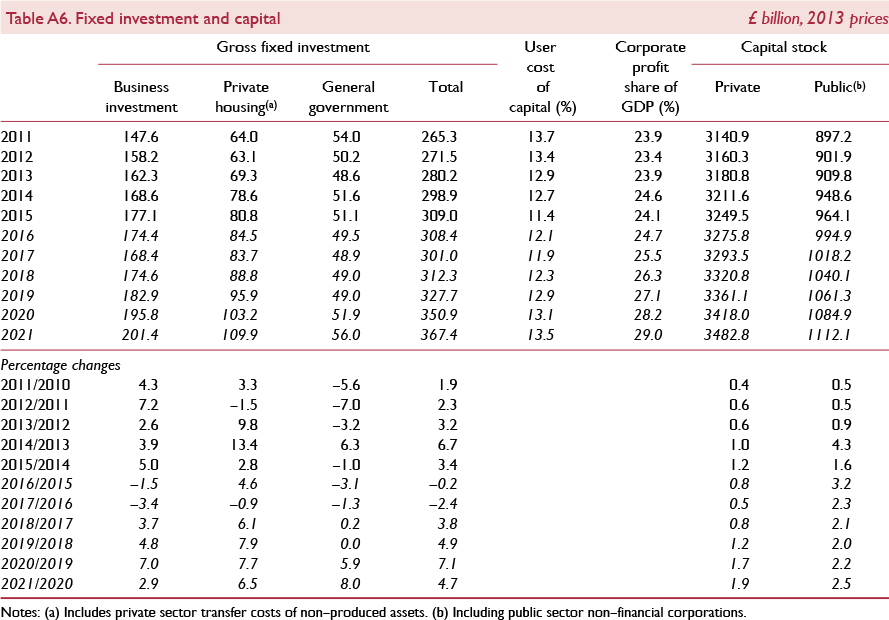
Productivity in the UK has just surpassed pre-recession levels
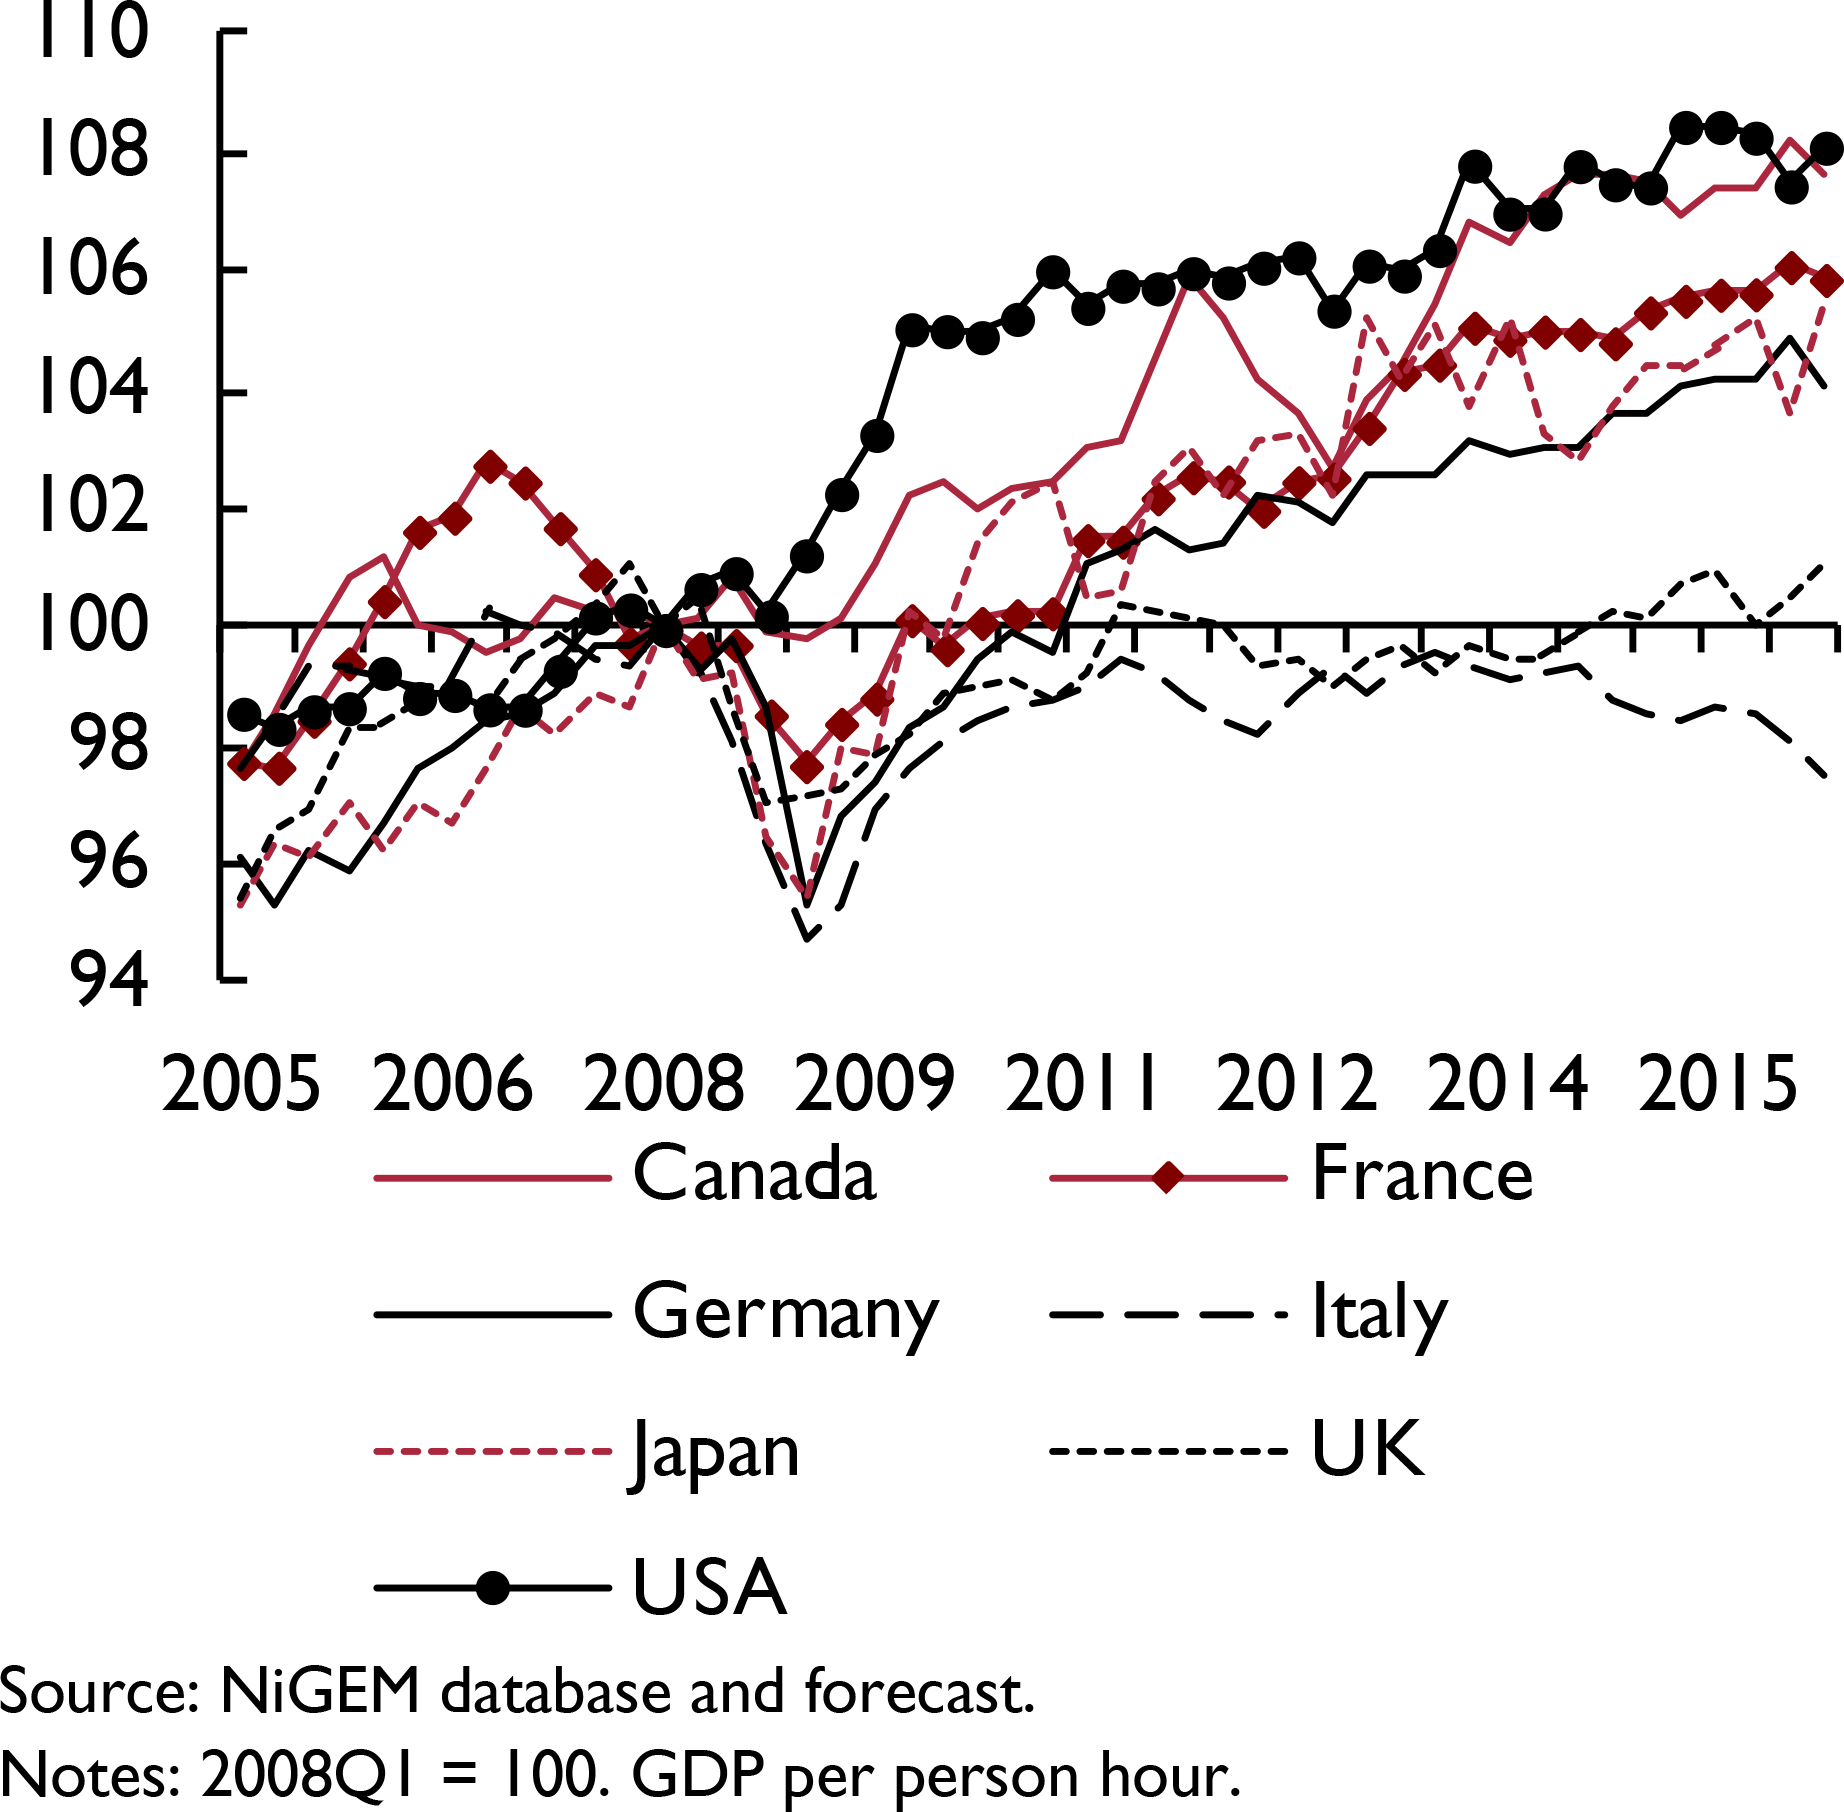
National saving rates (per cent of GDP)
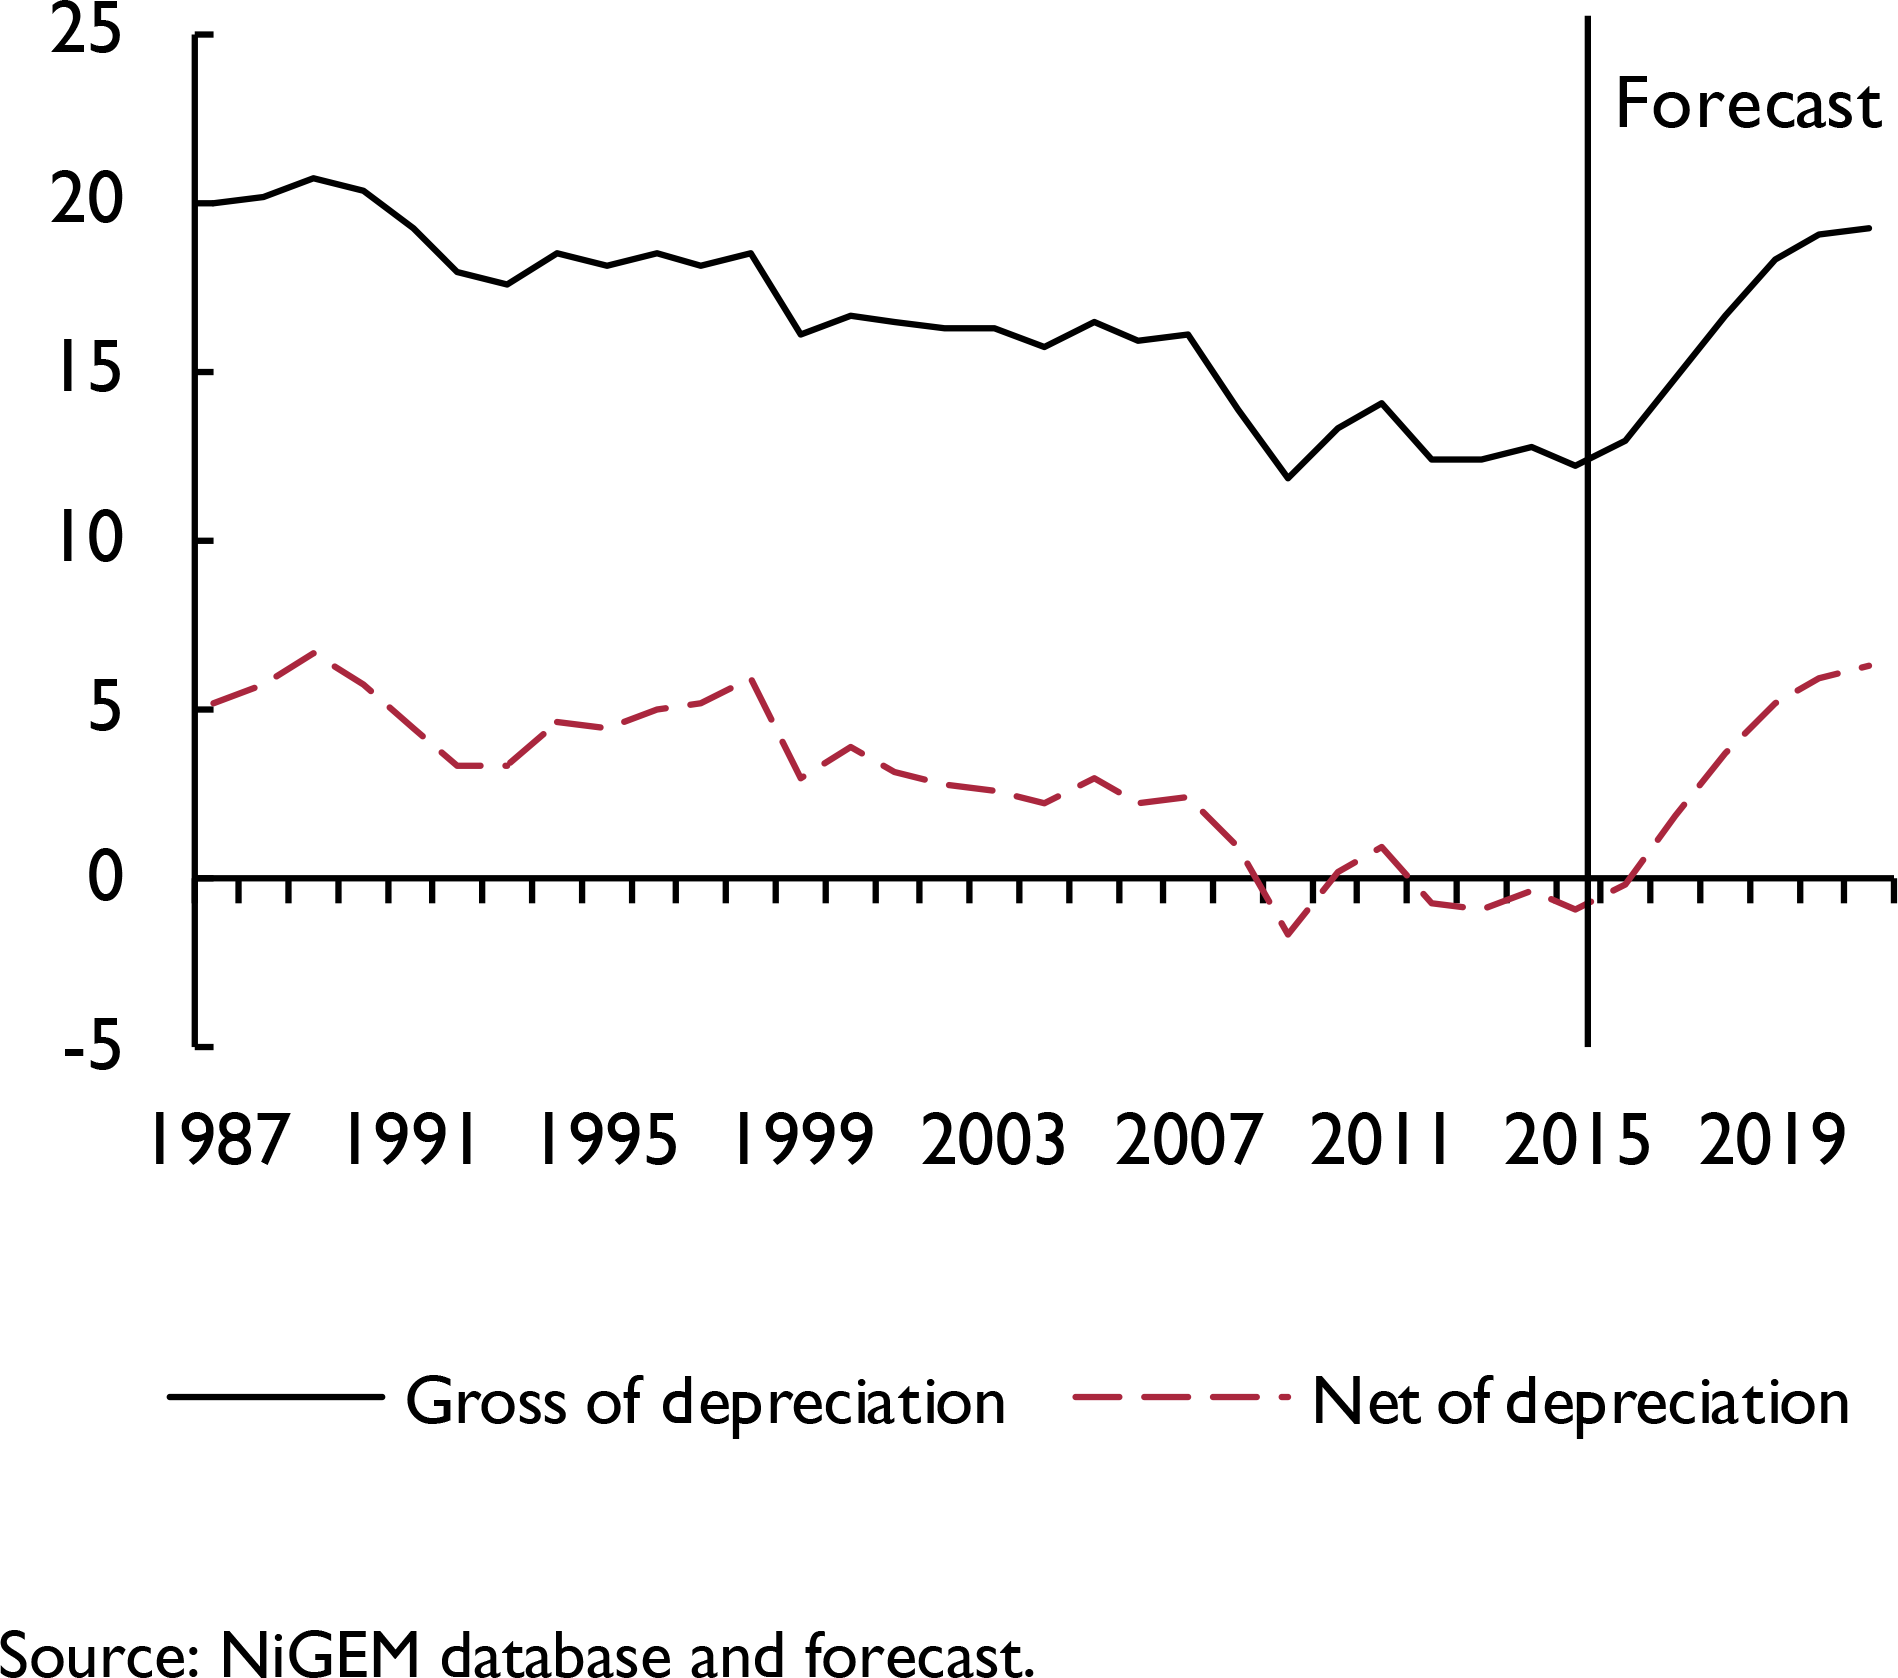
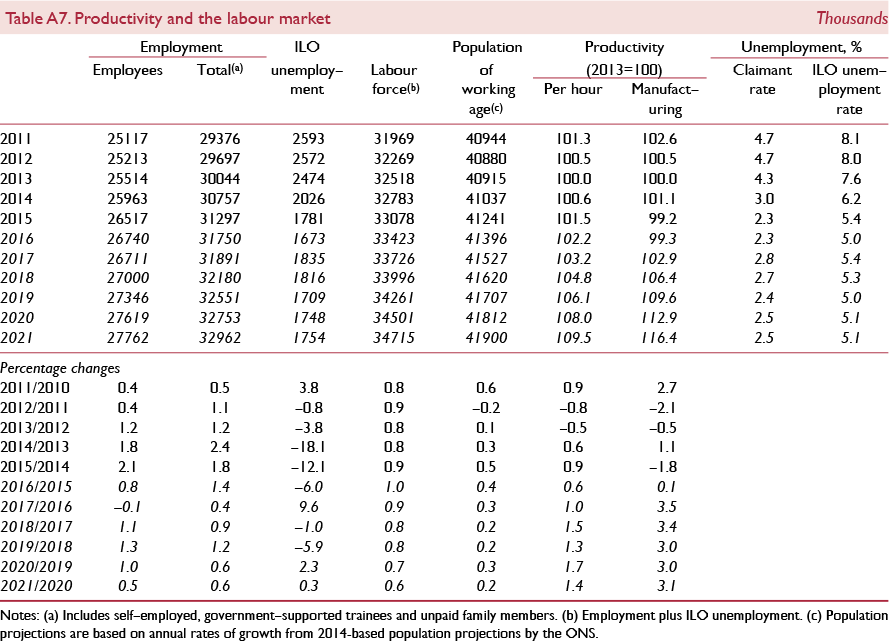
In 2016Q3 GDP was 8.2 per cent higher than its pre-crisis peak and employment is estimated to be 7.2 per cent higher

The Beveridge curve