

1. Introduction
Retroflex sounds are a class of language sounds often described by their articulatory property of being produced with the tip of the tongue ‘curled up to some extent’ (Ladefoged & Maddieson Reference Ladefoged and Maddieson1996:25). The term ‘retroflex’ has long served as a descriptor for this specific tongue gesture (since at least Pike Reference Pike1943; see also Dixit Reference Dixit1963, Reference Dixit1990:190, and the literature reviewed therein). While this definition is not circumscribed to any one place of articulation, the notion that a contrast exists in a number of languages between retroflex and non-retroflex apical consonants led to the further specification of retroflexes as apical post-alveolars, thereby effectively treating the label ‘retroflex’ as that of a specific place of articulation (in line with The International Phonetic Association 2010; see Ladefoged Reference Ladefoged1971, Bhat Reference Bhat1974), albeit one with great cross-linguistic, and possibly idiolectal (see Catford Reference Catford and Malmberg1968:310), variability. This variability is expressed in terms of (i) tongue-tip position (apical to sub-apical, see Ladefoged & Maddieson Reference Ladefoged and Maddieson1996, see more Section X) and (ii) nature of the gesture employed (Ladefoged & Bhaskararao Reference Ladefoged and Bhaskararao1983).
The observation that retroflex sounds are subject to considerable cross-linguistic variation dates as far back as Firth (Reference Firth1948), with notes on Urdu by Qadri (Reference Qadri1930) (see also Dixit Reference Dixit1990, Simonsen, Moen, & Cowen Reference Simonsen, Moen and Cowen2000). In the literature, the link between retroflexion and retraction has been the object of considerable debate. While originally rebutted by Bhat (Reference Bhat1973, Reference Bhat1974), based on remarks by Emeneau (Reference Emeneau1939) on the vowel system of Dravidian Badaga from India, Hamann (Reference Hamann2002) formalises this link as a monodirectional implication, meaning that all retroflex sounds would necessarily be retracted, but not vice versa. Building on this premise, Hamann (Reference Hamann2003) proposes that the actual ‘curling back’ of the tongue tip is not a necessary part of retroflex articulations, which would be better described by the following properties: apicality, posteriority, presence of a sub-lingual cavity throughout the articulation, and retraction (Hamann Reference Hamann2003:32–39; see Flemming Reference Flemming2003, Boersma & Hamann Reference Boersma and Hamann2005 for further discussion on this point).
This contribution represents the first description of nasal retroflex stops (henceforth, nasal retroflexes) in North Boma (Bantu B82),Footnote 1 a West-Coastal Bantu language spoken on the fringes of the Congo basin rainforest in southwestern Democratic Republic of Congo (DRC). Nasal retroflexes were first reported in North Boma by Stappers (Reference Stappers1986). Between 2021 and 2022, we conducted specific data collection to verify the presence of nasal retroflexes in the language. The interest of this line of research lies at the intersection of two issues.
First, North Boma retroflexes are exclusively nasal, which is an almost unique typological situation. The presence of a phonemic retroflex flap in North Boma is documented by Stappers (Reference Stappers1986) but remains dubious based on our own data. Whenever sporadically present, retroflex flaps seem to be free variants of intervocalic laterals and trills in North Boma (see Section 3). Nasal retroflexes constitute the rarest class of retroflex consonants in the world’s languages (Tabain et al. Reference Tabain, Breen, Butcher, Jukes and Beare2016, Reference Tabain, Butcher, Breen and Beare2020). Out of 399 languages reported to have a nasal retroflex in their phonological inventory in the PHOIBLE database (Moran & McCloy Reference Moran and McCloy2019), only forty-three (mostly from northern and western Australia) present inventories without any obstruent retroflexes, and only two (namely Syan or Saya, a Chadic language of Nigeria, see Schneeberg Reference Schneeberg1971; and Mandara or Wandala, another Chadic language spoken in Cameroon and Nigeria, see Fluckinger & Whaley Reference Fluckinger and Whaley1981) display a nasal as their sole retroflex phoneme. A detailed study of the acoustic properties of nasal retroflexes will allow us to compare available results in the literature (Hussain et al. Reference Hussain, Proctor, Harvey and Demuth2017, Tabain et al. Reference Tabain, Butcher, Breen and Beare2020), mostly drawn from languages outside Africa, with new information from one of the most severely under-documented linguistic areas of the planet (Hammarström Reference Hammarström2016), to formulate preliminary hypotheses for future empirical research in the field, and to lay the groundwork for further articulatory studies to be conducted with the necessary instrumental equipment.
Second, North Boma is spoken in the Mushie territory of the Mai-Ndombe Province of the DRC, north of the Kwa and Mfimi rivers. The reason why this is interesting is that, while retroflexion itself is not documented in the immediate vicinity of the area where North Boma is spoken, retroflex flaps can be found in the Bantu Lotwa languages of eastern Mai-Ndombe’s last surviving foraging communities (Motingea Reference Motingea2010, Maselli Reference Maselli2024). These relic groups, often referred to as ‘Pygmy’ or ‘Batwa’,Footnote 2 are generally considered the descendants of ancestral hunter-gatherers who inhabited the area before the advent of Bantu speakers (Saïdi Hemedi et al. Reference Saïdi Hemedi, Diss, Lokoka and Adebu2012:3). Nowadays, all Mai-Ndombe Batwa speak Bantu languages; they are presumed to have shifted to Bantu and to have abandoned their own original languages, which supposedly belonged to one or more unrelated and no longer extant language families (Bahuchet Reference Bahuchet2012). The occurrence of retroflexion in hunter-gatherer languages is consistent with earlier accounts by Vorbichler (Reference Vorbichler1966/67), who reports retroflex flaps in Efe, a Central Sudanic (Nilo-Saharan) language spoken by Bambuti foragers in the Ituri forest (northeastern DRC). A pre-Bantu ‘forest substrate’ (Möhlig Reference Möhlig1981, Pacchiarotti & Bostoen Reference Pacchiarotti and Bostoen2020, Reference Pacchiarotti and Bostoen2022, Motingea Reference Motingea2021) has already been hypothesised to explain specific phonological features of the Bantu languages of West-Central Africa, which are geographically less widespread but linguistically more diverse than their relatives further east and south (Bostoen Reference Bostoen and Spear2018). The North Boma case is of particular interest as it could provide new information on retroflexion as another possible substrate feature.
This paper aims to offer an exploratory acoustic description of nasal retroflexes in North Boma. More specifically, it provides as complete a phonetic examination of the available data on North Boma nasal retroflexes as possible, given the following limitations: first, the scarcity of said data, and second, the lack of balance in our small corpus. The present contribution is organised as follows. In Section 2, we present an overview of documentary efforts on retroflex sounds in the world’s languages. In Section 3, we present a concise account of North Boma phonology. In Section 4, we describe the technical and environmental aspects related to the data collection and processing phase of our research. In Section 5, we offer an acoustic analysis of North Boma nasal retroflexes and adjoining vowels, and discuss this in the context of the relevant literature on the acoustic correlates of nasal retroflexes in the world’s languages. In Section 6, we present a historical-phonological account for the development of phonemic nasal retroflexes in North Boma. In Section 7, we discuss phonetic and historical phonological findings. Section 8 concludes the article.
2. Documentation of retroflex sounds in Africa and beyond
Several phonological accounts of the properties of retroflexes are present in the literature. A few language-specific phonetic studies (acoustics, articulation, etc.) are also available. Firth (Reference Firth1948) presents palatograms from Marathi (Indo-Aryan), while Švarný & Zvelebil (Reference Švarný and Zvelebil1955) display palatograms, linguograms, and X-rays of retroflex consonants in multiple Indian languages, with special focus on Tamil. Other contributions are available on a wide array of languages of India (Heegård & Mørch Reference Heegård, Mørch and Saxena2004, Arsenault & Kochetov Reference Arsenault and Kochetov2011, Kochetov et al. Reference Kochetov, Arsenault, Petersen, Kalas and Khan2021, Hussain & Mielke Reference Hussain and Mielke2021 on Kalasha, Indo-Aryan; see also Morgenstierne Reference Morgenstierne1973, Ohala Reference Ohala1994, Spajić, Ladefoged, & Bhaskararao Reference Spajić, Ladefoged and Bhaskararao1996, Dart & Nihalani Reference Dart and Nihalani1999, Hussain et al. Reference Hussain, Proctor, Harvey and Demuth2017, Smith et al. Reference Smith, Proctor, Iskarous, Goldstein and Narayanan2013a,Reference Smith, Proctor, Iskarous, Goldstein and Narayananb, Kochetov, Faytak & Nara Reference Kochetov, Faytak and Nara2019), South-East Asian languages (Qiuwu Reference Qiuwu2001, Michaud Reference Michaud2006, Thurgood Reference Thurgood2009), and Norwegian (Simonsen, Moen, & Cowen Reference Simonsen, Moen and Cowen2008, Stausland Johnsen Reference Stausland Johnsen2012, Reference Stausland Johnsen2013). Numerous fine-grained phonetic analyses are available on several Australian languages (Dixit Reference Dixit1990, Butcher Reference Butcher and Lewis1995, Hamilton Reference Hamilton1996, Tabain Reference Tabain2009, Fletcher, Loakes, & Butcher Reference Fletcher, Loakes and Butcher2014, Tabain & Beare Reference Tabain and Beare2016, Reference Tabain and Beare2017, Tabain et al. Reference Tabain, Breen, Butcher, Jukes and Beare2016, Reference Tabain, Butcher, Breen and Beare2020).
However, to this day, comparatively few studies have been conducted on retroflexes in African languages. Bhat (Reference Bhat1973) treats what he calls ‘Central Africa’ as a ‘major retroflex area’:
Another major retroflex area is central Africa—coast to coast from Guinea to Somali Republic, and Tanzania. Languages belonging to different families and stocks spoken in this area such as SHERBRO (WEST ATLANTIC); EWE and BINI (KWA); HAUSA (CHAD); KANURI (SAHARAN); BAGIRMI, MORU, BIRRI, BONGO, LUGBARA and DAIR (SUDANIC); BERTA; BEDAUYE, GOLLA, and SOMALI (CUSHITIC); WELAMO (OMOTIC); KONDE and MOMBASA SWAHILI (BANTU) are reported to have retroflexed sounds. (Bhat Reference Bhat1973:14; capitals in the original)
The author does, however, go on to specify that retroflexion is ‘not a prominent feature in most of the languages of this area’ (same page; see similar remarks by Ladefoged Reference Ladefoged1964:18, Ladefoged & Maddieson Reference Ladefoged and Maddieson1996:25f).
Within the Niger-Congo phylum, Merrill (Reference Merrill2022) offers a survey of the occurrence of voiceless rhotic/retroflex consonants in Atlantic and posits that a sound similar to [ʈ] or [ʈʂ] likely goes back to the most recent common ancestor of these languages. Outside Atlantic, Laver (Reference Laver1994:222) mentions the presence of ‘voiced alveolar retroflex flapped stops’ in Gbaya (Ubangi, Sudan;Footnote 3 see also Lekens Reference Lekens1952, Samarin Reference Samarin1959, Walker & Samarin Reference Walker and Samarin1997) and Shona (Bantu S10, Zimbabwe).
Within Bantu, which is considered a low-level offshoot of Niger-Congo’s Benue-Congo subunit, besides Shona, the diachrony of non-nasal retroflex stops in Kizigua (Bantu G311, Somalia) has been studied by Tse (Reference Tse2013, Reference Tse2015); another relatively well-documented case is that of retroflex/flapped consonants in Kinyarwanda (Bantu JD61, Rwanda), for which acoustic, articulatory, and phonological accounts are available (Sibomana Reference Sibomana1974, Kimenyi Reference Kimenyi1979, Walker & Mpiranya Reference Walker and Mpiranya2006, Walker, Byrd, & Mpiranya Reference Walker, Byrd and Mpiranya2008). In some western and northern Bantu languages of the Equateur Province and greater Bandundu region of the DRC (Motingea Reference Motingea2010:205; earlier accounts of a similar phenomenon in northeastern DRC can be found in Vorbichler Reference Vorbichler1966/67), the flapped/retroflex realisation of laterals, rhotics, and occasionally alveolar stops has been attributed to the presence of an alleged hunter-gatherer substrate (Möhlig Reference Möhlig1981) based, among other circumstances, on the fact that lateral flaps are commonly used as free variants of intervocalic laterals by rainforest hunter-gatherer groups (Maselli Reference Maselli2024; see above). However, no detailed phonetic studies of this phenomenon are available. To the best of our knowledge, there are no acoustic studies of retroflex sounds in any Bantu language of the DRC besides the one presented here, and very few are available from other corners of the Bantu domain (see references above).
3. North Boma phonology
In the lexicon-based phylogeny of Pacchiarotti et al. (Reference Pacchiarotti, Chousou-Polydouri and Bostoen2019:185–89), North Boma constitutes, along with Tiene (Bantu B81), Mpe (B821), and Nunu (B822), a discrete subclade called Kwa-Kasai North within the Kwilu-Ngounie subbranch of West-Coastal Bantu, itself a major branch of the Bantu family also known as West-Western Bantu (Grollemund et al. Reference Grollemund, Branford, Bostoen, Meade, Venditti and Pagel2015, Koile et al. Reference Koile, Greenhill, Blasi, Bouckaert and Gray2022). A schematic representation of the main phylogenetic groups within West-Coastal Bantu is given in Figure 1. Nasal retroflexes were also found in Nunu. However, due to insufficient data, we do not report on them in this contribution.
Phylogenetic branches and subgroups within West-Coastal Bantu after Pacchiarotti et al. (Reference Pacchiarotti, Chousou-Polydouri and Bostoen2019) and de Schryver et al. (Reference de Schryver, Grollemund, Branford and Bostoen2015).

In Table 1, we present the consonantal inventory of North Boma as proposed by Stappers (Reference Stappers1986:1), the first to report the presence of nasal retroflexes in the language, with some modifications based on the data we collected during two fieldwork missions in 2021 and 2022 (see Sections 4 and 6); note that preN stands for ‘prenasalised’.
Consonantal phonemes of North Boma according to Stappers (Reference Stappers1986:1) with our own addition of prenasalised obstruent series and the flap /ɾ/.

According to Stappers (Reference Stappers1986), all consonants in Table 1 are phonemic except [d], which is an allophone of /l/ when preceded by a nasal. This observation is fully confirmed by the data we collected in 2022. Based on our data, /ɽ/ appears to be a free variant of intervocalic /l/ and /ɾ/, the latter of which is not present in Stappers’ consonantal inventory.
Stappers (Reference Stappers1986) states that /ɡ/ occurs only after /ŋ/. This is again confirmed by our own fieldwork data and in line with the fact that all languages belonging to the West-Coastal Bantu branch of which North Boma is part underwent a merger whereby Proto-Bantu (PB) *ɡ and *k merged to /k/, except in contexts where *ɡ was preceded by a homorganic nasal (see Pacchiarotti & Bostoen Reference Pacchiarotti and Bostoen2020 for a detailed account of this diachronic sound change). Post-nasally, the voicing contrast between *k and *ɡ was preserved. For this reason, in Table 1, we included /ŋɡ/ instead of /ɡ/ in the list of prenasalised plosives. In our data, we also find evidence for prenasalised fricatives and affricates, as can be seen in Table 1. All prenasalised obstruents, absent from Stappers’ (Reference Stappers1986) consonantal inventory, occur exclusively in stem-initial position. Like many other northwestern Bantu languages and Niger-Congo languages more generally, North Boma shows stem-initial prominence (Hyman Reference Hyman1998, Reference Hyman2008, Lionnet & Hyman Reference Lionnet, Hyman and Güldemann2018, Hyman et al. Reference Hyman, Rolle, Sande, Clem, Peter, Lionnet, Merrill, Baier and Wolff2019:196). This is visible, among other things, in the fact that only /m/, /ɳ/, /ŋ/, /ʁ/, /r/, /l/, /t/, and /n/ can occur in C2 position in North Boma in a C1V1C2V2 template (where C stands for consonant and V for vowel), while all consonants in Table 1 with the exception of /ɳ/ and /ʁ/ can occur in C1 position.
The phonemic status of /ɳ/ is confirmed by (near-) minimal pairs such as those in 1.

Stappers (Reference Stappers1986:4) provides contrasts for /n/ vs. /ɳ/ in C2 position with the minimal pair ɛkání ‘we had wished’ vs. ɛkáɳí ‘we had danced.’ This pair as well as all others present in Stappers have been confirmed by our main consultant, the late Léon Mabwakha ma Bonkako, whose memory we wish to honour with the present contribution (see ‘Acknowledgments’). Nonetheless, there are very few words in the North Boma variety described by Stappers (Reference Stappers1986), which appears to be nearly identical to the one spoken by Léon Mabwakha ma Bonkako, where /n/ occurs in C2 position within a C1V1C2V2(C3V3) template. This is because, as we show in Section 6, most PB *n and *nd in C2 position merged into /ɳ/ in North Boma.
4. Data collection and processing
The data used for the phonetic analyses presented in this venue (available on OSF: https://osf.io/cmezd/?view_only=a0465124c79a4782bad819%20a830d21f0e) were collected by the first and third authors between June and July 2021, on a field mission to the Mai-Ndombe Province of the DRC. Data collection took place in Nioki (co-ordinates: –2.72037, 17.69001), in the southern part of Mai-Ndombe; see Figure 2.Footnote 4
The Mai-Ndombe Province of the DRC with consultants’ locations.

The authors recorded word lists, including basic Swadesh-100 lexical items, sentences, and free connected speech, with three local consultants. Additional data were collected at a later stage by the last three authors during a mission in Kinshasa in August 2022 through elicitation with the late Léon Mabwakha ma Bonkako. Elicited materials in 2022 included a list of approximately 800 words. An overview of the relevant information on the four speakers is provided below, with their places of birth indicated on Figure 2:
-
• Subject A: 35 years, male, first language: North Boma, place of birth: Mbali (a.k.a. Mbali-Iboma, –2.38, 17.29), mother’s place of birth: Mbali, father’s place of birth: Izana (possibly Izono,Footnote 5 –2.60, 17.56);
-
• Subject B: 37, male, North Boma, place of birth: Bobala (–2.56, 17.52), mother’s place of birth: Bobala, father’s place of birth: Izono;
-
• Subject C: 50, male, North Boma, place of birth: Mushie (–3.02, 16.92), mother’s place of birth: Mushie, father’s place of birth: Mushie;
-
• Léon Mabwakha ma Bonkako (no pseudonymisation provided): 80, male, North Boma, place of birth: Bopaka (–2.49, 17.36), mother’s place of birth: Bopaka, father’s place of birth: Bopaka.Footnote 6
Recording sessions took place indoors, in a relatively quiet environment with no echo discernible in the background. Part of the data was recorded on Roland R-26 and Zoom H-5 devices with their built-in directional microphones, and the rest on the same Roland R-26 device with an external plug-in omnidirectional microphone (Saramonic Lavalier Microphone SR-XLM1) clipped onto the speakers’ clothes (sideways from the mouth). The sampling rate was kept at 44.1 kHz; maximum input, whenever verifiable, was set at 75% to minimise clipping; depth was set at 24 bits. The data were then imported into Praat (Boersma Reference Boersma2001) for annotation and analysis. Annotation and transcription of the data collected in 2021 were carried out by the first author and checked against preliminary descriptions of the sounds of interest by Stappers (Reference Stappers1986). The transcription of the data collected in 2022 was carried out by the fourth author, and phonetic annotation of the relevant segments was performed by the first author. The relevant acoustic variables (duration, formant, and spectral moment values; see below) were semi-automatically extracted from Praat by dint of a script specially written by the second author.
Formant values were sampled at 10%, 30%, 50%, 70%, and 90% of the duration of the segments of interest, that is, nasals and adjacent vowels. Both consonants and vowels were considered given that key cues to consonant acoustics can be found in segment transitions (see, among others, Catford Reference Catford1977, Johnson Reference Johnson2012). We extracted F1, F2, F3, and F4 median values with their relative bandwidths, average bandwidth over F1 to F4, as well as F1 and F2 onset and offset slopes (for vowels: offset slopes for pre-consonantal, and onset slopes for post-consonantal ones). Onset slopes were calculated as a function of F1/F2 formant values at 50% of the total duration of the sound of interest minus the same value at the 10% temporal mark, divided by 40% of the total duration of the sound. Conversely, offset slopes were calculated as formant value at 90% minus formant value at 50% on 40% of the segment’s total duration:
 $$ \mathrm{Onset}\ \mathrm{slope}=\frac{\mathrm{Formant}\ \mathrm{value}\hskip0.42em \mathrm{at}\hskip0.42em 50\%\hskip0.42em \mathrm{of}\ \mathrm{the}\ \mathrm{total}\ \mathrm{duration}\ \mathrm{of}\ \mathrm{the}\ \mathrm{sound}\ \mathrm{of}\ \mathrm{interest}\hbox{--} \mathrm{Formant}\ \mathrm{value}\hskip0.42em \mathrm{at}\hskip0.42em 10\%}{\mathrm{Total}\ \mathrm{duration}\ \mathrm{of}\ \mathrm{the}\ \mathrm{sound}\ \mathrm{of}\ \mathrm{interest}\hskip0.42em \ast \hskip0.42em \left(40/100\right)} $$
 $$ \mathrm{Offset}\ \mathrm{slope}=\frac{\mathrm{Formant}\ \mathrm{value}\hskip0.22em \mathrm{at}\hskip0.42em 90\%\hskip0.42em \mathrm{of}\ \mathrm{the}\ \mathrm{total}\ \mathrm{duration}\ \mathrm{of}\ \mathrm{the}\ \mathrm{sound}\ \mathrm{of}\ \mathrm{interest}\hbox{--} \mathrm{Formant}\ \mathrm{value}\hskip0.42em \mathrm{at}\hskip0.42em 50\%}{\mathrm{Total}\ \mathrm{duration}\ \mathrm{of}\ \mathrm{the}\ \mathrm{sound}\ \mathrm{of}\ \mathrm{interest}\hskip0.42em \ast \hskip0.42em \left(40/100\right)} $$
Formant transitions have been the focus of a lot of research on coronal oppositions, especially in relation to retroflexion (Halle, Hughes, & Radley Reference Halle, Hughes and Radley1957, Delattre, Liberman, & Cooper Reference Delattre, Liberman and Cooper1962, Butcher Reference Butcher and Lewis1995, Iskarous, Fowler, & Whalen Reference Iskarous, Fowler and Whalen2010, Rhone & Jongman Reference Rhone and Jongman2012). In particular, a lowered F3 both on the vowel preceding the sound and on the first part of the sound itself is considered an indicator of retroflexion (Steriade Reference Steriade1995, Reference Steriade, Hume and Johnson2001a, Tabain Reference Tabain2009, Reference Tabain2011, Reference Tabain2012). F4 is also, to some extent, affected by the same phenomenon and a lowered F4 has been associated with retroflex articulations (Hussain et al. Reference Hussain, Proctor, Harvey and Demuth2017). Importantly, Tabain et al. (Reference Tabain, Breen, Butcher, Jukes and Beare2016, Reference Tabain, Butcher, Breen and Beare2020) found F3 to be the most relevant correlate to retroflexion in the Australian languages that they surveyed, but they described the contrast between retroflexes and other coronal articulations as comparatively weak in their pool. Retroflexes also appeared to pattern with other coronals in terms of bandwidth values for F1–F4, which the authors took to suggest coronals undergo less acoustic damping than other nasals.
Less attention has been paid to spectral moments as cues to articulatory configurations of the vocal tract in the production of retroflexes (Tabain et al. Reference Tabain, Breen, Butcher, Jukes and Beare2016, Themistocleous, Fyndanis, & Tsapkini Reference Themistocleous, Fyndanis and Tsapkini2021). Spectral moment values correspond to a sound’s centre of gravity, standard deviation, skewness, and kurtosis (Forrest et al. Reference Forrest, Weismer, Milenkovic and Dougall1988, Nittrouer Reference Nittrouer1995, Tanner et al. Reference Tanner, Roy, Ash and Buder2005, Li, Edwards, & Beckman Reference Li, Edwards and Beckman2009, Schindler & Draxler Reference Schindler and Draxler2013). In Spectral Moment Analysis, the sound’s power spectrum is treated as a probability distribution and its mathematical moments are calculated accordingly (Li et al. Reference Li, Edwards and Beckman2009:3), as shown in Figure 3.
Centre of gravity (μ), standard deviation (σ), skewness, and kurtosis of a probability distribution. A = normal distribution, with corresponding μ and σ; B = positively skewed distribution and corresponding shift in mean (dotted vertical line); C = peaked distribution with positive kurtosis (source: Tanner et al. Reference Tanner, Roy, Ash and Buder2005).

Spectra displaying one dominant mode tend to exhibit a negative correlation between the first moment (centre of gravity) and the resonant cavity’s length, offering a rough indication of constriction position. The second spectral moment (standard deviation) serves the primary purpose of distinguishing between a broad, dispersed spectrum and sharper, more concentrated energy distributions. The third spectral moment (skewness) correlates to articulation placement. Broadly, a positive value suggests an accumulation of energy in the lower frequencies below the mean. The fourth spectral moment (kurtosis) can help distinguish tongue posture differences with higher tongue positions leading to higher kurtosis, in turn contributing to alterations in the spectral shape’s peak concentration (see Li et al. Reference Li, Edwards and Beckman2009:3). Spectral moment analysis has been applied most profitably to the study of noisy spectra such as those of fricatives; in the case of nasals, spectral moment analysis has been used most recently by Tabain et al. (Reference Tabain, Breen, Butcher, Jukes and Beare2016), though their study is limited to centre of gravity and standard deviation. We believe that, given the nature of our corpus and the suboptimality of acoustic data collection in field settings, spectral moment analysis is better suited than other, traditional methods of nasal spectrum analysis (Recasens Reference Recasens1983), such as antiformant analysis, to provide a preliminary description of nasal retroflexes in North Boma.
Spectral moments were calculated differently for vowels and consonants. For vowels, the analysis range was set at 0 to 5,000 Hz,Footnote 7 and for consonants at 1,000 to 5,000 Hz (in a way similar to Tabain et al. Reference Tabain, Breen, Butcher, Jukes and Beare2016). This is because, in voiced consonants, energy concentrations lower than 1,000 Hz essentially correspond to voicing, and the aim of moment measurements is rather to capture place of articulation (i.e. features of the supralaryngeal tract). On the other hand, in the case of vowels, information related to F1 is typically located below 1,000 Hz, which justifies the range selection mentioned above. Vowel and consonant values are never compared directly in this study, which allows for the adoption of two different set ranges.
For the purposes of this contribution, spectral moment values were sampled at 10%, 50%, and 90% of the duration of the segments of interest. We obtained average formant and spectral-moment values for the whole segment (from 10% to 90% of the duration). Spectral moments were calculated in two separate ways.
-
(i) Over the entire segment. This method is largely inspired by DiCanio’s (Reference DiCanio2021) script,Footnote 8 based (among others) on Shadle (Reference Shadle, Cohn, Fougeron and Huffman2012) and Forrest et al. (Reference Forrest, Weismer, Milenkovic and Dougall1988). This method was originally developed for fricatives. It involves: (i) analysing the central 80% of the consonant by calculating multiple spectra over consecutive windows within this larger 80%-duration window, and then (ii) averaging the spectra before measuring the moments: ‘Within time-averaging, a number of DFTs [discrete Fourier transforms] are taken from across the duration of the fricative. These DFTs are averaged for each token and then the moments are calculated. The analysed duration of the fricative is always equivalent to the centre 80% of the total duration, cutting off the transitions’ (DiCanio Reference DiCanio2021). Analysis parameters were adjusted to account for duration variations across the corpus, which contains very short segments (retroflex: average approx. 50 ms ± 20) and others over twice as long (other consonants: average approx. 110 ms ± 55). Thus, the number of windows used to calculate the spectra equals five windows of 15 ms each. In practice, if the segment was 110 ms, we discarded the first 11 and the last 11 ms, which results in five almost consecutive windows of 15 ms (inter-window signal portions of 3 ms were not analysed). If the segment was shorter, windows were permitted to overlap up to a maximum of 50% of their duration (to avoid overanalysing the central portion of the segment), which accounts for segments down to 45 ms;
-
(ii) In a single window positioned at specific points of the segment. This second method is based on Tabain et al. (Reference Tabain, Breen, Butcher, Jukes and Beare2016): a 20-ms window centred around the middle portion of the segment, with analysis over a frequency range of 1,000 to 5,000 Hz (for consonants). The main difference from Tabain et al.’s (Reference Tabain, Breen, Butcher, Jukes and Beare2016) previous method is that we performed the measurement of spectral moments directly via Praat’s algorithm. Note that, unlike Tabain et al. (Reference Tabain, Breen, Butcher, Jukes and Beare2016), we also adopted the same procedure at 10% and 90% of the segment’s total duration, both for vowels and consonants. For segments shorter than 100 ms, this includes a very short portion of the adjacent segment in the relevant window. For example, in the case of a nasal segment of 50 ms, centring our analysis window around 10% of the sound’s duration (i.e. at 5 ms from the start of the segment), our analysis would start at –5 ms (5 ms before the segment boundary, or the last 5 ms of the preceding vowel) and end at +15 ms. Given that (i) we want to capture transition effects, and (ii) the values remain very small, roughly overlapping manual segmentation error (5 ms), we hold this is an acceptable trade-off for a method which is overall better tailored to our specific needs.
It should be mentioned that the way values were measured for duration and spectral moments might risk obfuscating the effect of place of articulation on the phonetic realisation of the sounds at hand. This is because nasal retroflexes and non-retroflexes mostly occur in different contexts where duration differences are expected irrespective of place of articulation. Additionally, spectral moments are sensitive to lots of different factors, such as background noise and how much vowel is included in the measurement window, which might compound the duration issue. In order to address these points, modified versions of the dataset were produced, one balanced for duration (i.e. only including observations with duration values lower than 0.1 s) and one without spectral moment values (see below, Section 5.3).
The datasets resulting from the extraction of the parameters listed above were then imported into R and RStudio (RStudio Team 2019, R Core Team 2020), for the purposes of statistical analysis and modelling (including the production of all relevant graphs and averaged Fast Fourier Transform, or FFT, spectra) and mined with FactoMineR (Lê, Josse, & Husson Reference Lê, Josse and Husson2008).
5. Acoustic characteristics of nasal retroflexes in North Boma
5.1. Preliminary observations
Broadly speaking, clear spectral cues to tease retroflex and non-retroflex nasal sounds apart in North Boma are scarce. However, a few preliminary observations can be drawn from the comparison of word-internal nasal oppositions as shown in Figure 4 with [inã́ɳa] ‘eight’.
Oscillogram, spectrogram, and segmentation of one repetition of the word [inã́ɳa] ‘eight’ as produced by Subject C; audio file available on OSF (name: Figure 4 audio; https://osf.io/cmezd/?view_only=a0465124c79a4782bad819%20a830d21f0e).

The retroflex segment is considerably shorter than the alveolar; this is compatible with our understanding of transient articulations such as those of flaps and taps (see Laver Reference Laver1994:221–27, Bickford & Floyd Reference Bickford and Floyd2006:141–42, Warner et al. Reference Warner, Fountain and Tucker2009, Derrick & Gick Reference Derrick and Gick2011).Footnote 9 However, effects of position may also come into play, with consonants in C2 position (see Section 6) undergoing shortening (see below, Section 5.2).
In a handful of interesting cases, a high-frequency spike in intensity (circled in red in Figure 5) can be observed in the spectrogram when a nasal retroflex occurs (especially in the speech of Subject C). This very short span of higher-frequency noise might indicate the presence of a transient percussion, such as the one effected by the tongue against the palate in some flapped articulations (see also Švarný & Zvelebil Reference Švarný and Zvelebil1955:390). However, we are dealing with a weak indicator at best since it does not occur consistently across realisations.
To the left: oscillogram, spectrogram, and segmentation of [kokfã́ːɳa] ‘to bury’; to the right: [mobːã́ːɳo] ‘expensive’; both pronounced by Subject C [audio files available on OSF (https://osf.io/cmezd/?view_only=a0465124c79a4782bad819%20a830d21f0e) as Figure 5 – 1 audio and Figure 5 – 2 audio respectively].

5.2. Descriptive statistics
A series of descriptive statistics was performed to summarise our dataset (which includes [m], allophonic [ɱ] in pre-labiodental position, [n], [ɲ], [ɳ] and [ŋ]).Footnote 10 Full results are displayed in Appendix 2. On average, nasal retroflexes appear to be markedly shorter than their non-retroflex counterparts (their length is roughly half that of the other nasals; see Figure 6 below). This might be in keeping with our preliminary observation (see above) that nasal retroflexes behave more like flaps than nasal stops.
Average duration of North Boma nasals (see below).

This effect may also be enhanced by blurriness at the relevant segmental edges. Considering that these sounds are particularly subject to internal changes in articulatory targets, it becomes apparent that assigning clear-cut segmental boundaries can be complicated and possibly result in the identification of a core section without its more coarticulated boundaries.
Figure 7 summarises averaged median formant and bandwidth values for the six nasal places of articulation.
Averaged median formant values (horizontal lines) for six types of North Boma nasals with their relative average median bandwidth (bars).

F2–F4 values appear to be lower for retroflexes than their non-retroflex counterparts; contrary to our expectations, this effect is greater for F2 and F4 than for F3. Retroflex consonants’ F2 trajectories are expected to be largely language-dependent (Hamann Reference Hamann2003:59). Since articulatory predictions concerning the acoustics of retroflex sounds suggest that the presence of a posterior articulation would result in raised F2 (via the insertion of a low-frequency resonance between F2 and F3, see, e.g., Stevens Reference Stevens1998:436ff), it can be hypothesised that nasal retroflexes in North Boma are characterised by tongue retraction, resulting in lower F2 values, more than by other cross-linguistically well-attested retroflexion mechanisms; see Dart & Nihalani’s (Reference Dart and Nihalani1999) data on Malayalam. In turn, the inter-F3/4 spectral region in retroflexes has often been claimed to be narrower than in other articulations (Stevens & Blumstein Reference Stevens and Blumstein1975:219), which would explain why F4 is more significantly lowered than F3.
F1 bandwidth values are higher for nasal retroflexes than for their non-retroflex counterparts. This could be achieved through lengthening of both the front and back cavity, which is compatible with a more perpendicular position of the tongue against the passive articulator (thereby minimising the tongue-palate contact area); if coupled with the notion that F2 values tend to be lower on retroflexes than on their non-retroflex counterparts, this observation points in the direction of a (sub-)apical alveolar articulation. A wide F1 bandwidth has also been linked to more important acoustic losses in the nasal cavity, bringing F1 closer to the fundamental frequency (Stevens Reference Stevens1998). Additionally, wider bandwidths are an indicator of higher damping, which in turn could point to a tighter constriction in the vocal tract (Tabain et al. Reference Tabain, Breen, Butcher, Jukes and Beare2016; notably, the authors found the opposite to be true in their sample of Australian languages; see Section 7).
Figure 8 summarises spectral moment values in North Boma. Centre of gravity values are lower for retroflexes than non-retroflexes, while the effect of standard deviation (SDev) is less patent.
Average spectral moment values for six types of North Boma nasals (95% confidence interval); centre of gravity and standard deviation are expressed in Hz, while skewness and kurtosis are dimensionless (see Harrington Reference Harrington, Hardcastle, Laver and Gibbon2010:41).

Skewness and kurtosis values also distinguish nasal retroflexes from their non-retroflex counterparts, with the former scoring higher average values than the latter. This is compatible with higher (and more peaked)Footnote 11 concentrations of energy in the spectral area below their centroid frequency. In order to further illustrate this point, we computed averaged FFT spectra across multiple windows within each segment; results are shown in Figure 9. This averaging reduces the influence of transient fluctuations and provides a more stable representation of the sound’s overall spectral shape. The script used to extract the information presented in Figure 9 was written by the second author and is available on OSF (FFT folder; https://osf.io/cmezd/?view_only=a0465124c79a4782bad819%20a830d21f0e). As hypothesised based on the preliminary descriptive statistics presented earlier in this Section, nasal retroflexes display lower centres of gravity with higher energy, especially below their centroid frequency.
Averaged FFT spectra for six types of nasals in North Boma (mean smoothed amplitude across all nasal segments, with ribbons for standard deviation).Footnote 13

5.3. Factorial analyses
A Multiple Factor Analysis (MFA) was performed on the dataset. MFA is an extension of Principal Component Analysis (PCA). In order to understand how MFA works, we first review the fundamentals of PCA. PCA is a dimensionality reduction technique used to simplify complex datasets by transforming them into a new set of variables called ‘principal components.’ These principal components are linear combinations of the original dimensions. They are arranged in order of importance, with the first component explaining the most variation in the data, the second component being the second most indicative, and so on. In PCA terms, ‘dimension’ refers to the original variables or attributes that were used as input data. Dimensions are defined as percentages of total inertia (a measure of the points’ weighted spread), and their correlation to specific variables indicates to what extent those variables can explain the percentage(s) of inertia they express. PCA aims to reduce these dimensions into a smaller set of components, that is, the principal components, that capture the essential information in the data while minimising redundancy. These principal components are the new dimensions explaining the structure of the data.
MFA is a factorial method specifically designed to analyse datasets where variables are structured into groups. It is ‘tailored to handle multiple data tables that measure sets of variables collected on the same observations’ (Abdi et al. Reference Abdi, Williams and Valentin2013). In practice, MFA takes a set of observations described by a certain number of variables and yields a measure of the degree to which each variable group (as opposed to individual variables) explains variance in the set (see Abdi & Valentin Reference Abdi, Valentin and Salkind2007). Several sets of variables (continuous or categorical) are analysed in two steps. First, a PCA is run on the quantitative variables (in our case, clustered into the following groups: ‘duration’, ‘formant values’, ‘bandwidth values’, ‘slope values’, and ‘spectral moments’). Second, an estimate and p-value of the correlation between all (supplementary) qualitative variables (in our case, ‘segment’ and ‘retroflexion’) and the dimensions (principal components) produced by the first PCA are provided.
MFA is used when more than one set of variables has been measured for the same observations. In our case, several sets of variables (both quantitative and qualitative, see above) have been measured for the same individual observations (in this case, North Boma nasals). Therefore, MFA allows us to see what quantitative variables best explain variance in the corpus, and which of the two qualitative variables (‘segment’ and ‘retroflexion’) better describes the North Boma nasal acoustic space—in other words, we aim to determine whether nasal retroflexes constitute a compact and separate group from the other nasals of North Boma, and what acoustic parameters best explain their difference from those other nasals.
MFA have also been conducted on slightly modified versions of the dataset, one balanced by duration (i.e. only including observations with duration values lower than 0.1 s) and one without spectral moment values (see Section 4).
For the purposes of this presentation, we will only comment on individual factor maps;Footnote 12 these graphically represent each group of observations (average values) with the extracted values for all the variable sets and its barycentre on the plane described by the two top dimensions of the PCA. See, for example, Figure 10.
Individual factor map of the entire dataset.

In Figure 10, an individual factor map is presented for the entire dataset (all consonants, all duration values) with all variable groups. Each observation set (labelled in bold) is connected to small, coloured squares (at the end of every dotted line) representing its average value for the five variable group measurements of interest; the label itself is placed at the barycentre of these average values on the plane. The plane is defined by the first two principal components (here, dimensions 1 and 2)Footnote 14 of the PCA. As can be seen, retroflex and non-retroflex segments constitute two separate groups with very distinct acoustic characteristics. Along the dimension 1 axis, which accounts for around one fourth of the dataset’s total inertia (in other words, it explains one fourth of the variance, i.e. the ‘behaviour’ of the data), retroflex and non-retroflex segments exhibit inverse correlations for almost every variable, with the exception of bandwidth values for the nasal alveolar. Dimension 1 is described by the following characteristics (Table 2):Footnote 15 Retroflexes are significantly shorter than non-retroflexes; they exhibit lower F2 bandwidth values, have a lower centre of gravity, and tend to be characterised by negative F2 onset slopes; at the same time, they show higher spectral tilt (skewness) values, higher kurtosis, and higher F1 and F1 bandwidth values. This is due to the fact that nasal retroflexes show higher concentrations of energy in the lower regions of the spectrum around the centre of gravity; duration values are compatible with the possibility that North Boma retroflexes behave like nasalised flaps.
Top eight quantitative variables correlated (four directly and four inversely) with dimension 1 of the MFA summarised in Figure 10 (values rounded up, only two decimal points shown).

As mentioned above, MFA were also run on modified versions of the dataset to account for duration biases and other related issues, including the sensitivity of spectral moment values to background noise and vocalic context. Because nasal retroflexes and non-retroflexes mostly occur in different contexts where duration differences are expected irrespective of place of articulation, the duration-balanced set was restricted to segments shorter than 0.1 s (see above, Section 4). Figure 11 presents individual factor maps of this duration-balanced set and of the same set as above (Figure 10) without spectral moment values.
Individual factor maps of: above, a duration-balanced set (restricted to segments shorter than 0.1 s); below, the entire dataset without spectral moment values.

As can be seen in Figure 11, the acoustic distinction between retroflex and non-retroflex segments remains sharp whether the sets are balanced for duration or not. Nasal retroflexes remain negatively correlated with dimension 1, with non-retroflexes on the positive side of the same axis (the only exception being nasal palatal duration values). The main variable groups defining dimension 1 are now ‘formant values’ and ‘spectral moments,’ with retroflexes exhibiting once again lower F2 bandwidth values and higher F1 and F1 bandwidth values than their non-retroflex counterparts, along with higher skewness and kurtosis and a lower centre of gravity.Footnote 16 When spectral moment values are excluded from the analysis, a newly defined dimension 1 (mostly correlated with duration, slope, and bandwidth) is inversely correlated with the dataset’s retroflexes and directly correlated with their non-retroflex counterparts (except for labiodental and alveolar slope values, as well as alveolar bandwidth values, which tallies with the situation presented in Figure 9). Taken together, these supplementary analyses suggest that duration alone does not account for the retroflex/non-retroflex opposition in North Boma and show how other acoustic variables (chiefly bandwidth and formant values) contribute to informing the distinction.
MFA were also performed on the entire dataset with values measured at 10% and 90% of the sounds’ total duration, to account for the hypothesis advanced earlier in this section regarding flicking in the speech of Subject C; it has been mentioned (see above) that retroflexes can affect different targets throughout their articulation, with the tongue tip ‘flapping out’ of a curled-up position. In their typology of the sounds of the world’s languages, Ladefoged & Maddieson (Reference Ladefoged and Maddieson1996) claim that the ‘tongue tip first bends back into the retroflex position, and then, during the closure phase, straightens out somewhat, so that by the time of the release of the closure it is in a less extreme position’ (p. 28). This does not appear to be the case in North Boma; see Figure 12.
Individual factor maps of: above, the entire dataset with values measured at 10% of the sounds’ total duration; below, the entire dataset with values measured at 90% of the sounds’ total duration (see below).

The important similarities between the two planes at 10% and 90% of the sounds’ total duration indicate that nasal retroflexes in North Boma behave rather uniformly throughout their articulation, apart from slope and formant values (as would be expected in onset vs. offset position). Regardless, ‘retroflexion’ remains the most important variable in the definition of the planes, as was the case in all other MFA performed and shown above.
Based on the results summarised up to this point, North Boma nasal retroflexes constitute a discrete class within the language’s nasal inventory. Compared to their non-retroflex counterparts, they are significantly shorter, exhibit lower concentrations of energy in the spectrum with more energy concentrated around their centre of gravity (as well as more peaked energy concentrations), show higher values of F1 and F1 bandwidth and lower values of F2 bandwidth; they are not characterised by different acoustic properties in onset vs. offset position, suggesting that they do not in fact behave like quickly flicking flaps as had been hypothesised based on some features of the speech of Subject C. This, coupled with the phonological information provided above, backstops their characterisation by Stappers (Reference Stappers1986) as fully fledged nasal retroflexes.
5.4. Vowels
Nasal-adjacent vowels have also been analysed to account for coarticulation effects and to determine whether any effects attributable to proximity to a nasal retroflex can be detected (full results available in Appendix 2). Figure 13 compares duration values for the three cardinal vowels /a/, /i/, and /u/.
Average duration values for three nasal-adjacent cardinal vowels in North Boma.

All three vowels appear to be longer in pre-retroflex position, but only two of them (/a/ and /u/) display similar adjacency effects in post-retroflex position, where they are shorter.Footnote 17 A MFA was performed on the same vowels; the results are shown in Figure 14.
Individual factor map of the entire cardinal vowel dataset.

Retroflex adjacency is positively correlated with dimension 1 of the plane (which alone accounts for around one fourth of the set’s total inertia); however, as one can clearly see, the distinction is a lot less sharp than was observed for the consonants, with vowel quality effects (e.g. high vs. low) weighing more in the definition of the plane than vowel position. As a matter of fact, Table 3 clearly shows that of the two qualitative variables at hand, ‘position’ is a lot less significantly correlated with dimension 1 than ‘segment’.
Qualitative variables correlated with dimension 1 of the MFA summarised in Figure 14.

In other words, acoustic vowel measurements differ by vowel phoneme considerably more than by context. No specific effects of retroflexion could be detected on the nasal’s vocalic environment.
6. Diachronic phonology of North Boma nasal retroflexes
We now move away from phonetic analysis and turn to the discussion of the historical origins of /ɳ/ in North Boma; in Section 7, we present a comprehensive review of all results, both phonetic and diachronic-phonological.
Historically, /ɳ/ is the regular reflex of PB *n and *nd in C2 position within the root, as can be seen in 2.Footnote 18 In 2, slashes separate singular and plural forms of the same noun and hyphens show morphological segmentation of noun class prefixes and noun roots. In North Boma, /ɳ/ never occurs in C1 position within a C1V1C2V2(C3V3) template. Throughout this Section, a given North Boma synchronic form is posited as the reflex of a protoform. This protoform, conventionally preceded by an asterisk in historical linguistics, is accompanied by a number which identifies a unique entry in the Bantu Lexical Reconstruction (BLR) 2/3 database (Bastin et al. Reference Bastin, Coupez, Mumba and Schadeberg2002). This database contains nearly 10,000 Bantu lexical reconstructions of variable time depth (Bostoen & Bastin Reference Bostoen and Bastin2016). The meaning of a given reflex in North Boma is specified only when it differs from that of the protoform.

By contrast, /n/ in C1 is the regular reflex of PB *n as shown in 3. Note that *nd did not occur in C1 position in PB except across morpheme boundaries, that is, whenever *d was preceded by a homorganic class 9/10 nasal prefix N-. This noun class prefix was often reanalysed as part of the root as shown in 3; see, for example, Ø-ndúːɳú/ Ø-ndúːɳú, historically n-dúːɳú.

In North Boma, nasal + plosive sequences in C2 position underwent reduction in favour of the nasal, that is, *mb > /m/ (e.g. Ø-ndzàːmí ‘God’ (< BLR 3196 *jàmbé)), *ŋɡ > /ŋ/ (e.g. è‑káŋà/ŋ‑káŋà ‘guineafowl’ (< BLR 1720 *káŋɡà)). /ŋ/ is the only outcome of this cluster reduction process which further underwent total loss (/ŋ/ > Ø) in the vast majority of relevant lexical items; for example, è‑báá/m-báá ‘jaw, chin’ (< BLR 108 *báŋɡá). The reduction of NC+voice > N happened not only in North Boma but in many other West-Coastal Bantu languages (Pacchiarotti et al. Reference Pacchiarotti, Kouarata and Bostoen2024, Bostoen et al. Reference Bostoen, Pacchiarotti, Kouarata, Coutros, Doman, Sakala and Bostoen2025). Given the pervasiveness of /ɳ/ in the lexicon of North Boma, the most likely scenario is that this sound change occurred only after the simplification of *nd > /n/, once the historical simple nasal C2 *n had merged with *n historically originating from the simplification of C2 *nd.Footnote 20
In Bantu languages, the vowel preceding a nasal cluster (nasal + plosive) usually gets lengthened (Hyman Reference Hyman, Van de Velde, Bostoen, Nurse and Philippson2019). This can be seen in words such as n-síːɳí/n-síːɳí ‘squirrel’ and ŋ‑ɡɔ̀ːɳé/ŋ-ɡɔ̀ːɳé ‘crocodile’ in 2. In turn, lengthened vowels are an ideal phonetic environment for the emergence of diphthongs in West-Coastal Bantu languages (Koni Muluwa & Bostoen Reference Koni Muluwa and Bostoen2012, Pacchiarotti, Maselli & Bostoen Reference Pacchiarotti, Maselli and Bostoen2021). Indeed, there is evidence that diphthongisation of long vowels also happened in North Boma; see, for example, n‑sjɛ́ɳɛ́/n‑sjɛ́ɳɛ́ ‘thorn’ and kò-kwáɳ-à ‘to love’ in 2, but diphthongisation is also found in words containing historical short vowels preceding *n such as kò-kwáɳ-à ‘to plant’ in 1, as well as ì-kjáɳá/mà-kjáɳá ‘dance’ (< BLR 1807 *kɪ́nà) and kò-mjáɳ-à ‘to swallow’ (< BLR 2190 *mìn). This might have happened by way of analogy with historically lengthened vowels preceding nasal clusters while the merger *n, *nd > n was ongoing. Similarly, and perhaps also due to analogical change, not all vowels historically preceding a nasal cluster were lengthened; see, for example, mù-kàɳú/mì-kàɳú ‘news’ (< BLR 1706 *kàndá ‘letter’).Footnote 21
Nevertheless, there are a few lexical items which appear to have escaped the change *n, *nd > /ɳ/ in C2 and rather preserved /n/, giving rise to the minimal pair ɛkání ‘we had wished’ vs. ɛkáɳí ‘we had danced,’ which Stappers (Reference Stappers1986) uses to show that /ɳ/ contrasts with /n/ in C2 position in North Boma. In most instances, we find no readily identifiable conditioning environment that could have blocked this diachronic sound change. Although several nouns preserving /n/ in C2 end in /i/ as can be seen in 4, there are just as many cases where a final /i/ is preceded by /ɳ/, as shown in 5. In the same vein, the different vowels preceding C2 /n/ in 4 cannot be considered a conditioning environment preventing the merger *n, *nd > /ɳ/ from occurring because /u/, /ʊ/, and /a/ are also found in lexical items where C2 *n/*nd did become /ɳ/, see 2.

Additionally, three lexical items indicate that some of the few synchronic occurrences of /n/ in C2 position originate from PB *nj, phonetically probably [ɲɟ] or [ɲd͡ʒ], for example, kè-kánì/bè-kánì ‘hand’ (< BLR 1329 *ɡànjà), n-zén:é ‘cricket’ (< BLR 1583 *njénjé), or from PB *ny, phonetically probably [ɲ], for example, kò-ŋɔ́n-ɔ̀ ‘to twist’ (< BLR 1945 *kóny), kò-ɲán-à ‘to swim’ (< BLR *nyány). The fact that *n as the reflex of *nj and *ny did not merge with *n originating from either PB *n or *nd in C2 possibly indicates that the simplification *ɲɟ > ɲ and the merger with *ɲ > n occurred after the merger *n, *nd > n > ɳ. Otherwise, /n/ originating from *ɲ (from PB *ɲɟ and *ɲ) would have undergone retroflexion too.
Finally, we discuss occurrences of /ɳ/ in C3 position. In this position, /ɳ/ in North Boma is the reflex of a historical *n in the same phonotactic position, for example, mù-sámúɳù ‘six’ < (BLR 433 *cààmànò ‘six’), or the outcome of a common Bantu nasal harmony process whereby a stop becomes a nasal usually maintaining the same place of articulation as the stop, whenever the root contains a nasal consonant, for example, è-bɛ́mɛ́ɳɛ́/m-bɛ́mɛ́ɳɛ́ ‘mosquito’ (< BLR 7535 *bémbédé ‘mosquito’). In such cases, /d/ in a form such as *bémbédé underwent nasal harmony to *bémbéné in earlier stages of North Boma. Nasal harmony must have happened before the change *n > ɲ took place in order to account for the synchronic outcome è-bɛ́mɛ́ɳɛ́/m-bɛ́mɛ́ɳɛ́ ‘mosquito’. The same seriation of nasal harmony *d > n followed by retroflexion of *n > ɲ also occurred in verb stems with derivational suffixes such as *‑ad, *‑ɪd, and *‑ʊd and without any synchronically retrievable corresponding root. Some instances are: kò-zímàɳ-à ‘to forget’ (< BLR 5716 *dímbad ‘to forget’), kò-sɛ́mɔ̀ɳɔ̀ ‘to slip’ (< BLR 509 *cèdɪmʊk ‘to slip’, likely to have undergone metathesis to *cèmɪdʊk), è-ŋ-kfúmɛ̀ɳɛ̀ ‘stuttering’ (< BLR 5379 *kʊ́kʊmɪd ‘to stammer’), kò-kːámɔ̀ɳ-ɔ̀ ‘to squeeze’ (< BLR 1691 *kámʊd ‘to wring, to squeeze’); see also kò‑bímàɳ-à ‘to sleep’ (< BLR 6025 *bɪ́tam ‘to lie down’, likely to have undergone metathesis to *bɪ́mat).
Yet, there is evidence that in a few cases the nasal harmony process did give rise to /n/ instead of /ɳ/; see, for example, kò-zíɣìnà ‘to learn’ (< BLR 3338 *jɪ́ɡ ‘to learn, to imitate’), kò-záʁánè ‘to spread out in the sun’ (< BLR 3206 *jánɪk ‘to spread to dry in the sun’), and kò-sːíɣínè ‘push back’ (< BLR 2934 *tíndɪk ‘to push back’). The last two examples suggest that metathesis might have played a role in these seemingly irregular outcomes, for example, *jánɪk > jakɪn > jakan > záʁánè; *tíndɪk > tíkɪnd > tíkɪn > sːíɣínè. Footnote 22 Metathesis in verb stems is known to be common in Tiene (Ellington Reference Ellington1977, Hyman Reference Hyman, Wohlgemuth and Cysouw2010), one of North Boma’s closest relatives; see Figure 1.
Whatever the case might be, synchronically, the consonantal portion of a typical PB derivational suffix such as applicative *-ɪd always surfaces as /ɳ/ if the verb stem contains a nasal, see /kò-túm-ɪd-à/ ‘inf-send-appl-fv’ > [kòtúmɛ̀ɳɛ̀], /kò-tfúm-ɪd-a/ ‘inf‑sew-appl-fv’ > [kòtfúmɛ̀ɳɛ̀], but /kò-kàb-ɪd-a/ ‘inf-offer-appl-fv’ > [kòkàbɛ́rì]. Whenever the verb root contains /ɳ/ in C2 and is followed by an applicative suffix which is then realised as /ɳ/ due to nasal harmony, the outcome of a sequence of two [ɳ] after vowel apocope yields [nː]. This is shown in Table 4 with the synchronic derivation of the applicative form kò-mːánn-è [kòmːánːè] from its corresponding root kò-mːáɳ-à ‘to finish’.
Synchronic derivation of the applicative form kò-mːán-nè [kòmːánːè] from its corresponding root kò-mːáɳ-à ‘to finish’ in North Boma.

The emergence of [nː] out of a sequence of two [ɳ] is also observed with derivational suffixes other than the applicative. Compare kò-kfwáɳ-à ‘to bury’ (< BLR 2125 *kùnd ‘to bury’) and kò‑kfúnːò ‘to dig up’ (< BLR 2126 *kùnd-ʊd ‘to dig up’, derived from BLR 2125 *kùnd by the so-called reversive suffix *-ʊd; see Schadeberg & Bostoen Reference Schadeberg, Bostoen, Van de Velde, Bostoen, Nurse and Philippson2019). Based on the evidence we have gathered so far, one could imagine a chain of changes like the following: *kùndʊd > *kfú:nʊd > *kfú:ɳʊd > *kfúɳʊɳ/kfúɳʊn > *kfúɳɳ/kfúɳn > kfúnː.Footnote 23 The verb form kò-bːínːò ‘to dig up’ (< BLR 209 *bɪ́nd ‘obstruct’) probably underwent a similar chain of changes. Thus, it seems that C2 [nː] derives from a C1V1C2V2C3V3 templatic structure where C2 was /ɳ/ and C3V3 is a derivational suffix which underwent nasal harmony and was realised by default as /ɳ/.
In sum, /ɳ/ is a phonotactically restricted phoneme in North Boma which only occurs in C2/C3 position within a C1V1C2V2C3V3 template. Historically, /ɳ/ is the reflex of PB *n and *nd. The *nd sequence simplified to *n at some point in the history of this language and merged with PB *n. Both etymological *n as well as *n deriving from the cluster reduction *nd > n developed into /ɳ/ in C2/C3 position. In C1 position, PB *n and *nd were maintained as such. However, this merger did not affect all lexical items, so much so that some historical *n (whether from PB *n or *nd) were maintained as alveolar nasals in C2 instead of undergoing retroflexion. Other synchronic C2 /n/ in North Boma originate in PB C2 *nj, phonetically [ɲdʒ] or [ɲɟ], and PB *ny, phonetically [ɲ].
In the Appendix 1, we provide a comparative list of all lexical items we found which contain /ɳ/ or /n/ in C2 and C3 positions in the data from our fieldwork missions (2021 and 2022) as well as in the grammar sketch of Stappers (Reference Stappers1986).
7. Discussion
In this article, we have shown that nasal retroflexes in North Boma differ significantly from their non-retroflex counterparts. A first visual inspection of the available samples allowed us to identify a tendency for nasal retroflexes to display greater concentrations of energy in the lower regions of the spectrum and fewer or less identifiable higher-frequency intensity peaks, that is, less clear formant structure throughout the sound. Following this first step, a series of descriptive statistics were run to summarise the dataset. Nasal retroflexes were found to be shorter than their non-retroflex counterparts, and to exhibit lower F2, F3, and F4 average values than all other nasals in the set, while no effect of bandwidth could be identified at this stage, apart from F1 (greater F1 bandwidth values for retroflexes than non-retroflexes). This is at odds with the finding of Tabain et al. (Reference Tabain, Breen, Butcher, Jukes and Beare2016) that coronal nasals exhibit the lowest bandwidth values in their sample of Australian languages, and points to the presence of a more diffuse murmur, as well as a tighter (and more perpendicular to the palate) constriction in retroflex articulations in North Boma. Nasal retroflexes appear to have the sharpest F1 slopes both in onset and offset position, but no specific effect of retroflexion could be detected on F2 onset and offset slopes. Nasal retroflexes show higher skewness and kurtosis values than their non-retroflex counterparts, suggesting higher or more peaked concentrations of energy in the spectral area below their centroid frequency; lower centre of gravity values also appear to point in the same direction.
In order to substantiate these preliminary findings, a series of MFAs were performed on the dataset (quantitative variables grouped as follows: ‘duration’, ‘formant values’, ‘bandwidth values’, ‘slope values’, ‘spectral moments’; qualitative variables grouped as follows: ‘segment’, ‘retroflexion’). A first MFA, run on the relevant sounds’ median values, showed that the retroflex vs. non-retroflex opposition is better suited to explain the plane’s inertia than the ‘segment’ variable. Retroflexion was shown to be significantly correlated (inversely) with segment duration, F2 bandwidth, centre of gravity, and F2 offset slope values, and (positively) with skewness, kurtosis, F1 bandwidth, and F1. This indicates that North Boma nasal retroflexes are shorter than their non-retroflex counterparts and exhibit more energy concentrated in the lower regions of the spectrum, while no specific effect of retroflexion was found on F3.
This is interesting as it appears to set the North Boma case apart from others presented in the available typological literature (see Hussain et al. Reference Hussain, Proctor, Harvey and Demuth2017). Perhaps, this might indicate that retroflexes in North Boma have a relatively advanced constriction location. In line with the available acoustic literature (Stevens & Blumstein Reference Stevens and Blumstein1975), an F3–F4 pinch was observed, but no effect of F2–F3 convergence, which, again, sets the North Boma case apart from other well-documented cases (see Hamann Reference Hamann2002, Reference Hamann2003). Lower centre of gravity and standard deviation on the one hand, and higher skewness and kurtosis on the other, might indicate a position of the tongue perpendicular to the hard palate, which is consistent with the F3 findings (as a less retracted constriction location also requires less ‘curling’ of the tongue tip).
MFA were also performed on nasals with values sampled at the 10%- and 90%-duration temporal marks, to test whether retroflexion in North Boma were a dynamic articulation targeting different places at the sound’s onset and offset (Ladefoged & Maddieson Reference Ladefoged and Maddieson1996). This was not found to be the case, suggesting that nasal retroflexes in North Boma do not behave as quickly flicking flaps as we had previously hypothesised.
Vowel adjacency effects were also analysed. MFAs were performed on three cardinal vowels (/a/, /i/, and /u/). No significant effect of retroflexion was found on nasal-adjacent vowels. This also sets the North Boma case apart from other cases documented in the literature, where adjacency to a retroflex has been linked to lowered F3 values on the vowel.
While no other retroflexion phenomena could be found in the immediate vicinity of the North Boma area (with the exception of nasal retroflexes in closely related Nunu; see Section 3), some are detectable in the Bantu Lotwa languages of the last surviving Batwa groups of the eastern corner of Mai-Ndombe (Maselli Reference Maselli2024), where flapping as a realisation of intervocalic laterals is a common phonetic possibility, also attested in other Congo Basin Lotwa languages (see Bokula Reference Bokula1970, Kutsch Lojenga Reference Kutsch Lojenga1994, Motingea Reference Motingea2010). Although this is hard to prove given the absence of historical language data, the occurrence of nasal retroflexes in North Boma could be diagnostic of substrate interference through language shift (Thomason Reference Thomason and Brown2006). Those shifters might have been erstwhile Batwa people who once became part of the ancestral North Boma speech communities as L2 speakers whose L1 language was not a Bantu language but an indigenous language no longer attested. Another possibility is that the shifters might have come from the Ubangi-speaking area further north, where retroflex realisations of intervocalic laterals are also amply attested (see, e.g., Bouquiaux & Thomas Reference Bouquiaux, Thomas, Clermont-Ferrand and Mounin1977:216f, 220). In support of this hypothesis, recent population genetic research shows that some West-Coastal and Central-Western Bantu speech communities in the vicinity of the North Boma area display a specific component in their genetic make-up that points to past admixture with Ubangi speakers (Fortes-Lima et al. Reference Fortes-Lima, Pacchiarotti, Maselli, Donzo, Kouarata, Muluwa, Mundeke, Bostoen, Schlebusch, Coutros, Doman, Sakala and Bostoen2025).
In the process of foreign language acquisition, some degree of structural phonological impact of source languages on recipient languages is very common and known as ‘imposition’ under ‘source language agentivity’ (Van Coetsem Reference Van Coetsem1988). If these foreign language speakers shifted in sufficiently large numbers to ancestral North Boma, the imposition of the phonotactic structure of their non-Bantu source language on their Bantu recipient language would have undergone horizontal (through space) and vertical (through time) transmission along with the language community itself. While the overall rarity of nasal retroflexes in Bantu is a first indication of loan phonology, their positional restrictions are further evidence of the contact-induced intrusion of a phonotactic constraint from a non-Bantu source language, and so is our acoustic finding concerning their apparent salience within North Boma nasals. As a matter of fact, as Blevins (Reference Blevins and Hickey2017:12) puts it, ‘the more salient the phonetic pattern, the more likely it will spread areally’ (see also Fleischhacker Reference Fleischhacker2000, Kenstowicz Reference Kenstowicz2003a,Reference Kenstowiczb, Steriade Reference Steriade, Hume and Johnson2001a,Reference Steraideb, Kang Reference Kang2002, among others). To what extent retroflexion is stable in the Mai-Ndombe languages which display it is a matter for further research. In fact, while /ɳ/ appears in C2 (or, less often, C3) position within a C1V1C2V2C3V3 template, our comparative data suggest that /ɳ/ is not equally frequent in all varieties (see Appendix 1).
Even if /ɳ/ was originally a loan phoneme, this does not mean that it is found in loanwords—quite the opposite, as it did not enter the language through lexical borrowings from an unknown source language. Thanks to our diachronic phonological analysis, we could determine that /ɳ/ is the regular reflex of both PB *n and *nd in word-final position, that is, C2 in disyllabic stems or C3 in trisyllabic stems. While the regularity of the sound change points towards a firm integration of this alleged loan phoneme into North Boma’s sound system, its restriction to word-final position might betray the phonotactics of a non-Bantu substrate language. Additionally, the regular correspondence of /ɳ/ to both PB *n and *nd informs us about the sound shift’s relative chronology: this must have happened after the reduction of nasal - voiced oral stop (NC + voice) clusters such as *nd to simple nasals like *n. This type of consonant cluster simplification is widespread in the Bantu languages of the Lower Kasai region (Pacchiarotti et al. Reference Pacchiarotti, Kouarata and Bostoen2024). Since this simplification also occurs in North Boma’s closest relatives, namely Mpe (B821), Nunu (B822), and Tiene (B81), it probably took place in the most recent common ancestor of these four languages. However, /ɳ/ itself is not attested in North Boma’s closest relatives except Nunu. Consequently, its adoption in the sound inventory of North Boma (and Nunu) must, all in all, be a relatively recent phenomenon, which reinforces our hypothesis of a contact-induced origin. Tse (Reference Tse2015) also posits shift-induced substrate interference for the adoption of retroflex nasal + consonant clusters, that is, /ɳʈ/ and /ɳɖ/, in Somali Bantu Kizigua (G111), though here the putative source language would be another Bantu language, namely Chimwiini, commonly considered to be a northern Swahili variety (Nurse & Hinnebusch Reference Nurse and Hinnebusch1993).
8. Conclusions
The present contribution represents the first in-depth analysis of a severely understudied class of sounds—nasal retroflexes—in a severely understudied Bantu language, namely North Boma, spoken in a severely understudied area of the planet—the Mai-Ndombe Province of the DRC. By integrating low-level phonetics and synchronic and diachronic phonology, we have been able to push our analysis of nasal retroflexes beyond the scope of each individual field.
Our original fieldwork with different North Boma speakers allowed us to document the nasal retroflex /ɳ/, which is rare both in Bantu and in the rest of the world’s languages, and to confirm the phonemic status of this sound as reported by Stappers (Reference Stappers1986). Our comparative synchronic study also showed that this sound is not equally frequent across speakers and varieties of North Boma, suggesting a position of particular volatility in the language’s consonantal inventory. The cross-speaker and cross-variety instability of /ɳ/ in present-day North Boma could suggest that this sound was originally a loan phoneme. In support of this hypothesis, other retroflex sounds such as [ɽ] have been found in Bantu languages spoken by several Batwa communities in the wider area, commonly considered the descendants of populations who already lived in the region before the arrival of Bantu speakers. Hence, phonological substrate interference from shifting non-Bantu speakers could well be the historical source of North Boma /ɳ/.
By going beyond historical phonology and grounding our findings in acoustics, using, among other features, advanced methods of statistical analysis such as MFA (a first in the region), we have been able to show that retroflexes in North Boma are a particularly salient class of nasals. The retroflex/non-retroflex opposition is the most significant one in explaining our acoustic dataset’s variance regardless of duration and spectral moment values. This reinforces the hypothesis that the nasal retroflex is in fact a loan phoneme integrated into the North Boma inventory through contact, in the light of Blevins’s (Reference Blevins and Hickey2017) observations on the impact of acoustic salience on the ease of spread of phonetic patterns.
Finally, our factorial overview of the main acoustic correlates of retroflexion in North Boma shows that our data both match and flout acoustic expectations. These key typological data from a severely under-researched area of the world contribute to the debate on the acoustics of retroflex consonants in the world’s languages. Admittedly, considerably more research remains to be conducted, specifically aimed at the collection of articulatory data to further ground the acoustic considerations presented here. The possibility of perceptual studies should also be explored if we are to further assess the degree of salience of retroflexion in North Boma. Additional evidence should be collected on neighbouring Nunu, where nasal retroflexes have also been detected in our preliminary fieldwork data.
Acknowledgments
The present contribution is offered in memory of Mr. Léon Mabwakha ma Bonkako. Mr. Mabwakha died in a car accident on October 30, 2022, a couple of months after we last worked with him in Kinshasa. He wrote several booklets on the culture, history, and language of the North Boma people. He was an excellent speaker of North Boma, astonishingly aware of the sounds of his language. He designed his own North Boma orthography, where [ɳ] is transcribed as <nr> and the [ʁ] contained in his family name as <kh>. We also wish to acknowledge the help of multiple anonymous reviewers who have contributed to improving on our original research design.
Data availability statement
The supplementary data files are available on OSF: https://osf.io/cmezd/?view_only=a0465124c79a4782bad819%20a830d21f0e.
Conflict of interest statement
The authors declare no conflicts of interest.
Funding disclosure statement
The first author acknowledges the support of FWO (Fonds Wetenschappelijk Onderzoek) Ph.D. fellowship no. 11D7223N. The second author is a Research Associate of the FNRS (Fonds de la Recherche Scientifique), which she wishes to acknowledge here. The fourth author acknowledges the support of FWO postdoctoral fellowship no. 12ZV721N. The different fieldwork trips for this research were funded by an ERC Consolidator Grant no. 724275 within the Horizon 2020 Research and Innovation program granted to the last author.
Ethics statement
The authors declare that the research presented in this article has been conducted in accordance with the ethical requirements of Universiteit Gent and Université de Mons.
Appendix 1: Words with /ɳ/ or /n/ in C2 and C3 position across three North Boma varieties
This Appendix presents all lexical items containing either /ɳ/ or /n/ in C2 and C3 position across three North Boma varieties, i.e. those documented in Stappers (Reference Stappers1986) and our own fieldwork missions of 2021 and 2022. The reader will see that the variety we documented in 2022 is (nearly) identical to the one documented by Stappers (Reference Stappers1986). Lexical items in this Appendix are ordered alphabetically by concept name. All words are transcribed using the International Phonetic Alphabet (IPA), except in Stappers (Reference Stappers1986) where <y> = [j], <r> = [ɽ], and <j> [ɟ]. In Stappers (Reference Stappers1986) and Fieldwork 2021, low tone is left unmarked. The last column presents the historical form of which the lexical items on the same row are likely to be the reflex. All historical forms with an index number are taken from the Bantu Lexical Reconstructions (BLR) 2/3 database (Bastin et al. Reference Bastin, Coupez, Mumba and Schadeberg2002). Those without an index number are tentative reconstructions based on comparative evidence from West-Coastal and Central-Western Bantu branches. A blank cell indicates lack of data. An em-dash — means that in a given variety the concept is expressed by a root which does not contain /ɳ/ or /n/ in C2/C3 position.
As the reader will notice, our comparative data suggest that /ɳ/ is not equally frequent across varieties. We found that, out of 104 collected in 2022, eighty-two had /ɳ/ in C2/C3 (79%) and twenty-two had /n/ in C2/C3 (21%). Similarly, of the sixty-one lexical items having /ɳ/ or /n/ in C2/C3 in Stappers (Reference Stappers1986), fifty-three have /ɳ/ (87%) and eight /n/ (13%). By contrast, out of the seventy-seven lexical items collected in 2021, forty have /ɳ/ (52%) and thirty-seven have /n/ (48%). North Boma speakers who participated in the 2021 elicitation sessions were younger than the speaker we worked with in 2022 and have lived away from their community and in non-rural environments for longer than he had. It is possible that these younger speakers are losing the nasal retroflex by producing it as an alveolar, possibly under the influence of speakers of other languages of the region which do not have nasal retroflexes in their phonological inventories. It is worth noting that our 2022 speaker never produced /n/ as a free variant of /ɳ/ in C2 position.

Appendix 2: Full acoustic data
This Appendix contains all acoustic data for the six nasal places of articulation present in North Boma. All measurements (except slopes and duration) consist of the median of the values calculated over the duration of the consonant (from 10% to 90% of its duration).


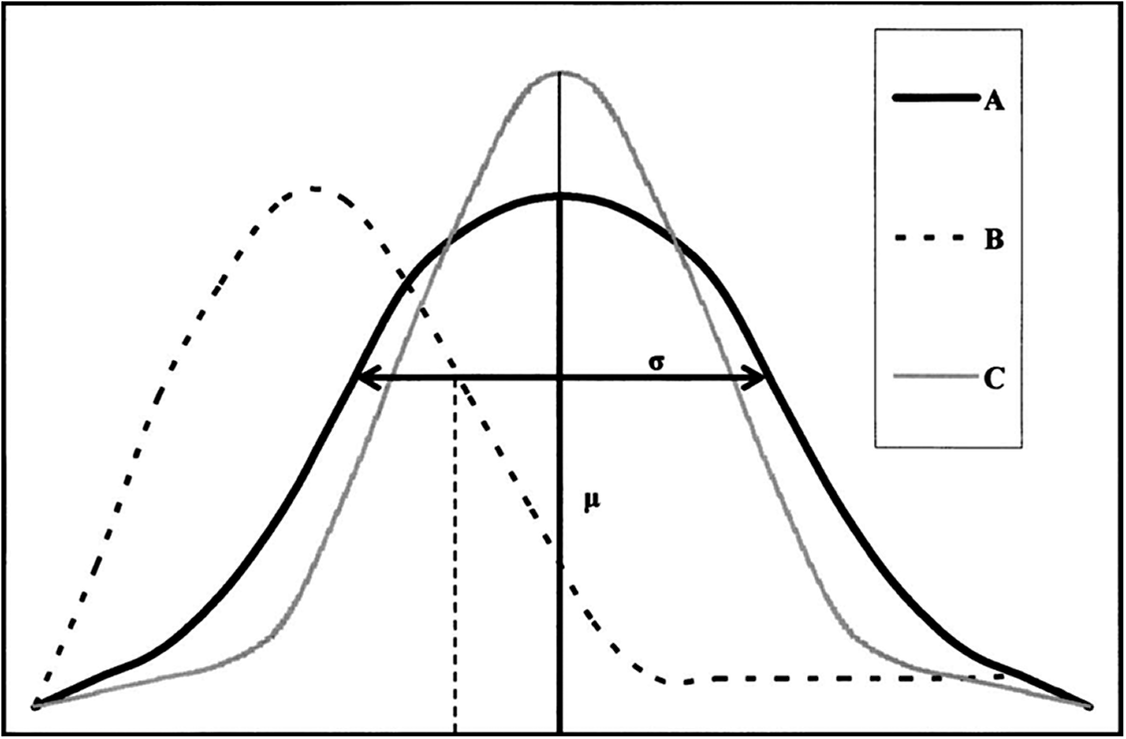


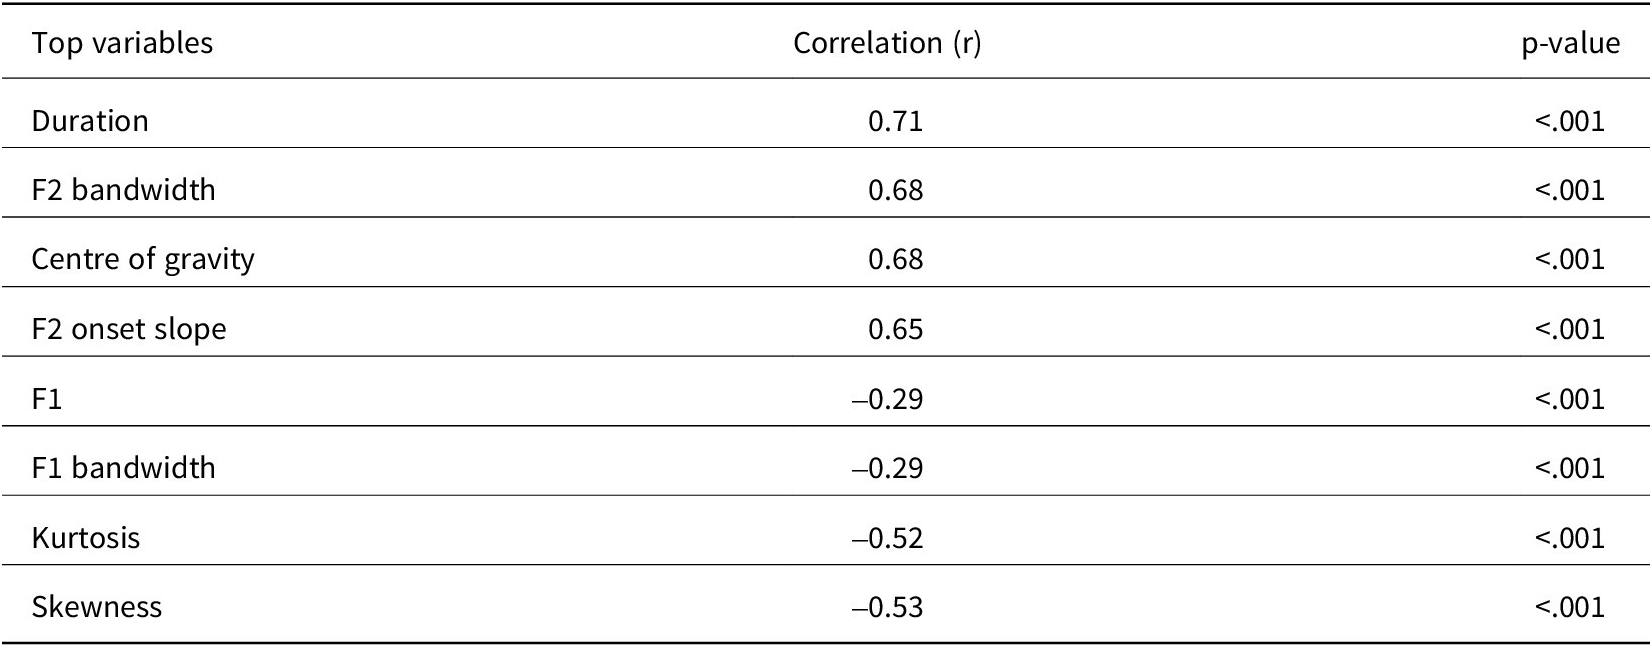


 Open access