1. Introduction
Clusters of galaxies are large virialised structures that reside at the intersection of cosmic filaments. The formation of galaxy clusters is thought to be hierarchical through mergers and accretion (Peebles Reference Peebles1980), and cluster mergers represent some of the largest, most energetic collisions in the known Universe. Clusters have been found to host a number of radio-emitting sources with steep synchrotron emission spectra implying aged electron populations (see e.g., Pacholczyk Reference Pacholczyk1970; Tribble Reference Tribble1993; Enßlin & Gopal-Krishna Reference Enßlin and Gopal-Krishna2001; Kempner et al. Reference Kempner, Blanton, Clarke, Enßlin, Johnston-Hollitt, Rudnick, Reiprich, Kempner and Soker2004). Both centrally located radio halo sources and peripherally located radio relic sources are thought to be associated with inter-cluster mergers or otherwise similarly energetic and turbulent events (see van Weeren et al. Reference van Weeren, de Gasperin, Akamatsu, Brüggen, Feretti, Kang, Stroe and Zandanel2019a, for a review).
Halos, relics, and other types of steep-spectrum cluster sources have been well studied over the last two decades. Enßlin & Gopal-Krishna (Reference Enßlin and Gopal-Krishna2001) propose for radio relics that adiabatic compression of remnant radio galaxy lobes by shocks in the intra-cluster medium (ICM) is responsible for radio relic sources such as that in Abell 85 (Slee & Reynolds Reference Slee and Reynolds1984; Slee et al. Reference Slee, Roy, Murgia, Andernach and Ehle2001) or Abell 4038 (Slee & Roy Reference Slee and Roy1998); however, for megaparsec-scale radio relics, a different physical process may be the cause. Diffusive shock acceleration (Fermi Reference Fermi1949; Jones & Ellison Reference Jones and Ellison1991) is consistent with the spectral features of megaparsec-scale radio relics (see e.g., Johnston-Hollitt Reference Johnston-Hollitt2003; van Weeren et al. Reference van Weeren, Röttgering, Brüggen and Hoeft2010, Reference van Weeren2016) and shocks have been observed at the locations of some relics. These two types of relics are distinguished as phoenices and radio shocks (see van Weeren et al. Reference van Weeren, de Gasperin, Akamatsu, Brüggen, Feretti, Kang, Stroe and Zandanel2019a, but also Kempner et al. Reference Kempner, Blanton, Clarke, Enßlin, Johnston-Hollitt, Rudnick, Reiprich, Kempner and Soker2004). Radio halo type sources can also be broken into two classes: giant radio halos and mini-halos; the distinction here is less about physical process as both are thought to be caused by turbulence in the ICM through a second-order Fermi process (Fermi Reference Fermi1954; Brunetti et al. Reference Brunetti, Setti, Feretti and Giovannini2001; Gitti et al. Reference Gitti2015).
While the physical (re-)acceleration mechanisms are understood, the origin of the seed electrons for the emission is still not entirely clear. The synchrotron-emitting electrons have been proposed as the thermal pool of electrons in ICM (i.e., the hot plasma, though this has issues related to Coulomb losses; Petrosian Reference Petrosian2001), left-over from old active galactic nuclei (AGN; see e.g., Shimwell et al. Reference Shimwell, Markevitch, Brown, Feretti, Gaensler, Johnston-Hollitt, Lage and Srinivasan2015; van Weeren et al. Reference van Weeren2017; de Gasperin et al. Reference de Gasperin2017), or electrons created in proton–proton collisions (Dennison Reference Dennison1980). The seed for phoenices and mini-halos are almost certainly AGN, despite any difference in final (re-)acceleration process, the larger-scale halos and relics may require a similar origin.
As halos, relics, and similar types of emission are usually detected with low surface brightness and steep, mostly power law spectra, radio interferometers such as the Murchison Widefield Array (MWA; Tingay et al. Reference Tingay2013) in remote Western Australia are well suited at detecting and characterising such emission (e.g., Hindson et al. Reference Hindson2014; George et al. Reference George2017; Duchesne et al. Reference Duchesne, Johnston-Hollitt, Offringa, Pratt, Zheng and Dehghan2017; Zheng et al. Reference Zheng, Johnston-Hollitt, Duchesne and Li2018). In 2017, the GaLactic and Extragalactic All-sky MWA survey (Wayth et al. Reference Wayth2015; Hurley-Walker et al. Reference Hurley-Walker2017) was released, unveiling myriad new candidate halos and relics (Johnston-Hollitt et al. in preparation), as well as giving unprecedented spectral coverage to previously detected halos and relics in the Southern Sky.
One such galaxy cluster, Abell 1127, was found to host diffuse radio emission within the 72–231 MHz GaLactic and Extragalactic All-sky MWA (GLEAM) survey images and was found as part of a targeted search for halos and relics within clusters from the Abell catalogues (ACO; Abell, Corwin, & Olowin Reference Abell, Corwin and Olowin1989), the Meta-Catalogue of X-ray detected Clusters of galaxies (MCXC; Piffaretti et al. Reference Piffaretti, Arnaud, Pratt, Pointecouteau and Melin2011), and the Planck Sunyaev–Zel’dovich cluster catalogue (PSZ1; Planck Collaboration et al. 2015). This particular example is complete with archival X-ray data from the Chandra observatory and given its location above the equator has good coverage from northern optical surveys.
In this paper, we will investigate the diffuse radio source within Abell 1127 (located at  $10\hour54\minute14\fs4$
,
$10\hour54\minute14\fs4$
,  $+14\degr38\arcmin34\farcs8$
) and the cluster itself, from radio to X-ray wavelengths to determine its nature. We assume a Lambda Cold Dark Matter cosmology, with
$+14\degr38\arcmin34\farcs8$
) and the cluster itself, from radio to X-ray wavelengths to determine its nature. We assume a Lambda Cold Dark Matter cosmology, with  $H_0 = 70$
km s–1 Mpc–1,
$H_0 = 70$
km s–1 Mpc–1,  $\Omega_\textrm{m} = 0.3$
, and
$\Omega_\textrm{m} = 0.3$
, and  $\Omega_\Lambda = 1-\Omega_\textrm{m}$
.
$\Omega_\Lambda = 1-\Omega_\textrm{m}$
.
1.1. Abell 1127 and associated clusters
Abell 1127 ( $10\hour54\minute09\ensuremath{^\textrm{s}}$
,
$10\hour54\minute09\ensuremath{^\textrm{s}}$
,  $+14\degr40\arcmin00\ensuremath{^{\prime\prime}}$
; Abell et al. Reference Abell, Corwin and Olowin1989) is detected as a Planck-SZ source (10h54m18s.1
$+14\degr40\arcmin00\ensuremath{^{\prime\prime}}$
; Abell et al. Reference Abell, Corwin and Olowin1989) is detected as a Planck-SZ source (10h54m18s.1  $+14$
°39ʹ21ʹʹ, with positional uncertainty of
$+14$
°39ʹ21ʹʹ, with positional uncertainty of  ${\sim}2.4$
arcmin; Planck Collaboration et al. 2016), designated as PSZ2 G231.56
${\sim}2.4$
arcmin; Planck Collaboration et al. 2016), designated as PSZ2 G231.56 $+$
60.03. A spectroscopic redshift is reported by Wen, Han, & Liu (Reference Wen, Han and Liu2012) of
$+$
60.03. A spectroscopic redshift is reported by Wen, Han, & Liu (Reference Wen, Han and Liu2012) of  $z_\textrm{spec}=0.2994$
. However, the cluster is also used as part of the SOARFootnote a Gravitational Arc Survey (SOGRAS; Furlanetto et al. Reference Furlanetto2013), wherein a photometric redshift of
$z_\textrm{spec}=0.2994$
. However, the cluster is also used as part of the SOARFootnote a Gravitational Arc Survey (SOGRAS; Furlanetto et al. Reference Furlanetto2013), wherein a photometric redshift of  $z_\textrm{phot} = 0.328$
is determined. Despite the difference in redshift, we consider this as a single-cluster system. The system has not previously been described as merging, and no diffuse, non-thermal radio emission has been found to be associated with the cluster.
$z_\textrm{phot} = 0.328$
is determined. Despite the difference in redshift, we consider this as a single-cluster system. The system has not previously been described as merging, and no diffuse, non-thermal radio emission has been found to be associated with the cluster.
2. Data
A plethora of all-sky and large-area astronomical surveys are available, many of which we make use of here. As well as survey data, we have dedicated observations with the MWA and archival data from the Chandra X-ray observatory and the Karl G. Jansky Very Large Array (VLA). We will introduce and describe the various data products in this section.
2.1. Surveys
2.1.1. Radio surveys
Three radio surveys are used explicitly in this work: The NRAOFootnote b VLA Sky Survey (NVSS; Condon et al. Reference Condon, Cotton, Greisen, Yin, Perley, Taylor and Broderick1998), which covers the entire sky north of  $\delta_{\textrm{J2000}} \geq -40^\circ$
at 1.4 GHz; the Faint Images of the Radio Sky at Twenty-centimetres (FIRST; Becker, White, & Helfand Reference Becker, White and Helfand1995; White et al. Reference White, Becker, Helfand and Gregg1997; Helfand, White, & Becker Reference Helfand, White and Becker2015), mostly located in the Northern Sky and also at 1.4 GHz, the TIFR GMRTFootnote c Sky Survey Alternative Data Release (TGSS-ADR1; Intema et al. Reference Intema, Jagannathan, Mooley and Frail2017), covering the sky north of
$\delta_{\textrm{J2000}} \geq -40^\circ$
at 1.4 GHz; the Faint Images of the Radio Sky at Twenty-centimetres (FIRST; Becker, White, & Helfand Reference Becker, White and Helfand1995; White et al. Reference White, Becker, Helfand and Gregg1997; Helfand, White, & Becker Reference Helfand, White and Becker2015), mostly located in the Northern Sky and also at 1.4 GHz, the TIFR GMRTFootnote c Sky Survey Alternative Data Release (TGSS-ADR1; Intema et al. Reference Intema, Jagannathan, Mooley and Frail2017), covering the sky north of  $\delta_\textrm{J2000} \gtrsim -53^\circ$
centred at 150 MHz. We also utilise low-resolution images from both the NVSS and TGSS ADR1 by convolving full-resolution images to a final resolution of
$\delta_\textrm{J2000} \gtrsim -53^\circ$
centred at 150 MHz. We also utilise low-resolution images from both the NVSS and TGSS ADR1 by convolving full-resolution images to a final resolution of  $100\,\text{arcsec} \times 100\,\text{arcsec}$
to match closely to MWA-2 data.
$100\,\text{arcsec} \times 100\,\text{arcsec}$
to match closely to MWA-2 data.
2.1.2. Optical surveys
The region surrounding the Abell 1127 system is covered by the Sloan Digital Sky Survey Data III, Data Release 12 (SDSS III, DR12; York et al. Reference York2000; Eisenstein et al. Reference Eisenstein2011; Alam et al. Reference Alam2015), with 158 sources with redshifts available within 7 Mpc of the diffuse radio source of interest.
2.2. VLA S-band data
In June 2017, Abell 1127 was observed with the VLA in S-band (2–4 GHz) in the C configuration for  ${\sim}24$
min (Proposal ID 17A-308, PI T. Cantwell). S-band is split into 16 subbands of 128 MHz, and each subband is calibrated independently. Calibration and radio frequency interference (RFI) flagging is performed following standard procedures for VLA data using the Common Astronomy Software Applications (CASA) package (McMullin et al. Reference McMullin, Waters, Schiebel, Young, Golap, Shaw, Hill and Bell2007). 3C 286 is used for flux scale calibration using the Perley & Butler (Reference Perley and Butler2017) scale (itself based on the flux density scale of Baars et al. Reference Baars, Genzel, Pauliny-Toth and Witzel1977), and 3C 241 is used for phase calibration, bracketing the source observations. Eight subbands are not used due to RFI contamination or calibration problems. The remaining eight subbands are imaged using the widefield imager WSClean (Offringa et al. Reference Offringa2014; Offringa & Smirnov Reference Offringa and Smirnov2017),Footnote d jointly deconvolving the eight subbands and creating a model in each band which is used for self-calibration with CASA. We perform three rounds of phase-only self-calibration followed by a round of phase and amplitude self-calibration. Data are imaged with a natural weighting, providing the best sensitivity to point sources in this configuration, creating a fullband image centred at 3.063 GHz. No extended emission is seen at the location of the diffuse emission seen in the GLEAM data. We subtract the naturally weighted model from the visibilities and re-image with a 25-arcsec Gaussian taper to try to highlight extended structure, finally convolving the resulting image to a final resolution of
${\sim}24$
min (Proposal ID 17A-308, PI T. Cantwell). S-band is split into 16 subbands of 128 MHz, and each subband is calibrated independently. Calibration and radio frequency interference (RFI) flagging is performed following standard procedures for VLA data using the Common Astronomy Software Applications (CASA) package (McMullin et al. Reference McMullin, Waters, Schiebel, Young, Golap, Shaw, Hill and Bell2007). 3C 286 is used for flux scale calibration using the Perley & Butler (Reference Perley and Butler2017) scale (itself based on the flux density scale of Baars et al. Reference Baars, Genzel, Pauliny-Toth and Witzel1977), and 3C 241 is used for phase calibration, bracketing the source observations. Eight subbands are not used due to RFI contamination or calibration problems. The remaining eight subbands are imaged using the widefield imager WSClean (Offringa et al. Reference Offringa2014; Offringa & Smirnov Reference Offringa and Smirnov2017),Footnote d jointly deconvolving the eight subbands and creating a model in each band which is used for self-calibration with CASA. We perform three rounds of phase-only self-calibration followed by a round of phase and amplitude self-calibration. Data are imaged with a natural weighting, providing the best sensitivity to point sources in this configuration, creating a fullband image centred at 3.063 GHz. No extended emission is seen at the location of the diffuse emission seen in the GLEAM data. We subtract the naturally weighted model from the visibilities and re-image with a 25-arcsec Gaussian taper to try to highlight extended structure, finally convolving the resulting image to a final resolution of  $100\,\text{arcsec} \times 100\,\text{arcsec}$
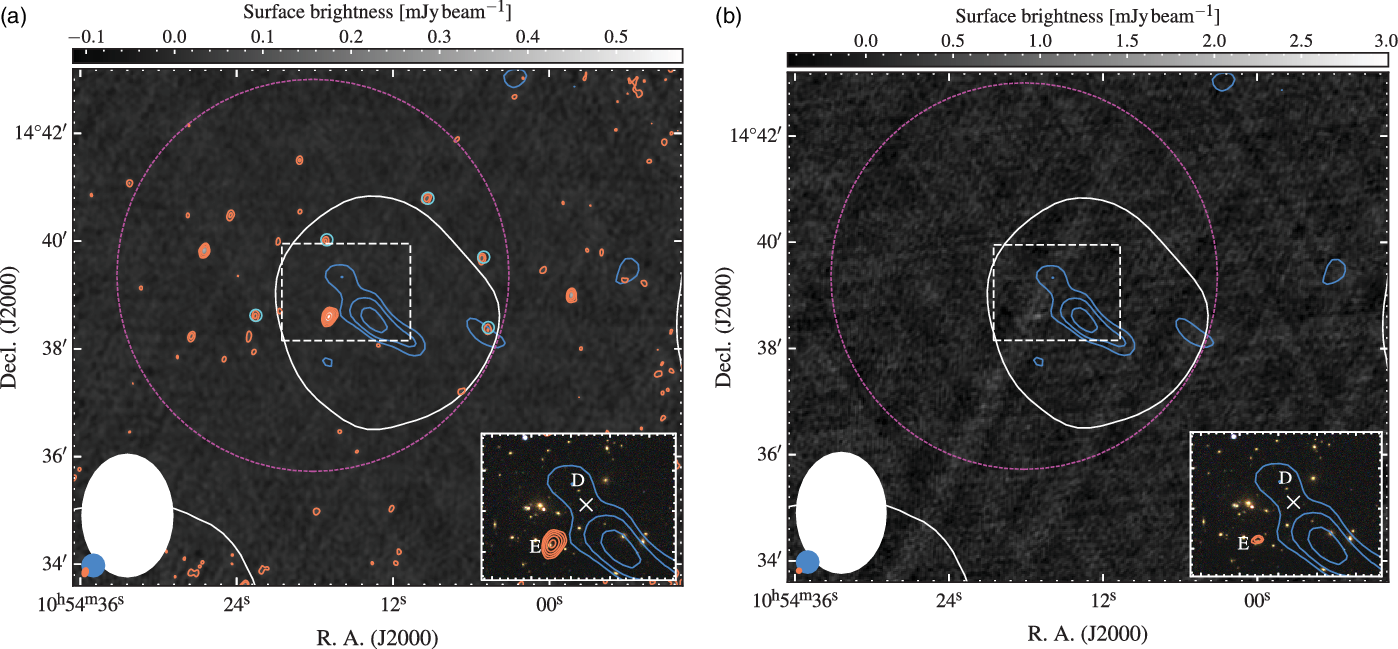
. The naturally weighted image prior to source subtraction is shown in Figure 1(a).
$100\,\text{arcsec} \times 100\,\text{arcsec}$
. The naturally weighted image prior to source subtraction is shown in Figure 1(a).
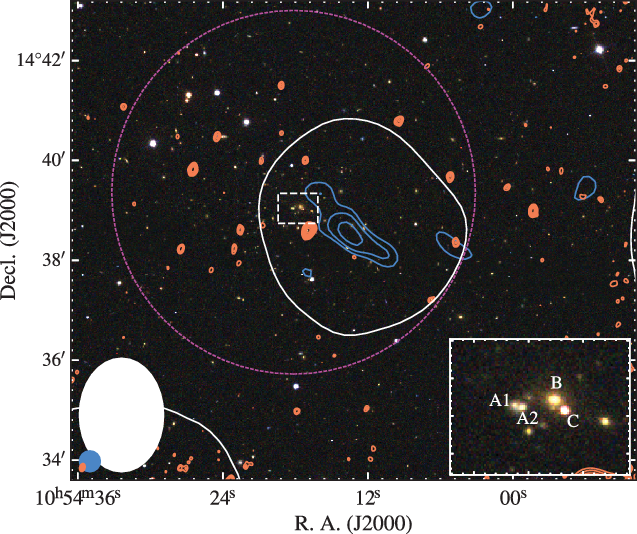
VLA GHz view of the cluster region. (a) The background is the 3.063 GHz VLA S-band map prior to source subtraction. Orange contours start at  $4\sigma_\textrm{rms}$
(
$4\sigma_\textrm{rms}$
( $\sigma_\textrm{rms} = 11.5$ $\mu$
Jy beam–1
) increasing with factors of 2. The cyan circles denote discrete sources that affect the MWA measurements as discussed in the main text. (b) FIRST survey image background of the same region. In both panels, the magenta circle is as in Figure 4. The single white contour is the 154-MHz MWA-2 data at
$\mu$
Jy beam–1
) increasing with factors of 2. The cyan circles denote discrete sources that affect the MWA measurements as discussed in the main text. (b) FIRST survey image background of the same region. In both panels, the magenta circle is as in Figure 4. The single white contour is the 154-MHz MWA-2 data at  $3\sigma_\textrm{rms}$
, and the blue contours are the TGSS data starting at
$3\sigma_\textrm{rms}$
, and the blue contours are the TGSS data starting at  $3\sigma_\textrm{rms}$
increasing with factors of
$3\sigma_\textrm{rms}$
increasing with factors of  $\sqrt{2}$
. The coloured ellipses in the lower right of each panel are of the respective beam shapes, with smallest, orange beam being the VLA data. The dashed, white box indicates the location of the inset panels. Sources ‘E’ and ‘D’ are discussed in the text.
$\sqrt{2}$
. The coloured ellipses in the lower right of each panel are of the respective beam shapes, with smallest, orange beam being the VLA data. The dashed, white box indicates the location of the inset panels. Sources ‘E’ and ‘D’ are discussed in the text.
2.3. MWA-2 data
Abell 1127 was observed as part of a MWA project G0045Footnote e during the 2018A observing semester. During this semester, the MWA was operating in the ‘extended’ configuration, part of the Phase II upgrade (Wayth et al. Reference Wayth2018, hereafter MWA-2) that occurred in 2017 adding tiles (antennas) out to  ${\sim}5$
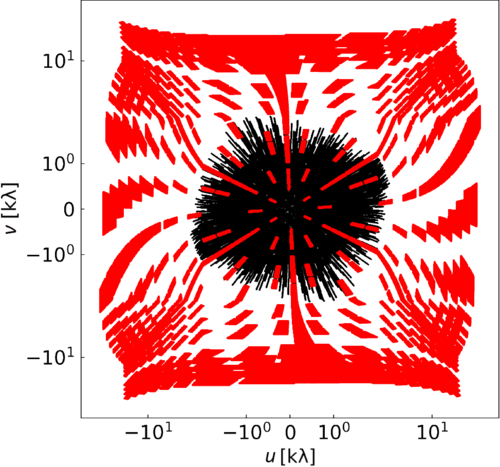
km improving the resolution of the array at a small cost to surface brightness sensitivity. Figure 2 shows the monochromatic u–v coverage for a single 2-min snapshot at 154 MHz illustrating the completeness of the u–v coverage with the MWA-2. In addition to the G0045 observations, we make use of snapshots taken as part of the MWA-2 GLEAM survey (GLEAM-eXtended) where they overlap with the position of A1127 to increase sensitivity. Pertinent observation information is provided in Table 1. A set of between 50 and 56 2-min snapshots for each of the 5 observing frequencies (at 88, 118, 154, 185, and 216 MHz) were taken across the two projects and across a number of observing nights, though in practice because of poor ionospheric conditions some snapshots were rendered unusable.Footnote f Over half of the snapshots taken in the lowest frequency band were rendered unusable with current processing techniques.
${\sim}5$
km improving the resolution of the array at a small cost to surface brightness sensitivity. Figure 2 shows the monochromatic u–v coverage for a single 2-min snapshot at 154 MHz illustrating the completeness of the u–v coverage with the MWA-2. In addition to the G0045 observations, we make use of snapshots taken as part of the MWA-2 GLEAM survey (GLEAM-eXtended) where they overlap with the position of A1127 to increase sensitivity. Pertinent observation information is provided in Table 1. A set of between 50 and 56 2-min snapshots for each of the 5 observing frequencies (at 88, 118, 154, 185, and 216 MHz) were taken across the two projects and across a number of observing nights, though in practice because of poor ionospheric conditions some snapshots were rendered unusable.Footnote f Over half of the snapshots taken in the lowest frequency band were rendered unusable with current processing techniques.
The typical u–v coverage of a single 2-min snapshot at 154 MHz (the central band) with 30 MHz bandwidth (black) with the VLA S-band u–v coverage overlaid (red). Note the symmetric logarithmic scale used for both axes to highlight the overlap.
Data processing is largely done using the purpose-written Phase II Pipeline (piipFootnote g) and skymodelFootnote h code once data have been pre-processed. The following sections outline this process and the various software involved.
2.3.1. Pre-processing
Data are recorded by the telescope in 2-min snapshots as the primary beam varies with time and this allows primary beam correction with current tools. The downside of this observing strategy is that each 2-min snapshot must be calibrated and imaged individually. Data processing is performed at the Pawsey Supercomputing CentreFootnote i in Perth, Western Australia, which conveniently also hosts the raw visibilities sent directly via fibre from the Murchison Radio-astronomy Observatory. For each snapshot, the following process is used to generate a calibrated, primary beam corrected image: data are staged using the MWA All-Sky Virtual Observatory.Footnote j The MWA ASVO system converts raw telescope products to the more standard ‘MeasurementSet’ format using the cotter software developed by A. O. Offringa and performs preliminary RFI flagging using the AOFlagger software (Offringa, van de Gronde, & Roerdink Reference Offringa, van de Gronde and Roerdink2012).Footnote k Additional bad tiles and channels are manually flagged prior to calibration, then again prior to imaging if any bad data present itself.
2.3.2. Initial calibration
As the field of view of the MWA at all frequencies is  $>20^\circ$
, every snapshot contains a large number of sources which often allows infield calibration, which is made even easier when bright extragalactic sources (e.g., Virgo A) lie within the main lobe of the primary beam. Generally, MWA calibration requires peeling of bright (
$>20^\circ$
, every snapshot contains a large number of sources which often allows infield calibration, which is made even easier when bright extragalactic sources (e.g., Virgo A) lie within the main lobe of the primary beam. Generally, MWA calibration requires peeling of bright ( $>25$
Jy) sources outside of the image field of view, and in the case of this field the Galactic Plane becomes a source of sidelobe noise at the high end of the MWA band. To counter this, after initial calibration the sidelobes of the 185 and 216 MHz bands are imaged on multiple angular scales and their CLEAN component models (Gaussian and point sources) are subtracted from the visibilities. Note that all CLEAN components within the sidelobe are subtracted, including non-Galactic discrete sources. Despite Virgo A being within and near the field of interest, it either lies within the primary beam mainlobe at low frequencies (88 and 118 MHz) or outside enough to be nulled at higher frequencies (154, 185, and 216 MHz).
$>25$
Jy) sources outside of the image field of view, and in the case of this field the Galactic Plane becomes a source of sidelobe noise at the high end of the MWA band. To counter this, after initial calibration the sidelobes of the 185 and 216 MHz bands are imaged on multiple angular scales and their CLEAN component models (Gaussian and point sources) are subtracted from the visibilities. Note that all CLEAN components within the sidelobe are subtracted, including non-Galactic discrete sources. Despite Virgo A being within and near the field of interest, it either lies within the primary beam mainlobe at low frequencies (88 and 118 MHz) or outside enough to be nulled at higher frequencies (154, 185, and 216 MHz).
MWA-2 observational details for Abell 1127.
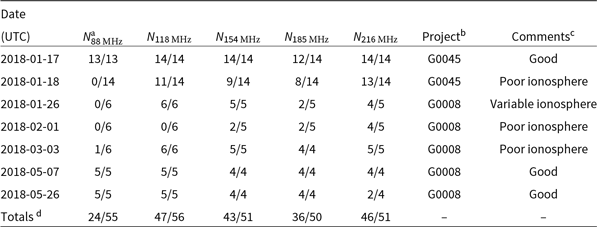
Notes. aRatio of snapshots used to snapshots observed for a given night and frequency, with each snapshot 112–120 s of data.
b G0008 is GLEAM-eXtended, and G0045 is the dedicated cluster project.
c User determined qualitative assessment of the datasets.
d Total snapshots used after discarding snapshots with issues including poor ionospheric conditions, too few tiles, or particularly bad RFI.
Output from stacking and re-gridding for the 30 MHz band centred on 154 MHz. Note the images cover a  ${\sim}25\ensuremath{^\circ}$
by
${\sim}25\ensuremath{^\circ}$
by  ${\sim}25\ensuremath{^\circ}$
region.
${\sim}25\ensuremath{^\circ}$
region.
In these observations, we use 100–200 sources for infield calibration, depending on frequency (with more sources used at low frequency due to the larger field view). Calibration is performed with an implementation of the full-Jones Mitchcal algorithm, developed for MWA calibration specifically as described by Offringa et al. (Reference Offringa2016), which produces static phase offsets via least-squares fitting for each MWA tile. The sky model used for calibration is generated using a cross-match between GLEAM, NVSS, and TGSS (using the Positional Update and Matching Algorithm, PUMA; Line et al. Reference Line, Webster, Pindor, Mitchell and Trott2017) with flux densities and the required frequency estimated by either fitting a generic curved or normal power law to the catalogue flux density measurements, or using an average spectral index of  $\langle\alpha\rangle = -0.77$
and assuming a normal power law model. Given the density of measurements provided by the GLEAM Extra-Galactic Catalogue (GLEAM EGC; Hurley-Walker et al. Reference Hurley-Walker2017), flux densities are heavily weighted by these measurements which are based on the Baars et al. (Reference Baars, Genzel, Pauliny-Toth and Witzel1977) flux density scale, but positions are more heavily weighted by the NVSS positions where available.
$\langle\alpha\rangle = -0.77$
and assuming a normal power law model. Given the density of measurements provided by the GLEAM Extra-Galactic Catalogue (GLEAM EGC; Hurley-Walker et al. Reference Hurley-Walker2017), flux densities are heavily weighted by these measurements which are based on the Baars et al. (Reference Baars, Genzel, Pauliny-Toth and Witzel1977) flux density scale, but positions are more heavily weighted by the NVSS positions where available.
2.3.3. Self-calibration and imaging
After initial calibration, a single round of phase and amplitude self-calibration is performed by first doing a shallow CLEAN using WSClean which makes use of a w-stacking technique to ensure the large field-of-view is properly imaged. This round of CLEAN stops at a threshold of five times the local noise. Imaging during self-calibration is done in an ‘8 channels out’ mode, where CLEANing is performed on eight subbands (each with  $\Delta\nu = 3.84$
MHz) which allows for a self-calibration model that has frequency dependence at that sampling. The model generated by WSClean is then used by the previously described calibration software to once again calibrate the data. This usually significantly improves the residual calibration artefacts from the first iteration. Deeper CLEANing is then performed again using WSClean with a ‘Briggs’ robust
$\Delta\nu = 3.84$
MHz) which allows for a self-calibration model that has frequency dependence at that sampling. The model generated by WSClean is then used by the previously described calibration software to once again calibrate the data. This usually significantly improves the residual calibration artefacts from the first iteration. Deeper CLEANing is then performed again using WSClean with a ‘Briggs’ robust  $+1.0$
weighting, this time down to an initial threshold of
$+1.0$
weighting, this time down to an initial threshold of  $3\sigma_{\textrm{rms}}$
and a final threshold of
$3\sigma_{\textrm{rms}}$
and a final threshold of  $1\sigma_\textrm{rms}$
. Here we use a ‘4 channels out’ mode (CLEANing subbands of
$1\sigma_\textrm{rms}$
. Here we use a ‘4 channels out’ mode (CLEANing subbands of  $\Delta\nu = 7.68$
MHz), which addresses the issue of a changing point spread function (PSF) as a function of frequency, thus reducing amplitude errors which become particularly more problematic around bright sources. Primary beam corrections are applied to each snapshot, using the Full Embedded Element primary beam model (Sokolowski et al. Reference Sokolowski2017), generating astronomical Stokes I primary beam-corrected images. Note that a set of images are also produced at a ‘Briggs’ robust 0.0 weighting but are not used.
$\Delta\nu = 7.68$
MHz), which addresses the issue of a changing point spread function (PSF) as a function of frequency, thus reducing amplitude errors which become particularly more problematic around bright sources. Primary beam corrections are applied to each snapshot, using the Full Embedded Element primary beam model (Sokolowski et al. Reference Sokolowski2017), generating astronomical Stokes I primary beam-corrected images. Note that a set of images are also produced at a ‘Briggs’ robust 0.0 weighting but are not used.
2.3.4. Astrometric and flux scale corrections
For each 2-min snapshot Stokes I image, a pixel-based position correction is done to account for first-order ionospheric effects. This is achieved using fits_warp.py (Hurley-Walker & Hancock Reference Hurley-Walker and Hancock2018), which compares an initial image catalogue generated by the aegeanFootnote l source-finding software (Hancock et al. Reference Hancock, Murphy, Gaensler, Hopkins and Curran2012, Hancock, Trott, & Hurley-Walker Reference Hancock, Trott and Hurley-Walker2018) with a reference catalogue, in this case generated by combining the NVSS, TGSS, and GLEAM catalogues. A pixel-based shift is performed based on the angular separation of sources, and cubic interpolation is used to create an effective screen to shift pixels by. Any snapshots that have significantly higher noise or show more complex ionospheric distortions are at this stage discarded.
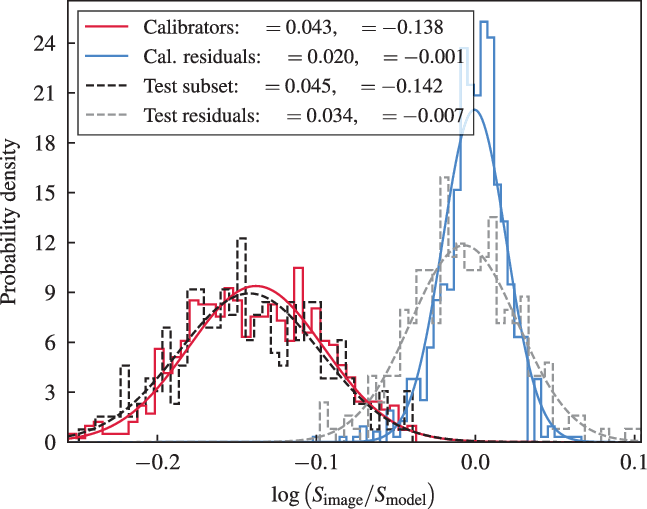
Finally, each snapshot at each frequency has a slightly different flux scale that must be normalised. The initial calibration is performed with respect to both the GLEAM EGC (Hurley-Walker et al. Reference Hurley-Walker2017) (along with other radio sky surveys) as well as select multi-component and point source models from earlier MWA Phase I data of particularly bright sources (e.g., Virgo A). This initial flux scale is more heavily determined by the initial bright source models, which vary from the GLEAM catalogue by up to 50% and so final image-based bootstrapping is required to tie the flux scale more closely to the GLEAM EGC. Additionally, we suspect that there are residual primary beam model errors present in the data, which have a position dependence which is corrected for simultaneously. This process uses in-house code written for this purpose and is described in more detail in Appendix B.
2.3.5. Stacking the 2-min snapshots
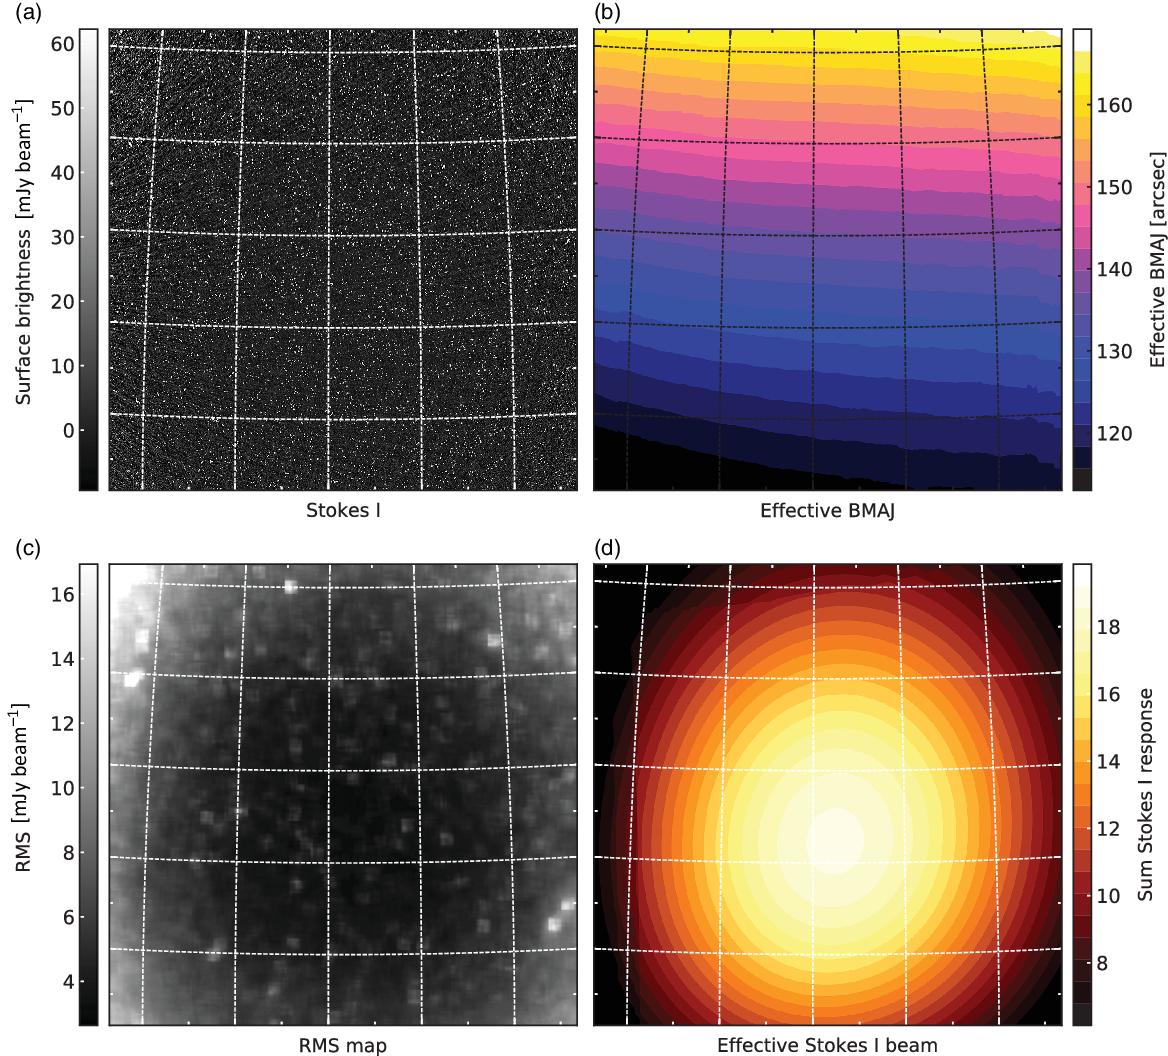
To re-grid images prior to co-addition, we make use of the regrid task within the miriad software suite (Sault, Teuben, & Wright Reference Sault, Teuben, Wright, Shaw, Payne and Hayes1995). We generate three separate stacked images: (1) Stokes I images weighted by the primary beam response, (2) the effective Stokes I response images corresponding to the weighted Stokes I image, and (3) the effective PSF map weighted as per the previous two stacked images. In practice, this PSF map incorporates a total flux preserving factor (see Appendix A for determination of the correction factor) within an effective major axis for the PSF which is all that is required when measuring total or integrated flux densities, hence the position angle is not well defined. Note that peak flux (i.e., surface brightness) is always preserved. Figure 3 shows the output from creating mosaics for the 154 MHz data, with the Stokes I image, effective PSF major axis map, noise map, and summed Stokes I primary beam. While our pipeline produces individual snapshots of the  $\Delta\nu=30.72$
MHz bands as well as the
$\Delta\nu=30.72$
MHz bands as well as the  $\Delta\nu = 7.68$
MHz subbands generated during ‘4 channels out’ CLEANing, we only use stacked mosaics of the
$\Delta\nu = 7.68$
MHz subbands generated during ‘4 channels out’ CLEANing, we only use stacked mosaics of the  $\Delta\nu=30.72$
MHz images due to the signal-to-noise ratio constraints of our source of interest in the higher frequency bands (see Section 3.2.2). The final mosaic properties are presented in Table 2 and the images centred on Abell 1127 are shown in Figure 4. Note that some image properties vary over the map (e.g., PSF) so we report the value at the position of Abell 1127.
$\Delta\nu=30.72$
MHz images due to the signal-to-noise ratio constraints of our source of interest in the higher frequency bands (see Section 3.2.2). The final mosaic properties are presented in Table 2 and the images centred on Abell 1127 are shown in Figure 4. Note that some image properties vary over the map (e.g., PSF) so we report the value at the position of Abell 1127.
Details of the MWA-2 observations and resultant images.
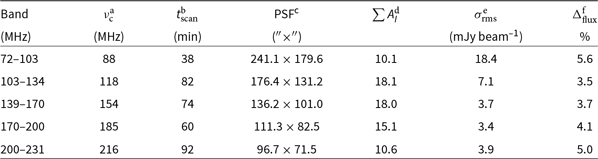
Notes. aCentral observing frequency.
bTotal scan length of data used in imaging.
cEffective PSF at the source location.
dThe summed Stokes I primary beam response of the stacked image, where  $A_I=1$
is the peak response for a 2-min observation at zenith.
$A_I=1$
is the peak response for a 2-min observation at zenith.
eLocal rms at the location of Abell 1127.
f% uncertainty on the flux scale compared to the input calibration model.
2.4. Chandra data
A1127 (as RM J105417.5 $+$
143904.2) was observed with the Advanced CCD Imaging Spectrometer (ACIS-I) instrument on the Chandra observatory with 10.46 ks of exposure time (Obs. ID 17160, PI: Eduardo Rozo). These archival data were retrieved from the Chandra Data Archive. We analysed the data obtained from the S0-3 chips of ACIS. We followed the standard Chandra data reduction process and used the CIAOFootnote m (version v4.11 with CALDB v4.8.2; Fruscione et al. Reference Fruscione2006) script chandra_repro to generate the level-2 event file. We examined the light curves extracted in 0.5–12.0 keV from source-free regions near CCD edges and exclude the time intervals during which the count rates deviate from the mean values by 20%. The CIAO tool celldetect is used to identify and exclude the point sources detected on the S0-3 chips and finally flux_image is used to generate the exposure map to correct for the vignetting and exposure time fluctuations.
$+$
143904.2) was observed with the Advanced CCD Imaging Spectrometer (ACIS-I) instrument on the Chandra observatory with 10.46 ks of exposure time (Obs. ID 17160, PI: Eduardo Rozo). These archival data were retrieved from the Chandra Data Archive. We analysed the data obtained from the S0-3 chips of ACIS. We followed the standard Chandra data reduction process and used the CIAOFootnote m (version v4.11 with CALDB v4.8.2; Fruscione et al. Reference Fruscione2006) script chandra_repro to generate the level-2 event file. We examined the light curves extracted in 0.5–12.0 keV from source-free regions near CCD edges and exclude the time intervals during which the count rates deviate from the mean values by 20%. The CIAO tool celldetect is used to identify and exclude the point sources detected on the S0-3 chips and finally flux_image is used to generate the exposure map to correct for the vignetting and exposure time fluctuations.
3. RESULTS
3.1. The optical and X-ray core
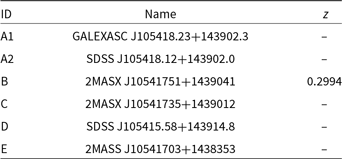
The core of the cluster system can be characterised by both an optical concentration of galaxies as well as an X-ray-emitting plasma. Figure 5 shows the SDSS data of the cluster region, with an inset zoom-in on the brightest cluster galaxy (BCG) and surrounding galaxies (‘A1-2’, ‘B’, and ‘C’). The BCG, ‘B’, is 2MASX J10541751 $+$
1439041 (hereafter, 2MASX J1504). 2MASX J1504 is reported with a spectroscopic redshift of
$+$
1439041 (hereafter, 2MASX J1504). 2MASX J1504 is reported with a spectroscopic redshift of  $z=0.299437\pm0.000054$
from DR12 of the SDSS. Labelled optical sources are shown in Table 3.
$z=0.299437\pm0.000054$
from DR12 of the SDSS. Labelled optical sources are shown in Table 3.
Sources detected in the SDSS images at the centre of the cluster region.
The MWA-2 robust  $+1.0$
stacked mosaics for the MWA field containing Abell 1127 across the five frequencies, with the TGSS ADR1 image in the top right. The greyscale maps are all linear stretches between
$+1.0$
stacked mosaics for the MWA field containing Abell 1127 across the five frequencies, with the TGSS ADR1 image in the top right. The greyscale maps are all linear stretches between  $-3\sigma_\textrm{rms}$
and
$-3\sigma_\textrm{rms}$
and  $15\sigma_\textrm{rms}$
(see Table 4 for values for each image). The magenta circle is centred on PSZ2 G231.56
$15\sigma_\textrm{rms}$
(see Table 4 for values for each image). The magenta circle is centred on PSZ2 G231.56 $+$
60.03 and has a radius of 1 Mpc. The red, hatched ellipses in the lower right corners are the effective PSF size for each map at this position.
$+$
60.03 and has a radius of 1 Mpc. The red, hatched ellipses in the lower right corners are the effective PSF size for each map at this position.
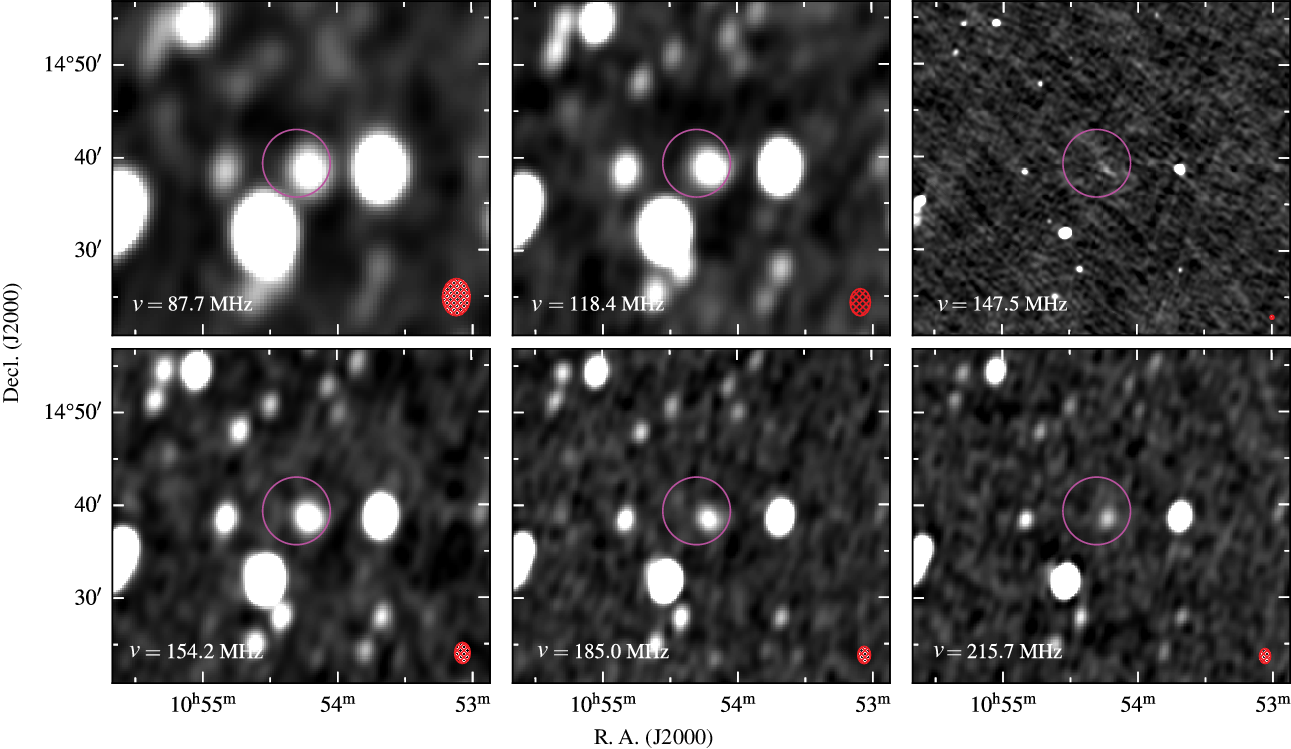
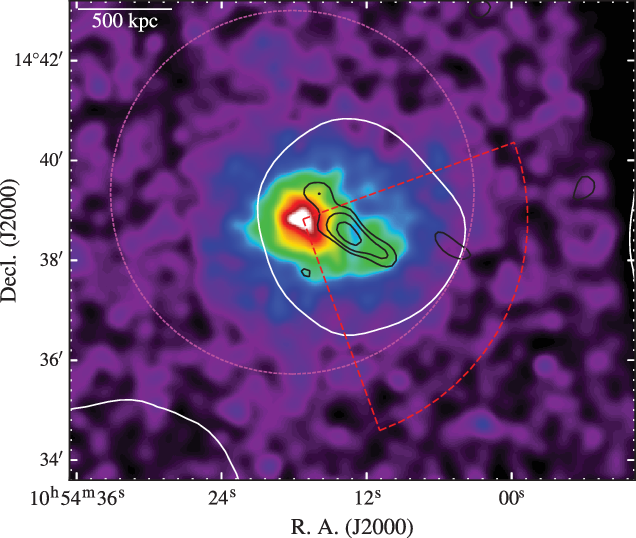
Figure 6 shows the reprocessed archival Chandra data with radio contours overlaid. For display purposes, we smooth the X-ray image by convolving with a  $\sigma=18$
arcsec Gaussian kernel using the CIAO task asmooth. The image itself provides two interesting things to note: (1) the X-ray distribution is not circular, and (2) the emission is divided into two clumps, with the main, eastern clump containing the peak of the surface brightness and the secondary, western clump being much fainter. The void between the clumps coincides with the peak of the radio emission.
$\sigma=18$
arcsec Gaussian kernel using the CIAO task asmooth. The image itself provides two interesting things to note: (1) the X-ray distribution is not circular, and (2) the emission is divided into two clumps, with the main, eastern clump containing the peak of the surface brightness and the secondary, western clump being much fainter. The void between the clumps coincides with the peak of the radio emission.
We analyse the unsmoothed Chandra image with the X-ray surface brightness analysis software, proffitFootnote n (Eckert, Molendi, & Paltani Reference Eckert, Molendi and Paltani2011). We use circular annuli to determine an azimuthally averaged surface brightness profile. As the unsmoothed image has no well-defined peak, we use the smoothed image to define the centre of the surface brightness profile (corresponding to coordinates 10h54m17s.3,  $+$
14°38ʹ49ʹʹ). The profile is measured out to 6 arcmin (1.6 Mpc at
$+$
14°38ʹ49ʹʹ). The profile is measured out to 6 arcmin (1.6 Mpc at  $z_\textrm{spec}=0.2994$
, however this radius is chosen as it is the edge of the image), with counts initially binned in 4 arcsec annuli. These bins are adjusted to ensure a signal-to-noise ratio of at least 10 per bin, resulting in 8–16 arcsec bins with
$z_\textrm{spec}=0.2994$
, however this radius is chosen as it is the edge of the image), with counts initially binned in 4 arcsec annuli. These bins are adjusted to ensure a signal-to-noise ratio of at least 10 per bin, resulting in 8–16 arcsec bins with  $>100$
counts per bin. We assume a constant background over the image and define the annuli with radii
$>100$
counts per bin. We assume a constant background over the image and define the annuli with radii  $4.5\ensuremath{^\prime} < r \leq 6\ensuremath{^\prime}$
to consist of only background counts from visual inspection and fit these bins with a constant profile. This is
$4.5\ensuremath{^\prime} < r \leq 6\ensuremath{^\prime}$
to consist of only background counts from visual inspection and fit these bins with a constant profile. This is  $I_\textrm{b} = (1.095 \pm 0.034) \times 10^{-5}$
counts s–1 cm–2 arcmin–2 and is subtracted from the surface brightness profile. For the background-subtracted annuli with radii
$I_\textrm{b} = (1.095 \pm 0.034) \times 10^{-5}$
counts s–1 cm–2 arcmin–2 and is subtracted from the surface brightness profile. For the background-subtracted annuli with radii  $r \leq 4.5\ensuremath{^\prime}$
, we find that a standard
$r \leq 4.5\ensuremath{^\prime}$
, we find that a standard  $\beta$
model (Cavaliere & Fusco-Femiano Reference Cavaliere and Fusco-Femiano1976) fits the surface brightness profile well (with
$\beta$
model (Cavaliere & Fusco-Femiano Reference Cavaliere and Fusco-Femiano1976) fits the surface brightness profile well (with  $\chi_\textrm{red} = 1.27$
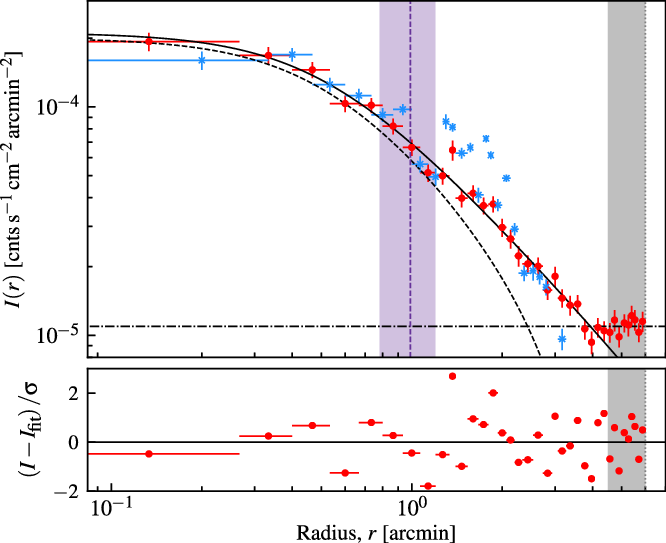
). The results of the surface brightness profile fitting and background subtraction are shown in Figure 7. We perform a similar surface brightness analysis across the southwest X-ray clump as indicated by the red, dashed wedge region in Figure 6. This profile is shown in Figure 7 and the location of the peak radio emission in the TGSS ADR1 image is also plotted for reference. The peak radio emission occurs immediately as the X-ray separates into the southwestern clump.
$\chi_\textrm{red} = 1.27$
). The results of the surface brightness profile fitting and background subtraction are shown in Figure 7. We perform a similar surface brightness analysis across the southwest X-ray clump as indicated by the red, dashed wedge region in Figure 6. This profile is shown in Figure 7 and the location of the peak radio emission in the TGSS ADR1 image is also plotted for reference. The peak radio emission occurs immediately as the X-ray separates into the southwestern clump.
We calculate the centroid shift, w (e.g., Poole et al. Reference Poole, Fardal, Babul, McCarthy, Quinn and Wadsley2006, but see also Mohr, Fabricant, & Geller Reference Mohr, Fabricant and Geller1993) with an outer radius set to 1.87 arcmin, corresponding to 500 kpc (see Cassano et al. Reference Cassano, Ettori, Giacintucci, Brunetti, Markevitch, Venturi and Gitti2010), resulting in  $w_{500}=0.072$
. For further comparison to literature data, we estimate the centroid shift within
$w_{500}=0.072$
. For further comparison to literature data, we estimate the centroid shift within  $R_{500}$
.Footnote o We estimate
$R_{500}$
.Footnote o We estimate  $R_{500}\sim920$
kpc from a 0.5–2.0 keV X-ray luminosity of
$R_{500}\sim920$
kpc from a 0.5–2.0 keV X-ray luminosity of  $L_{\text{X}} \sim 3.6\times10^{44}$
erg s–1 as measured from flux within the cluster region, using
$L_{\text{X}} \sim 3.6\times10^{44}$
erg s–1 as measured from flux within the cluster region, using  $R_{500}$
–
$R_{500}$
– $L_{\text{X}}$
relations (Böhringer et al. Reference Böhringer2007 but see also Arnaud, Pointecouteau, & Pratt Reference Arnaud, Pointecouteau and Pratt2005); we find
$L_{\text{X}}$
relations (Böhringer et al. Reference Böhringer2007 but see also Arnaud, Pointecouteau, & Pratt Reference Arnaud, Pointecouteau and Pratt2005); we find  $w_{920} = 0.02R_{500}$
. Additionally, we calculate the surface brightness concentration parameter (see e.g., Santos et al. Reference Santos, Rosati, Tozzi, Böhringer, Ettori and Bignamini2008) in two ways: within 100 and 500 kpc (0.37 and 1.87 arcmin, respectively, as per Cassano et al. Reference Cassano, Ettori, Giacintucci, Brunetti, Markevitch, Venturi and Gitti2010) and within 40 and 400 kpc (0.15 and 1.50 arcmin, respectively, as per Santos et al. Reference Santos, Rosati, Tozzi, Böhringer, Ettori and Bignamini2008), thus finding
$w_{920} = 0.02R_{500}$
. Additionally, we calculate the surface brightness concentration parameter (see e.g., Santos et al. Reference Santos, Rosati, Tozzi, Böhringer, Ettori and Bignamini2008) in two ways: within 100 and 500 kpc (0.37 and 1.87 arcmin, respectively, as per Cassano et al. Reference Cassano, Ettori, Giacintucci, Brunetti, Markevitch, Venturi and Gitti2010) and within 40 and 400 kpc (0.15 and 1.50 arcmin, respectively, as per Santos et al. Reference Santos, Rosati, Tozzi, Böhringer, Ettori and Bignamini2008), thus finding  $c_{100/500} = 0.105$
and
$c_{100/500} = 0.105$
and  $c_{40/400} = 0.022$
.
$c_{40/400} = 0.022$
.
3.2. Radio emission
3.2.1. Radio morphology and discrete sources
The full-resolution TGSS ADR1 image at 150 MHz shows an elongated radio structure near the optical centre of the cluster system (see Figure 5). Given the concentration of optical sources, it is difficult to confirm if one or more of the optical galaxies in the region is the host of the emission; however, no discrete radio sources are seen within the TGSS-detected emission either in the FIRST survey image or the VLA S-band image (Figure 1). Optical source ‘D’ (Figure 5) sits within the TGSS emission and at first glance appears to correspond to a peak in the TGSS image with  $S_\textrm{150\,MHz} \sim 12$
mJy beam–1. However, no discrete source is detected in the VLA S-band image above
$S_\textrm{150\,MHz} \sim 12$
mJy beam–1. However, no discrete source is detected in the VLA S-band image above  $3\sigma_\textrm{rms}$
(
$3\sigma_\textrm{rms}$
( $\sigma_\textrm{rms} = 11.5$ $\mu$
Jy beam–1) at this position. If this component of the full extended emission is a discrete source, it would require
$\mu$
Jy beam–1) at this position. If this component of the full extended emission is a discrete source, it would require  $\alpha < -1.9$
to result in a non-detection in the VLA S-band image. Given this would be an unusually steep-spectrum core, we assume the peak 150 MHz emission co-spatial with ‘D’ is not associated with ‘D’ and is part of the extended emission.
$\alpha < -1.9$
to result in a non-detection in the VLA S-band image. Given this would be an unusually steep-spectrum core, we assume the peak 150 MHz emission co-spatial with ‘D’ is not associated with ‘D’ and is part of the extended emission.
The background is a three-colour (red–green–blue) image made from the i, r, and g bands of the SDSS. The contours and features in the image are as in Figure 1(a), though the inset location is focused on the cluster centre. The dashed box in the centre of the cluster is enlarged in the inset shown on the bottom right.
The Chandra X-ray map smoothed with a  $\sigma=18$
arcsec Gaussian kernel. The overlaid white contour is from the 154 MHz MWA-2 image at
$\sigma=18$
arcsec Gaussian kernel. The overlaid white contour is from the 154 MHz MWA-2 image at  $3\sigma_\textrm{rms}$
. The overlaid black contours are the 150 MHz TGSS ADR1 image, with contours also starting at
$3\sigma_\textrm{rms}$
. The overlaid black contours are the 150 MHz TGSS ADR1 image, with contours also starting at  $3\sigma_\textrm{rms}$
. The dashed, magenta circle is the same as in Figure 4, and the dashed, red wedge indicates the region used to extract the surface brightness profile through the southwest X-ray clump (blue points in Figure 7).
$3\sigma_\textrm{rms}$
. The dashed, magenta circle is the same as in Figure 4, and the dashed, red wedge indicates the region used to extract the surface brightness profile through the southwest X-ray clump (blue points in Figure 7).
Surface brightness profile of the X-ray emission associated with Abell 1127. For the azimuthally averaged profile (red circles), two models are fit at separate radii: a  $\beta$
model for
$\beta$
model for  $r \leq 4.5\ensuremath{^\prime}$
(dashed line) fit to background subtracted data, and a constant model for
$r \leq 4.5\ensuremath{^\prime}$
(dashed line) fit to background subtracted data, and a constant model for  $ 4.5\ensuremath{^\prime} < r \leq 6\ensuremath{^\prime}$
(dot-dash line) to determine the background. The solid line is the combination of the background-subtracted
$ 4.5\ensuremath{^\prime} < r \leq 6\ensuremath{^\prime}$
(dot-dash line) to determine the background. The solid line is the combination of the background-subtracted  $\beta$
model and the constant background. The grey, shaded region indicates the background fitting region. The horizontal bars indicate the radial bin widths. The blue points correspond to a radial surface brightness profile across the southwest X-ray clump (red, dashed region in Figure 6), and the vertical, dashed purple line marks the peak emission of the radio source in the TGSS ADR1 image, with the purple shaded region indicating the beam size.
$\beta$
model and the constant background. The grey, shaded region indicates the background fitting region. The horizontal bars indicate the radial bin widths. The blue points correspond to a radial surface brightness profile across the southwest X-ray clump (red, dashed region in Figure 6), and the vertical, dashed purple line marks the peak emission of the radio source in the TGSS ADR1 image, with the purple shaded region indicating the beam size.
The VLA S-band data reveal six discrete radio sources, including Source ‘E’, within the measured region in the MWA-2 images. Source ‘E’ is shown in the insets of Figure 1 and other discrete sources are indicated by cyan circles in Figure 1(a), though the additional discrete sources are not detected in the FIRST survey image. Source ‘E’ is not detected in the TGSS image above 9.4 mJy ( $3\sigma_\textrm{rms}$
) but based on the spectral index between the FIRST and VLA S-band data (
$3\sigma_\textrm{rms}$
) but based on the spectral index between the FIRST and VLA S-band data ( $\alpha_\textrm{E} = -0.8 \pm 0.2$
), assuming a power law, the source would be just detectable at
$\alpha_\textrm{E} = -0.8 \pm 0.2$
), assuming a power law, the source would be just detectable at  ${\sim}4\sigma_\textrm{rms}$
significance in the TGSS image.
${\sim}4\sigma_\textrm{rms}$
significance in the TGSS image.
We measure the full extent of the diffuse source in the MWA-2 154-MHz image: the deconvolved largest angular size is determined to be 3.2 arcmin measured out to  $2\sigma_\textrm{rms}$
, corresponding to a projected linear size of 850 kpc.
$2\sigma_\textrm{rms}$
, corresponding to a projected linear size of 850 kpc.
3.2.2. Radio spectral energy distribution and power
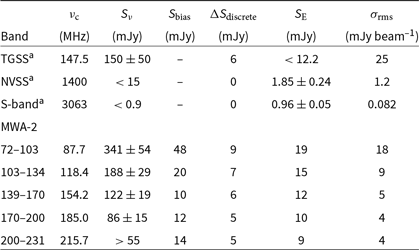
We measure the spectral energy distribution of the source between 88 and 3063 MHz using the MWA-2, TGSS, NVSS, and VLA S-band data. We measure the integrated flux density of the source in the MWA-2 and TGSS data by integrating over a circular aperture centred on the source. We mask pixels below 2 $\sigma_\textrm{rms}$
, and the measurement uncertainty,
$\sigma_\textrm{rms}$
, and the measurement uncertainty,  $\sigma_S$
, is defined via
$\sigma_S$
, is defined via
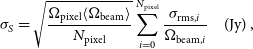 \begin{equation} \sigma_S = \sqrt{\frac{\Omega_\textrm{pixel} \langle \Omega_\textrm{beam}\rangle}{N_\textrm{pixel}}} \displaystyle \sum_{i=0}^{N_\textrm{pixel}} \frac{\sigma_{\textrm{rms},i}}{\Omega_{\textrm{beam},i}} \quad (\textrm{Jy})\, ,\end{equation}
where  $\Omega_\textrm{pixel}$
is the constant pixel solid angle,
$\Omega_\textrm{pixel}$
is the constant pixel solid angle,  $\Omega_\textrm{beam}$
is the varying beam solid angle, and
$\Omega_\textrm{beam}$
is the varying beam solid angle, and  $\sigma_\textrm{rms}$
is the map rms. While the synthesised beam does vary in size across these MWA-2 mosaics, in practice the variation across our source of interest is minute. Note that the 216 MHz band of the MWA-2 data is considered a lower limit as the shape of the source changes significantly enough that we suspect the entirety of the source is not detected in this band. Inspecting the highest frequency subband (
$\sigma_\textrm{rms}$
is the map rms. While the synthesised beam does vary in size across these MWA-2 mosaics, in practice the variation across our source of interest is minute. Note that the 216 MHz band of the MWA-2 data is considered a lower limit as the shape of the source changes significantly enough that we suspect the entirety of the source is not detected in this band. Inspecting the highest frequency subband ( $\nu_\textrm{c} = 227$
MHz) shows only a hint of signal at the 3
$\nu_\textrm{c} = 227$
MHz) shows only a hint of signal at the 3 $\sigma_\textrm{rms}$
level.
$\sigma_\textrm{rms}$
level.
For the MWA-2 data, we correct a CLEAN bias by adding 14–48 mJy to each measurement (see Appendix C for details). Additionally, we estimate the possible contribution from the unnamed discrete S-band sources by extrapolating to MWA frequencies assuming  $\alpha_\textrm{discrete} = -0.77$
. We find the contribution is small (at the level of the noise) so include this as additional uncertainty in the measurements. The total uncertainty of an integrated flux density measurement is the quadrature sum of the measurement uncertainty, flux scale uncertainty, and discrete source uncertainty. The contribution from source ‘E’ is also estimated from
$\alpha_\textrm{discrete} = -0.77$
. We find the contribution is small (at the level of the noise) so include this as additional uncertainty in the measurements. The total uncertainty of an integrated flux density measurement is the quadrature sum of the measurement uncertainty, flux scale uncertainty, and discrete source uncertainty. The contribution from source ‘E’ is also estimated from  $\alpha_\textrm{E} \sim -0.8$
and is subtracted. The low-resolution TGSS ADR1 flux density measurement is consistent with the MWA-2 measurement at 154 MHz within the estimated uncertainties. Finally, assuming the angular size of the emission in the MWA-2 154 MHz map is the true size, we estimate a 3
$\alpha_\textrm{E} \sim -0.8$
and is subtracted. The low-resolution TGSS ADR1 flux density measurement is consistent with the MWA-2 measurement at 154 MHz within the estimated uncertainties. Finally, assuming the angular size of the emission in the MWA-2 154 MHz map is the true size, we estimate a 3 $\sigma$
upper limit from the low-resolution NVSS and VLA discrete-source-subtracted S-band maps which have constant rms noises of 1.25 and 0.082 mJy beam–1, respectively. Table 4 presents the flux densities measurements and the various measurement corrections for each band.
$\sigma$
upper limit from the low-resolution NVSS and VLA discrete-source-subtracted S-band maps which have constant rms noises of 1.25 and 0.082 mJy beam–1, respectively. Table 4 presents the flux densities measurements and the various measurement corrections for each band.
Flux density measurements of the diffuse radio source with required corrections.
Note. aBased on low-resolution image ( $100\,\text{arcsec} \times 100\,\text{arcsec}$
).
$100\,\text{arcsec} \times 100\,\text{arcsec}$
).
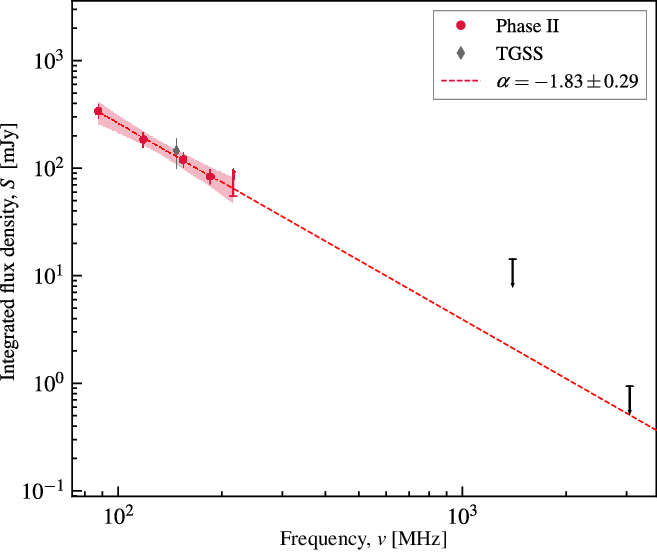
We fit a generic power law model to the MWA-2 data between 88–185 MHz using the Levenberg–Marquardt algorithm for non-linear least-squares fitting implemented in lmfit (Newville et al. Reference Newville, Stensitzki, Allen and Ingargiola2014). The best-fit power law model yields a spectral index of  $\alpha = \ensuremath{-1.83\pm0.29}$
for the source. This fit is shown in Figure 8. Using the MWA-2 model fit, we estimate the 1.4 GHz flux density of the extended source to be
$\alpha = \ensuremath{-1.83\pm0.29}$
for the source. This fit is shown in Figure 8. Using the MWA-2 model fit, we estimate the 1.4 GHz flux density of the extended source to be  $S_\textrm{1.4\,GHz} \sim 2$
mJy, which gives a monochromatic power of
$S_\textrm{1.4\,GHz} \sim 2$
mJy, which gives a monochromatic power of  $P_\textrm{1.4\,GHz} \sim 7\times 10^{23}$
W Hz–1 if indeed the emission is at the redshift of the BCG (
$P_\textrm{1.4\,GHz} \sim 7\times 10^{23}$
W Hz–1 if indeed the emission is at the redshift of the BCG ( $z=0.2994$
), and using the spectral index determined above.
$z=0.2994$
), and using the spectral index determined above.
The spectral energy distribution (SED) of the diffuse radio source from 88 to 3063 MHz. The black upper limits are from the low-resolution NVSS and VLA source-subtracted S-band images. Note the lower limit at 216 MHz. The power law fit to the MWA-2 data is shown as the dashed, red line. Limits are not used in fitting. The TGSS measurement is also shown for completeness but not used in fitting. The shaded region corresponds to the 95% confidence interval.
4. Discussion
4.1. A dynamic system
The clumping of the X-ray emission and general extension to the west suggests an unrelaxed system. We can attempt to quantify this by comparing the morphological parameters  $c_{100/500}=0.105$
(
$c_{100/500}=0.105$
( $c_{40/400} = 0.022$
) and
$c_{40/400} = 0.022$
) and  $w_{500}=0.072$
(
$w_{500}=0.072$
( $w_{920}=0.02R_{500}$
) and with other clusters. The surface brightness concentration parameter is a good indicator of cool-core systems (Santos et al. Reference Santos, Rosati, Tozzi, Böhringer, Ettori and Bignamini2008) and here we note that
$w_{920}=0.02R_{500}$
) and with other clusters. The surface brightness concentration parameter is a good indicator of cool-core systems (Santos et al. Reference Santos, Rosati, Tozzi, Böhringer, Ettori and Bignamini2008) and here we note that  $c_{40/400}=0.026$
is below values typically seen in cool-core systems (with
$c_{40/400}=0.026$
is below values typically seen in cool-core systems (with  $c_{40/400} \gtrsim 0.75$
). Poole et al. (Reference Poole, Fardal, Babul, McCarthy, Quinn and Wadsley2006) find that for simulated data the centroid shift, w, is a good indicator that a cluster has been disturbed, presumably by merger-related activity. Pratt et al. (Reference Pratt, Croston, Arnaud and Böhringer2009) define a disturbed system as having
$c_{40/400} \gtrsim 0.75$
). Poole et al. (Reference Poole, Fardal, Babul, McCarthy, Quinn and Wadsley2006) find that for simulated data the centroid shift, w, is a good indicator that a cluster has been disturbed, presumably by merger-related activity. Pratt et al. (Reference Pratt, Croston, Arnaud and Böhringer2009) define a disturbed system as having  $w > 0.01R_{500}$
from a representative sample of 31 X-ray-emitting, nearby clusters (i.e., the REXCESSFootnote p sample), suggesting that Abell 1127 is morphologically disturbed. Additionally, the measured values for
$w > 0.01R_{500}$
from a representative sample of 31 X-ray-emitting, nearby clusters (i.e., the REXCESSFootnote p sample), suggesting that Abell 1127 is morphologically disturbed. Additionally, the measured values for  $w_{500}$
and
$w_{500}$
and  $c_{100/500}$
place the cluster in the quadrant of merging clusters in Figure 1(a) from Cassano et al. (Reference Cassano, Ettori, Giacintucci, Brunetti, Markevitch, Venturi and Gitti2010), most of which have been found to host giant radio halos. The Chandra data provide good support for the cluster system being in a morphologically disturbed state (corresponding to merger activity). In addition to this, the peak emission of the radio source in the TGSS ADR1 image sits immediately before the transition between the main X-ray-emitting clump and the fainter southwestern clump.
$c_{100/500}$
place the cluster in the quadrant of merging clusters in Figure 1(a) from Cassano et al. (Reference Cassano, Ettori, Giacintucci, Brunetti, Markevitch, Venturi and Gitti2010), most of which have been found to host giant radio halos. The Chandra data provide good support for the cluster system being in a morphologically disturbed state (corresponding to merger activity). In addition to this, the peak emission of the radio source in the TGSS ADR1 image sits immediately before the transition between the main X-ray-emitting clump and the fainter southwestern clump.
4.2. Classification of the diffuse radio source
While there are numerous optical galaxies within the emission region of the extended, diffuse radio emission, there is no radio core detected. This, combined with the steep observed radio spectrum, precludes the extended source from being a normal, active radio galaxy. The steep radio spectrum of the source suggests an aged population of electrons, fading or perhaps re-accelerated from merger-related activity within the ICM. Merging clusters have been found to host radio halos and relics (see e.g., Cassano et al. Reference Cassano2013). While the source is unlikely to be a giant radio halo, given its offset from the X-ray emission peak, we consider the possibility of a relic-like radio source.
Unfortunately, the source is not resolved enough with the current data to perform a resolved spectral study to explore possible radio shock origins (e.g., van Weeren et al. Reference van Weeren, Röttgering, Brüggen and Hoeft2010; Hindson et al. Reference Hindson2014; de Gasperin et al. Reference de Gasperin, van Weeren, Brüggen, Vazza, Bonafede and Intema2014) including re-acceleration or re-energisation (e.g., Bonafede et al. Reference Bonafede, Intema, Brüggen, Girardi, Nonino, Kantharia, vanWeeren and Röttgering2014; de Gasperin et al. Reference de Gasperin2017); however, if the source is a relic generated from a shock, it is likely oriented at some angle between the cluster and observer, and shock-driven relic features such as a spectral gradients may not be present or observable. The integrated spectrum is steeper than most radio relics associated with shocks (with the current sample mean  $\alpha = -1.2 \pm 0.2$
; van Weeren et al. Reference van Weeren, de Gasperin, Akamatsu, Brüggen, Feretti, Kang, Stroe and Zandanel2019b and references therein) but does share observed properties of the relic source in RXC J1234.2
$\alpha = -1.2 \pm 0.2$
; van Weeren et al. Reference van Weeren, de Gasperin, Akamatsu, Brüggen, Feretti, Kang, Stroe and Zandanel2019b and references therein) but does share observed properties of the relic source in RXC J1234.2 $+$
0947 (Kale et al. Reference Kale2015); a similar steep-spectrum relic-like source with no observed connection to a shock. Such steepness is more often seen in ‘roundish’ radio relics or phoenices, thought to be energised by adiabatic compression due to small-scale shocks (Kempner et al. Reference Kempner, Blanton, Clarke, Enßlin, Johnston-Hollitt, Rudnick, Reiprich, Kempner and Soker2004), possibly from cluster mergers. We do not rule out a merger-related relic classification based on the present data.
$+$
0947 (Kale et al. Reference Kale2015); a similar steep-spectrum relic-like source with no observed connection to a shock. Such steepness is more often seen in ‘roundish’ radio relics or phoenices, thought to be energised by adiabatic compression due to small-scale shocks (Kempner et al. Reference Kempner, Blanton, Clarke, Enßlin, Johnston-Hollitt, Rudnick, Reiprich, Kempner and Soker2004), possibly from cluster mergers. We do not rule out a merger-related relic classification based on the present data.
An alternative explanation is that of remnant (non-re-accelerated) electrons from a long-dead radio galaxy—confirmation of this would require, at the least, access to a higher-frequency detection of the emission to confirm spectral steepening (see e.g., Murgia et al. Reference Murgia2011; Duchesne & Johnston-Hollitt Reference Duchesne and Johnston-Hollitt2019). Potential hosts for such a scenario are sources ‘B’ (the BCG) or ‘E’, with ‘E’ the most likely candidate based on existing detected emission at 1.4 GHz. In either case, this requires some separation of the radio lobes from the host and, assuming a maximum projected velocity of  $1\,000$
km s–1 (away from the diffuse radio source) requires a travel time of
$1\,000$
km s–1 (away from the diffuse radio source) requires a travel time of  $\gtrsim200$
Myr.
$\gtrsim200$
Myr.
While we may speculate on the nature of the emission, from the data at hand it is impossible to confirm its precise classification.
4.3. Towards an SED-based taxonomy: current limitations
SED sampling is sorely missing in many studies of diffuse, non-thermal radio cluster emission. Some examples exist of well-sampled spectra, though it is only the brightest examples of diffuse cluster emission, such as the radio halo in the Coma Cluster (e.g., Schlickeiser, Sievers, & Thiemann Reference Schlickeiser, Sievers and Thiemann1987; Thierbach, Klein, & Wielebinski Reference Thierbach, Klein and Wielebinski2003), or the relic-type source in Abell 85 (Slee et al. Reference Slee, Roy, Murgia, Andernach and Ehle2001) or Abell 4038 (Slee et al. Reference Slee, Roy, Murgia, Andernach and Ehle2001; Kale, Parekh, & Dwarakanath Reference Kale, Parekh and Dwarakanath2018), that have well-studied and sampled spectra which allow the distinction between synchrotron emission models for the sources. The MWA provides good fractional bandwidth at MHz frequencies, however, cannot be used alone to fully confirm integrated emission models. For completeness, additional data at GHz frequencies would be required to distinguish between various emission model with breaks or curves in logarithmic space between MHz and GHz frequencies.
The most significant limit of MWA data (even in its Phase II ‘extended’ configuration) is the angular resolution. This is limiting for two reasons: (1) the intrusion of discrete sources within the larger scale cluster emission and (2) the limited ability to perform resolved spectral studies. The first limitation can be bypassed by incorporating complementary higher resolution observations or survey data as used in this work. In the near future, the Australian Square Kilometre Array Pathfinder (Johnston et al. Reference Johnston2007, Reference Johnston2008) will be providing the Evolutionary Map of the Universe (Norris et al. Reference Norris2011) survey, covering the Southern Sky up to  $+30^\circ$
declination, complementing the coverage offered by the MWA. At a frequency of
$+30^\circ$
declination, complementing the coverage offered by the MWA. At a frequency of  ${\sim}900$
MHz, resolution of 10 arcsec, and expected noise of 10
${\sim}900$
MHz, resolution of 10 arcsec, and expected noise of 10  $\mu$
Jy beam–1, we will be able to provide better analysis of intruding discrete sources than what is provided here with the current VLA S-band data and FIRST survey images. Additionally, where there is overlap between the MWA and TGSS (and by extension the newly upgraded Giant Metrewave Radio Telescope (GMRT); Gupta et al. Reference Gupta2017), we can immediately rule out bright compact sources within the emission or that make up the emission. The second limitation is not bypassable with the current array, but still resolved spectral studies can be performed on the nearest, largest sources (e.g., Hindson et al. Reference Hindson2014). For resolved spectral studies, a combination of instruments such as the LOw Frequency ARray (LOFAR; van Haarlem et al. Reference van Haarlem2013), (u)GMRT, and VLA have been used to good effect with deep observations (e.g., de Gasperin et al. Reference de Gasperin2017; Di Gennaro et al. Reference Di Gennaro2018), noting the appropriate caveats in regard to matching u–v coverage.
$\mu$
Jy beam–1, we will be able to provide better analysis of intruding discrete sources than what is provided here with the current VLA S-band data and FIRST survey images. Additionally, where there is overlap between the MWA and TGSS (and by extension the newly upgraded Giant Metrewave Radio Telescope (GMRT); Gupta et al. Reference Gupta2017), we can immediately rule out bright compact sources within the emission or that make up the emission. The second limitation is not bypassable with the current array, but still resolved spectral studies can be performed on the nearest, largest sources (e.g., Hindson et al. Reference Hindson2014). For resolved spectral studies, a combination of instruments such as the LOw Frequency ARray (LOFAR; van Haarlem et al. Reference van Haarlem2013), (u)GMRT, and VLA have been used to good effect with deep observations (e.g., de Gasperin et al. Reference de Gasperin2017; Di Gennaro et al. Reference Di Gennaro2018), noting the appropriate caveats in regard to matching u–v coverage.
5. SUMMARY
In this paper, we have presented observations of a steep-spectrum, diffuse radio source in the cluster Abell 1127. The data include dedicated MWA-2 observations, and archival VLA (S-band) and Chandra data, as well as survey data from the TGSS, FIRST, NVSS, and SDSS. With the available data, we are unable to unambiguously classify the radio source, but we report on the following properties:
1. steep radio spectrum, $\alpha=\ensuremath{-1.83\pm0.29}$
, up to GHz frequencies,
$\alpha=\ensuremath{-1.83\pm0.29}$
, up to GHz frequencies,2. projected linear extent 850 kpc,
3. hosting cluster is morphological disturbed,
4. no obvious radio core.

These features are consistent with radio relics, phoenices, as well as remnant radio galaxies, and places this in a growing category of similar diffuse cluster sources which are not able to be precisely categorised with present data (e.g., Shakouri, Johnston-Hollitt, & Pratt Reference Shakouri, Johnston-Hollitt and Pratt2016; Duchesne et al. Reference Duchesne, Johnston-Hollitt, Offringa, Pratt, Zheng and Dehghan2017 and a number of references within van Weeren et al. Reference van Weeren, de Gasperin, Akamatsu, Brüggen, Feretti, Kang, Stroe and Zandanel2019a).
We have described a data reduction pipeline for MWA-2 continuum data based on the pipeline used for the GLEAM survey, with improvements to the calibration and overall flux scale and improvements to how the re-projected PSF is handled during image stacking/mosaicking.
Despite additional long baselines provided by the MWA-2 ‘extended’ configuration, MWA data are still limited in angular resolution ( $\gtrsim50$
arcsec). We have showed that despite this limiting angular resolution, with complementary high-resolution observations to remove discrete source contribution, we can investigate diffuse cluster sources. In the near future, the sky observable to the MWA will have complementary
$\gtrsim50$
arcsec). We have showed that despite this limiting angular resolution, with complementary high-resolution observations to remove discrete source contribution, we can investigate diffuse cluster sources. In the near future, the sky observable to the MWA will have complementary  ${\sim}10$
arcsec resolution data with sufficient sensitivity to disentangle underlying point source populations as well as the necessary surface brightness sensitivity to detect diffuse cluster sources.
${\sim}10$
arcsec resolution data with sufficient sensitivity to disentangle underlying point source populations as well as the necessary surface brightness sensitivity to detect diffuse cluster sources.
Acknowledgements
The authors would like to thank Davide Picchieri and Susannah R. Keel for identifying the source of interest. The authors would also like to thank the anonymous referee for their useful comments that have improved the quality of this paper.
SWD acknowledges an Australian Government Research Training Program scholarship administered through Curtin University. ZZ is supported by the National Science Foundation of China (grant No. 11433002, 11835009).
This scientific work makes use of the Murchison Radio-astronomy Observatory, operated by CSIRO. We acknowledge the Wajarri Yamatji people as the traditional owners of the Observatory site. Support for the operation of the MWA is provided by the Australian Government (NCRIS), under a contract to Curtin University administered by Astronomy Australia Limited.
We acknowledge the Pawsey Supercomputing Centre which is supported by the Western Australian and Australian Governments.
This research has made use of data obtained from the Chandra Data Archive and software provided by the Chandra X-ray Center (CXC) in the application package CIAO.
The National Radio Astronomy Observatory is a facility of the National Science Foundation operated under cooperative agreement by Associated Universities, Inc. This research made use of a number of python packages: aplpy (Robitaille & Bressert Reference Robitaille and Bressert2012), astropy (Astropy Collaboration et al. 2013; Price-Whelan et al. Reference Price-Whelan2018), matplotlib (Hunter Reference Hunter2007), numpy (van der Walt, Colbert, & Varoquaux Reference van der Walt, Colbert and Varoquaux2011), and scipy (Jones et al. Reference Jones2001).
This research has made use of the NASA/IPAC Extragalactic Database (NED), which is operated by the Jet Propulsion Laboratory, California Institute of Technology, under contract with the National Aeronautics and Space Administration.
Funding for SDSS-III has been provided by the Alfred P. Sloan Foundation, the Participating Institutions, the National Science Foundation, and the U.S. Department of Energy Office of Science. The SDSS-III website is http://www.sdss3.org/. SDSS-III is managed by the Astrophysical Research Consortium for the Participating Institutions of the SDSS-III Collaboration including the University of Arizona, the Brazilian Participation Group, Brookhaven National Laboratory, Carnegie Mellon University, University of Florida, the French Participation Group, the German Participation Group, Harvard University, the Instituto de Astrofisica de Canarias, the Michigan State/Notre Dame/JINA Participation Group, Johns Hopkins University, Lawrence Berkeley National Laboratory, Max Planck Institute for Astrophysics, Max Planck Institute for Extraterrestrial Physics, New Mexico State University, New York University, Ohio State University, Pennsylvania State University, University of Portsmouth, Princeton University, the Spanish Participation Group, University of Tokyo, University of Utah, Vanderbilt University, University of Virginia, University of Washington, and Yale University.
A. The effective PSF
The effective PSF is not well defined in images after regridding and reprojecting with current software (e.g., regrid from miriad; Sault et al. Reference Sault, Teuben, Wright, Shaw, Payne and Hayes1995, or SWarp Bertin et al. Reference Bertin, Mellier, Radovich, Missonnier, Didelon, Morin, Bohlender, Durand and Handley2002). This problem is exacerbated by a shift of reference coordinates over tens of degrees and by the large field of view of the MWA. To ensure the reprojected PSF is defined correctly for integrated flux density measurements, we define an effective PSF correction factor,  $f_\textrm{regrid}$
, dependent on final projection, to determine the effective PSF area. This factor is
$f_\textrm{regrid}$
, dependent on final projection, to determine the effective PSF area. This factor is
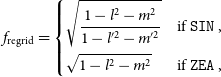 \begin{equation}f_\textrm{regrid} = \begin{dcases}\sqrt{\frac{1 - l^2 -m^2}{1 - l^{\prime 2} - m^{\prime 2}}} & \text{if }\texttt{SIN} \, , \\\sqrt{1 - l^2 -m^2} & \text{if }\texttt{ZEA} \, ,\end{dcases}\end{equation}
where l, m are the direction cosines with respect to the original image reference coordinates and  $l^\prime,m^\prime$
with respect to the new image reference coordinates. Note that this assumes the original images are in a SIN projection as output by wsclean. For the work here we have final reprojected images in the SIN projection; however, it is common with MWA data to also produce mosaics with the ZEA projection (see e.g., GLEAM; Hurley-Walker et al. Reference Hurley-Walker2017). Naturally, the ZEA correction only takes the SIN component from the original image due to the equal area definition of the ZEA projection.
$l^\prime,m^\prime$
with respect to the new image reference coordinates. Note that this assumes the original images are in a SIN projection as output by wsclean. For the work here we have final reprojected images in the SIN projection; however, it is common with MWA data to also produce mosaics with the ZEA projection (see e.g., GLEAM; Hurley-Walker et al. Reference Hurley-Walker2017). Naturally, the ZEA correction only takes the SIN component from the original image due to the equal area definition of the ZEA projection.
An additional concern regarding the PSF and measuring integrated flux densities was found in the aegean source-finding software. Prior to commit 6cd5bacFootnote q calculation of the PSF size was done assuming a distortion due to projection and, optionally, with an additional latitude-dependent correction if not in the SIN projection. These factors produced an approximate correction that became worse radially from the image reference coordinates. Removing these factors and applying  $f_\textrm{regrid}$
to the effective PSF area (when data have been reprojected) produces the expected results.
$f_\textrm{regrid}$
to the effective PSF area (when data have been reprojected) produces the expected results.
We demonstrate these two effects (general reprojection corrections and removal of PSF size calculations by aegean) by selecting two 88 MHz snapshots—a low-elevation snapshot (from this work) and a zenith-pointed snapshot (a ‘best-case’ example)—to simulate grids of 1 Jy point sources across the field of view without noise. We then image the data using wsclean as with real data (including the use of a shift of phase centre to zenith) and reproject each resultant snapshot to an example set of coordinates that would be used when generating mosaics. Once images are prepared, we source-find with aegean: first with the old version of aegean, then without the internal PSF calculations and using  $f_\textrm{regrid}$
for the reprojected images. Figure A.1 shows the results of the source finding on the various images (original SIN, reprojected SIN, and reprojected ZEA). Note that a
$f_\textrm{regrid}$
for the reprojected images. Figure A.1 shows the results of the source finding on the various images (original SIN, reprojected SIN, and reprojected ZEA). Note that a  $<+1$
% error remains after the correction, however, it is likely this falls within the expected error from the interpolation done during the reprojection process. Visual inspection of simulated point sources makes it clear that
$<+1$
% error remains after the correction, however, it is likely this falls within the expected error from the interpolation done during the reprojection process. Visual inspection of simulated point sources makes it clear that  $f_\textrm{regrid}$
applied to the PSF major axis mimics the reprojected point sources.
$f_\textrm{regrid}$
applied to the PSF major axis mimics the reprojected point sources.
Post commit 6cd5bac, aegean does not attempt to calculate the size of the PSF, leaving the user to supply an appropriate PSF map if needed,Footnote r and python code is available in piip (see Section 2.3) to generate PSF maps with  $f_\textrm{regrid}$
applied. This is done as part of the mosaicking for this work. Note that at the time of writing work is being done on aegean (from February 2020) to incorporate correct calculations of PSF and pixel sizes across an image for SIN projection images. From February 2020 up to commit d453938, the
$f_\textrm{regrid}$
applied. This is done as part of the mosaicking for this work. Note that at the time of writing work is being done on aegean (from February 2020) to incorporate correct calculations of PSF and pixel sizes across an image for SIN projection images. From February 2020 up to commit d453938, the  $f_\textrm{regrid}$
factors derived for SIN PSF maps are identical to those derived for ZEA and
$f_\textrm{regrid}$
factors derived for SIN PSF maps are identical to those derived for ZEA and  $f_\textrm{regrid}$
for ZEA re-gridded images remains the same.
$f_\textrm{regrid}$
for ZEA re-gridded images remains the same.
The various effects on integrated flux density measurements. Note the datasets are shifted by an arbitrary 36ʹ for clarity. The ZEA projection is only used after reprojecting as the imaging software does not natively generate ZEA images. (a) and (b): low-elevation snapshot (from this work) where the snapshot is reprojected to a different set of coordinates, showing the RA and declination dependence, respectively. (c) and (d): a zenith-pointed snapshot (used as a ‘best-case’ example only) where the reprojection does not change the reference coordinate significantly, showing for the RA and declination dependence, respectively. Note the different scales of  $S_\textrm{int}/S_\textrm{peak}$
between the two pointings.
$S_\textrm{int}/S_\textrm{peak}$
between the two pointings.
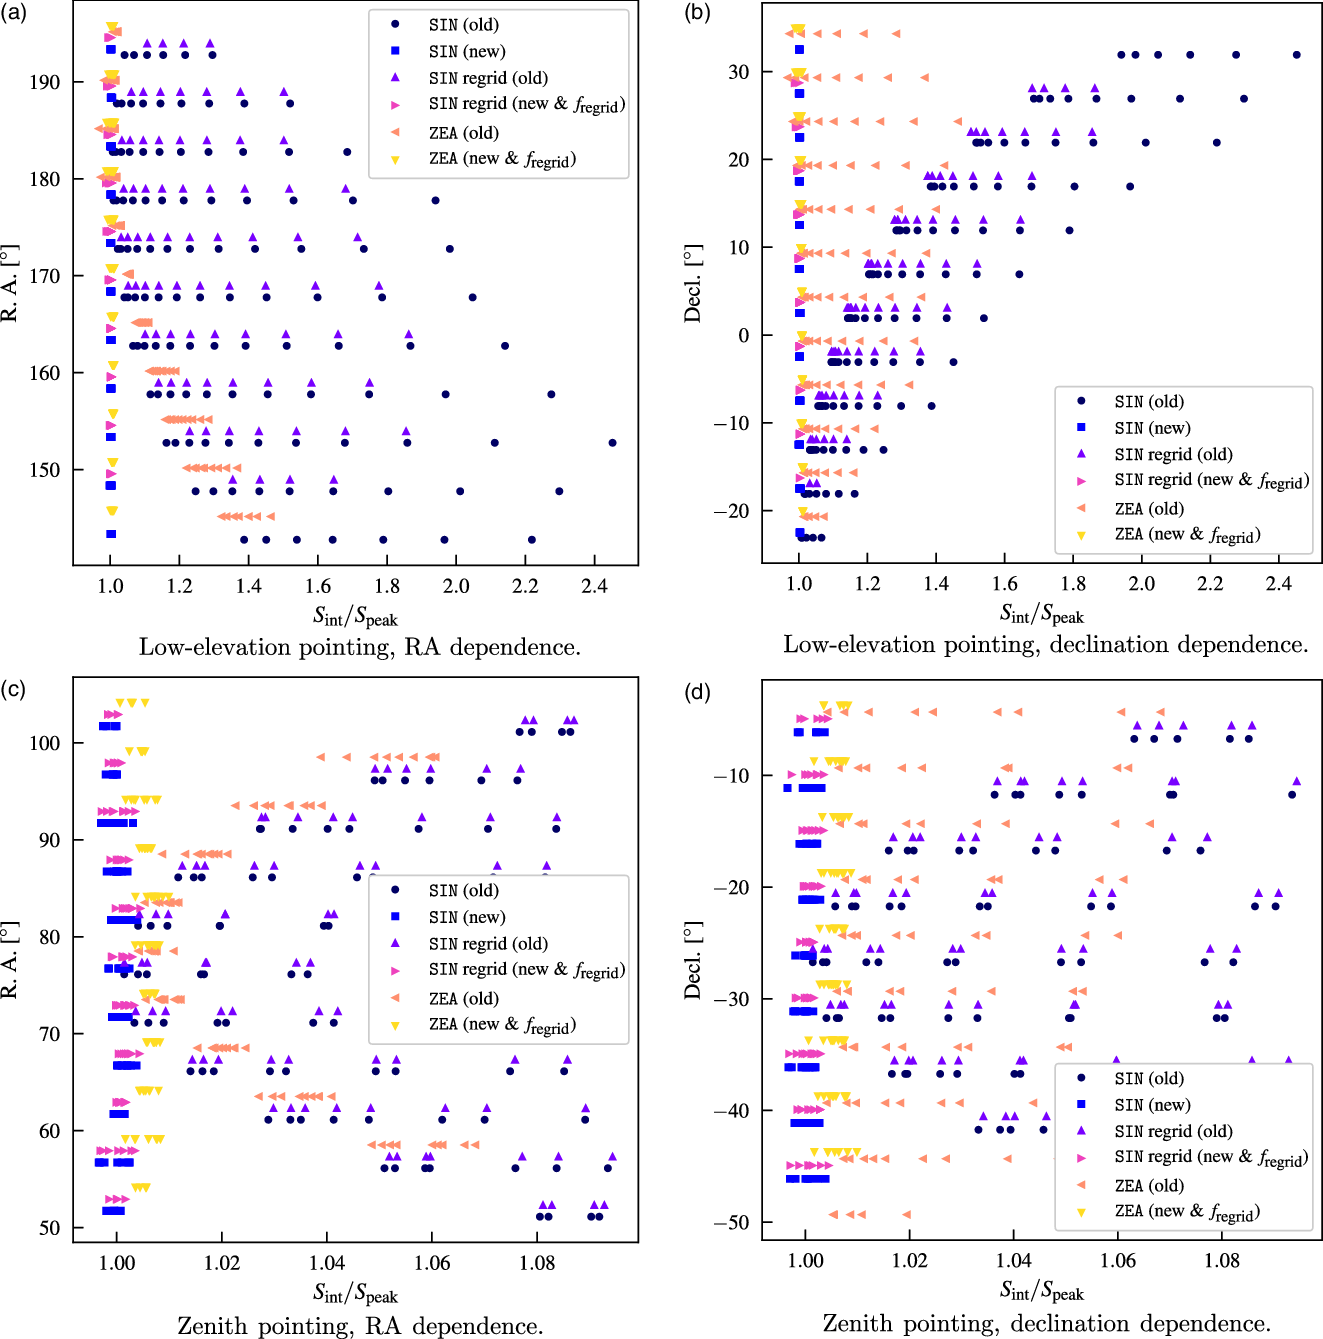
B. MWA flux scale corrections
After ensuring PSF-related effects are removed, there are still other issues that arise in real MWA data reduction that result in final image flux scales not being consistent with the input amplitude calibration model. The effect is largely only problematic at low elevations, which leads to the suspicion that the primary beam model used in correcting the individual snapshots is not accurately defined for these low-elevation pointings. The individual snapshots have differing pointings and so the final primary beam correction is slightly different between them. To correct this effect, we use an in-house developed python code flux_warpFootnote s to finalise the primary beam correction. The basic premise of flux_warp is to take an image, image catalogue with measured flux densities, and a model catalogue of the sky to compare to, then create a screen to multiply the image by to correct, for example, primary beam-related problems. In principle, a variety of model sky catalogues can be used but for this work we use the same model sky catalogue used for calibration, without bright extended sources (e.g., Virgo A). The screen scan be created using a number of methods, some involving signal-to-noise ratio (SNR) weighting:
1. (SNR-weighted) mean or median,
2. (SNR-weighted) 1D polynomial fit to declination or elevation,
3. (SNR-weighted) 2D polynomial fit to image pixel coordinates, or
4. Interpolation using linear radial basis function (RBF), pure 2D linear, or nearest-neighbour methods.
While the beam effects appear elevation-dependent, we find that for these data this fitting does not reduce residuals as well as a linear RBF interpolation (see scipy.interpolation.RbfFootnote t; Jones et al. Reference Jones2017) method, thus we use this RBF method to determine appropriate flux-scale corrections to apply over the individual snapshots. For each snapshot, a number of ‘calibrator’ sources are chosen satisfying
 \begin{equation} S_{\textrm{cal},\nu} \geq 1\,\textrm{Jy} \left(\frac{\nu}{88\,\textrm{MHz}}\right)^{-0.77},\end{equation}
where  $\nu$
is effective frequency of the image and
$\nu$
is effective frequency of the image and  $S_{\textrm{cal},\nu}$
is the flux density of the source. Additionally, we impose a constraint that only 1 000 sources may be selected with the brightest sources preferentially chosen. This source number limit is largely due to computational time constraints. The exact number of ‘calibrators’ chosen for each snapshots varies between 50 and 1 000, with the higher frequency bands typically on the lower side. Of the 50–1 000 calibrator sources initially selected, 25% of these from the faint end of the set are reserved for testing the model and are not used in determining the model.
$S_{\textrm{cal},\nu}$
is the flux density of the source. Additionally, we impose a constraint that only 1 000 sources may be selected with the brightest sources preferentially chosen. This source number limit is largely due to computational time constraints. The exact number of ‘calibrators’ chosen for each snapshots varies between 50 and 1 000, with the higher frequency bands typically on the lower side. Of the 50–1 000 calibrator sources initially selected, 25% of these from the faint end of the set are reserved for testing the model and are not used in determining the model.
Figure B.1 shows the derived correction factor map (where corrected data are the original data divided by the correction factor map) with the calibrator and test sources overlaid. Figure B.2 shows the residuals of the calibrator and test sources at their locations on the correction factor map. For this particular snapshot example (Obs. ID 1200252120), the flux density threshold for calibrator sources was moved to 2.14 Jy (with maximum flux density 129 Jy) for 750 calibrators, and the flux density range for the 250 test sources was  $1.77\,\textrm{Jy} < S < 2.14$
Jy. During a run of flux_warp, a number of basic statistics are computed prior to creating the correction factor screen including fitting a normal distribution to the log ratios (i.e.,
$1.77\,\textrm{Jy} < S < 2.14$
Jy. During a run of flux_warp, a number of basic statistics are computed prior to creating the correction factor screen including fitting a normal distribution to the log ratios (i.e.,  $\log\left[S_\textrm{image} / S_\textrm{model}\right]$
). Figure B.3 shows this fitting to the log ratios and residuals showing the improvement in the calibrators and test sources.
$\log\left[S_\textrm{image} / S_\textrm{model}\right]$
). Figure B.3 shows this fitting to the log ratios and residuals showing the improvement in the calibrators and test sources.
One final use of the flux_warp is performing quality assurance on the stacked mosaics, where we determine the standard deviation of the measured integrated flux densities from our input model to estimate the intrinsic uncertainty in our absolute flux calibration. This results in attributing a few per cent flux scale error to each mosaic (see Table 2).
C. CLEAN bias
In comparing the MWA MWA-2 data to the TGSS data in the same region, we found that integrated flux densities were biased towards lower values. In the low-SNR case, this bias pushed the integrated flux density well below the peak flux in the map. We consider this (at least in part) due to CLEAN bias (see e.g., Becker et al. Reference Becker, White and Helfand1995; White et al. Reference White, Becker, Helfand and Gregg1997; Condon et al. Reference Condon, Cotton, Greisen, Yin, Perley, Taylor and Broderick1998), though note that the observed bias will have some contribution from the inherent bias in measuring integrated flux densities without, for example, Gaussian fitting (as in the case for measuring the flux density of the source in Abell 1127).
Example output showing the derived RBF interpolated correction factor map that is applied to the snapshot image with calibrator and test sources overlaid. The colour scale for the map and sources is the same. Note this image represents the full imaged region at 88 MHz which is  ${\sim}44\ensuremath{^\circ} \times 44\ensuremath{^\circ}$
.
${\sim}44\ensuremath{^\circ} \times 44\ensuremath{^\circ}$
.
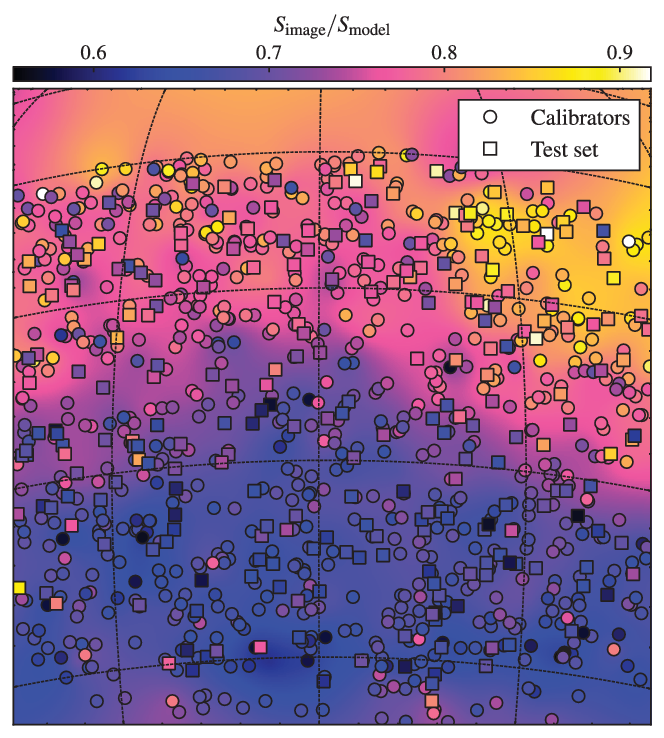
Example output showing the residuals between the calibrator and test sources when inspecting their new measured flux densities after applying the correction factor map, where M is the model factor, and the black solid and dashed lines are the mean and median factors, respectively.
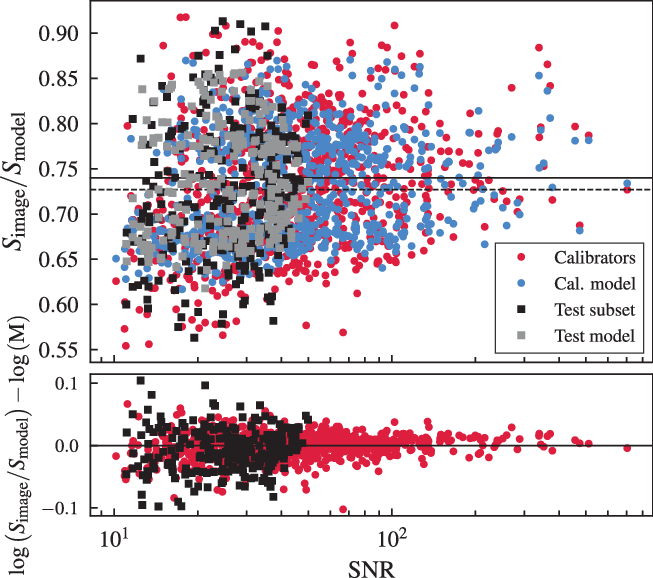
We correct this by fitting the offset  $S_\textrm{peak} - S_\textrm{int}$
for compact sources (
$S_\textrm{peak} - S_\textrm{int}$
for compact sources ( $S_\textrm{int} / S_\textrm{peak} < 1.2$
) with a linear function of the form
$S_\textrm{int} / S_\textrm{peak} < 1.2$
) with a linear function of the form  $S_\textrm{bias,compact} = A\times\textrm{SNR} + B$
for each MWA-2 image. For measuring source flux densities, we use a floodfill approach out to
$S_\textrm{bias,compact} = A\times\textrm{SNR} + B$
for each MWA-2 image. For measuring source flux densities, we use a floodfill approach out to  $2\sigma_\textrm{rms}$
rather than Gaussian fitting to mimic the technique used in measuring the diffuse cluster source. Gaussian fitting would hide the issue, as the integrated flux density of a Gaussian source is measured from its fitted peak flux, and major/minor axes and does not directly measure the pixel values.
$2\sigma_\textrm{rms}$
rather than Gaussian fitting to mimic the technique used in measuring the diffuse cluster source. Gaussian fitting would hide the issue, as the integrated flux density of a Gaussian source is measured from its fitted peak flux, and major/minor axes and does not directly measure the pixel values.
Table C.1 reports the bias-correcting parameters. Note that for an extended source, we assume that the bias scales with fractional peak, that is,  $S_\textrm{bias} = S_\textrm{bias,compact} \times \left(S_\textrm{int} / S_\textrm{peak} \right)$
, becoming worse for low surface brightness sources. Note that due to the convention used, the final integrated flux density is defined as
$S_\textrm{bias} = S_\textrm{bias,compact} \times \left(S_\textrm{int} / S_\textrm{peak} \right)$
, becoming worse for low surface brightness sources. Note that due to the convention used, the final integrated flux density is defined as  $S_\textrm{int,corrected} = S_\textrm{int} + S_\textrm{bias}$
.
$S_\textrm{int,corrected} = S_\textrm{int} + S_\textrm{bias}$
.
Fitted bias correction parameters for each MWA-2 band for  $S_\textrm{bias,compact} = A\times\textrm{SNR} + B$
.
$S_\textrm{bias,compact} = A\times\textrm{SNR} + B$
.
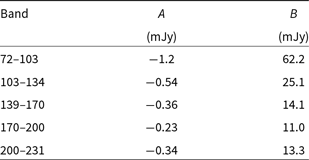
Example output showing the histogram of the log ratios and their residuals after creating the correction factor map.