


1. Introduction
High-quality legislation is written simply, clearly, concisely, and unambiguously (Butt, Reference Butt2013; Xanthaki, Reference Xanthaki2014). Well-written legislation is more predictable; it allows policy-makers to specify clear regulatory messages, which are necessary to implement regulatory goals, and ensures that bureaucrats understand the legislation correctly (Xanthaki, Reference Xanthaki2014). National and international institutions such as the Italian Senate of the Republic and the European Union (EU) incorporate these standards into their guidelines for legal drafters (e.g., Senato della Repubblica, Reference Senato della Repubblica2001; European Union, 2015).
In this paper, we study how legislative quality affects compliance with EU directives, which specify goals that EU member states must transpose into national law. Compliance refers to the correct and timely transposition of directives. High-quality directives reduce the chances that legal documents will be misinterpreted as well as the costs of transposition (e.g., Chayes and Chayes, Reference Chayes and Chayes1995; Börzel, Reference Börzel2021). We propose two natural language processing (NLP) measures of legislative quality and apply them to a dataset on EU legislation. We find that syntactic complexity is negatively related to compliance. However, this relationship is not robust to controlling for the length of the legislative texts, as syntactically complex legislation tends to be long. Furthermore, our analysis reveals that vague legislation is less likely to be correctly transposed. Importantly, our results suggest that vagueness has an effect even after controlling for important drivers of compliance, such as member states’ preferences, and administrative resources, as well as the length of the texts.
The case of the EU is particularly relevant for two reasons. First, good data and measures are available. We build upon the data of König and Mäder (Reference König and Mäder2014), who worked with graduate law students to assess the extent to which member states’ national legislation complies with EU directives. Hence, our data do not rely on reports of the European Commission or member states, which are incomplete and can thus bias the results. The data also include detailed information on EU legislation, including about member states’ preferences, amongst others (Thomson et al., Reference Thomson, Stokman, Achen and König2006). Second, the quality of legislation is especially important at the EU level because legislation needs to be transposed in 27 member states with different legal traditions and institutions. Hence, EU institutions invest significant resources in monitoring legislative quality. For example, the Legal Service of the European Commission has an entire directorate working on the quality of legislation (directorate K).
We make two contributions to the literature. First, we provide novel evidence of how the legislative quality shapes compliance with legislation. Qualitative research provides evidence that the quality of legislation is crucial for understanding how specific directives are transposed in the EU (Falkner et al., Reference Falkner, Treib, Hartlapp and Leiber2005), which is in line with the assessment of legal experts (Barrata, Reference Barrata2014). Prior quantitative studies often acknowledge the importance of legislative quality, but ours systematically analyzes the explanatory power of this factor (Tallberg, Reference Tallberg2002; Mastenbroek, Reference Mastenbroek2003; Borghetto et al., Reference Borghetto, Franchino and Giannetti2006; Börzel, Reference Börzel2021).
Second, we propose two quantitative measures of legislative quality, which complement previous measures. Prior theoretical work emphasizes the importance of legislative quality (e.g., Hirsch and Schotts, Reference Hirsch and Schotts2015; Hitt et al., Reference Hitt, Volden and Wiseman2017; Gratton et al., Reference Gratton, Guiso, Michelacci and Morelli2021) but most previous empirical analyses rely on the number of words or pages in their measurement (Gratton et al., Reference Gratton, Guiso, Michelacci and Morelli2021).Footnote 1 We instead use information on the syntactic and lexical features of the legal texts to measure legislative quality.Footnote 2
2. Explaining compliance with legislation
Two main approaches explain compliance with legislation. First, rational or strategic explanations highlight the role of preferences and strategic incentives (Tallberg, Reference Tallberg2002; Carrubba, Reference Carrubba2005; Thomson et al., Reference Thomson, Torenvlied and Arregui2007; König and Luetgert, Reference König and Luetgert2009). König and Luig (Reference König and Luig2014) suggest that non-compliance is a strategic choice of member states, particularly of the minister in charge of transposing the directive. Related explanations concentrate on the power of member states and national institutions as they highlight a rational explanation for non-compliance (Börzel, Reference Börzel2021). Multiple papers highlight the important role of domestic factors in influencing incentives to comply (e.g., Dai, Reference Dai2005).
Second, public administration approaches emphasize administrative capacity and efficiency (e.g., Chayes and Chayes, Reference Chayes and Chayes1995). According to this perspective, some states have more efficient or capable administrations, which increases their compliance with international law. Nordic member states are thought to have more efficient administrations, and Southern European states are generally considered less efficient. Administrative capacity might also depend on the adaptation pressures resulting from EU legislation (e.g., Knill, Reference Knill1998). Finally, legislative quality and policy complexity may decrease states’ capacity to implement directives (Zhelyazkova, Reference Zhelyazkova2013; Börzel, Reference Börzel2021).
In this paper, we focus on the relationship between legislative quality and compliance in the EU. The quality of legislation has been on the EU agenda since the Birmingham declaration of 1992, when the European Council highlighted the need to make legislation “simpler and clearer” (European Council, 1992, 5). Multiple Council meetings and inter-institutional agreements have since reiterated the importance of legislative quality. The European Commission, the European Parliament, and national administrations have legal services to monitor the quality of legal documents. Appendix A further discusses the role of legislative quality in the EU.
Legislative quality can influence compliance via two mechanisms (e.g., Falkner et al., Reference Falkner, Treib, Hartlapp and Leiber2005). First, low-quality legislation may delay the transposition of EU law in member states due to interpretation problems. National administrators may need more time to transpose legislation that is unclear and difficult to interpret. For example, national administrators may need to coordinate with the Commission to transpose the directive. Second, low-quality legislation can lead to incomplete transposition.Footnote 3
We therefore expect low-quality legislation to be associated with low levels of compliance:
Hypothesis: The lower the quality of the legislation, the less likely it is to be correctly transposed.
3. Measuring legislative quality
We measure the legislative quality of 21 directives by focusing on two features of legislative texts—syntactic complexity and vagueness. We use two NLP methods that work well for small corpora. Appendix D assesses the construct validity of the measures by examining a case study and illustrating the procedure using example sentences. In Appendix F, we illustrate the variation of these variables by policy area.
3.1 Syntactic complexity
In line with recent political economy and political science research (Vannoni et al., Reference Vannoni, Ash and Morelli2020; Ash et al., Reference Ash, Morelli and Vannoni2022), we look at the syntactic features of the text to extract important information. We measure syntactic complexity by focusing on the modifiers of nouns, which make legal texts more complex because it is harder for the reader to identify the subject-verb-object structure (e.g., Xanthaki, Reference Xanthaki2014, chapter 5).
Our measure of complexity indicates the percentage of words that modify nouns. We therefore focus on adjectival modifiers that modify the meaning of a noun or a pronoun. An example of a sentence with many modifiers (in italics) is “Particularly cruel actions, even if committed with an allegedly political objective, may be classified as serious non-political crimes” (see Table A1 for more examples). These modifiers make the sentence longer and more difficult to read and understand.
We calculate the number of modifiers using a dependency parser (the python module spaCy) to extract the syntactic dependencies that link the words and phrases in the text of the legislative acts in our sample (Honnibal and Montani, Reference Honnibal and Montani2017). The parser is trained on annotated syntactic dependencies, so-called dependency treebanks (Goldberg and Nivre, Reference Goldberg and Nivre2012; Honnibal and Johnson, Reference Honnibal and Johnson2015). For example, in the sentence “the Member State shall enforce the act”, the dependency parser identifies the following syntactic dependencies: determiner “the”, compound “Member”, nominal subject “State”, auxiliary “shall”, root “enforce”, determiner “the”, and direct object “act.”
3.2 Vagueness
Words are vague when their boundaries are unclear (Xanthaki, Reference Xanthaki2014). Legal writing experts recommend using concrete rather than vague words because the latter “tend to make sentences ineffective” (Garner, Reference Garner2002, 31). We measure vagueness using the Linguistic Inquiry and Word Count (LIWC) dictionary (Pennebaker et al., Reference Pennebaker, Booth, Boyd and Francis2015), which includes 178 vague words and (or word stems) (e.g., “approximat*”, “may”, “or”, “perhaps”, and “unknown”) and 113 concrete words (e.g., “all”, “everyone*”, “must”, “never”, and “totally”).
Our measure equals the percentage of vague minus the percentage of concrete words. Previous political science studies have used it to measure the vagueness of party manifestos (Eichorst and Lin, Reference Eichorst and Lin2019), and the LIWC has been extensively validated across different corpora (Pennebaker et al., Reference Pennebaker, Boyd, Jordan and Blackburn2015, 8).Footnote 4 For example, our measure assesses the following sentence as very vague because it includes three vague words (in italics) and zero concrete words: “Such sharing or coordination arrangements may include rules for apportioning the costs of facility or property sharing.”
4. Data
To analyze how legislative quality influences compliance, we build upon the data from König and Mäder (Reference König and Mäder2014), who focus on directives studied by the “Decision making in the European Union” (DEU) project (Thomson et al., Reference Thomson, Stokman, Achen and König2006). Their data include information on 299 compliance cases related to 21 directives adopted between 1999 and 2003 when the EU had 15 member states. These directives were not affected by procedural changes and were politically important (Thomson et al., Reference Thomson, Stokman, Achen and König2006, 26).
Our dependent variable equals 1 if a country transposed all the goals of the directive into national law in a timely manner, and 0 otherwise. This measure focuses on the issues covered by the DEU project (König and Mäder, Reference König and Mäder2014, 251).
König and Mäder's dataset has two advantages. First, they employed graduate law students from the different member states to identify cases of non-compliance. These students studied the text of national legislation and determined the extent to which it implements the directive's goals (König and Mäder, Reference König and Mäder2014, 251). This approach overcomes a common problem in compliance research that the Commission and member states do not report all cases of non-compliance (see also Zhelyazkova and Yordanova, Reference Zhelyazkova and Yordanova2015)—which can bias the analysis. A second advantage is that their data include legislation-specific data on actors’ preferences, which helps control for alternative explanations.
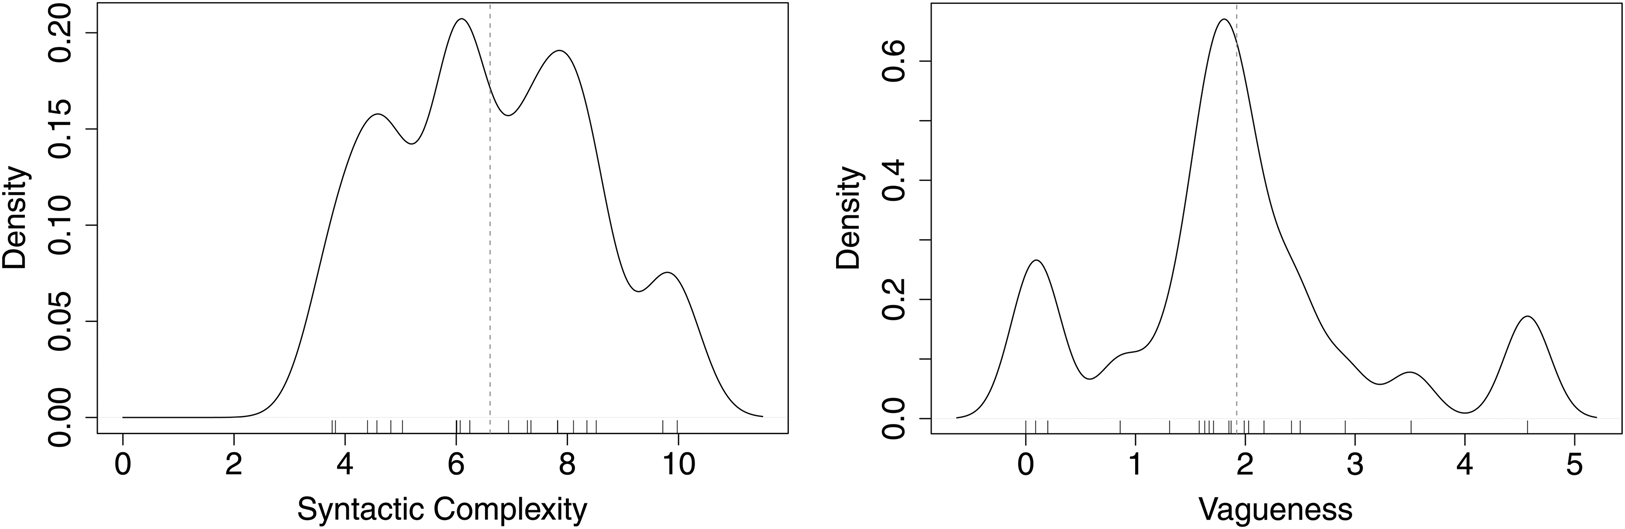
We expand this dataset by incorporating the legal texts and our two measures of legislative quality—syntactic complexity and vagueness. Figure 1 (panel a) displays the density of the variable syntactic complexity; the dashed vertical line represents the mean value of the variable. The figure illustrates that legal acts contain, on average, 6.6 percent noun modifiers. Panel (b) displays the density of the variable vagueness. The vertical dashed line represents the mean value of the variable, 1.9, which indicates that the percentage of vague words is 1.9 points higher than the percentage of concrete words. The minimum value of this variable is 0, and the maximum value is 4.6.
Density of explanatory variables, (a) syntactic complexity, (b) vagueness. Notes: The figures illustrate the density of the two measures of legislative quality. The vertical dashed lines denote the mean values. The rug plot at the bottom illustrates the data distribution.
We consider multiple control variables that capture factors that might be related to both compliance and the quality of directives. Following König and Mäder (Reference König and Mäder2014), our analysis controls for preferences, administrative capacity, interest group patterns, and the type of directive. Furthermore, we take into account the length of texts, amending legislation, government changes, and member state's discretion.
First, we include variables on preferences computed from the DEU project data (Thomson et al., Reference Thomson, Stokman, Achen and König2006), which is based on expert surveys. Member states’ disagreement is measured as the distance between each country's ideal point and the outcome of the decision-making process. If a legislative act has multiple issues, the distances for all issues are aggregated. The diversity of member states’ preferences related to a directive is measured as the sum of standard deviations of their preferences for each issue.
Second, we use a variable on administrative resources, which relies on the index of Kaufmann et al. (Reference Kaufmann, Kraay and Mastruzzi2006). We also control for the corporatist interest group system using Lijphart's index of interest group pluralism (Lijphart, Reference Lijphart1999): high values referring to member states with a pluralistic interest group system. We create an indicator variable that equals 1 if the Council and European Parliament adopted the proposal, and 0 if only the Council adopted it.
Furthermore, we control for the number of words in a legislative act and create an indicator variable on amending legislation. We also include an indicator variable for government changes during the period between the law's adoption and the implementation deadline.
Finally, we measure the delegation of authority to member states using two measures. More specifically, we use the discretion index computed by Anastasopoulos and Bertelli (Reference Anastasopoulos and Bertelli2020), and as an alternative a measure of the delegation ratio (Thomson et al., Reference Thomson, Torenvlied and Arregui2007). Appendix F provides descriptive statistics of all variables.
5. Results
We use descriptive statistics and logistic regression models to study the relationship between legislative quality and compliance with EU legislation at the national level. First, we inspect the correlation between the percentage of countries that correctly implemented the directive and our measures of legislative quality. Second, we run logistic models that include both explanatory variables (syntactic complexity and vagueness). Our preferred model controls for preference divergence among member states, member states’ disagreement with the policy, administrative resources, interest group patterns, type of directives, length of texts, amending legislation, government changes, and discretion. Appendix G includes the complete regression outputs. Third, we implement further analysis and robustness tests.
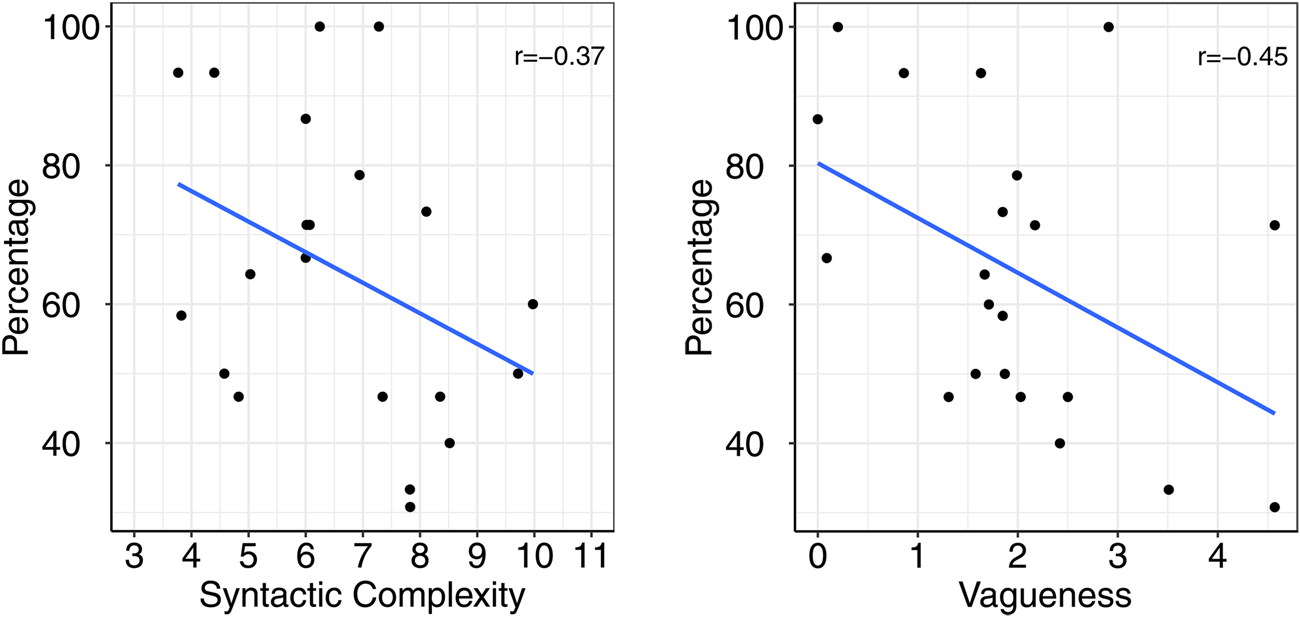
Figure 2 displays the relationship between legislative quality and the percentage of countries correctly implementing the directives. Each dot refers to one of the 21 directives. As panels (a) and (b) illustrate, the correlation between the percentage of countries implementing the directive and syntactic complexity is −0.37. The correlation equals –0.45 when examining the percentage of countries that correctly implemented the directive and vagueness. The evidence suggests that less well-written legislation tends to be correctly implemented in fewer countries.
Percentage of countries that implemented the directive and legislative quality, (a) syntactic complexity, (b) vagueness. Notes: The figures show the correlation between the measures of legislative quality (x-axis) and the percentage of countries complying with a legislation (y-axis). Lines of best fit are computed based on OLS regression models.
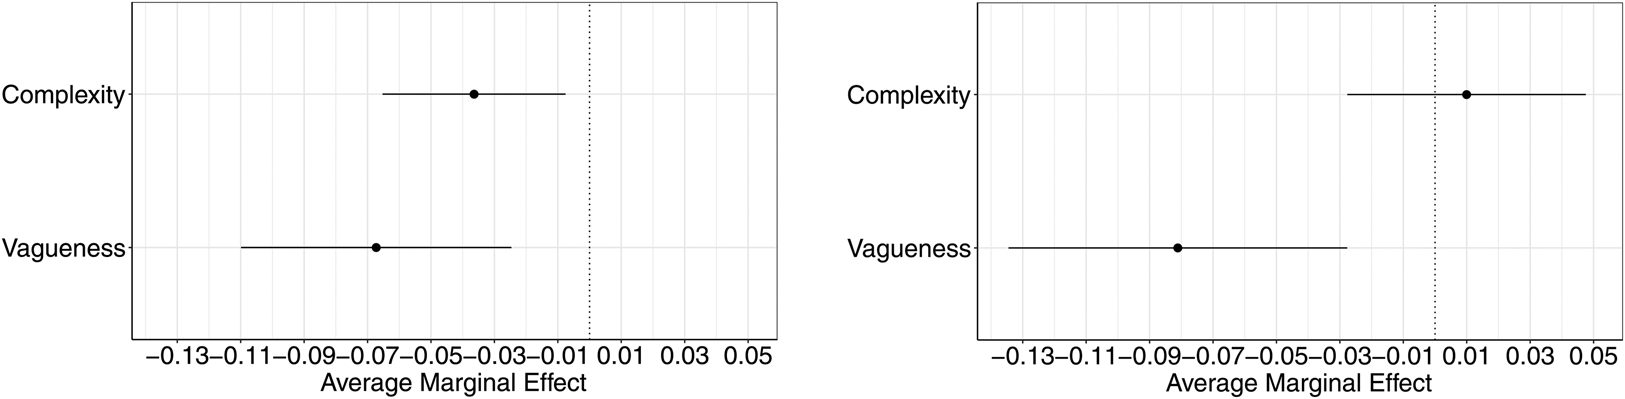
We continue analyzing the effects using a logistic regression model. In Figure 3, we present the average marginal effects of syntactic complexity and vagueness estimated using a model without control variables and our preferred model that includes all control variables. The average marginal effect captures how much a one-unit change in a variable influences the predicted probability, on average, holding the other variables at their default values (Arel-Bundock, Reference Arel-Bundock2023). Figure 3 displays the effects and the 95 percent confidence intervals. In line with Figure 2, panel (a) shows that both complexity and vagueness are negatively related to compliance. Both effects are statistically significant at the 0.05 level. However, panel (b) illustrates that the average marginal effect of the syntactic complexity variable is not robust to including all control variables. On closer inspection, this occurs when controlling for the length of texts as this measure is correlated with syntactic complexity. In models including all control variables except length, the effect of syntactic complexity is statistically significant (see Table A5, column 2). Panel (b) also indicates that a one-unit increase in the ambiguity dictionary scale decreases the probability of compliance by 0.08. This average marginal effect is statistically significant at the 0.01 level. In line with this result, the probability decreases by 0.11 if the vagueness score increases from the 20th to the 80th percentile, which corresponds to a change in the vagueness variable from 1.13 to 2.50.
Average marginal effects, (a) without control variables, (b) with control variables. Notes: The figures show the average marginal effects of syntactic complexity and vagueness and 95 percent confidence intervals. Panel (a) illustrates the effects of a model without control variables (model 1 in Table A5) and panel (b) is based on a model with control variables (model 3 in Table A5).
We also study the interaction effects between disagreement with the policy and our measures of legislative quality to understand whether the effect is stronger for member states that oppose the legislation. We find that the interaction effects are not statistically significant, which suggests that vagueness tends to reduce the probability of compliance regardless of whether states opposed the legislation. To confirm this result, we demonstrate that our result holds when we re-run the analysis on the ten least controversial directives (see Appendix H for details).
We assess the robustness of our results using various tests, which are described in Appendices G and H. First, we incorporate an alternative measure of delegation (Thomson et al., Reference Thomson, Torenvlied and Arregui2007). Second, we use a different pre-processing approach. In the main text, we report the results on the corpus of texts excluding recitals and citations, which come before the provisions and are not legally binding. In Appendix G, we run the same analysis but include the recitals and citations. Third, we re-run the models with time-fixed effects. Fourth, we add additional control variables on time-varying factors. Finally, we re-run the models clustering the standard errors by legislation. The main results are robust to all of these tests.
In sum, our analysis establishes that syntactic complexity is negatively related to compliance, but that this effect is not robust to controlling for the length of texts. However, vagueness matters for compliance, even when controlling for other potential explanatory factors.
6. Concluding remarks
We study how legislative quality shapes compliance, focusing on the transposition of EU directives. High-quality legislation is expected to increase compliance because it reduces interpretation costs and misunderstandings. We propose two NLP measures of legislative quality—syntactic complexity and vagueness. Our analysis builds on the data of König and Mäder (Reference König and Mäder2014), which include detailed information on compliance cases.
The paper makes two main contributions. First, it presents quantitative evidence of how legislative quality affects compliance with EU directives. Previous qualitative research has increased our understanding (e.g., Falkner et al., Reference Falkner, Treib, Hartlapp and Leiber2005), but our systematic quantitative evidence controls for alternative explanations. In a second contribution, the paper introduces two simple NLP measures of legislative quality that examine the language of the legislative texts. These measures complement prior research, which focused on the length of sentences and the number of provisions or other formal features (e.g., Gratton et al., Reference Gratton, Guiso, Michelacci and Morelli2021). We use the case study of the EU, where compliance is a key part of the rule of law.
Our analysis reveals that the quality of legislation, measured as syntactic complexity and vagueness, is positively related to compliance with EU directives. The results for the former are not robust to controlling for the length of legislative texts since longer texts tend to be syntactically more complex. However, the effect of the latter is robust when including control variables on member states’ preferences, administrative resources, interest group structure, type of directive, length of texts, amending legislation, and government changes, as well as discretion.
We hope our paper encourages further work on the causes and consequences of legislative quality. Future research may apply unsupervised and supervised learning techniques to larger corpora to develop new measures of legislative quality. In addition, theoretical work may study the extent to which strategic interaction between actors influences the quality of legislation. Furthermore, it would be promising to evaluate the consequences of legislative quality in different political systems.
Supplementary material
The supplementary material for this article can be found at https://doi.org/10.1017/psrm.2024.21. To obtain replication material for this article, https://dataverse.harvard.edu/dataset.xhtml?persistentId=doi:10.7910/DVN/Z8LCHG&version=DRAFT.
Acknowledgements
For helpful comments and suggestions, we thank two anonymous reviewers, Tony Bertelli, Thomas König, Xiao Lu, Juraj Medzihorsky, Miguel Pereira, Gabriele Spilker, Resul Umit, and our audience at the IGRI research seminar in 2021 and the MPSA and EPSA conferences in 2022. We gratefully acknowledge funding from the British Academy/Leverhulme Small Research Grants scheme (SRG22/220129).
Competing interests
None.


 Open access