


1 INTRODUCTION
Circumstellar disks evolution is an aspect of stellar formation (Shu, Adams, & Lizano Reference Shu, Adams and Lizano1987; Zuckerman Reference Zuckerman2001; Williams & Cieza Reference Williams and Cieza2011; Dunham et al. Reference Dunham2015). In Class II young-stellar-objects, the dissipation of the protostellar envelope exposes a pre-main-sequence star surrounded by a gaseous accretion disk. In this framework, the spectral-energy-distributions (SEDs) provide constraints on radial disk structure. Central cavities (and gaps) are inferred in so-called transition disks (and pre-transitional disks, Espaillat, Calvet, D’Alessio, Hernández, Qi, Hartmann, Furl Reference Espaillat, Calvet, D’Alessio, Hernández, Qi, Hartmann, Furlan and Watson2007, TDs hereafter), whose structure is being refined with resolved observations.
This review provides a selection of structures seen in TDs, with an emphasis on the radio domain. Insights on the origin of the cavities based on TD demographics are summarised in the accompanying review by Owen (Reference Owen2015). We caution that resolved observations of TDs are affected by many biases, as they target the brightest sources with the largest cavities, so that they cannot be extrapolated to reflect the whole population (which is for now studied by complete photometric surveys, e.g. Cieza et al. Reference Cieza, Schreiber, Romero, Williams, Rebassa-Mansergas and Merín2012, Reference Cieza, Williams, Kourkchi, Andrews, Casassus, Graves and Schreiber2015). Instead, such resolved observations inform on the range of possible astrophysical phenomena at work in disks.
The observational identification of abrupt disk inclination changes (Section 2) provides the information on disk orientation required to interpret the dynamics of residual gas inside TD cavities (Section 3). The outer rings surrounding the central cavities of most TDs resolved so far in the submillimetre continuum show non-axial symmetry, with intensity contrasts from a few to ~ 100 (Section 4). Complex spiral patterns are seen in the outer disks, which are also beginning to be resolved in molecular lines (Section 5). The exciting observation of giant protoplanet candidates opens an enormous research potential, since their formation is expected to carve a radial gap, but their detection in TDs is still far from systematic (Section 6). The inferred warped accretion flows, the dramatic non-axial symmetry of some outer disks, and the observed spiral patterns, motivate questions on their origins, their connection to embedded protoplanets, and on their role in disk evolution (Section 7).
2 WARPS
Warps, or variable inclination and orientation as a function of stellocentric distance, have long been suspected to occur in circumstellar disks. In this Section, we compile evidence for warps in young circumstellar disks in a broader context, with special attention to TDs and the case of HD 142527.
2.1. Debris disks
Warps are seen in debris disks, or Class III young stellar objects that have dissipated the left-over primordial gas. This is the case of the edge-on warp seen in β Pic (Golimowski et al. Reference Golimowski2006; Millar-Blanchaer et al. Reference Millar-Blanchaer2015). Another example is AU Mic (Wang et al. Reference Wang2015; Boccaletti et al. Reference Boccaletti2015), and perhaps also HD 110058 (Kasper et al. Reference Kasper, Apai, Wagner and Robberto2015). The identification of warps in debris disks requires an edge-on view, and the lack of gaseous counterparts hampers reaching definitive conclusions on their structure, and so distinguish continuous warps from superimposed disks.
2.2. Indications of warps in gas-rich disks
Inner warps, or a tilted inclination at the disk centre, could lead to the photometric variations seen in some high-inclination (so close to edge-on) Class II classical T-Tauri starsFootnote 1 , such as in RY Lup (Manset et al. Reference Manset, Bastien, Ménard, Bertout, Le van Suu and Boivin2009), TWA 30 (Looper et al. Reference Looper2010), and AA Tau (Bouvier et al. Reference Bouvier, Grankin, Ellerbroek, Bouy and Barrado2013). The light curve variability of AA Tau is well accounted for by a magnetically induced warp on scales of a few stellar radii or ≲ 0.1 AU (Esau, Harries, & Bouvier Reference Esau, Harries and Bouvier2014), and part of the occulting structure could extend beyond 1 AU (Schneider et al. Reference Schneider, France, Günther, Herczeg, Robrade, Bouvier, McJunkin and Schmitt2015). In the NGC 2264 open cluster, up to ~ 40% of young and gas-rich cTTs with thick inner disks present AA Tau-like variability (Alencar et al. Reference Alencar2010), suggesting that such inner warps represent a fairly common phase in the early evolution of circumstellar disks (McGinnis et al. Reference McGinnis2015). Light curve variability on weeks and months timescales, due to obscuring material, has also been reported in the TDs T Cha (Schisano et al. Reference Schisano, Covino, Alcalá, Esposito and Guenther2009) and GM Aur (Ingleby et al. Reference Ingleby, Espaillat, Calvet, Sitko, Russell and Champney2015).
In TDs, warps have also been hinted at in the form of significant inclination changes in observations with different angular resolutions. For example in GM Aur, with a stellar mass ≲ 1 M⊙, Hughes et al. (Reference Hughes2009) propose a central warp to explain the small change in disk position angleFootnote 2 of 11° ± 2° when comparing the major axis of the submillimetre continuum sampled at 0.3 arcsec, with that of the CO(3 − 2) kinematicsFootnote 3 sampled at 2 arcsec. Likewise, Tang et al. (Reference Tang, Guilloteau, Piétu, Dutrey, Ohashi and Ho2012) explain that in AB Aur (~ 2 M⊙), the inclination inferred from near-IR interferometry (i ~ 20° within the central AU; Eisner et al. Reference Eisner, Lane, Hillenbrand, Akeson and Sargent2004) is close to that sampled over 20 AU scales, and lower than sampled in coarser beams (i ~ 36° outside 70 AU; Piétu, Guilloteau, & Dutrey Reference Piétu, Guilloteau and Dutrey2005). Hashimoto et al. (Reference Hashimoto2011) also conclude, from polarised-differential-imaging (PDI) in the near-IR, that the inner regions of AB Aur are warped, given the varying inclinations in a double ring structure, dropping from ~ 43° to ~ 27° over 90 to 200 AU in radius. Tang et al. (Reference Tang, Guilloteau, Piétu, Dutrey, Ohashi and Ho2012) relate the warped structure inferred from their molecular line data with a residual infalling envelope.
Yet, another example of such inclination changes with angular scale is seen in MWC 758 (~ 2 M⊙), where near-IR interferometry (with VLTI+AMBER, Isella et al. Reference Isella, Tatulli, Natta and Testi2008) yields an inclination of 30°–40° in the central AU, while Submillimeter Array (SMA) observations in CO(3 − 2), with a 0.7 arcsec beam spanning over 100 AU, yield an inclination of ~ 21° (Isella et al. Reference Isella, Natta, Wilner, Carpenter and Testi2010). Similarly, in HD 135344B (also ~ 2M⊙), the VLTI+MIDI inclination is ~ 60° (Fedele et al. Reference Fedele2008), while CO(3 − 2) data suggests 11° (Dent, Greaves, & Coulson Reference Dent, Greaves and Coulson2005), and IR direct imaging restricts < 20° (HST+NICMOS; Grady et al. Reference Grady2009).
From an observational point of view, there is a degeneracy in the line-of-sight kinematics due to variable inclination, as in a warp, and the non-Keplerian flows expected from infalling gas, as identified in TW Hya and HD 142527 by Rosenfeld et al. (Reference Rosenfeld2012) and Rosenfeld, Chiang, & Andrews (Reference Rosenfeld, Chiang and Andrews2014). In TW Hya, excess CO emission at high velocities, additional to that expected from axially symmetric disk models, could be due to a warp, that may also account for the faint azimuthal modulation in scattered light imaging reported by Roberge, Weinberger, & Malumuth (Reference Roberge, Weinberger and Malumuth2005). In HD 142527, the infalling gas reported by Casassus et al. (Reference Casassus2013b) and Casassus et al. (Reference Casassus, Perez, van der Plas, Dent, Hales and Ménard2013a) could instead be due to a warp.
2.3. The HD 142527 warp
The unambiguous identification of warps requires further evidence, in addition to the possible inclination trends with angular scales (which could be related to a variety of physical structures other than warps) and the hints provided by the molecular line data. Radiative transfers effects due to warps can provide such evidence. For instance, in HD 100546, Quillen (Reference Quillen2006) recognised how a warped structure could approximate the spiral pattern seen by HST (Grady et al. Reference Grady2001), thereby illustrating the potential of radiative transfer effects to account for non-axially symmetric structures. Indeed, Whitney et al. (Reference Whitney, Robitaille, Bjorkman, Dong, Wood and Honor2013) apply three-dimensional radiative transfer to warped disk architectures, as shown in Figure 1, showing that shadows are expected in the outer disks.
Figure adapted from Whitney et al. (Reference Whitney, Robitaille, Bjorkman, Dong, Wood and Honor2013, ©AAS, reproduced by permission), with a three-dimensional radiative transfer prediction in JHK for a warped disk configuration. The field is 4 AU on a side.

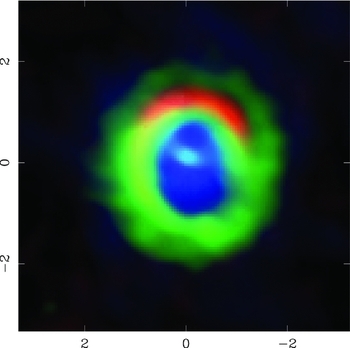
HD 142527 is an example of how such radiative transfer effects in scattered light can unambiguously determine the disk orientation and the existence of variable inclinations. In this case, the relative inclination change between the outer and inner disks reaches ~ 70° ± 5°, as shown by Marino, Perez, & Casassus (Reference Marino, Perez and Casassus2015a). Despite such a dramatic inclination change, the intensity dips originally identified by Casassus et al. (Reference Casassus, Perez, Jordán, Ménard, Cuadra, Schreiber, Hales and Ercolano2012) eluded interpretation for 3 yrs, because the direction connecting the dips is offset from the star, in contrast with that naively expected for a simple tilt. Yet, as illustrated in Figure 2, the silhouette of the shadows cast by the inner warp provide unequivocal evidence for this warp, which is further supported by the gas kinematics discussed in Section 3.
Comparison between the observed H-band polarised intensity image of HD 142527 (a- from Avenhaus et al. Reference Avenhaus, Quanz, Schmid, Meyer, Garufi, Wolf and Dominik2014a) and three-dimensional radiative transfer predictions (b- from Marino et al. Reference Marino, Perez and Casassus2015a, this is an updated version of their Figure 2). The kinematics of C18O(2 − 1) emission (Perez et al. Reference Perez2015a) give the orientation of the outer disk; the white contours in a- correspond to systemic velocities, so that the PA of the outer disk lies at ~ 160° East of North, as indicated on b-. The inner disk shadows cast on the outer disk are best reproduced with a PA of 172°, the curvature of their outline (or silhouette) is reminiscent of the observations for the Eastern side. The similarities with the observations are particularly good given the idealisations of the model, which assumes a circular cavity.

2.4. Near-term prospects: how common are warps?
Although there are indications for the frequent occurrence of inclination changes in gas-rich systems, there is so far only one clear case of a warp, i.e. in HD 142527. Next-generation adaptive-optics cameras, such as SPHERE and GPI, should soon provide substantial improvements, particularly through PDI which appears ideally suited to trace illumination effects, and so identify warps. First, results from such new AO imaging are indeed revealing intriguing intensity modulations, as in MWC 758 (Benisty et al. Reference Benisty2015), HD 135344B (Wahhaj et al. Reference Wahhaj2015), and in HD 100453 (Wagner et al. Reference Wagner, Apai, Kasper and Robberto2015). Follow-up molecular-line observations with Atacama Large Millimeter Array (ALMA) may provide the necessary clues from the gas kinematics.
3 GAS IN CAVITIES
Models predict that young giant protoplanets carve a deep gap in the dust component of protoplanetary disks, and a shallower gap in the gas and very small grains (VSGs) components (e.g. Paardekooper & Mellema Reference Paardekooper and Mellema2006; Fouchet, Gonzalez, & Maddison Reference Fouchet, Gonzalez and Maddison2010). The clearing of the protoplanetary gap is thought of as an important mechanism underlying the class of TDs, and residual gas in cavities has thus been intensely searched for.
This section describes observations of intra-cavity gas that select sufficiently large cavities to be resolved with current gas tracers, so with radii greater than a dozen AUs at the very least. Smaller cavities and inner disks have been detected by broad-band long-baseline optical interferometry (e.g. the gaps in HD 100546 or HD 139614 [Tatulli et al. Reference Tatulli2011, Matter et al. Reference Matter2016]). Such observations do not yet sample the intra-cavity gas (except for the central few stellar radii in Brɣ, e.g. Mendigutia et al.). The continuum interferometric observations have allowed to isolate the crystalline spectrum of the inner disks (as in HD 142527 [van Boekel et al. Reference van Boekel2004]), and to study the occurrence bof gaps in HAeBes (Menu et al. Reference Menu, van Boekel, Henning, Leinert, Waelkens and Waters2015)
3.1. Ro-vibrational gas and very small grains
Long-slit spectroscopy has provided indirect evidence for gas inside cavities, under the assumption of azimuthal symmetry and Keplerian rotation (Carr, Mathieu, & Najita Reference Carr, Mathieu and Najita2001; Najita, Carr, & Mathieu Reference Najita, Carr and Mathieu2003; Acke & van den Ancker Reference Acke and van den Ancker2006; van der Plas et al. Reference van der Plas, van den Ancker, Fedele, Acke, Dominik, Waters and Bouwman2008; Salyk et al. Reference Salyk, Blake, Boogert and Brown2009). Spectro-astrometry has also been used to infer a residual gas mass from ro-vibrational CO emission (Pontoppidan et al. Reference Pontoppidan, Blake, van Dishoeck, Smette, Ireland and Brown2008; van der Plas et al. Reference van der Plas, van den Ancker, Acke, Carmona, Dominik, Fedele and Waters2009; Pontoppidan, Blake, & Smette Reference Pontoppidan, Blake and Smette2011). A comprehensive analysis is presented in van der Plas et al. (Reference van der Plas, van den Ancker and Waters2015) and Banzatti & Pontoppidan (Reference Banzatti and Pontoppidan2015). The general picture is that dust cavities do indeed contain some amount of residual gas, as expected in the context of dynamical clearing.
The smallest grains are thought to be well coupled with the gas, so that they can be used as proxies. Thermal IR observations suggest the existence of smaller gaps in VSGs than in silicates, and have also led to the finding of gaps otherwise undetectable through the SED alone (Maaskant et al. Reference Maaskant2013; Honda et al. Reference Honda2015). Detailed studies of the gap structure in ro-vibrational lines along with infrared data have been performed in HD 135344B (Garufi et al. Reference Garufi2013; Carmona et al. Reference Carmona2014).
3.2. Resolved radio observations of intra-cavity gas
While the ro-vibrational detections pointed at residual intra-cavity gas, surprises were nonetheless brought by the first resolved images (Figure 3, Casassus et al. Reference Casassus2013b), made possible thanks to the advent of ALMA. The finest angular resolutions from ALMA Cycle 0 were just sufficient to resolve the largest TD cavity, i.e. that of the HD 142527 disk. A few M jup worth of gas was indeed seen inside this cavity from CO isotopologues (Perez et al. Reference Perez2015a). However, the gas kinematics were puzzling, and seemed consistent with radial infall as illustrated by the fast and centrally peaked HCO+(4 − 3). Slower intra-cavity HCO+ signal seemed to connect with the outer disk along filamentary structures, reminiscent of protoplanetary accretion streams. But the slow intra-cavity HCO+ was faint in these Cycle 0 data, and the cavity radius was sampled only with three beams. New observations in HCO+(4 − 3) are required to ascertain its structure.
Summary of Cycle 0 band 7 observations, from MEM maps, with continuum in red, HCO+(4 − 3) in green, and CO(3 − 2) in blue (adapted from Casassus et al. Reference Casassus2013b). x − and y − show offset from the star, in arcsec. Velocities have been restricted to highlight the fainter structures seen in HCO+, which are otherwise dwarfed by the fast HCO+ central emission.
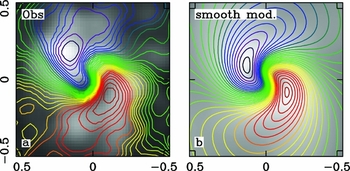
A more accurate view of the intra-cavity kinematics in HD 142527 is provided by the CO(6 − 5) line, with a higher frequency and a finer Cycle 0 beam. CO(6 − 5) is also free of the interstellar absorption that affects CO(3 − 2) (Casassus et al. Reference Casassus2013c, Reference Casassus, Perez, van der Plas, Dent, Hales and Ménard2013a). Given the warped structure of HD 142527, the line-of-sight CO(6 − 5) can be understood as infall, at the observed stellar accretion rate (Garcia Lopez et al. Reference Garcia Lopez, Natta, Testi and Habart2006), but along and through the warp. As illustrated in Figures 4 and 5, the observations are fairly well accounted for by a model with gas inside the continuous warp. At the radius where the disk plane crosses the sky, the kinematics are Doppler-flipped so that blue turns to red, and convolution with the angular resolution results in the ‘S’-shaped centroids. Interestingly, a fast and narrow warp improves the model, such that the two disk orientations are connected within ~ 3 AU, at a radius of 20 AU, with material flowing orthogonal to the local disk plane at a velocity comparable to Keplerian. These observations are based on non-parametric image synthesis that pushes the limits of the Cycle 0 beam, so that further observations are required to ascertain the details of the gaseous flows inside the warp.
Figure adapted from Casassus et al. (Reference Casassus2015a), showing the observed CO(6 − 5) kinematics in the central regions of HD 142527, and comparing with model predictions for the accretion through the warp represented in Figure 5 (convolved at the resolution of the centroid map). The origin of coordinates is set to the stellar position.
Sketch of the accretion kinematics through the warp in HD 142527 (from Casassus et al. Reference Casassus2015a). The crescent in hues of red and purple represents the distribution of mm-sized grains. Inside the warp, as it connects the two disk inclination material flows along the dashed and curved arrows.

A likely origin for the observed accretion dynamics in HD 142527 probably involves the low-mass companion, at ~ 12 AU and with a mass ratio ≲ 1/10 (Biller et al. Reference Biller2012; Close et al. Reference Close2014; Rodigas et al. Reference Rodigas, Follette, Weinberger and Close2014). The proper-motion of the companion (Lacour et al. Reference Lacour2015) seems to indicate an orbit in clockwise rotation, as for the whole disk. If HD 142527B is contained in the tilted inner disk, or if it is close to it, the properties of the warp caused by the HD142527A+B system resemble disk tearing in strongly warped circumbinary disks (Nixon, King, & Price Reference Nixon, King and Price2013; Nealon, Price, & Nixon Reference Nealon, Price and Nixon2015; Doğan et al. Reference Doğan, Nixon, King and Price2015). In the context of circumstellar disks, Facchini, Lodato, & Price (Reference Facchini, Lodato and Price2013) and Facchini, Ricci, & Lodato (Reference Facchini, Ricci and Lodato2014) show that in the thick-disk regime, where α < H/R, an inner warp greater than ~ 40° will break the disk into distinct planes. Note, however, that the low mass companion at ~ 12 AU is unlikely to have originated the 140 AU cavity, unless it is undergoing oscillations in inclination and eccentricity (i.e. Kozai cycles, see Martin et al. 2014). Further progress in the interpretation of the HD 142527 warp requires better data and tailored hydrodynamical models.
3.3. Residual gas in cavities
A summary of several other detections with ALMA of residual gas in TD cavities is given by van Dishoeck et al. (Reference van Dishoeck, van der Marel, Bruderer and Pinilla2015). Bright CO(6 − 5) emission was found ascribed to the cavities of HD 135344B and SR21 (Pérez et al. Reference Pérez, Isella, Carpenter and Chandler2014), as well as in LkCa 15, RXJ 1615-3255, and SR 24S (van der Marel et al. Reference van der Marel, van Dishoeck, Bruderer, Pérez and Isella2015a). The size of the ring in [PZ99]J160421.7-213028 is smaller in CO(2 − 1) than in the dust continuum (Zhang et al. Reference Zhang, Isella, Carpenter and Blake2014), much as in SZ 91(Canovas et al. Reference Canovas2015). The depth of the cavity in mm-sized grains follows from the submillimetre continuum. Results so far are limited by dynamic range, with depths in the mm-sized dust deeper than ~ 1/100 relative to the outer disk.
The recent state of the art 345 GHz continuum and CO(3 − 2) isotopologue data analysed by van der Marel et al. (Reference van der Marel, van Dishoeck, Bruderer, Andrews, Pontoppidan, Herczeg, van Kempen and Miotello2016) in terms of a thermochemical model, suggests that the gas cavities are up to three times smaller than the dust rings in DoAr 44, SR 21, HD 135344B, and IRS 48 (see also Bruderer et al. Reference Bruderer, van der Marel and van Dishoeck2014). The drop in gas surface density can be up to δ ~ 10−2 (the exact values vary in each object and can be calculated from the parameters given in Table 3 of van der Marel et al. Reference van der Marel, van Dishoeck, Bruderer, Andrews, Pontoppidan, Herczeg, van Kempen and Miotello2016).
The main result that transpires from the above studies, including HD 142527 (Perez et al. Reference Perez2015a), is that the depth of the cavity is shallower in the gas than in the dust, by at least a factor of 10. However, while van der Marel et al. (Reference van der Marel, van Dishoeck, Bruderer, Andrews, Pontoppidan, Herczeg, van Kempen and Miotello2016) investigate gradual cavity edges, angular resolution limits prevent firm conclusions on the distribution of the gas. Most studies assume axially symmetric and sharp cavity edges, parametrised by a step-function drop, with a depth δ ~ 1/10 − 1/100 relative to the outer disk in the gaseous component. Due to the coarse linear resolutions available, the accretion kinematics remain largely unsampled. For instance, in HD 142527 sufficient linear resolution is crucial to trace the non-Keplerian accretion flows, which are otherwise much less conspicuous when sampled with a beamwidth comparable to the cavity radius (Perez et al. Reference Perez2015a).
3.4. Near-term prospects: structure and origin of the cavities
The finest angular resolutions available from the latest ALMA results (van der Marel et al. Reference van der Marel, van Dishoeck, Bruderer, Andrews, Pontoppidan, Herczeg, van Kempen and Miotello2016) do not yet provide enough linear resolution to sample the cavity edges. However, at the time of writing several ALMA projects are currently underway in gas-rich cavities, and the first results from the next-generation AO cameras are soon due. With much finer angular resolutions, it will be possible to understand better the distribution of the gas in TDs and its kinematics, and so reconcile mass transport across TD cavities with the stellar accretion rates (which has so far only been possible in HD 142527).
A key question is on the shape of the cavity edge, which is currently modelled as a step function. Yet, the edge of the cavity gives important clue on the clearing mechanism: for instance, if planet formation, the sharpness of the edge is a function of the mass of the outermost body (e.g. Crida, Morbidelli, & Masset Reference Crida, Morbidelli and Masset2006; Mulders et al. Reference Mulders, Paardekooper, Dominik, van Boekel and Ratzka2013).
Intriguingly very few companions have been found in TDs (and only one candidate near the edge of a cavity, i.e. in the HD 169142 disk, see Section 6). A spectacular example is HD 142527, with a record-sized cavity of 140 AU and no intra-cavity protoplanet detected as yet. The binary separation in HD 142527 is ~ 10 AU (see Section 3.2) and could only account for a ~ 30 AU gas-free cavity (Artymowicz & Lubow Reference Artymowicz and Lubow1994). An interesting comparison object is the GG Tau circumbinary ring, which by contrast to HD 142527 may be explained in terms of dynamical interactions with the binary provided the edge of the cavity is ‘soft’ in the gas (Andrews et al. Reference Andrews2014; Dutrey et al. Reference Dutrey2014).
Despite the lack of detections in TD cavities, the data in HD 142527 suggest that low-mass companions can drive dramatic warps. Thus, a possible solution to the puzzle of large cavities could perhaps be found in viewing them as circumbinary disks with low mass companions undergoing Kozai oscillations, so that when the system is coplanar the binary is very eccentric (as suggested in Casassus et al. Reference Casassus2015a, pending tests with hydrodynamic simulations). Thus, in HD 142527, we could be witnessing a high-inclination phase at relatively close binary separation. Definitive conclusions on the structure of this warp require finer angular resolutions and deeper sensitivities, along with new observations in the HCO+ lines. Here, we are presented with another puzzle to reconcile models of disk tearing with the indications that even though the warp appears to be abrupt, gas continuously flows through it and connects the two disk inclinations.
Is there a binary lurking in all of the large TD cavities, as in HD 142527? Low mass companions into the brown-dwarf mass regime are difficult to detect at very close separations. The new AO cameras along with ALMA gas kinematics should soon cast light on these questions, starting with the recent detection of fairly high-mass bodies in LkCa 15 (Sallum et al. Reference Sallum2015, see Section 6).
4 LOPSIDED DISKS
Early resolved observations of TDs already suggested that the outer rings deviate from axial symmetry (in general from SMA data, Ohashi Reference Ohashi2008; Brown et al. Reference Brown, Blake, Qi, Dullemond, Wilner and Williams2009; Andrews et al. Reference Andrews, Wilner, Espaillat, Hughes, Dullemond, McClure, Qi and Brown2011). ALMA has brought confirmation and revealed the dramatic contrastFootnote 4 of the most extreme asymmetries seen in the dust continuum. To what extent do these asymmetries trace matched asymmetries in the gas? What is the efficiency of dust segregation from the gas?
4.1. The most dramatic asymmetries
4.1.1. HD 142527
The submillimetre continuum from HD 142527 is approximately shaped into a crescent (Ohashi Reference Ohashi2008; Casassus et al. Reference Casassus2013b; Fukagawa et al. Reference Fukagawa2013) and modulated by a temperature decrement under the shadow of the inner warp (Section 2.3). It is still not entirely clear to what extend is the submillimetre continuum reflecting a similarly pronounced asymmetry in the gas. Existing observations rely on optically thick tracers of the total gas mass (including small dust grains), so cannot conclude on the underlying gas distribution. The dense-gas tracers discussed by van der Plas et al. (Reference van der Plas, Casassus, Perez, Thi, Pinte and Christiaens2014, HCN(4 − 3) and CS(7 − 6)) are affected by chemistry and seem to anti-correlate with the continuum.
Recently, the Cycle 0 data in the optically thin CO isotopologues were further analysed by Muto et al. (Reference Muto2015), who estimate that the contrast in the gas-phase CO column is about a factor of 3. While this is all the existing information available on the gas contrast, at the time of writing, its extrapolation to the total gas mass is hampered by uncertainties from grain surface chemistry: The azimuthal structure in these transitions is not a smooth crescent; their emission peaks differ from the continuum. Perhaps, the gas-phase CO abundance is significantly modulated in azimuth by chemistry, or a fraction of CO could be depleted on dust grains, especially at the location of the continuum peak (at about 11 h), where continuum grey-body temperatures are ~ 22 K (Figure 6, Casassus et al. Reference Casassus2015d), so below freeze-out (Jørgensen et al. Reference Jørgensen, Visser, Williams and Bergin2015).
Figure adapted from Casassus et al. (Reference Casassus2015d). Upper row: multi-frequency data of HD 142527 brought to a common uv-coverage. The ALMA data have been filtered for the ATCA response with Monte Carlo simulations of ATCA observations on deconvolved models of the ALMA data. (a): restored ATCA image at 34 GHz. (b): average of Monte Carlo (MC) simulations of ATCA observations on the ALMA band 7 data. (c): MC simulations of ATCA observations on the ALMA band 9 data. Lower row: Grey-body diagnostics inferred from the multi-frequency data. (a): optical depth map at the reference frequency of 345 GHz. (b): line of sight emissivity index map β, with ATCA specific intensity contours in red. (c): root-mean-square uncertainties on the emissivity index map. (d): line of sight temperature, Ts .

The hydrodynamic simulations tend to predict contrast ratios of order ~ 3. Large-scale crescents in the gas surface density arise naturally in models of cavity clearing by giant planets (e.g. Zhu & Stone Reference Zhu and Stone2014). Such crescents are reproduced in hydrodynamical simulations by large-scale anti-cyclonic vortices, which result from Rossby wave instabilities triggered at sharp radial gradients in physical conditions. For instance, they have also been modelled in the context of viscosity gradients (Regály et al. Reference Regály, Juhász, Sándor and Dullemond2012). An apparently different model for such crescents, leading to more pronounced asymmetries in the gas, was proposed by Mittal & Chiang (Reference Mittal and Chiang2015) based on a global disk mode in response to a stellar offset. However, as argued by Zhu & Baruteau (Reference Zhu and Baruteau2015), if such offsets result from the shift of the system centre of mass in sufficiently massive disk, the consistent incorporation of disk self-gravity dampens the contrast of an otherwise standard large-scale anticyclonic vortex. Thus in general, the gas surface density contrasts are predicted to reach moderate values, typically ~ 3 and perhaps up to 10.
The azimuthal intensity contrast in HD 142527 reaches about 30, yet there is no hint so far of a similar contrast ratio either in the small grains (≪ 0.1 mm), nor in molecular lines, which led Casassus et al. (Reference Casassus2013b) to suggest that the mm-sized dust grains that originate the ALMA continuum were segregated from the gas. In other words, the dust-to-gas mass ratio could vary with azimuth. A promising mechanism to explain such segregation is the pile-up of larger grains in local pressure maxima (e.g. Weidenschilling Reference Weidenschilling1977; Barge & Sommeria Reference Barge and Sommeria1995; Birnstiel, Dullemond, & Pinilla Reference Birnstiel, Dullemond and Pinilla2013; Lyra & Lin Reference Lyra and Lin2013), as proposed to account for the even more dramatic submillimetre continuum contrast seen in IRS 48 (see below, van der Marel et al. Reference van der Marel2013).
An important prediction of dust trapping is that progressively larger grainsFootnote 5 should be more sharply confined. Multi-frequency radio observations may test this prediction, since grains of progressively larger size dominate the continuum emission at correspondingly longer wavelengths. Indeed, 34 GHz ATCA observations of HD 142527 revealed a compact clump of cm-wavelength-emitting grains buried into the ALMA crescent (Figure 6, Casassus et al. Reference Casassus2015d). Populations of larger grains correspond to shallower optical depth spectral index β (e.g. Testi et al. Reference Testi2014), in a parametrisation of the optical depth spectrum such that τ = τ○ × (ν/ν○)β s (β is also referred to as emissivity index). Thus, three frequency points can be used to solve for the radiation temperature, optical depth, and β index at each line of sight. Frequencies above ~ 345 GHz turned out to be optically thick (Figure 6, Casassus et al. Reference Casassus2015d), so that the spectral index trends at ALMA frequencies are due to optical depth effects rather than the underlying dust population. The ATCA clump translates into a local minimum in the β index, indicative of larger grains.
Interestingly, the optical depth at 345 GHz (Figure 6 a, bottom), shows an extension towards 2 h. Yet, the minimum in opacity spectral index β lies at 11 h, which should be the core of the pressure maximum in the dust trap scenario. Since rotation in HD 142527 goes clockwise, a possible interpretation lies in the phenomenon predicted by Baruteau & Zhu (Reference Baruteau and Zhu2015), that larger grains should concentrate significantly ahead of the dust trap. Thus at 2 h, the line of sight would intercept a disk-averaged grain population, modulated by the gaseous crescent, but the addition of larger grains (perhaps up to 1 cm sizes in this disk), might raise the total optical depth even away from the pressure maximum. However, such a shift of the larger grains is possible only with Stokes numbers S ≳ 1 (Baruteau & Zhu Reference Baruteau and Zhu2015), which for 1~cm grains would require a disk mass ~ 100 times lower than inferred from the SED modelling (Casassus et al. Reference Casassus2015d), and/or a correspondingly low gas-to-dust mass ratio.
Thus, the bulk of the data so far indicates that the spatial segregation of dust sizes in azimuth is indeed at work in the lopsided outer ring of HD 142527. However, while models have been proposed that approximate the observed segregation (through parametric models, Casassus et al. Reference Casassus2015d), they are fine-tuned in key parameters such as the α turbulence prescription and the threshold grain size for trapping.
4.1.2. IRS 48
The record-holder lopsided TD is IRS 48, where van der Marel et al. (Reference van der Marel2013) found that the contrast in ALMA band 9 is greater than 100, so three times as pronounced as in HD 142527. They reproduce such dramatic contrast with their dust trapping prescriptions.
Observations of IRS 48 are hampered by intervening cloud emission from ρ Oph, with A V ~ 10. Yet, by using the rarer CO isotopologues at higher velocities, Bruderer et al. (Reference Bruderer, van der Marel and van Dishoeck2014) estimated that the total gas mass of the disk is only ~ 10−4M⊙.
The dramatic contrast observed in IRS 48 would seem very unlikely to correspond to an equally lopsided gas distribution, and is thus probably due to segregation of grain sizes. Indeed, van der Marel et al. (Reference van der Marel, Pinilla, Tobin, van Kempen, Ricci and Birnstiel2015b) report on the tentative detection of the corresponding spectral trends in a comparison between VLA and ALMA observations. The confirmation of lopsidedness at optically thin VLA frequencies (see Figure 7) dissipates worries that the asymmetry observed at high frequencies, which are likely optically thick, could be related to optical depth effects in this highly inclined disk.
Figure adapted from van der Marel et al. (Reference van der Marel, Pinilla, Tobin, van Kempen, Ricci and Birnstiel2015b, their Figure 1, ©AAS, reproduced with permission). VLA observations of IRS 48 at optically thin frequencies confirm the extreme lopsidedness of this TD. VLA observations at 34 GHz are shown in red contours—the tail towards the NE is likely due to stellar emission. ALMA band 9 observations at 680 GHz are shown in black contours, after filtering for the VLA response. The field is 2 arcsec on a side. While at 34 GHz the crescent appears to be somewhat more compact, the role of optical depth effects in widening the 680 GHz signal remain to be quantified.

4.1.3. MWC 758
Can all continuum asymmetries in TDs be interpreted as dust traps? MWC 758 presents an interesting caveat. The VLA 34 GHz image presented by Marino et al. (Reference Marino, Casassus, Perez, Lyra, Roman, Avenhaus, Wright and Maddison2015b, reproduced in Figure 8), when compared with the more extended signal seen by ALMA, seems fairly consistent with the dust trap scenario, at least as well as in HD 142527 or IRS 48 given the available constraints. But in fact two pressure maxima (or anticyclonic vortices) would seem to be required to account for the double-peaked ALMA signal in MWC 758. Besides estimates of the submillimetre optical depth are missing—which requires finer angular resolution submillimetre data, as well as an additional frequency point intermediate with the VLA.
Figure adapted from Marino et al. (Reference Marino, Casassus, Perez, Lyra, Roman, Avenhaus, Wright and Maddison2015b, their Figure 3). VLA observations of MWC 758 compared to a deconvolved model of the ALMA band 7 visibilities. The VLA signal is shown in red contours—the red ellipse corresponds to the synthesised beam. The blue scale corresponds to an ‘MEM’ non-parametric model of the 337 GHz ALMA data—the blue ellipse corresponds to an elliptical Gaussian fit to the point-spread-function of the ‘MEM’ algorithm.

The compact VLA signal in MWC 758 may also be looked at from an entirely different perspective. Another interpretation could follow from the recent proposal by Dong et al. (Reference Dong, Zhu, Rafikov and Stone2015a) that the observed spiral pattern in MWC 758 are launched by planet could be launched by a planet exterior to the arms, at a radius of ~ 0.6 arcsec. Marino et al. (Reference Marino, Casassus, Perez, Lyra, Roman, Avenhaus, Wright and Maddison2015b) caution that the observed signal is quite close to the location of such a body, as illustrated in Figure 9. Thus, the compact signal could be circumplanetary dust that is heated by planet formation feedback, (as in the positive feedback leading to enhanced viscous heating proposed by Montesinos et al. Reference Montesinos, Cuadra, Perez, Baruteau and Casassus2015).
Left: Spiral model involving a planetary mass companion, from Dong et al. (Reference Dong, Zhu, Rafikov and Stone2015a, part of their Fig. 4, ©AAS, reproduced with permission). The companion is highlighted as a green dot—and the field is rotated so that the companion approximately matches the location of the VLA clump seen in MWC 758. Right (adapted from Marino et al. Reference Marino, Casassus, Perez, Lyra, Roman, Avenhaus, Wright and Maddison2015b): VLA data, in red contours, and ALMA 345GHz, in blue contours, overlaid on the SPHERE Y-band polarised intensity image (Benisty et al. Reference Benisty2015), in grey scale.

4.2. Mild asymmetries and radial dust traps
The above examples for extreme submillimetre continuum asymmetries are seen in few HAeBe stars (stellar mass 2 M⊙), and are not typical of the average TD. Most TDs show milder azimuthal asymmetries when resolved in the submillimetre continuum. Examples of mild contrast ratios, ≲ 4 or as could be reached by the gas, are HD 135344B, SR 21 (Pérez et al. Reference Pérez, Isella, Carpenter and Chandler2014; Pinilla et al. Reference Pinilla2015), and LkHα 330 (Isella et al. Reference Isella, Pérez, Carpenter, Ricci, Andrews and Rosenfeld2013). Given their coarseness, these observations could accommodate sharper asymmetries.
An interesting avenue to explain such mild asymmetries could be spiral arm crowding. Indeed the asymmetry reported in HD 135344B (Pérez et al. Reference Pérez, Isella, Carpenter and Chandler2014) with a relatively coarse beam in ALMA Cycle 0, has been resolved into a convergence of spiral arms (van der Marel et al. Reference van der Marel, van Dishoeck, Bruderer, Andrews, Pontoppidan, Herczeg, van Kempen and Miotello2016, their Figure 1). These spirals were hinted at in axisymmetric model residuals (Pérez et al. Reference Pérez, Isella, Carpenter and Chandler2014; Pinilla et al. Reference Pinilla2015). Local shock heating from the spiral waves (Rafikov Reference Rafikov2016) could perhaps further pronounce asymmetries related to spirals, and lead to mild asymmetries when observed in a coarse beam.
There are also examples of axially symmetric TDs, such as the TTauri J160421, SZ 91, DoAr 44 (Zhang et al. Reference Zhang, Isella, Carpenter and Blake2014; van der Marel et al. Reference van der Marel, van Dishoeck, Bruderer, Andrews, Pontoppidan, Herczeg, van Kempen and Miotello2016), and SZ 91 (Canovas et al. Reference Canovas, Caceres, Schreiber, Hardy, Cieza, Ménard and Hales2016). While azimuthal dust segregation or trapping does not seem to be required in such systems with no or mild asymmetries, on the other hand, the radial segregation of dust grain sizes seems to be systematically present in TDs. Radial trapping is often invoked as a means to halt the catastrophic inward migration of grains due to aerodynamic drag (Weidenschilling Reference Weidenschilling1977). The smaller and shallower cavities in the gas phase compared to the dust were introduced in Section 3 as a feature of dynamical clearing by giant planet formation. This is the same phenomenon as radial trapping, since it is the radial bump in gas pressure generated by planet formation that traps the larger dust grains in the outer disk (e.g. Pinilla, Benisty, & Birnstiel Reference Pinilla, Benisty and Birnstiel2012; Pinilla et al. Reference Pinilla2015).
4.3. Near-term prospects: the gas background and vortex velocity fields
The dust trap phenomenon is clearly at work in the two most extreme asymmetries, and could be an important mechanism in the evolution of the dust grain population. However, accurate knowledge of the gas background and physical conditions is required to estimate the efficiency of trapping by aerodynamic coupling. As yet, there has been no confirmation of the velocity fields expected in large-scale vortices, so an important unknown on the origin of the lopsided gas distributions remains untackled. Another open question is, for instance, the impact of enhanced cooling in the dust trap on the maximum possible gas density contrast.
Taking the dust trapping scenario one step further poses a question on the potential of such dust traps to form gaseous giants. What would be the impact on the disk of massive bodies forming inside a dust trap at large stellocentric distances? Are there signs of such bodies?
Both the observational and theoretical situations are quickly evolving. ALMA should soon provide additional multi-frequency continuum data with which to better quantify the degree of trapping and the corresponding grain distributions. Perhaps, resolved molecular line maps of dust traps could be used to detect the expected vortex velocity fields. Without an observational confirmation, however, the question on the origin of the gaseous lopsided structures is still open.
5 SPIRALS
Observations in optical/IR scattered light of spirals in protoplanetary disks have been discussed on several occasions, both in discovery articles (see below) and in modelling efforts (Juhász et al. Reference Juhász, Benisty, Pohl, Dullemond, Dominik and Paardekooper2015; Pohl et al. Reference Pohl, Pinilla, Benisty, Ataiee, Juhász, Dullemond, Van Boekel and Henning2015; Dong et al. Reference Dong, Hall, Rice and Chiang2015b). The single-star systems where spirals have been reported seem to be TDs, i.e. they host either central cavities or gaps. It is possible that these systems are in fact binaries with a low mass ratio: their spiral patterns bear similarities with the arc-like features seen in some binary disks, such as in AS 205 (Salyk et al. Reference Salyk, Pontoppidan, Corder, Muñoz, Zhang and Blake2014) and SR 24 (Mayama et al. Reference Mayama2010). The following is a list of spiral patterns in disks around primary stars that dominate by mass (relative to possible low mass bodies embedded in the disks), some of which are shown in Figure 10:
Gallery of optical/IR spirals. From left to right, we show scattered-light images of AB Aur (Fukagawa et al. Reference Fukagawa2004, part of their Fig. 3, ©AAS, reproduced with permission), HD 141569A (Clampin et al. Reference Clampin2003, part of their Fig. 8, ©AAS, reproduced with permission), HD 135344B (Garufi et al. Reference Garufi2013, part of their Fig. 1, ©ESO, reproduced with permission), and HD 100453 (Wagner et al. Reference Wagner, Apai, Kasper and Robberto2015, part of their Fig. 2, ©AAS, reproduced with permission). All figures have been reproduced by permission of the AAS or A&A. In HD 100453, we have highlighted two intensity dips where the two-armed spiral pattern seem to stem from. These dips are very reminiscent of the HD 142527 shadows, which also seem to be at the root of spirals.

-
• HD 100546, with a 13 AU gap (e.g. Tatulli et al. Reference Tatulli2011; Avenhaus et al. Reference Avenhaus, Quanz, Meyer, Brittain and Najita2014b), and tightly wound and complex spirals seen in the outer disk (Grady et al. Reference Grady2001; Boccaletti et al. Reference Boccaletti, Pantin, Lagrange, Augereau and Quanz2013);
-
• HD 142527, with a 140 AU gap and both a grand design spiral pattern in the outer disk as well as more intricate spiral features carving the outer edge of the cavity (Fukagawa et al. Reference Fukagawa, Tamura, Itoh, Kudo, Imaeda, Oasa, Hayashi and Hayashi2006; Rameau et al. Reference Rameau, Chauvin, Lagrange, Thébault, Milli, Girard and Bonnefoy2012; Casassus et al. Reference Casassus, Perez, Jordán, Ménard, Cuadra, Schreiber, Hales and Ercolano2012; Canovas et al. Reference Canovas, Ménard, Hales, Jordán, Casassus, Gledhill and Pinte2013; Avenhaus et al. Reference Avenhaus, Quanz, Schmid, Meyer, Garufi, Wolf and Dominik2014a);
-
• AB Aur, with a gap between 40 and 140 AU (Hashimoto et al. Reference Hashimoto2011), also exhibits large scale spirals that modulate the outer disk, and seen in scattered light (Grady et al. Reference Grady, Woodgate, Bruhweiler, Boggess, Plait, Lindler, Clampin and Kalas1999; Fukagawa et al. Reference Fukagawa2004);
-
• HD 141569A, in the transition to debris disk (e.g. Thi et al. Reference Thi2014), with several tightly-wound concentric rings or spirals extending out to 400 AU, and a 175 AU cavity (Biller et al. Reference Biller2015), also hosts large-scale open spirals that may result from interaction with the other members of this hierarchical multiple system (Clampin et al. Reference Clampin2003);
-
• MWC 758, with a central 100 AU cavity detected in the submillimetre (Isella et al. Reference Isella, Natta, Wilner, Carpenter and Testi2010) but not in the near-IR (Grady et al. Reference Grady2013), shows a large-scale grand design two-armed spiral (Grady et al. Reference Grady2013; Benisty et al. Reference Benisty2015) recently interpreted as interior spirals triggered by a companion at fairly wide separation (0.5 arcsec, see Figure 9, Dong et al. Reference Dong, Zhu, Rafikov and Stone2015a);
-
• HD 135344B has a ~ 30 AU dust cavity (Carmona et al. Reference Carmona2014), and a two-armed grand-design spiral best seen with PDI (Muto et al. Reference Muto2012; Garufi et al. Reference Garufi2013; Wahhaj et al. Reference Wahhaj2015);
-
• HD 100453 is a recent addition to the list of known spirals in TDs (Wagner et al. Reference Wagner, Apai, Kasper and Robberto2015; Dong et al. Reference Dong, Zhu, Fung, Rafikov, Chiang and Wagner2016). This HAe disk, with ring enclosing a cavity of ~ 20 AU, displays a two-armed spiral pattern stemming from the ring, fairly open and extending out to ~ 42 AU.
There are, however, only two examples of molecular-line counterparts to the near-IR spirals in protoplanetary disks. The AB Aur IR spirals were also detected in the CO isotopologues (Corder, Eisner, & Sargent Reference Corder, Eisner and Sargent2005; Lin et al. Reference Lin, Ohashi, Lim, Fukagawa and Tamura2006). Intriguingly, the spirals in AB Aur appear to counter-rotate with the disk, which led Tang et al. (Reference Tang, Guilloteau, Piétu, Dutrey, Ohashi and Ho2012) to propose that they stem from an infalling envelope (but the apparent counter-rotation could also result from a Doppler flip due to a warp, see Section 2.2). As summarised in Figure 11, Christiaens et al. (Reference Christiaens, Casassus, Perez, van der Plas and Ménard2014) reported very large scale 12CO spirals in HD 142527, one of which appears to have a clear counterpart in the most conspicuous IR spiral found by Fukagawa et al. (Reference Fukagawa, Tamura, Itoh, Kudo, Imaeda, Oasa, Hayashi and Hayashi2006).
Radio spirals from HD 142527 (Figure adapted from Christiaens et al. Reference Christiaens, Casassus, Perez, van der Plas and Ménard2014). The CO(2 − 1) peak signal is shown on the left, while CO(3 − 2) is shown on the right (the gray ellipse correspond to the clean beams). x − and y − axis indicate angular offset from the star, along RA and Dec., and in arcsec. Since the distance to HD 142527 is about 140 pc, the spirals are seen to extend out to 700 pc in radius. The lozenge symbols indicate the most conspicuous IR spiral, from Fukagawa et al. (Reference Fukagawa, Tamura, Itoh, Kudo, Imaeda, Oasa, Hayashi and Hayashi2006). The inverted-V decrement in peak CO intensity, seen in both transitions, is due to interstellar absorption at velocities that correspond to these locations in the Keplerian outer disk.
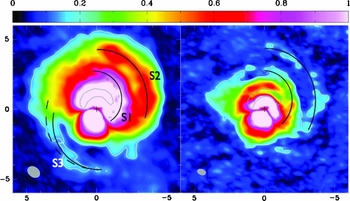
The radio detection of spirals in molecular-lines is very important to estimate physical conditions, and search for kinematic trends, such as deviations from Keplerian rotation (as in AB Aur), that may help understand the origin of the spirals. Velocity dispersion maps may perhaps also be used to detect the compression wave. For now, the molecular-line spirals in HD 142527 allow estimates of temperature and column densities. Christiaens et al. (Reference Christiaens, Casassus, Perez, van der Plas and Ménard2014) find that the spirals are surprisingly cold, with 25 K near the continuum ring, and down to 10–15 K further out. The Toomre Q parameter, Q = c sΩ/(πGΣ), for each of the two spirals S 1 and S 2, are 100 < Q S1 < 50000, and 50 < Q S2 < 35000, where the lower bound stems from the continuum non-detection (assuming a gas-to-dust ratio of 100), and the upper bound is set by the assumption of optically thin 12CO. Thus, the spirals seen in the outer disk of HD 142527 appear to be gravitationally stable.
5.1. Near-term prospects: radio counterparts
The near future should see a multiplication of radio counterparts to the IR spirals (e.g. the continuum counterparts in HD 135344B; van der Marel et al. Reference van der Marel, van Dishoeck, Bruderer, Andrews, Pontoppidan, Herczeg, van Kempen and Miotello2016). Radio observations, especially in molecular lines, are required to estimate physical conditions such as density and temperature, and so find clues as to the origin of spirals. In addition, radio observations should help in disentangling radiative transfer effects, such as proposed by Quillen (Reference Quillen2006).
There are several on-going efforts on the theoretical side, with the coupling of three-dimensional hydrodynamics and three-dimensional radiative transfer applied to planet–disk interaction (e.g. Ober et al. Reference Ober, Wolf, Uribe and Klahr2015; Perez et al. Reference Perez, Dunhill, Casassus, Roman, Szulágyi, Flores, Marino and Montesinos2015b; Dong et al. Reference Dong, Zhu, Rafikov and Stone2015a). However, in addition to the gravitational interaction with massive bodies, either planetary-mass or stellar, as in multiple stellar systems, perhaps other physical mechanisms may also launch spirals in circumstellar disks. One possibility is gravitational instability of the disk, whose observability in scattered light has recently been predicted from three-dimensional radiative transfer and hydrodynamics (Dong et al. Reference Dong, Hall, Rice and Chiang2015b). Another example, motivated by the obvious link of the HD 142527 spirals with the shadows cast on the outer disk by the inner warp (which may also be observed in HD 100453), is the proposal by Montesinos et al. (Reference Montesinos, Perez, Casassus, Marino, Cuadra and Christiaens2016) that spirals could result from the forcing of the temperature field in the outer disk, as it is modulated by variable illumination due to non-axially symmetric shadowing from the inner regions. This idea is illustrated in Figure 12.
Spirals launched from the temperature forcing of the outer disk by shadows projected from a tilted inner disk—as in HD 142527 (and perhaps also in HD 100453). The image shows a snapshot of the density field at 250 orbits, under the effect of shadows aligned in the East–West direction (from Montesinos et al. Reference Montesinos, Perez, Casassus, Marino, Cuadra and Christiaens2016).

6 THE ROLE OF EMBEDDED PROTOPLANETS
Key to understanding the astrophysics of circumstellar disks, and eventually giant planet formation, is definitive information on the protoplanetary systems that these disks potentially host. Three promising protoplanet detections have recently been reported from their thermal signal at ~ 3 μm, in the gapped disks HD 100546 (Quanz et al. Reference Quanz, Amara, Meyer, Kenworthy, Kasper and Girard2013, Reference Quanz, Amara, Meyer, Girard and Kasper2015), HD 169142 (Reggiani et al. Reference Reggiani2014) and in LkCa 15 (Sallum et al. Reference Sallum2015). In the case of LkCa 15, the interpretation in terms of an accreting body is strengthened by the detection of coincident and unresolved Hα emission.
The interpretation of unresolved continuum signals at low contrasts is difficult, as the protoplanet accretion luminosity leads to a positive feedback in stellocentric accretion (Montesinos et al. Reference Montesinos, Cuadra, Perez, Baruteau and Casassus2015), resulting in an extended thermal signal well in excess of genuine photospheric emission, and perhaps also a local enhancement in scale height. An example of such extended near-IR emission, both in thermal emission (e.g. in L band) and in scattered-light (e.g. in K band), could be the spatially extended signal from HD 100546b (Garufi et al. Reference Garufi2016).
In general the morphological details of the extended signal from such candidate circumplanetary regions are very difficult to ascertain because of observational biases, either in the high-contrast techniques or in near-IR interferometry, which are being tackled by technological breakthroughs (i.e. with extreme AO cameras such as GPI and SPHERE, and the next-generation interferometry instruments such as VLTI-MATISSE). Examples of such biases are the radiative transfer effects at finite inclination that lead to asymmetries in otherwise axially symmetric disks, and to similar closure phase signals as binary models (as in FL Cha and T Cha, Cieza et al. Reference Cieza2013; Olofsson et al. Reference Olofsson2013).
A different avenue to detect embedded protoplanets, and estimate their mass, is to identify the corresponding kinematical signature of the circumplanetary disk (CPD). Perez et al. (Reference Perez, Dunhill, Casassus, Roman, Szulágyi, Flores, Marino and Montesinos2015b) study the observability of such CPDs with ALMA using molecular lines, by coupling 3D hydrodynamical simulations and radiative transfer, and after filtering for the instrumental responseFootnote 6 . They predict that the CPD from an accreting gaseous giant should stand out in velocity dispersion maps. In addition the channel maps with disk emission at the position of the protoplanet should show a kink (i.e. a tight local bend), whose amplitude depends on the planet mass. Starting from ALMA Cycle 3, such long baseline observations with ALMA are routinely possible, so that prospects are good for the detection of the kinematical signatures of CPDs.
7 CONCLUSION
While accurate knowledge on the existence of embedded protoplanetary systems is still far from systematically available, resolved observations of TDs reveal surprising structures. The observed phenomena do not readily fit in the picture expected for TDs as sculptures of planet formation. Instead, the basic idea of flat protoplanetary disk system is being challenged by the observations of warps, whose frequency remains to be assessed. Residual gas inside cavities is clearly observed, as expected for dynamical clearing, but the concomitant protoplanetary streamers are still elusive. The observed intra-cavity stellocentric accretion, in the single case where it has been detected, occurs at much higher velocities than expected for planetary accretion streams.
The outer regions of TDs often seem to be non-axially symmetric—quite dramatically so in a couple of instances. This observation could bring confirmation for the scenario of ‘dust trapping’ as a way to circumvent the catastrophic infall of the larger dust grains due to aerodynamical drag. While dust size segregation has clearly been demonstrated to exist, the origin of the required gaseous asymmetry in a large anticyclonic vortex remains to be confirmed observationally. There does not seem to be a clear observational connection between the outer disk asymmetry and on-going planet formation, as illustred by the case of LkCa 15, with a detection of protoplanetary accretion (Sallum et al. Reference Sallum2015), and a seemingly perfectly symmetric outer disk (van der Marel et al. Reference van der Marel, van Dishoeck, Bruderer, Pérez and Isella2015a).
The observations of TDs have also revealed spectacular spiral arms, the origin of which still remains the subject of intense debate. They could be launched by planets, or result from gravitational instability, or be induced from variable illumination (Montesinos et al. Reference Montesinos, Perez, Casassus, Marino, Cuadra and Christiaens2016). Once launched, the frequent observation of spirals in systems with cavities and non-axially symmetric outer disks suggests that spirals may play a crucial role in disk evolution, as argued by Rafikov (Reference Rafikov2016). New data will soon provide estimates of physical conditions with which to test these ideas.
Finally, it appears that physical processes other than planet formation are governing the TD phase of Class II YSOs, since most large cavities seem empty of massive bodies. Perhaps, well identifiable planet formation structures have to be searched for at earlier evolutionary stages, i.e. in Class I disks such as HL Tau (ALMA Partnership et al. 2015; Testi et al. Reference Testi2015; Dipierro et al. Reference Dipierro, Price, Laibe, Hirsh, Cerioli and Lodato2015; Gonzalez et al. Reference Gonzalez, Laibe, Maddison, Pinte and Ménard2015; Pinte et al. Reference Pinte, Dent, Ménard, Hales, Hill, Cortes and de Gregorio-Monsalvo2016).
ACKNOWLEDGEMENTS
We thank the following disk workers for very useful input: Henning Avenhaus, Amelia Bayo, Mark Booth, Valentin Christiaens, Lucas Cieza, Sebastián Marino, Matías Montesinos, Johan Olofsson, Sebastián Pérez, Dave Principe, Nienke van der Marel, Gerrit van der Plas and Matthias Schreiber. Financial support was provided by Millennium Nucleus RC130007 (Chilean Ministry of Economy), and additionally by FONDECYT grant 1130949.


