


Introduction
Diabetes is a chronic metabolic disorder associated with microvascular and macrovascular complications, especially in cases of non-adherence to medication and recommended lifestyle (DeCoster, Reference DeCoster2001; García-Pérez et al., Reference García-Pérez, Alvarez, Dilla, Gil-Guillén and Orozco-Beltrán2013). The non-insulin-dependent diabetes mellitus (type 2 diabetes mellitus) accounts for 90% of all diabetic patients (Tripathi and Srivastava, Reference Tripathi and Srivastava2006). In the world, the prevalence of diabetes is estimated at 9.3%, representing a total of 463 million people living with this disease (Saeedi et al., Reference Saeedi, Petersohn, Salpea, Malanda, Karuranga, Unwin, Colagiuri, Guariguata, Motala, Ogurtsova, Shaw, Bright and Williams2019). In France, diabetes affects 3.3 million people, which corresponds to 5% of the population (Fosse-Edorh et al., Reference Fosse-Edorh, Mandereau-Bruno and Piffaretti2018). In 2019, the national incidence was estimated to be about 10 new cases per 1000 inhabitants per year for type 2 diabetes mellitus and 10 new cases per 100,000 inhabitants per year for insulin-dependent diabetes mellitus (type 1 diabetes mellitus) (Piffaretti et al., Reference Piffaretti, Mandereau-Bruno, Guilmin-Crepon, Choleau, Coutant and Fosse-Edorh2019; Fuentes et al., Reference Fuentes, Mandereau-Bruno, Regnault, Bernillon, Bonaldi, Cosson and Fosse-Edorh2020).
International guidelines on diabetes control strongly encourage the implementation of the Therapeutic Educational Programs (TEP) (Scottish Intercollegiate Guidelines Network, 2010; International Diabetes Federation, 2017; National Institute for health and Care Excellence, 2019; American Diabetes Association, 2020; Buse et al., Reference Buse, Wexler, Tsapas, Rossing, Mingrone, Mathieu, D’Alessio and Davies2020). TEP seems to be effective with diabetes patients, particularly on glycemic control (Deakin et al., Reference Deakin, McShane, Cade and Williams2005; Loveman et al., Reference Loveman, Frampton and Clegg2008; Trento et al., Reference Trento, Gamba, Gentile, Grassi, Miselli, Morone, Passera, Tonutti, Tomalino, Bondonio, Cavallo and Porta2010; Trouilloud & Regnier, Reference Trouilloud and Regnier2013; Cani et al., Reference Cani, da Lopes, Queiroz and Nery2015; Coppola et al., Reference Coppola, Sasso, Bagnasco, Giustina and Gazzaruso2016). However, more than half of the patients fail to control their diabetes a few months post-TEP because of a lack of regular follow-up by medical professionals (Albano et al., Reference Albano, Crozet and d’Ivernois2008; Wexler et al., Reference Wexler, Beauharnais, Regan, Nathan, Cagliero and Larkin2012).
In recent years, the pharmacist’s role has developed in diabetic patient care. Numerous reviews have proven that the contribution of pharmacists to achieving better control of diabetes was significant (Jameson & Baty, Reference Jameson and Baty2010; Aguiar et al., Reference Aguiar, da Silva, Chiann, Dórea, Lyra and Storpirtis2018; Deters et al., Reference Deters, Laven, Castejon, Doucette, Ev, Krass, Mehuys, Obarcanin, Schwender and Laeer2018; Iqbal et al., Reference Iqbal, Khan, Iqbal and Syed Sulaiman2019; Abdulrhim et al., Reference Abdulrhim, Sankaralingam, Ibrahim and Awaisu2020; Nogueira et al., Reference Nogueira, Otuyama, Rocha and Pinto2020). Pharmaceutical intervention was provided by the pharmacist alone or by a multidisciplinary health care team including the pharmacist (Aguiar et al., Reference Aguiar, de Brito, de Lima, Santos, Lyra and Storpirtis2016; Bukhsh, Khan, et al., Reference Bukhsh, Khan, Lee, Lee, Chan and Goh2018; Newman et al., Reference Newman, San-Juan-Rodriguez, Parekh, Swart, Klein-Fedyshin, Shrank and Hernandez2020). Educational and/or counseling intervention was provided during group and individual sessions, in hospital or in ambulatory care (Aguiar et al., Reference Aguiar, de Brito, de Lima, Santos, Lyra and Storpirtis2016; van Eikenhorst et al., Reference van Eikenhorst, Taxis, van Dijk and de Gier2017). Some studies combine both group and individual sessions (Doucette et al., Reference Doucette, Witry, Farris and McDonough2009).
The DIAB-CH (Diabetes City-Hospital) is a TEP associated with the follow-up of diabetic patients by primary healthcare professionals, and, more precisely, community pharmacists. In France, as in other countries of the European Union, pharmacists are not authorized to prescribe. General advice related to lifestyle measures and the proper use of medication are provided by the prescriber when issuing the prescription and by the community pharmacist when dispensing medicines. Pharmacists have thus always been able to play a role in the improvement of clinical outcomes, health status and lifestyle factors in patients known for failing to reach the clinical and biological goals assigned by their diabetologists (ie, body mass index (BMI) and glycated hemoglobin (HbA1c) respectively) (Jameson & Baty, Reference Jameson and Baty2010; van Eikenhorst et al., Reference van Eikenhorst, Taxis, van Dijk and de Gier2017; Yaghoubi et al., Reference Yaghoubi, Mansell, Vatanparastc, Steeves, Zeng and Farag2017; Aguiar et al., Reference Aguiar, da Silva, Chiann, Dórea, Lyra and Storpirtis2018; Bukhsh, Khan, et al., Reference Bukhsh, Khan, Lee, Lee, Chan and Goh2018; Deters et al., Reference Deters, Laven, Castejon, Doucette, Ev, Krass, Mehuys, Obarcanin, Schwender and Laeer2018; Iqbal et al., Reference Iqbal, Khan, Iqbal and Syed Sulaiman2019; Michiels et al., Reference Michiels, Bugnon, Chicoye, Dejager, Moisan, Allaert, Hunault, Romengas, Méchin and Vergès2019; Syarifuddin et al., Reference Syarifuddin, Nasution and Dalimunthe2019; Abdulrhim et al., Reference Abdulrhim, Sankaralingam, Ibrahim and Awaisu2020; Nogueira et al., Reference Nogueira, Otuyama, Rocha and Pinto2020).
The aim of the present study was to compare clinical (BMI) and biological (HbA1c) parameters observed in control (no TEP-H or community pharmacist intervention), TEP-H (TEP in hospital only) and DIAB-CH (TEP-H plus tailored counseling sessions from community pharmacists) groups, composed of diabetic patients hospitalized in our establishment for treatment of their disease.
Methods
Setting
We conducted a retrospective and comparative cohort study on diabetic patients hospitalized for uncontrolled diabetes in a short-stay unit (hospitalization ≤5 days) in the 2000-bed University Hospital of Tours in France that provides targeted care for patients with uncontrolled type 1 and type 2 diabetes (HbA1 outside the target or frequent hypoglycemia). During this hospitalization, clinical and biological examinations are carried out and diabetic treatments are re-evaluated. This study was conducted between January 2017 and December 2017, with a 12-month follow-up subsequent to discharge.
Ethical approval
Data processing information, especially about the recipients and the purposes of the data processing as well as the right to object to it, has been provided to all participants. This study was approved by the Ethics Committee of our establishment (‘Clinical Ethics Group’, project number n = 2020022).
Design of the local TEP-H
The short-stay unit of the diabetology department is composed of 40 beds on two equal wards (n = 20). For organizational reasons, only one sector offers TEP-H to inpatients. Admission within these two areas is random and does not rely on patient profile but on the availability of beds. This TEP-H was authorized by the Regional Health Agency, in accordance with article L1162-1 of the French Public Health Code.
The TEP-H is devoted to patients with type 1 and type 2 diabetes. It includes group sessions on topics concerning medicines (adherence, dosage, drug-related problems, indication, storage and use) and pathology (eg, pathophysiology of diabetes, management of hypoglycemia and hyperglycemia and foot care). A maximum of four patients are included in each group session. For patients who do not understand the French language, sessions are offered in the presence of interpreters. This TEP-H is conducted by a multidisciplinary team composed of two diabetologists, two dieticians and seven nurses. In total, three to five sessions per day are organized from Monday to Thursday. At the end of the program, an assessment of acquired/non-acquired skills is carried out by a nurse during an individual session and a standardized report (pre-filled) is completed by the multidisciplinary educational team. This TEP-H report mentions acquired/non-acquired skills, blood glucose and HbA1C targets assigned by the diabetologist. The TEP-H report is forwarded by secure email to the patient’s general practitioner (regular care).
Description of the study intervention: the DIAB-CH program
The DIAB-CH is a TEP-H associated with the follow-up of diabetic patients by the community pharmacist (Figure 1). This coordinated support program between community pharmacists and hospital health professionals was implemented in July 2017 in the diabetology department of our teaching hospital by the pharmaceutical team and diabetologists. This program, dedicated to diabetic patients included in the TEP of our hospital, was presented to all members of the educational team and a leaflet describing the stages of the DIAB-CH program was displayed in this department. It was integrated into the local TEP-H without changing its organization. The presentation of the organization and the objectives of the DIAB-CH program to the patients was an essential preliminary step in order to obtain consent from the patient. Another specific leaflet designed for patients and describing the organization of the program was given to them to support the initial presentation. Patients who agreed to participate in the DIAB-CH program had to sign a consent form stating that they accepted the transmission of their TEP-H report to their community pharmacist. This consent form indicated the surname, first name and date of birth of the patient. In the second part, clearly- explained, precise information about the objective and the description of the DIAB-CH program was provided. In the last part, the patient had to sign and date the form if he gave informed consent to participate in the program.
Design of the DIAB-CH program. This program relies on a city/hospital collaboration of health professionals: 1/ in hospital, multidisciplinary educational team performs the collective TEP sessions and draws up the TEP report for general practitioners and community pharmacists; 2/ hospital pharmacists forward TEP report and information sheets to community pharmacists; 3/ in city, community pharmacists conduct individual counseling sessions related to the diabetic patients’ difficulties mentioned in the TEP report each time medication is dispensed.
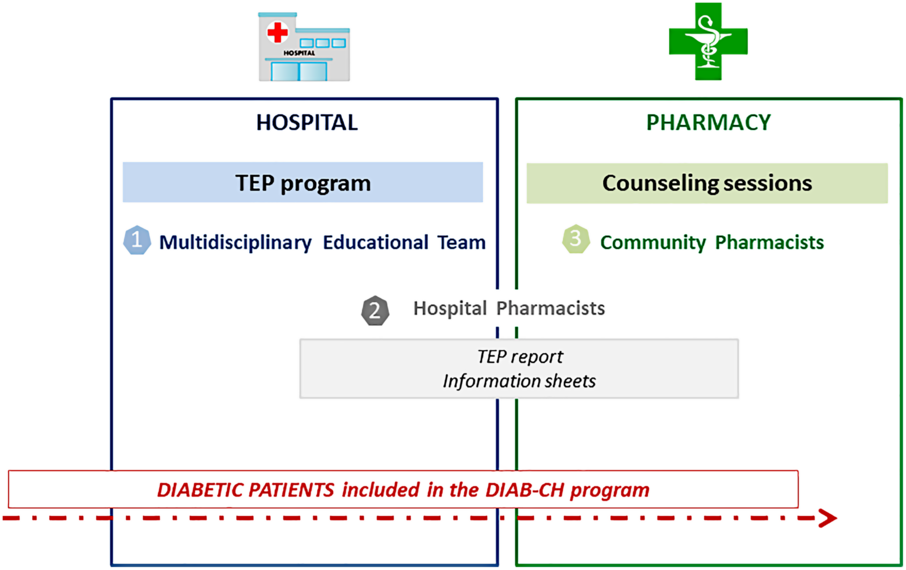
The hospital pharmacists were in charge of the coordination between community pharmacists and hospital health professionals. The community pharmacists of patients who agreed to participate in the DIAB-CH program were contacted by phone by hospital pharmacists. The discussion started with the presentation of the organization of the DIAB-CH program. Community pharmacists were offered the choice whether to accept or refuse to participate in the DIAB-CH program. If they agreed, the TEP-H report was forwarded by secure email to the patient’s general practitioner (regular care) and community pharmacist (only in DIAB-CH group) to inform them about the difficulties encountered by their patients to manage their disease. The second part of the discussion focused on pharmaceutical care. A protocol concerning the counseling sessions was drawn up and forwarded to the community pharmacists. The community pharmacists had to carry out counseling sessions, face-to-face, related to the patient’s difficulties with regard to medication (adherence, dosage, drug-related problems, indication, storage and use) or lifestyle measures (diet, foot care, medical follow-up) mentioned in the TEP-H report. To carry out those tailored counseling sessions, the community pharmacist could consult information sheets prepared by the mixed medical and pharmaceutical hospital team to harmonize the information communicated to patients between community pharmacists and hospital health professionals. These documents have been reviewed by an association of diabetic patients (Association des diabétiques de Loir-et-Cher - https://www.federationdesdiabetiques.org/) and by the regional medicines observatory (http://www.omedit-centre.fr/) in order to better target the needs of patients and their advisors and to facilitate the reading and comprehension of the documents. These counseling sessions were performed each time medicine was dispensed to the patient (at least every three months). The first session had to be performed no later than one month after the hospital discharge.
Distribution of participants per study groups
Patients included in the TEP-H from January 2017 to June 2017 (before the implementation of the DIAB-CH program) were enrolled in the TEP-H group (n = 20) and patients hospitalized over the same period, but not receiving TEP-H, were enrolled in the control group (n = 20). Patients included in the TEP-H from July 2017 to December 2017 (after the implementation of the DIAB-CH program) were enrolled in the DIAB-CH group (n = 20).
Patients with no regular community pharmacy, as well as those who both showed difficulty understanding language and were not accompanied by a caregiver, were excluded from the DIAB-CH program. The absence of a caregiver to help them understand could have been an obstacle to the effective involvement of the community pharmacist in the program. The assessment of patients’ understanding of the language was subjective (no language comprehension level test used) and at the discretion of the diabetologist who saw the patient during medical consultations.
Feedback from patients on the DIAB-CH program
The feedback from the patients 12 months after their inclusion in the DIAB-CH program was collected during a phone survey focused on the role of community pharmacists in helping patients manage their illness, and on confidentiality in their pharmacy. The phone survey, based on a structured interview, was performed by the same hospital pharmacist for all patients and included the following five questions:
-
How many times have you met your pharmacist in the past 12 months?
-
Did you find the education sessions with your pharmacist very beneficial, beneficial or unhelpful to help you manage your illness?
-
Regarding the confidentiality of your discussions in the pharmacy, are you satisfied, moderately satisfied or dissatisfied?
-
Would you like to talk for longer and/or more frequently with your community pharmacist? – In your opinion, what is the added value of your community pharmacist’s participation in your treatment compared to that of other community healthcare professionals who support you in the management of your diabetes?
Evaluation of time spent on the program by community pharmacists
The time allocated by community pharmacists to the program was collected three months after the inclusion of patients by means of a written questionnaire distributed by hospital pharmacists.
Biological and clinical parameters measurements
One of the purposes of DIAB-CH is to improve the self-management of patients with type 1 and type 2 diabetes through more tailored pharmaceutical care by the community pharmacists. However, such a combined hospital/community follow-up system requires the time and investment of many professionals and its real benefit for patient’s health remains to be proved.
The impact of these therapeutic educational procedures has been evaluated for each patient by measuring two parameters: the BMI and the Hb1Ac level. The BMI (kg/m2) was determined from patient height (m2) and weight (kg) during hospitalization (M0) and at M0 + 6 (±1) and M0 + 12 (±1) months post-hospitalization during planned medical consultations. HbA1c was measured by high-performance liquid chromatography (HPLC) at the same time. The HbA1c and the BMI were recorded by the diabetologist in the patient’s medical records.
The participants had individualized HbA1c targets assigned by the diabetologist according to their profile (type of diabetes, age, existence of complications and/or comorbidities) (Table 1). All patients hospitalized in the short-stay unit of the diabetology department and included in the study had an HbA1c higher than the target value (%). An HbA1c target was therefore assigned to every participant. It is to be noted that the BMI survey only concerned patients with a BMI over 30 kg/m2 when measured at M0. In this case, weight loss in order to achieve a BMI under 25 kg/m2 was indicated as an objective to patients on entering the program.
Target values for HbA1c in accordance to international guidelines according to the type of diabetes and the patient’s profile (Scottish Intercollegiate Guidelines Network, 2010; Haute Autorité de Santé, 2013; Société Française d’Endocrinologie, 2015; International Diabetes Federation, 2017; Vela et al., Reference Vela2018; National Institute for health and Care Excellence, 2019; American Diabetes Association, 2020)

Statistical analysis
The results were analysed using the GraphPad Prism™ v.7 software (San Diego, California, USA). The non-normal distribution of HbA1c and BMI values when using the D’Agostino-Pearson normality test led us to use the Friedman test (Friedman, Reference Friedman1940). Friedman’s test is a non-parametric test that compares three or more paired groups. Hence, HbA1c and BMI were individually compared between M0, M6 and M12 in the control, TEP-H and DIAB-CH groups with this statistical test (significant level set at 5%). In the event of significant differences between the three groups, P-values were corrected for False Discovery Rate by the Benjamini-Hochberg method and the adjusted P-values (q-values) were reported (Lee and Lee, Reference Lee and Lee2018).
The Kruskal-Wallis test is a non-parametric test that compares three or more unpaired groups. Median (Mdn) levels of HbA1c and BMI of the control, TEP-H and DIAB-CH groups were compared at M0, M6 and M12 by the Kruskal-Wallis test (significant level set at 5%) Ostertagová et al., Reference Ostertagová, Ostertag and Kováč2014).
Results
Patients’ profiles and duration of counseling sessions
The characteristics of patients are listed in Table 2. The additional time allocated by community pharmacists to the program was estimated at approximately 10 min per visit.
Profile of patients included in the Control, TEP-H and DIAB-CH groups. DT1 refers to patients with type 1 diabetes mellitus and DT2 refers to patients with type 2 diabetes mellitus. SD, standard deviation
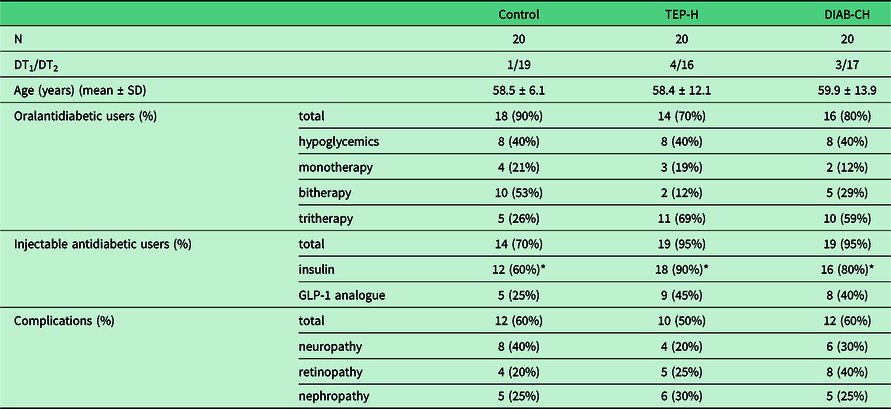
* including 3 (CTE), 4 (TEP-H) and 5 (DIAB-VH) patients treated with both insulin and GLP-1 analogue
Feedback about the DIAB-CH program by patients
Sixteen patients out of 20 agreed to respond. Among these patients, 14 (87.5%) had met their community pharmacist every two months and 2 (12.5%) every three months. The majority of them (n = 14) deemed the pharmaceutical sessions to be very beneficial. Two patients (12.5%) considered the sessions with the pharmaceutical team about their condition and treatments unhelpful.
Concerning confidentiality in the community pharmacy, nine patients (56.2%) were satisfied, six patients (37.5%) moderately satisfied and one dissatisfied. Eleven patients (69%) would like to be able to talk for longer and/or more frequently with their community pharmacist about their condition and associated treatments. Among these 11 patients, 3 patients would like monthly pharmaceutical sessions to have reminders about the correct use of their medication and the potential side effects. According to the participants, the pharmacist’s added value lies in his proximity to them and his knowledge of medicine.
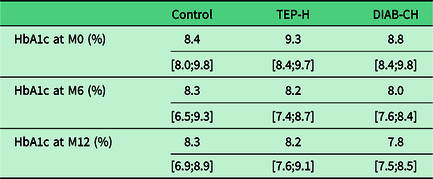
HbA1c measurements at M0, M6, M12 post-TEP-H
The Friedman’s test showed that there was no significant difference between M0, M6 and M12 in Control group (X2 F(2) = 1.64, P = 0.4402). However, there was a significant difference between M0, M6 and M12 in both TEP-H and DIAB-CH groups (respectively, X2 F(2) = 7.81, P = 0.0201 and X2 F(2) = 11.87, P = 0.0026). In the TEP-H group, post-hoc test using the Benjamini-Hochberg procedure showed that HbA1c at M0 (Mdn = 9.3) was significantly higher than HbA1c at M6 (Mdn = 8.2) (rank sum diff. = 17, q-value= 0.0216, P = 0.0072), while no significant difference was measured between M0 and M12 (Md n = 8.15) (X2 F(2) = 11.5, P = 0.069). In the DIAB-CH group, post-hoc test using the Benjamini-Hochberg procedure showed that HbA1c at M0 (Mdn = 8.8) was significantly higher than HbA1c at M6 (Mdn = 8.0) (rank sum diff. = 18.5, q-value= 0.0018, P = 0.0034) and at M12 (Mdn = 7.8) (rank sum diff. = 19, q-value= 0.0018, P = 0.0027) (Figure 2) (Table 3).
Evolution of HbA1c measured in the Control (n = 20), TEP (n = 20) and DIAB-CH (n = 20) groups (respectively, in green, blue and red). For each group, the symbol represents the median at M0, M6 and M12 (**P < 0.01).

Glycated hemoglobin (HbA1c) (%) measured in Control (n = 20), TEP-H (n = 20) and DIAB-CH (n = 20) groups at M0, M6 and M12. For each group and at each time, the median and the 95% confidence interval values are represented
In the Control group, patients were assigned an HbA1c target either at 7% (n = 18); 7.5% (n = 1) or 8% (n = 1). In the TEP-H group, patients were assigned an HbA1c target either at 7% (n = 17); 7.5% (n = 2) or 8% (n = 1). In the DIAB-CH group, patients were assigned an HbA1c target either at 7% (n = 13); 7.5% (n = 5) or 8% (n = 2). For each patient, the difference was calculated between the individual HbA1c levels measured at M0, M6 and M12 and the HbA1c target assigned respectively (Figure 3). The Friedman’s test showed no significant difference in the Control group (X2 F (2) = 0.62, P = 0.073). However, there was a significant difference between M0, M6 and M12 in both TEP-H and DIAB-CH groups (respectively, X2 F (2) = 6.63, P = 0.03 and X2 F (2) = 11.68, P = 0.0029). In the TEP-H group, post-hoc test using the Benjamini-Hochberg procedure showed that the difference between the easured HbA1c and the assigned target at M0 (Mdn = 2.1) was significantly higher than the difference at M6 (Mdn = 1.1) (rank sum diff. = 17, q-value= 0.0151, P = 0.0072), while no significant difference was measured between M0 and M12 (Md n = 1.2) (X2 F (2) = 11.5, P = 0.12). In the DIAB-CH group, the Benjamini-Hochberg procedure showed that the difference between the measured HbA1c and the assigned target at M0 (Mdn = 1.75) was significantly higher than the difference at M6 (Mdn = 0.9) (rank sum diff. = 18, q-value= 0.0023, P = 0.0044) and at M12 (Mdn = 0.75) (rank sum diff. = 18, q-value= 0.0023, P = 0.0044).
Evolution of the difference between HbA1c measured and HbA1c targeted in the Control (n = 20), TEP (n = 20) and DIAB-CH (n = 20) groups at M0, M6 and M12 post-TEP. For each group, the symbol and the error bars represent the median and the 95% confidence interval, respectively (**P < 0.01).

We measured 44% and 57% decreases between M0 and M12 in TEP-H and DIAB-CH groups, respectively.
A Kruskal-Wallis test showed no significant difference between Control, TEP-H and DIAB-CH groups either at M0 (H(2) = 0.45, P = 0.80) and M6 (H(2) = 0.65, P = 0.73) or at M12 (H(2) = 0.83, P = 0.66).
The individual analysis reports that an increase in HbA1c 12 months after hospitalization was observed for nine patients in Control group, seven patients in TEP-H group and four patients in DIAB-CH group. A significant decrease in HbA1c (ie, >1%) in the DIAB-CH group was observed in three times more patients than in the Control group and in twice as many as in the TEP-H group (4 patients in the Control group, 8 patients in the TEP-H group and 12 patients in the DIAB-CH group).
Body mass index follow-up of patients with BMI over 30 kg/m2 at M0
The Friedman’s test showed that the BMI was not significantly different in the Control (n = 13), TEP-H (n = 14) and DIAB-CH (n = 14) groups between M0 and the measurement points M6 and M12 within the groups (respectively, X2F (2) = 3.606, P > 0.05; X2F (2) = 4.618, P > 0.05; X2F (2) = 0.4727, P > 0.05). The Kruskal-Wallis test showed no significant difference between Control, TEP-H and DIAB-CH groups either at M0 (H(2) = 0.09, P = 0.95), and M6 (H(2) = 0.04, P = 0.97) or at M12 (H(2) = 0.72, P = 0.69) (Table 4).
Body mass index (BMI) (kg/m2) measured in Control (n = 13), TEP-H (n = 14) and DIAB-CH (n = 14) groups at M0, M6 and M12. For each group and at each time, the median and the 95% confidence interval values are represented

Discussion
Patients with diabetes are at high risk of complications and iatrogenic side effects especially in cases of inadequate therapeutic management (Schellhase et al., Reference Schellhase, Koepsell and Weiss2005; Frazzitta, Reference Frazzitta2014; Bailey, Reference Bailey2015; Huang et al., Reference Huang, Refaat, Mohammedi, Jayyousi, Al Suwaidi and Abi Khalil2017). Given the aging of the population with diabetes and social and territorial inequalities, a strengthening of the primary care/hospital care link is one way to improve continuity of care and to optimize patient follow-up (Garnica, Reference Garnica2017; Black and Duval, Reference Black and Duval2019). Unlike general practitioners, and despite the participation of hospital pharmacists in TEP-H, the majority of community pharmacists are insufficiently informed of the difficulties encountered by their patients and identified during these programs. However, community pharmacists are involved on the front line of healthcare and are ideally positioned to provide patient education and counseling on medication and disease (Sarkadi and Rosenqvist, Reference Sarkadi and Rosenqvist2004; Clifford et al., Reference Clifford, Davis, Batty and Davis2005). The DIAB-CH is a reinforced and personalized program dedicated to diabetic patients which aims to improve community/hospital care collaboration through active involvement of primary healthcare professionals, and, more precisely, community pharmacists.
Patient’s profiles and feedback about the DIAB-CH program
In our study, the mean age of patients between the three groups was similar and both types of diabetes were represented. The average age of the patients included in the study was slightly lower than the average age of diabetics treated pharmacologically in France (58.9 years old versus 65.1 years old) (Fagot-Campagna et al., Reference Fagot-Campagna, Romon, Fosse and Roudier2010). Moreover, the proportion of type 1/type 2 diabetes of our sample was equivalent to those reported in literature (Tripathi and Srivastava, Reference Tripathi and Srivastava2006).
In European countries, the implementation of the pharmaceutical care for diabetic patients was increasing over the last decade (Pizarro et al., Reference Pizarro, Martins and Simões2019). According Brewster et al. (Reference Brewster, Holt, Portlock and Price2020), the pharmaceutical care provided to diabetic patients is not sufficiently described to ensure their reproducibility. In addition, compared to the number of people living with diabetes, few studies of the pharmaceutical care provided by community pharmacists in Europe have focused on the biological and clinical outcomes, namely quantification of HbA1c (Fornos et al., Reference Fornos, Andrés, Andrés, Guerra and Egea2006; Mehuys et al., Reference Mehuys, Van Bortel, De Bolle, Van Tongelen, Annemans, Remon and Giri2011; Ali et al., Reference Ali, Schifano, Robinson, Phillips, Doherty, Melnick, Laming, Sinclair and Dhillon2012; Kjeldsen et al., Reference Kjeldsen, Bjerrum, Dam, Larsen, Rossing, Søndergaard and Herborg2015). Interestingly, a significant majority of published studies concerning services delivered by pharmacists have been focused only on diabetes mellitus type 2 (Babinec et al., Reference Babinec, Rock, Lorenzetti and Johnson2010; Aguiar et al., Reference Aguiar, de Brito, de Lima, Santos, Lyra and Storpirtis2016; Seidu et al., Reference Seidu, Walker, Bodicoat, Davies and Khunti2016; Bukhsh, Khan, et al., Reference Bukhsh, Khan, Lee, Lee, Chan and Goh2018; de Barra et al., Reference de Barra, Scott, Scott, Johnston, de Bruin, Nkansah, Bond, Matheson, Rackow, Williams and Watson2018; Iqbal et al., Reference Iqbal, Khan, Iqbal and Syed Sulaiman2019; Abdulrhim et al., Reference Abdulrhim, Sankaralingam, Ibrahim and Awaisu2020). Based on a literature review, van Eikenhorst et al. (Reference van Eikenhorst, Taxis, van Dijk and de Gier2017) report that 22 of 24 studies were conducted focused on type 2 diabetes and only one study included both type 1 and type 2 diabetic patients (Kraemer et al., Reference Kraemer, Kradjan, Bianco and Low2012).
The patients included in our study were at high risk of iatrogenic side effects. In fact, 40% of patients were treated with a hypoglycemic oral antidiabetic and the vast majority of them received insulin therapy. These therapeutic classes are known to be associated with severe hypoglycemia (Cryer et al., Reference Cryer, Davis and Shamoon2003). Ensuring the effective self-management of diabetes is an important strategy for the reduction of risk of hypoglycemia (Frazzitta, Reference Frazzitta2014). Patient education was crucial for the success of the therapeutic management (Spollett et al., Reference Spollett, Edelman, Mehner, Walter and Penfornis2016; Iqbal et al., Reference Iqbal, Khan, Iqbal and Syed Sulaiman2019).
Participants in the DIAB-CH program would like more frequent education sessions with their community pharmacy concerning their difficulties. According to the participants, the pharmacist’s added value lies in his proximity to them and his knowledge of therapeutics. Indeed, patients may encounter a community pharmacist five times more often than a primary care physician (Steil, Reference Steil1989).
HbA1c measurements
From three relatively small groups of patients, we reported the long-lasting benefit of TEP-H in the population receiving individual advice from their community pharmacist, while most patients without this link between community and hospital professionals lost the benefit of TEP-H as no significant difference between HbA1C measurements at M0 and M12 was observed. Although we did not detect a significant difference between our groups at any measurement time points, there was a clear trend supporting the superiority of DIAB-CH versus TEP-H only and more so versus Control. The patient’s participation first in the TEP-H and subsequently in the DIAB-CH program could possibly have a more beneficial impact on HbA1c decrease compared to patient participation in the TEP-H or DIAB-CH program individually.
The authors have considered the gap between HbA1c measurements and the individual target assigned by the diabetologist for each patient as a relevant index to assess the efficacy of the TEP-H with or without community pharmacist specific follow-up. The evolution of this index over 12 months coincides with that of HbA1c measurements.
The patient’s assimilation of the information and tools necessary for his therapeutic management often requires repetition and reformulation over a long period (Sarkadi & Rosenqvist, Reference Sarkadi and Rosenqvist2004; Odegard et al., Reference Odegard, Goo, Hummel, Williams and Gray2005; Trento et al., Reference Trento, Gamba, Gentile, Grassi, Miselli, Morone, Passera, Tonutti, Tomalino, Bondonio, Cavallo and Porta2010; Krass et al., Reference Krass, Mitchell, Song, Stewart, Peterson, Hughes, Smith, White and Armour2011). In our study, after a similar HbA1c decrease in TEP-H and DIAB-CH groups between M0 and M6, HbA1c increases again between M6-M12 in the TEP-H group while HbA1c remains stable in the DIAB-CH group during this same period.
Diabetes is a progressive disease that requires lifelong management (Forbes and Cooper, Reference Forbes and Cooper2013; Atkinson et al., Reference Atkinson, Eisenbarth and Michels2014; Stevens et al., Reference Stevens, Khunti, Harvey, Johnson, Preston, Woods, Davies and Goyder2015). The continuing effectiveness of the TEP-H over time is also confirmed by the individual analysis of the evolution of HbA1c. Twelve months post-discharge, a decrease in HbA1c higher than 1% in the DIAB CH group was observed in three times more patients than in the Control group.
BMI follow up
It is noteworthy that we did not observe a significant benefit of the program on the weight loss of obese patients in spite of its specific indication on TEP-H reports. The causes may relate to the reluctance of community pharmacists to bring up a topic that could offend obese patients who may feel, from their perspective, that the advice on diet and lifestyle may not be appropriate from a pharmacist (Weidmann et al., Reference Weidmann, Cunningham, Gray, Hansford, Bermano and Stewart2012; O’Neal and Crosby, Reference O’Neal and Crosby2013; Jordan and Harmon, Reference Jordan and Harmon2015; Murphy and Gardner, Reference Murphy and Gardner2016). However, it seems that education and counseling by community pharmacists have already resulted in improvements of the BMI of patients with type 2 diabetes (Ali et al., Reference Ali, Schifano, Robinson, Phillips, Doherty, Melnick, Laming, Sinclair and Dhillon2012; Santschi et al., Reference Santschi, Chiolero, Paradis, Colosimo and Burnand2012; van Eikenhorst et al., Reference van Eikenhorst, Taxis, van Dijk and de Gier2017).
Group sessions on healthy diet were offered to patients included in the TEP-H and DIAB-CH groups of our study by dieticians during hospitalization. All patients have the option of being seen by a nutritionist in primary care at the end of the hospitalization. However, among the patients included in the study, none were provided such follow-up care by this health professional.
Strengths of the DIAB-VH program
Unlike the DIAB-CH program, in most of the published studies, educational intervention was performed either by the pharmacist alone (Doucette et al., Reference Doucette, Witry, Farris and McDonough2009; Jarab et al., Reference Jarab, Alqudah, Mukattash, Shattat and Al-Qirim2012; Jahangard-Rafsanjani et al., Reference Jahangard-Rafsanjani, Sarayani, Nosrati, Saadat, Rashidian, Hadjibabaie, Ashouri, Radfar, Javadi and Gholami2015; Wishah et al., Reference Wishah, Al-Khawaldeh and Albsoul2015), or by a multidisciplinary healthcare team, including nurses, physicians, dieticians and pharmacists (Kang et al., Reference Kang, Chang, Chen, Liu, Liu, Chang and Chang2010; Taveira et al., Reference Taveira, Friedmann, Cohen, Dooley, Khatana, Pirraglia and Wu2010; Cohen et al., Reference Cohen, Taveira, Khatana, Dooley, Pirraglia and Wu2011; Bukhsh, Tan, et al., Reference Bukhsh, Tan, Chan, Lee, Goh and Khan2018). The effectiveness of multidisciplinary collaboration on HbA1c reduction and diabetes control in primary care has already been highlighted (Kiel and McCord, Reference Kiel and McCord2005; Farland et al., Reference Farland, Byrd, McFarland, Thomas, Franks, George, Gross, Guirguis and Suda2013). The international guidelines endorse multidisciplinary diabetes care (American Diabetes Association, 2020). Combining the strengths of different healthcare professionals seems to increase the effect of the intervention compared to that of the pharmacist alone (van Eikenhorst et al., Reference van Eikenhorst, Taxis, van Dijk and de Gier2017). However, support programs for diabetic patients focused on patients’ specific needs through tailored intervention during individual sessions seem to be more effective in achieving improvement of biological parameters (HbA1c) and patient self-management (Jameson and Baty, Reference Jameson and Baty2010; Harrington and Noar, Reference Harrington and Noar2012; Michiels et al., Reference Michiels, Bugnon, Chicoye, Dejager, Moisan, Allaert, Hunault, Romengas, Méchin and Vergès2019).
As far we know, no support program for diabetic patients combining both multidisciplinary group sessions associated with community pharmacist-led educational interventions on self-care in ambulatory care had been evaluated (de Barra et al., Reference de Barra, Scott, Scott, Johnston, de Bruin, Nkansah, Bond, Matheson, Rackow, Williams and Watson2018). It is to be noted that one study combines both group and individual sessions in ambulatory care (Doucette et al., Reference Doucette, Witry, Farris and McDonough2009). However, the authors did not specify if the education sessions were conducted by a multidisciplinary team. Secondly, researchers randomized patients who had completed at least two diabetes education sessions within the past 2 years. Hence, the pharmacist’s follow-up could start up to two years after the education group sessions. Finally, there was no evaluation comparing patients who did not benefit from both the TEP-H and the follow-up by the community pharmacist. According to Donihi et al (Reference Donihi2017), only a few published studies describe outcomes related to the effects of a care program combining diabetes education during hospitalization and post-discharge support. Moreover, in these studies, the follow-up of diabetic patients after discharge was mainly performed by telephone by a nurse (Wong et al., Reference Wong, Mok, Chan and Tsang2005; Dungan et al., Reference Dungan, Lyons, Manu, Kulkarni, Ebrahim, Grantier, Harris, Black and Schuster2014; Brumm et al., Reference Brumm, Theisen and Falciglia2016). (Donihi, Reference Donihi2017)
Limitations of the study
One limitation of this study is that while the counseling covered a range of areas, only two measures are analyzed. Thus, it can be difficult to determine the impact of the counseling related to lifestyle measures such as foot care. In addition, the relatively small sample size of the groups represents another limit of our study. The results could have been subject to greater sampling variation. Finally, the small number of patients with type 1 diabetes does not allow a subgroup analysis.
Practical implications
The present study reports the beneficial impact of the DIAB-CH program and especially of its coordination by hospital pharmacists allowing the practical involvement of community pharmacists in personalized support on an outpatient basis. In addition to TEP-H group sessions, diabetic patients enrolled in the DIAB-CH program received recurrent individualized advice from their community pharmacists, allowing lasting HbA1c goal achievement.
The community pharmacist has a role in supporting diabetic patients, especially for the elderly, because of his proximity, his knowledge of the patient (and his family) and the opportunity for frequent communication with these patients. As the time dedicated to medication dispensing and advice to patients is limited, the community pharmacist does not waste time working on skills already acquired by the patient. Guided by the TEP-H report, they can focus on individual difficulties identified during the TEP-H session of DIAB-CH. This study showed that community pharmacists could effectively help diabetic patients to increase their glycemic control and to make the educational program benefits more durable. To facilitate this, the transmission of information sheets to community pharmacists helped harmonize the information and advice transmitted to patients between hospital and community pharmacists. Our multidisciplinary and tailored DIAB-CH program enhanced primary care/hospital care collaboration through greater involvement of the community pharmacist.
Future research
The positive effects on glycemic control in patients with insufficiently-controlled diabetes lead us to support the continuation of the program in our establishment and its development in other university hospitals. A follow-up study with more participants and a longer study period, as well as focus on more clinical data (eg, occurrence of macro and micro vascular complications) and biological data (eg, lipid profile) would help to further evaluate the benefits of the DIAB-CH program. These future directions of research could also help to find ways to improve the DIAB-CH program.
Supplementary Material
To view supplementary material for this article, please visit https://doi.org/10.1017/S1463423620000390
Acknowledgements
We thank Susan Walters-Galopin for assistance with language and the regional drugs observatory for comments that improved the good practice and information sheets.
Financial Support
This research received no specific grant from any funding agency, commercial or not-for-profit sectors.
Conflicts of Interest
None.
Ethical Standards
This study was approved by the Ethics Committee of our establishment (“Clinical Ethics Group”, project number n°2020022). The computer processing is recorded in the computer processing register of our university hospital under the number 2020_027.


 Open access