


Introduction
Environmental degradation resulting from anthropogenic activities is one of the foremost concerns for policymakers and organizations, as it poses significant risks to the sustainability of human life, ecosystems, and biomes (Marcovitch, Reference Marcovitch2006). Among the primary drivers of environmental impacts are deforestation, illegal extraction, and unsustainable land use practices to expand agricultural production (Fearnside, Reference Fearnside2001). A substantial portion of these environmentally harmful activities is driven by survival needs and market forces, which increase production and alter existing productive structures, necessitating extensive use of natural resources to fuel economic growth (Havranek, Horvath, and Zeynalov, Reference Havranek, Horvath and Zeynalov2016).
This understanding forms the basis of the Environmental Kuznets Curve (EKC), first introduced by Grossman and Krueger (Reference Grossman and Krueger1991), which hypothesizes that environmental degradation initially increases with economic growth but eventually decreases as income stabilizes, resulting in an “Inverted-U” shaped curve. In some cases, however, a subsequent rise in degradation can occur after a period of improvement, forming an “N”-shaped curve. Analyses seeking to validate the EKC hypotheses predominantly verify the shapes of these curves at global levels using aggregated country data. However, specific sectors are essential for the economy and are sources of negative environmental externalities, requiring particular analysis.
Soy is the most important commercial agricultural crop in Brazil. Its importance is underscored as the country’s main export product, a performance driven by demand from China, as emphasized by Escher and Wilkinson (Reference Escher and Wilkinson2019). The consecutive production records indicate the productivity and technological advancement of Brazil’s soy agricultural chain. The logistic process is one of the main bottlenecks for the sector’s economic competitiveness, especially transportation, as highlighted by Correa and Ramos (Reference Correa and Ramos2010). Beyond cost-related issues, Brazil’s characteristics amplify the environmental impacts of transportation activities. Given the country’s vast dimensions, with large distances from main production centers to export structures (Aguilar, Shikida, and Lobo, Reference Aguilar, Shikida and Lobo2018) and the predominance of road transportation reliant on fossil fuels, the logistics of transportation emerge as a significant contributor to environmental degradation in the soy logistics chain.
This paper presents a novel application of the EKC hypothesis by focusing on the soy transportation sector in Brazil, a critical segment of the country’s economy and a significant source of environmental externalities. While the EKC has been examined broadly across nations and sectors, this study brings a new perspective by applying it to a specific industry with high environmental relevance. It investigates whether CO2 emissions from soy transport follow the “Inverted-U” or “N” shape, offering new insights into how sectoral economic growth interacts with environmental outcomes.
Methodologically, this paper employs a unique approach by combining a network equilibrium model to estimate CO2 emissions from transportation with the Generalized Method of Moments (GMM) econometric analysis. This dual approach allows for more precise and sector-specific quantification of environmental impacts, considering the nuances of road and intermodal transport in Brazil. The integration of these models represents an innovation in analyzing the environmental impacts of agricultural logistics, providing a more detailed understanding of how transportation dynamics influence emissions in a high-impact sector.
While extensive research has been conducted on the EKC across various sectors, few studies have focused on sector-specific agricultural transportation analyses, particularly in Brazil’s soy industry. This paper addresses that research gap by providing a detailed examination of the environmental impacts of soy logistics. In light of the soy sector’s importance, its positive economic impacts, and the negative environmental impacts of high-fuel-consumption transportation operations, this study seeks to assess the validity of the “Inverted-U” or “N”-shaped EKC hypothesis for CO2 emissions resulting from soy transportation activities in Brazil. The findings of this study have implications for academic research and public policy. Identifying an “N”-shaped EKC in the soy transportation sector suggests that current assumptions about the relationship between economic growth and environmental improvement may not hold in all contexts, particularly in agricultural logistics. The study underscores the need for more sustainable transport practices, advocating for increased use of intermodal transport solutions and stricter environmental regulations to curb long-term emissions. By focusing on Brazil’s soy logistics chain, the research emphasizes the need for policymakers to rethink growth strategies that depend heavily on road transport, which continues to contribute significantly to CO2 emissions.
Literature review
The agribusiness and the soy complex in Brazil
The decade beginning in 2010 posed significant challenges to the Brazilian economy. Initially signaling a seemingly virtuous cycle, the economy soon faced governmental misalignments in economic policy, followed by a severe fiscal and political crisis, adversely affecting the country’s economic dynamics. This period was characterized by a two-year recession, with a decline in Gross Domestic Product (GDP) of 3.55% and 3.31% in 2015 and 2016, respectively (IBGE 2024a). However, in contrast to this downturn, the agribusiness sector emerged as the primary supporter of the economy. The sector’s GDP exhibited growths of 3.94% and 7.54% in these years, which, despite subsequent declines of 5.52% and 0.01% in the following years, maintained an average growth of 1.2% over the decade. The sector accounted for 21.1% of the national GDP in 2019 (CEPEA 2020).
These results were predominantly leveraged in the early 21st century by what Manzi (Reference Manzi2016) termed the “commodity boom.” This sudden surge in commodity prices was primarily driven by China’s role in global trade, becoming the world’s second-largest exporter of primary products. It has resulted from China’s increasing industrialization and large population (Kaplinsky and Messner, Reference Kaplinsky and Messner2008). Medeiros and Cintra (Reference Medeiros and Cintra2015) suggest that the rise of China in the global economy had a significant impact on South American countries, especially after China joined the World Trade Organization in 2002. This impact was seen in increased demand for key products exported by trading partners, such as Brazilian and Argentine soybeans, Brazilian iron ore and Chilean copper. China is Brazil’s primary soy market trading partner (SECEX 2020).
Costa, Garred, and Pessoa (Reference Costa, Garred and Pessoa2016), in their study on the potential beneficiaries of the “commodity boom,” note that in Brazil, the Chinese demand effect enabled the major exporting regions to achieve improvements in income, wages, and social conditions, positioning Brazil as one of the winners in this episode. In this context, soybeans are the most important product for Brazilian agribusiness, being the country’s primary export. The soybean market is strongly controlled by multinational companies’ actions in providing production technologies through inputs and marketing (Oliveira and Schneider, Reference Oliveira and Schneider2016).
Bolfe et al. (Reference Bolfe, Victória, Contini, Silva, Araújo and Gomes2016), Bonetti (Reference Bonetti and Bonetti1981), Gasques, Bacchi, and Bastos (Reference Gasques, Bacchi and Bastos2017), Siqueira (Reference Siqueira2004), Freitas and Mendonça (Reference Freitas and De Mendonça2016) and Oliveira and Schneider (Reference Oliveira and Schneider2016) characterize the development of soybean production in Brazil. Integration with livestock, the role of the Brazilian Agricultural Research Corporation (EMBRAPA), the formation of cooperatives, the edaphoclimatic and topographic characteristics of the expanding agricultural frontier regions and various public and credit policies designed for the sector are among the highlights presented in these articles.
The advancement of production facilitated the growth of the industrial capacity of companies within the soy agro-industrial complex, such as industries dedicated to crushing, refining, and derivatives. The entire chain has had a significant impact on Brazil’s economy. Montoya et al.’s (Reference Montoya, Bertussi, Lopes and Finamore2019) sector analysis indicates that, from 2000 to 2014, the chain’s participation in the GDP increased from 1.4% to 2.6%.
The movement of the production volume of the soy complex and other agro-industrial complexes in Brazil is predominantly carried out through road transport, which, according to the National Confederation of Transport (CNT 2019), is responsible for 61% of the cargo transport matrix and 85% of passenger transport. Costa, Silva, and Cohen (Reference Costa, Silva and Cohen2013), Pereira and Lessa (Reference Pereira and Lessa2011), Vianna and Villela (Reference Vianna, Villela, Vianna and Villela2011), Villela (Reference Villela and Villela2011), Raiser et al. (Reference Raiser, Clarke, Procee, Briceño-Garmendia, Kikoni, Kizito and Viñuela2017) and Silva, Martins, and Neder (Reference Silva, Martins and Neder2016) highlight the history of decisions and public policies that led Brazil to prioritize the development of road transport throughout its economic growth.
Transporting agro-industrial goods by road is costly and negatively affects the competitiveness of national products. For example, logistics can compromise up to 25% of the value of a sack of soybeans due to high variable costs (Correa and Ramos, Reference Correa and Ramos2010). The long-distance between the leading producing states in the Midwest and the main ports in the South-Southeast, as well as the low added value of the product, make intermodal solutions cost-effective.
A solid railway infrastructure is necessary for intermodality to be effectively implemented and for its economic and environmental effects to be realized. Assis et al. (Reference Assis, Silva, Marchetti, Dalto, Rios and Ferreira2017) indicate that Brazil has the ninth-largest railway network in the world, with over 29,800 km of extension. However, the railway density, the extension relative to the area, at 4.7 km/thousand km2, can be considered low compared to other major agricultural production players. Hydro-road terminals are also crucial for improving logistics through intermodal solutions. Teixeira and Campeão (Reference Teixeira and Campeão2014) identify this as a potential neglect, noting that the country only uses 13,000 km of the 48,000 km of navigable waterways, comprised of 16 waterways. According to CNT (2019), waterway transport represents only 13.6% of the national transport matrix. Silva and Marujo (Reference Silva and Marujo2012) point out that since there is lower fuel consumption, waterway transport is environmentally superior in CO2 emissions.
The environmental issue and the transportation sector
Human activities such as natural resource utilization significantly impact the environment, affecting climatic phenomena. Moser (Reference Moser2010) suggests changing production practices to reduce this impact. However, this task is complex and requires significant institutional and productive changes. Guimarães and Fontoura (Reference Guimarães and Fontoura2012) argue that the Stockholm Conference in 1972 became a milestone as the first major event to discuss environmental degradations caused by human action and how these impacts could affect the human development of nations and human rights. To ensure productive agreements, Stern and Rydge (Reference Stern and Rydge2012) suggest modifying productive structures and processes, focusing on utilizing energy sources that promote lower greenhouse gas emissions.
According to Moura (Reference Moura and Moura2016), the Eco-92 event in Rio de Janeiro strengthened Brazil’s actions in pursuit of public environmental policies. Viola and Franchini (Reference Viola and Franchini2013) analyze Brazil’s climate governance and note that until 2005, the predominant idea was a ‘carbon-intensive growth model.’ The authors claim a policy shift between 2005 and 2009, when emission trajectories significantly declined due to reduced deforestation in the Amazon.
Since the 2000s, Brazil has voluntarily committed itself, as early as COP-15, to reduce greenhouse gas emissions by 36.1% to 38.9% relative to the projected emission volume in 2020. This commitment was part of different sectoral programs implemented to fulfill the National Policy on Climate Change (PNMC) scope, established by Law number 12.187/2009 (Brazil, 2009). Teixeira, Molleta, and Luedemann (Reference Teixeira, Molleta, Luedemann, Teixeira, Molleta and Luedemann2016) list the main sectoral plans developed to mitigate emissions and adapt to climate change in several sectors crucial to the national economy, including the Industry Plan and the ABC Plan, which target carbon emission reduction in industrial and agricultural sectors. The authors also point out that, among the main results of Brazil’s efforts, 87.1% of land use and forestry emissions were reduced from 2005 to 2014.
SEEG (2020) data highlight this reduction in the representativeness of CO2 emissions linked to agricultural activities. However, during the same period, there was an increase in emissions from other sectors, including cargo and passenger transport (SEEG 2020). It corroborates the findings of Viola and Basso (Reference Viola and Basso2015), who posit that Brazil exhibits a unique emission profile distinct from other major emitters, such as the United States and the European Union. This distinction primarily arises from Brazil’s land use and forestry sector, historically the largest emitter of greenhouse gases (GHGs). In contrast, in developed countries, the energy sector remains the predominant emitter, mainly due to using nonrenewable energy sources.
Specifically for the transportation sector, Fuglestvedt et al. (Reference Fuglestvedt, Shine, Berntsen, Cook, Lee, Stenke, Keie, R., Velders and Waitz2010) highlight concerns regarding the use of diesel-powered transportation and its associated emission of pollutants. Efforts to mitigate climate change through policies and programs under the National Policy on Climate Change (PNMC) have aimed to contribute to the policy’s objectives. Notable among the actions adopted during this period are the National Transportation and Logistics Program (PNTC) and the National Energy Program (PNE 2030). According to Neves, Chang, and Pierri (Reference Neves, Chang and Pierri2015), the PNTC seeks to create and improve logistics infrastructure. The plan aims to increase railway participation but needs to be more environmentally focused. The PNE 2030 aims to achieve long-term objectives by 2030, including promoting biodiesel production through subsidies, as Rathmann, Szklo, and Schaeffer (Reference Rathmann, Szklo and Schaeffer2012) outlined. Santos and Ferreira-Filho’s (Reference Santos and Ferreira Filho2017) analysis of the economic impacts of this measure indicates that the expansion of biofuel use offers both environmental and economic benefits, including increased employment, investment and income.
The concern with road transportation is notable in Brazil. Kim and Van Wee (Reference Kim and Van Wee2009) compared European container transport emissions, considering both exclusively road-based transport and intermodal options involving electric or oil-powered trains. They concluded that the worst scenario for emissions results from the sole use of trucks. The authors also argue that intermodality may be environmentally insufficient due to the reliance on nonrenewable sources for electricity generation. In the United States, Quiros et al. (Reference Quiros, Smith, Thiruvengadam, Huai and Hu2017) assert that CO2 emissions from heavy-duty diesel vehicles exceed those from hybrid diesel, biogas, or natural gas vehicles.
Other factors intrinsic to Brazil’s transportation logistics further exacerbate GHG emissions in cargo transport. Since these emissions stem from diesel combustion, increased fuel consumption leads to higher emissions. This consumption is further compounded by vehicles operating on lower-quality paved roads, as elucidated by Bartholomeu and Caixeta Filho (Reference Bartholomeu and Caixeta Filho2009). Cruvinel, Pinto, and Granemann (Reference Cruvinel, Pinto and Granemann2012), in a study on the economic measurement of CO2 emissions in transport by independent carriers, point out that one of the main drivers of higher emissions is the advanced age of Brazil’s truck fleet. This aging fleet, through increased energy inefficiency and lack of modern technologies, leads to higher diesel costs for independent carriers and severe negative externalities for society due to emissions. The authors estimate that fleet renewal, replacing vehicles older than 30 years, could reduce three million tons of CO2 emissions annually. The average age of the national fleet is 15.2 years (CNT 2019).
The Environmental Kuznets Curve
In macroeconomics, a crucial topic of discussion is the distribution of resources among economic agents. Sen (Reference Sen1997) posits that a nation’s economic growth should primarily drive improved allocative efficiency, facilitating the amelioration of various inequalities through income growth. However, this income growth is often correlated with increased inequality. Kuznets (Reference Kuznets1955) hypothesized that distributive inequality is low in agriculturally based and technologically less developed economies due to income limitations. This scenario reverses, with an increase in inequality concurrent with the rise in income driven by industrialization, which generates higher income. However, after a turning point, these inequalities diminish upon reaching higher per capita income levels, giving rise to an inverted “U-shaped” curve for the inequality/per capita income relationship.
The nexus between economy and environment has been a topic in economic discussions, focused initially on how the economy manages indispensable resources for the current productive and energy mode, as indicated by Solow (Reference Solow1974), to pursue growth within the confines of these natural resources. In the 1990s, studies examined the relationship between environmental quality and income growth. Grossman and Krueger (Reference Grossman and Krueger1991), in a study on NAFTA countries, identified an inverted “U-shaped” relation between pollution and per capita income, giving rise to the concept of the “Environmental Kuznets Curve” (EKC). Subsequently, this hypothesis was also validated by Shafik and Bandyopadhyay (Reference Shafik and Bandyopadhyay1992).
A key reason for this process is that economic growth leads to structural changes in the economy, initially from a rural and less polluting phase to an industrial one, represented by the ascending segment of the curve. The inflection point arises from another change, with an increased contribution of the service sector to economic growth – a less polluting industry – and the implementation of regulations and institutional mechanisms for environmental preservation as development progresses. Hence, economic growth is inferred as a viable alternative for ecological sustainability.
Dinda (Reference Dinda2005) notes that among various factors responsible for increasing or decreasing environmental pressure considered in the analysis and estimation of the EKC, environmental regulation and policy changes are crucial for mitigating long-term degradation. Other notable variables include population changes, technological progress enhancing energy efficiency, introducing cleaner technologies, and improving processes and material use. Dinda (Reference Dinda2005) suggests that the initial hypothesis of the environmental curve is that the increase in degradation during the industrial cycle is temporary, while the reduction after the turning point is permanent. However, studies such as Torras and Boyce (Reference Torras and Boyce1998) refute that the latter is always true, generating “N-shaped” curves indicating that increased income can again pressure the environment after reducing environmental pressure, primarily due to diminishing returns of technologies.
Grossman and Krueger (Reference Grossman and Krueger1991) explain the behavior of the Environmental Kuznets Curve through three effects:
-
i. The scale effect results from increased input utilization for higher production, pressuring the environment through greater use of natural resources and energy. This effect suggests that increased production induces environmental degradation;
-
ii. The composition effect has the potential to reduce degradation as it relates to structural economic changes and the transition from more polluting activities, notably industry, to greater activity in the service sector;
-
iii. Technological effect, where adopting new technologies significantly mitigates environmental degradation. Thus, the research and adoption of new production techniques and cleaner, more efficient operations reduce environmental impact and are expected to be prioritized at higher income levels.
The total effect is determined by which among them prevails. Given criticisms regarding the composition effect’s ability to determine the curve’s shape (Torras and Boyce, Reference Torras and Boyce1998), the scale and technological effects emerge as the actual determinants. Thus, an “N-shaped” Kuznets Curve can be explained by the more significant impact of a potential production increase. Balsalobre-Lorente and Álvarez Lorente (Reference Balsalobre-Lorente and Álvarez-Herranz2016) then point to the real possibility that technological obsolescence in environmental terms could enable the curve’s inflection at higher income levels.
Among studies focused on the OECD, Jebli, Youssef, and Ozturk (Reference Jebli, Youssef and Ozturk2016) identify an inverted “U-shaped” relationship between economic growth (GDP per capita) and CO2 emissions for the bloc’s countries from 1980 to 2010. Besides validating the EKC hypothesis, the study further confirms the importance of renewable energy as a crucial resource for reducing emissions without compromising income. Sohag, Kalugina, and Samargandi (Reference Sohag, Kalugina and Samargandi2019) also identified the hypothesis of curve inversion for OECD countries in a study from 1980 to 2017. However, Erdogan, Okumus, and Guzel (Reference Erdogan, Okumus and Guzel2020), in a panel data analysis from 1980 to 2014, do not validate the EKC hypothesis.
In addition to this study, which emphasizes investments in development and research in new energy technologies and GHG emissions, Alvarez-Herranz et al. (Reference Alvarez-Herranz, Balsalobre-Lorente, Shahbaz and Cantos2017) indicate that higher energy intensity increases energy consumption and emissions. Menz and Welsch (Reference Menz and Welsch2012), through a panel of 26 countries between 1960 and 2005, identify that economic evolution is accompanied by higher carbon monoxide emissions (CO).
The use of dynamic panel data estimation through GMM (Generalized Method of Moments) was conducted by Joshi and Beck (Reference Joshi and Beck2018), who failed to identify the characteristic relations of the Kuznets curve for 22 OECD countries. Among the explanatory variables, they consider indicators of economic freedom, identifying a growing relationship between income and CO2 emissions. Joshi and Beck (Reference Joshi and Beck2017) use this methodology to analyze deforestation and income in OECD member and non-member countries, identifying a corroborative relationship to the EKC hypothesis in an “N” shape.
Nassani et al. (Reference Nassani, Aldakhil, Qazi Abro and Zaman2017), in a panel analysis with data from 1990 to 2014, verify an inverted “U-shaped” form concerning income and nitrogen dioxide (N20) emissions. Through causality tests, they identify the importance of emphasis on new energy sources as mitigators of emissions and the impacts of transportation and industry on the result. The hypothesis is supported in analyses by Dong, Sun, and Hochman (Reference Dong, Sun and Hochman2017) and Danish et al. (Reference Danish, Mahmood and Zhang2019) about the BRICS countries’ CO2 emissions.
Ozturk (Reference Ozturk2015) analyzes to identify the validity of the hypothesis for sustainability indicators that consider the relationship between food, energy, and water, successfully identifying the relationship for the model that includes Brazil, India, and South Africa. Among other relevant factors for this group of countries regarding CO2 emissions, urbanization is highlighted, as inferred by Zhu et al. (Reference Zhu, Xia, Guo and Peng2018), and agricultural activity, as indicated by Balsalobre-Lorente et al. (Reference Balsalobre-Lorente, Driha, Bekun and Osundina2019).
Different papers corroborate the existence of the EKC through an inverted “U-shaped” form, such as Aldy (Reference Aldy2005), Franklin and Ruth (Reference Franklin and Ruth2012), Rupasingha et al. (Reference Rupasingha, Goetz, Debertin and Pagoulatos2004), and Atasoy (Reference Atasoy2017). The analysis of Dogan and Ozturk (Reference Dogan and Ozturk2017), however, using the ARDL (Autoregressive Distributed Lags) time series model and considering variables such as the use of renewable and nonrenewable energy sources, from 1980 to 2014, does not identify the relationship advocated for the EKC.
The environmental analysis of developing countries has predominantly been developed in the last thirty years. Diao et al. (Reference Diao, Zeng, Tam and Tam2009), analyzing Jinping province in China, considering the classic variables of product, urbanization, and energy and water use, corroborate the hypothesis of an inverted “U-shaped” curve. Dong, Sun, and Dong (Reference Dong, Sun and Dong2018) also, in a time series analysis considering structural breaks for data from 1965 and 2016, arrive at similar results and further point out the importance of renewable energy use for long-term emission control.
The premises of the Kuznets environmental analysis are corroborated for China as a whole, considering the spatial panel analysis conducted for the period 1997 to 2012 by Kang, Zhao, and Yang (Reference Kang, Zhao and Yang2016), which demonstrates an “N-shaped” relationship between CO2 emissions and per capita income, indicating that spatial spillovers influence the curve and is mainly driven by urbanization and coal as an energy source. The same finding is observed in He and Wang (Reference He and Wang2012), Li, Wang, and Zhao (Reference Li, Wang and Zhao2016), and Wang et al. (Reference Wang, Zhang, Lu, Li, He, Tojo and Zhu2017).
In Brazil, Tritsch and Arvor (Reference Tritsch and Arvor2016) conducted a municipal-level analysis from 2000 to 2010 in the Legal Amazon region, utilizing the Kuznets Curve to investigate the relationship between deforestation and socioeconomic indicators. Through quadratic regression, they validated the hypothesis of an initial boom in deforestation during the early stages of development. Similarly, Oliveira et al. (Reference Oliveira, Almeida, Freguglia and Barreto2011) supported the hypothesis that initial growth stages significantly drive deforestation. Their analysis, also focusing on the municipalities of the Legal Amazon from 2001 to 2016, differed in its approach by employing panel data and considering a spatial weight matrix (due to dependency identified via exploratory spatial data analysis). Additional variables include agricultural production (soy, sugarcane), forestry (timber), population density, rural credit, forest area, and extraction of timber and non-timber products. The findings indicated that the curve exhibited behavior similar to a cubic polynomial, forming a generic “N” shape, where after an initial decline in deforestation with income growth, a new inflection point led to an increase in deforestation.
Other studies in Brazil focused on observing the Kuznets Curve for solid waste. Morel, Triaca and Souza (Reference Morel, Triaca and de Souza2016) identified an “inverted-U” relationship between income and solid waste disposal from 2000 to 2012. Ávila and Diniz (Reference Ávila and Diniz2015) analyzed the relationship between the Kuznets Curve in Brazil and the convergence between income and emissions for data from 1972 to 2008, validating the “N” shaped curve hypothesis. This “N” shape was also observed by Saiani, Toneto Junior, and Dourado (Reference Saiani, Toneto Junior and Dourado2013) in their analysis, linking the deficit in access to sanitation as a proxy for environmental degradation.
Some studies have reported findings inconsistent with the Environmental Kuznets Curve (EKC) hypothesis. Almeida and Lobato’s (Reference Almeida and Lobato2019) analysis of the North region of Brazil between 2002 and 2015 sought the relationship between CO2 emissions and per capita income, finding a non-inverted “U” relationship. Almeida et al. (Reference Almeida, Silva, Vieira and Saiani2017) studied the behavior of environmental degradation, reflected in the variable of deficit in access to environmental health services, for state data from 2000 to 2014. The curve estimated by fixed effects in the panel, using ordinary least squares, exhibited behavior akin to an inverted “N”.
Swart and Brinkmann (Reference Swart and Brinkmann2020) considered other variables indicative of development. Their analysis encompassing Brazilian states used an economic complexity indicator as a proxy, positing that greater economic complexity leads to increased interaction among production systems, resulting in higher environmental impacts. Using panel data for EKC estimation, they found that greater economic complexity corresponded to less degradation as measured by deforestation, pollutant gas emissions, and waste reduction.
Table 1 summarizes papers investigating the relationship between environmental issues and the Kuznets Curve, highlighting the main variables.
Applications of the environmental Kuznets Curve

Despite the extensive body of literature exploring the Environmental Kuznets Curve (EKC) across various sectors and regions, significant gaps remain, particularly regarding sector-specific analyses in the agricultural transport domain. Most studies have focused on general economic indicators and emissions at a national level, overlooking the relationships between income, transport modalities, and environmental impacts within critical sectors such as agriculture. The literature reveals that while the EKC has been validated for numerous contexts, including OECD countries and various developing nations, fewer studies have concentrated on agricultural transport sectors, particularly within emerging economies like Brazil. This gap underscores the need for a detailed exploration of how economic growth within the soy transportation sector influences CO2 emissions, which is crucial given Brazil’s position as a leading global exporter of soy.
Furthermore, existing research often assumes a uniform relationship between income and environmental degradation, neglecting specific agricultural transport systems’ unique dynamics and structural characteristics. For instance, studies such as those by Dinda (Reference Dinda2005) and Torras and Boyce (Reference Torras and Boyce1998) have hinted at the possibility of “N-shaped” relationships in some contexts, yet empirical validations remain limited. By focusing on the soy transportation chain, this study aims to fill the identified void in the literature, providing a nuanced understanding of the environmental implications of economic activities within this sector.
Moreover, the interplay between transportation infrastructure investments and their effects on emissions has received insufficient attention. While existing literature, such as that by Assis et al. (Reference Assis, Silva, Marchetti, Dalto, Rios and Ferreira2017) and Silva and Marujo (Reference Silva and Marujo2012), highlights the critical need for improved intermodal solutions, there is a lack of comprehensive studies that quantitatively assess the impacts of these investments on CO2 emissions specifically in agricultural transport. This research seeks to address this deficiency by employing a robust econometric analysis to examine how investments in transport infrastructure, particularly rail and waterway systems, can alter the emissions trajectory in the soy sector. By doing so, this study will provide valuable insights into the efficacy of proposed policy measures aimed at enhancing environmental sustainability within Brazil’s agricultural transport sector.
Materials and methods
Analyses that validate the Environmental Kuznets Curve (EKC) hypothesis predominantly utilize econometric models. These models employ a measure of environmental degradation as the dependent variable relating to emissions or deforestation. This analysis method is prevalent among the studies indicated in the previous section. In this work, the analysis focuses on emissions from both road and intermodal transportation of soy in Brazil as the dependent variable. Using emission variables related to transportation is typical for validating the EKC in this sector. Alshehry and Belloumi (Reference Alshehry and Belloumi2017), Hassan and Nosheen (Reference Hassan and Nosheen2019), Kharbach and Chfadi (Reference Kharbach and Chfadi2017), and Shahbaz et al. (Reference Shahbaz, Abosedra, Kumar and Abbas2020) are examples of papers that analyzed the CO2 emissions specifically from the transport sector to test the hypothesis regarding the EKC’s shape.
This work will utilize a network equilibrium model to calculate CO2 emissions from soy transportation in Brazil. This metric will serve as the proxy for the degradation variable, which will subsequently be used in econometric models (System GMM). Figure 1 illustrates the sequence of steps of this methodological approach.
Methodological steps for analyzing the Environmental Kuznets Curve in soy transport.

Econometric model
To validate the hypotheses regarding the shape of the Environmental Kuznets Curve (EKC), one of the primary methods used and applied in this work is the analysis through panel data. As Baltagi (Reference Baltagi2005) notes, the panel data approach arises from observations of entities (cross-sectional units). The Generalized Method of Moments (GMM) is considered. The application of GMM estimators is as follows (Roodman, Reference Roodman2009):
-
i. It is suitably used for samples with “small T and large N,” that is, in panels classified as short by the analysis of few periods, compared to the cross-sectional units;
-
ii. There is a linear relationship;
-
iii. Independent variables that possess some degree of endogeneity, meaning they do not follow the principle of strict exogeneity, being somehow related to the fixed effects;
-
iv. The presence of fixed effects; and
-
v. The heteroscedasticity and autocorrelation within cross-section units, but not between them.
Blundell and Bond (Reference Blundell and Bond1998) created a system of equations known as the Generalized Method of Moments (GMM) system. This system involves generating equations from the general and transformed equations. The instruments for the difference equations used in the GMM system are the explanatory variables’ lagged levels. According to Roodman (Reference Roodman2009), these methods are more efficient since they use more instruments, with a noteworthy point being that the number of instruments should be less than the number of observations. Due to these characteristics, the dynamic panel estimation will occur through the GMM system. Huang et al. (Reference Huang, Hwang and Yang2008), Li et al. (Reference Li, Wang and Zhao2016) and Ozturk (Reference Ozturk2015) utilize the GMM system in the estimation of the EKC.
After the estimation, the results are evaluated using the Hansen test, which validates the instruments used in the analysis and ensures no correlation between the instruments and the error term. The Hansen test is used instead of the Sargan test, as the estimation is done through the System GMM two-step, which employs a weight matrix for cases of heteroscedasticity.
Therefore, the data panel for this work considered the evolution of variables from the 290 microregions where there were soybean-producing cities from 2002 to 2017. The variables, whose aggregation at the microregion level originated from municipal information, are described in Table 2.
Variables and expected signs

Through dynamic panel data analysis, models (I) and (III) seek to validate the quadratic and cubic forms using the one-step System GMM. Models (II) and (IV) aim for the same objective but use the two-step System GMM. Equation (1) represents models (I) and (III). Equation (2) represents models (II) and (IV).


Where:
lnCO2 it : natural logarithm of CO2 emissions (kgs), originating from soy transport activities in microregion i, in year t;
lnCO2 i, t − 1: natural logarithm of CO2 emissions, originating from soy transport activities in microregion i, in year t-1;
lnPIB(Soja) i, t : natural logarithm of the Gross Domestic Product per capita, from microregion i, in year t;
ln(PIBSoja) i, t 2: natural logarithm of the squared Gross Domestic Product per capita, in Brazilian Reals (R$), from microregion i, in year t;
ln(PIBSoja) i, t 3: natural logarithm of the Gross Domestic Product per capita cubed, in Brazilian Reals (R$), from microregion i, in year t;
lnÁrea i, t : natural logarithm of the soy harvested area, in microregion i, in year t;
lnRebanho i, t : natural logarithm of livestock numbers, in microregion i, in year t;
lnIDHM i, t : natural logarithm of the Human Development Index of microregion i, in year t;
lnPopulação i, t : natural logarithm of the population estimate of microregion i, in year t;
lnPreço i, t : natural logarithm of the soy price in microregion i, in year t;
lnEmprego i, t : natural logarithm of employment in soy production in microregion i, in year t;
lnInvRodovias i, t : natural logarithm of public investments in roads in microregion i, in year t;
γ, β 0; β 1; β 2; β 3; β 4; β 5; β 6; β 7; β 8; β 9 and β 10: coefficients to be estimated
ϵ it : Random error term.
According to Dinda (2004), the verification of the EKC curve shape occurs through the signs of the estimated coefficients related to income variables. If: β 1 ≥ 0; β 2 < 0 and β 3 = 0, there is the traditional relationship with an “Inverted-U” shape; if: β 1 ≥ 0; β 2 ≤ 0 and β 3 > 0, with β 1 and β 2 not being zero at the same time, there is a relationship in “N” shape.
Network equilibrium model
Mathematical optimization models are well established in solving transportation problems, including those related to agricultural cargoes. Silva and Marujo (Reference Silva and Marujo2012) applied a linear programming model to identify the optimal flows for intermodal soy production transport originating from Sorriso (MT). Almeida et al. (Reference Almeida, Amaral and Morabito2016), Mascarenhas et al. (Reference Mascarenhas, De Oliveira, Lopes and Coleti2014), and Rocha and Caixeta Filho (Reference Rocha and Caixeta Filho2018) used mixed integer linear programming through location models to determine the best sites for storage or distribution facilities. These models focus on soy transportation and aim to improve efficiency in transporting agricultural goods.
This study focuses on optimizing the transportation process for three types of soy flows (see Figure 2):
-
i. Transporting soy intended for the foreign market, exclusively by road, from producer cities to ports.
-
ii. Transporting soy intended for the foreign market from producer cities using intermodal solutions, with road transport from the origin to the entry into rail or waterway terminals and destined for ports.
-
iii. Transporting soy exclusively by road from producer cities to cities with factory units and processing units is intended for the domestic market and is considered the sole internal demand flow for soy.
Transportation flows considered in the network equilibrium model.

The indices of the mathematical optimization model are:
-
i: microregions with soy production (origins).
-
j: soy-exporting ports.
-
k: period (years).
-
l: rail and waterway transshipment terminals used in soy transportation.
-
m: soy processing units in the Brazilian domestic market.
Equation (3) defines the model objective function.
 $$\eqalign{ & MINZ = \sum\limits_{i \in I} {\sum\limits_{j \in J} {\sum\limits_{k \in K} {{Q_{ijk}}} } } FMERO{D_{ijk}} + \sum\limits_{i \in I} {\sum\limits_{l \in L} {\sum\limits_{j \in J} {\sum\limits_{k \in K} {{R_{iljk}}} } } } FMEMULT{I_{iljk}} \cr & \quad \quad \quad \quad \quad + \sum\limits_{i \in I} {\sum\limits_{m \in M} {\sum\limits_{k \in K} {{S_{imk}}} } } FM{I_{imk}} \cr} $$
The mathematical model’s decision variables are Q ijk , R iljk and S imk . It represent the quantity of soy moved exclusively by road mode, in intermodal solutions and exclusively by road mode to domestic processing units, respectively. All variables are non-negative and expressed in tons.
The parameters are defined as:
-
• FMEROD ijk : road freight price for soy, in BRL/ton, moved for the foreign market, from municipality i to port j in year k, obtained from SIFRECA (2020).
-
• FMEMULTI iljk : intermodal freight price for soy (BRL/t) moved for the foreign market, from municipality i, shipped from rail/waterway terminal l to port j in year k (SIFRECA 2020).
-
• FMI imk : road freight price for soy (BRL/t) destined for the domestic market from municipality i to a milling industry located in municipality m in year k (SIFRECA 2020).
-
• PRODUÇÃO ik : represents, in tons, the soy supply in producing municipality i in year k, derived from information provided by IBGE (2024b).
-
• CAPPORTO Jk ,: determines the capacity of ports, resulting from exports carried out by Brazilian ports from 2002 to 2017, in tons (Secex 2020).
-
• CAPTERMINAL lk : indicates the operational capacity, in tons, of rail and waterway transshipment terminals in Brazil (ANTT 2020; ANTAQ 2020).
-
• CAPFÁBRICA mk : processing capacity of the industries in tons (ABIOVE 2020).
The model is subject to a set of restrictions expressed through equations (4) to (7). These constraints ensure that all soybean production is transported to the demand regions, limiting the transportation flows to the operational capacity of ports and terminals. They also indicate that the capacity of factories should be, at most, the quantity of soy designated by the municipalities, which must be transported exclusively via road transport.

 $$\sum _{i\in I}Q_{iJk}+\sum _{i\in I}\sum _{l\in L}R_{iljk}\leq \textit{CAPPORTO}_{Jk}\forall j\in J, k\in K$$
 $$\sum _{i\in I}\sum _{j\in J}R_{iljk}\leq \textit{CAPTERMINAL}_{lk}\forall l\in L, k\in K$$
 $$\sum _{i\in I}S_{iMk}\leq \textit{CAPF}{\acute{A}}{\textit{BRICA}}_{mk}\forall m\in M, k\in K$$
The CO2 emissions variable from fuel consumption in road and intermodal transportation operations for soy transportation flows will be estimated to construct the dependent variable to be used in the econometric model. The calculation of emissions in road transportation follows the methodology developed by the Intergovernmental Panel on Climate Change (IPCC, 1996).
Equation (8) calculates CO2 emissions from road transportation of soy, where DIESEL is the diesel fuel consumption in liters for soy transportation, and FERODCO2 is the CO2 emission factor for diesel at 2.60 kg/l, as used by the Brazilian GHG Protocol Program (2020).
 $$CO2ROD=\textit{DIESEL}\times \textit{FERODCO}2$$
Equation (9) calculates the diesel consumption for each vehicle composition. DRod represents the total distance traveled by the vehicle, measured in kilometers (km), and R denotes the diesel efficiency, which is how many kilometers (km) can be traveled per liter (l) of diesel for the specific vehicle composition in question. The formula DIESEL thus calculates the total volume of diesel consumed during transportation by dividing the total distance traveled by the vehicle’s fuel efficiency, resulting in the quantity of diesel, in liters, required to complete the journey.
 $$\textit{DIESEL}={DRod \over R}$$
Equation (10) calculates CO2 emissions for intermodal transportation.
 $$CO2\textit{INTER}=CO2ROD+(Q\times \textit{DInter}\times \textit{FEINTERCO}2)$$
CO2INTER represents CO2 emissions from intermodal transportation of soy, Q is the quantity of soy transported in tons, DInter is the distance of the route performed by railway or waterway, and FEINTERCO2 is the CO2 emission factor for railway or waterway transport, according to the Brazilian GHG Protocol Program (2020).
Results
Network Equilibrium Model
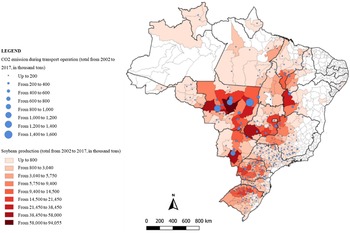
Table 3 presents the values of movements by transportation corridor based on the outcome of the Network Equilibrium Model. It is evident from the analysis that there has been a change in the primary transportation flows throughout the reported period. In 2002, the initial year of analysis and before the commodities boom, the movement destined for the domestic market, represented by the transport flow from the factories, accounted for 66% of the production. However, by 2017, exportation gained greater significance in relation to the total produced. Export flows accounted for 56% of the total national production.
Amount of soybean transported and CO2 emissions during transport operation by transportation corridor (from 2002 to 2017)

The mathematical model’s results indicate that the average annual production growth during the analyzed period was 7.42%, and yearly emissions increased by 9.27%. This is known as the scale effect, which means that an increase in quantity positively impacts emissions (see Figure 3).
Soy production and CO2 emissions during transport operation (2002–2017).

The microregions that produced the most soy were also responsible for the highest CO2 emissions from transportation, indicating a solid scale effect. However, the growth effect varied among the analyzed transportation flows. The average annual growth in transportation conducted solely by road mode was 18.21%, with average emissions increasing by 28.37%. For the flow that utilized intermodality, the movement growth was 10.98%, accompanied by a 9.97% increase in emissions. Meanwhile, in the flow to factories, the average growth in the allocated amount was 3.77%, accompanied by a 5.46% increase in emissions.
Specifically, direct road transport for exporting can amplify the environmental impact. In fact, during the period analyzed, the amount of soy transported exclusively by road for export accounted for 38.08% of emissions despite only transporting 24.84% of the total production. In contrast, goods transported via road to domestic factories only accounted for 39.06% of emissions despite transporting 60% of the total production. This is because goods transported to factories can be transported on shorter routes, reducing fuel consumption and emissions.
Intermodal transport, which involves using different modes of transportation with lower emission factors, can be used to reduce transportation costs and increase competitiveness. This allows for larger volumes of low-value-added agro-industrial products to be transported. Overall, using intermodal transport can reduce fuel consumption and emissions while increasing competitiveness and reducing transportation costs.
Econometric model
This work aimed to validate the shapes of the Environmental Kuznets Curve through econometric estimation using a panel data set. The panel data set includes data from 290 microregions where soy-producing cities exist over a 16-year period from 2002 to 2017.
The descriptive statistics of the variables in logarithms are provided in Table 4.
Descriptive statistics of the variables

The data panel has been designed to be well balanced, incorporating data from all periods and cross-sectional units. However, there are some gaps in the series due to unavailable data for some variables. Table 4 detailed the problem of missing observations for some sectional units. This has implications for conducting certain crucial tests that need to be performed before estimating dynamic panels.
As presented in Table 5, the null hypothesis of sectional dependence is rejected for all variables. This allows for the use of first-generation unit root tests (Fisher test). The Fisher test, based on the Augmented Dickey-Fuller (ADF), rejects the null hypothesis of a unit root in the panels for all variables, enabling the econometric model estimation.
Cross-sectional dependence and Sectional Dependence and Unit Root tests

*Significance at 1%.
Table 6 consolidates the model’s result. Models (I) and (II), which seek to test the EKC hypothesis in a quadratic format through system GMM one-step and two-step, respectively, do not demonstrate this behavior of the income–emissions relationship, as the coefficients related to income variables are statistically insignificant. Furthermore, the values derived from the Hansen statistic indicate the inadequacy of the instruments used, compromising the acceptance of the model. In addition to the lack of statistical conditions for validation, models (I) and (II) present possible turning points that are too high, making it infeasible to analyze any potential policies that could be developed to seek an inflection in the emissions trajectory, since a large part of the microregions, in each year, have soy-derived income far from the critical income level.
Econometric models results

*Significance at 1%; ** Significance at 5%; *** Significance at 10%.
The results of the models estimated through GMM show divergences, as expected, given the high sensitivity resulting from the estimation options used, a critique of the EKC pointed out by Dinda (Reference Dinda2005). Models (III) and (IV) validate the “N” shape form. Model (IV) is the most satisfactory and efficient due to being estimated using system GMM - two-step. It was the only one in which, through the t-statistic, it was possible to infer the statistical significance of the coefficients of the variables ln(PIBSoja), ln(PIBSoja)2 and ln(PIBSoja)³.
The model validation is further supported by tests and checks performed after estimation. Thirty instruments were used in the analysis, a number significantly lower than the panel groups (254), indicating that the strategies used to avoid the proliferation of instruments were successful, notably the use of collapsed/combined instruments and the restriction of lag use to a maximum of second order. The estimated models considered the variables related to the soybean segment (ln(PIBSoja), ln(PIBSoja)2, ln(PIBSoja)³, lnArea, lnRebanho, lnPreço, and lnEmpregos) as endogenous for instrumentation purposes; the others were considered strictly exogenous. Furthermore, as Roodman (Reference Roodman2009) points out, time dummies were considered as exogenous instruments.
Through the Arellano and Bond (Reference Arellano and Bond1991) test, the null hypothesis that there is no second-order serial correlation (AR2) is accepted, indicating that the treatment of endogeneity was adequate.
Finally, the validation of the instruments is accepted through the Hansen statistic, which assumes a p-value of 0.108. The presented value is included in the range of 0.10 to 0.25, which is considered by Roodman (Reference Roodman2009) to allow broad confidence in the validity of the instruments since high values of the Hansen statistic can result from the influence of instrument proliferation.
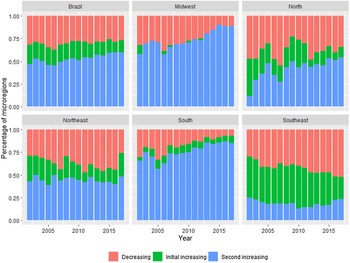
According to Model (IV), the EKC turning points occur at two different income levels for soy transportation. The first turning point is at an income level of R$ 2,880,819.83, beyond which a negative inflection occurs. The second turning point is R$ 48,241,626.73, which marks a new evolution in the relationship between income and emissions in transportation. Some of the regions in the study have already reached these inflection points. Figure 4 and Figure 5 illustrate the behavior of the microregions in relation to the phases of the EKC for soy transportation.
Number of microregions classified according to the phase of the EKC.

Percentage of microregions classified according to the phase of the EKC.

According to the findings, microregions that produce soybeans have income levels that place them on a path of increasing emissions from transportation activities. In the first year of analysis (2002), about 47% of these microregions had income levels that were consistent with the new phase of the Environmental Kuznets Curve (EKC), which shows that emissions initially increase as income rises but eventually decrease as income continues to grow. However, by 2017, the last year of analysis, 60% of these microregions had income levels on this trajectory. Additionally, there was a decrease in the number of regions with income levels within the initial growth and emission reduction phases.
There is a significant difference in behavior when conducting analyses with a regional focus. The microregions in the South and Midwest were the most representative for the second ascending phase of the EKC throughout the analysis. In 2002, these microregions accounted for 49.01% and 28.43% of the new emission growth phase locations, respectively. By 2017, they accounted for 42.19% and 26.58%, respectively. On average, 74% of the Midwest region’s microregions are in the phase of new emission growth, and for the South region, this number is 75.98%. From 2014 to 2017, no Midwest microregion was classified as being in the initial phase.
It is essential to pay attention to the initial growth and subsequent reduction in emissions in the Kuznets Curve in the Southeast and Northeast regions. In 2017, 52.5 and 20% of the regions were in the growth phase, while 58.44% and 10.38% were in the emission reduction phase. It highlights the different stages the regions are in, with the larger and more traditional regions having the majority of microregions with income levels related to continuous environmental degradation growth. On the other hand, the less dynamic regions, new agricultural frontiers in the Northeast and Southeast, are in the initial stages of the curve.
The Kuznets relationship was verified through Model (IV), which revealed that the area significantly impacts increasing emissions. The model also showed a positive relationship between commodity price and transportation emissions due to remuneration in movements. The variables related to the level of employment in soy production and livestock were statistically insignificant and not considered for analysis.
This study shows that population growth is related to decreased soy transportation emissions despite previous research indicating the opposite. This is because this study focuses solely on the agricultural sector and considers the natural process of economic structural change.
Higher levels of human development help mitigate emissions by including higher levels of technology and productivity. Contrary to initial expectations, the study’s results show that higher HDI indicators in already developed countries help reduce environmental impact. Therefore, improving development indicators benefits the environment.
The lnHighways variable shows a positive and significant relationship with higher emissions. Greater investments in highways lead to increased emissions. It can be attributed to constructing or expanding new road sections, which may suggest an incentive to use this modality. Overall, more significant public investments in highways highlight the importance of actions aimed at multimodality.
The study found an “N” curve behavior between CO2 emissions in soy transportation and sectoral income, but this behavior isn’t sustained in the long term. There’s a new reversal in emission behavior where income increases lead to more significant environmental damage. The seminal work of Grossman and Krueger (Reference Grossman and Krueger1991), which validates the “Inverted-U” shape of the Environmental Kuznets Curve, points out the main effects that can explain the shapes of the EKC: composition, scale, and technology effects. The results obtained by this study confirm the expectation of Torras and Boyce (Reference Torras and Boyce1998) regarding the “N” shape of the EKC, and one of the primary explanations for this comes from the real possibility that in the long term, the scale effect here clearly represented by the increase in soy production, which consequently requires more outstanding transportation operations and emissions, predominates over the others.
The plausibility of these findings is supported by the underlying economic dynamics inherent in the soy sector, which is characterized by a complex interplay between production growth, transportation modalities, and environmental impact. As Brazil’s economy partially relies on soy (and other commodities) exports, transportation operations have expanded significantly. This expansion initially leads to increased CO2 emissions due to the scale effect, as higher production volumes necessitate greater transportation efforts, primarily via carbon-intensive road networks. The subsequent decline in emissions observed in the middle phase of the EKC can be attributed to infrastructural advancements and regulatory measures that often accompany economic growth. These developments foster a transition from high-emission transport practices to more sustainable transport operations, such as intermodal transport solutions that utilize rail and waterways, which are less environmentally damaging. However, the latter phase of the “N-shaped” curve, where emissions rise again, highlights the challenge of sustaining environmental improvements in the long term. This phenomenon can be justified because continued economic growth and increased production capabilities often lead to renewed environmental pressures.
The results of this study emphasize that without strategic interventions and policies aimed at decoupling economic growth from environmental degradation, the initial gains in sustainability may be undermined, leading to adverse long-term outcomes. Investments in soy transportation were expected to generate positive environmental effects, but the study found that although they enhance productivity, they are insufficient to prevent long-term environmental degradation. The increase in logistical infrastructure was expected to promote intermodal flows, but it did not lead to an “Inverted-U” shaped EKC. The expansion of logistical infrastructure is crucial in improving productivity in transportation operations. Developing new transshipment terminals and enhancing railway and waterway networks facilitate intermodality, improving transportation efficiency. Additionally, having more transportation options enhances agility and reduces reliance on specific terminals, which results in cost reduction and, as a positive side effect, a decrease in environmental damage.
Conclusions
The results showed that the EKC for soy transportation follows an “N” shape, indicating that after an initial period of growth and decrease, there is a new inflection point suggesting that the activity is environmentally harmful in the long term. Additionally, the study highlights that variables related to area and investments in highways enhance emissions, while population and development levels are critical factors for mitigating environmental degradation in transportation.
The evidence from the econometric models differs from the initial expectations of the study, which predicted an Environmental Kuznets Curve in the shape of an inverted-U for the soy sector. This was based on the findings of Grossman and Krueger (Reference Grossman and Krueger1991). The study anticipated that increased production, driven by foreign trade, would significantly expand infrastructure projects that would reverse the emissions trajectory, ensuring that sectoral growth alone would be sufficient for environmental protection. However, the results indicate the need for actions to mitigate problems in soy transportation. Since the main reason for environmental degradation is the increase in production, as is recurrent in Brazil according to IBGE (2024b) data with record harvests, it is necessary to explore more alternatives to increase the productivity of transportation operations, especially those aimed at reducing the use of fossil fuels.
Specific measures aim to increase investments in intermodality. This can notably reduce emissions due to Brazil’s unique characteristics, such as the long distance between the primary producing regions and the export ports. It is also relevant to take actions for road transportation, such as enforcing legislation and incorporating new technologies.
One of the key findings is that the emission expansion in the primary producing states of the Midwest and South regions primarily drives the behavior identified by the EKC. However, the states of the Southeast and Northeast regions are not contributing to this behavior. In short, while the findings highlight the “N-shaped” EKC, indicating potential long-term environmental harm, they also underscore the importance of considering regional differences and sector-specific characteristics. The results emphasize that policies designed to mitigate emissions must be tailored to the unique conditions of each country’s region, particularly in the Midwest and South. This nuanced understanding enhances the relevance of the study’s implications for policymakers, who must recognize that a one-size-fits-all approach may not suffice in addressing the environmental challenges posed by agroindustrial logistics.
The results indicate that soy’s sectoral growth alone is insufficient to reduce the degradation caused by emissions in the product’s transportation. A collaboration between the public and private sectors is necessary to undertake actions aimed at increasing operational productivity so that emissions can be mitigated. The “N”-shaped EKC and the perspective of further growth in the activity, especially for transportation operations, suggest that the omission of action could significantly contribute to worsening environmental issues in the long term.
While the study provides evidence for the EKC in the soy transportation context, the specific economic, social, and environmental factors in Brazil may limit the applicability of these results to other regions with different agricultural chains or transport infrastructures. However, the underlying principles of the “N-shaped” EKC could resonate in similar contexts where rapid economic growth coincides with significant environmental pressures, suggesting that similar dynamics might be observed in other emerging economies experiencing agricultural expansion. Future research should aim to explore these relationships in different agroindustrial contexts, enabling a broader understanding of how economic activities interact with environmental outcomes across regions and sectors.
Future research also should address some of the barriers and assumptions made in this study. One significant limitation is the relatively short period analyzed, which only covers 16 years. Most studies examining the Kuznets Curve span over 25 years, thus providing a more comprehensive analysis. Unfortunately, the lack of essential time series data for this study, such as the data provided by the National Accounts System for the income proxy, significantly contributed to this limitation.
Data availability statement
The data that support the findings of this study are available from Group ESALQ-LOG (from the University of São Paulo), but restrictions apply to the availability of these data, which were used under license for the current study and so are not publicly available. The data are, however, available from the authors upon reasonable request and with the permission of Group ESALQ-LOG.
Author contribution
Conceptualization, E.L.C., F.V.R., T.G.P., J.V.C.F.; Methodology, E.L.C.; Formal Analysis, E.L.C., F.V.R.; Data Curation, E.L.C., F.V.R., T.G.P.; Writing—Original Draft, E.L.C., F.V.R., Writing—Review and Editing, E.L.C., F.V.R., T.G.P.; Supervision, J.V.C.F.
All authors read and approved the final manuscript.
Financial support
Luiz de Queiroz Agrarian Studies Foundation (FEALQ) for funding the publication of this article.
Competing interests
On behalf of all authors, the corresponding author states that there is no conflict of interest.
AI contributions to research
During the preparation of this work the authors used Grammarly in order to improve readability and language. After using this tool/service, the authors reviewed and edited the content as needed and take full responsibility for the content of the publication.


 Open access