

Notation

Introduction
In a previous paper. Reference Stone, and Clarke.Stone and Clarke (1993) developed a theoretical framework for borehole-response tests (BHRT) on glaciers and demonstrated how their model could be used to solve the forward problem — generating predicted data which can be compared with field observations. In this paper, we consider the inverse problem, which begins with the observed data and is guided by the forward model toward an estimate of the model parameters. Forward modeling describes the underlying physics of a particular system; inversion uses the modeled or assumed physics and focuses on quantifying specific properties of the system.
The BHRT model represents subglacial water-flow conditions in an idealized way. The model describes water flow in a saturated, confined sediment layer at the glacier sole. It is in this context that we will use the terms “aquifer” and “flow layer” when referring to the subglacial drainage system. The model also assumes that subglacial material in the region influenced by a response test is homogeneous and isotropic. This approach avoids the complications of a more detailed description and, instead, represents the actual substrate in terms of an effective medium whose hydraulic properties incorporate the test-scale heterogeneities; the effective medium is an alternate, but hydraulically equivalent, characterization of the real flow system.
Data from two different types of response tests will be examined: the first we refer to as a connection-drainage test, which entails monitoring the water-level draw-down with time when a water-filled borehole is suddenly opened to the subglacial aquifer: the second is a conventional slug test, in which a sealed pipe is suddenly removed from an equilibrated borehole and the water-level recovery with time is measured. Both types of test have previously been used to investigate subglacial hydraulic conditions (Reference Hodge,Hodge, 1976; Reference Engelhardt,Engelhardt, 1978: Reference Engelhardt,, Humphrey and KambEngelhardt and others, 1990; Reference Fountain,Fountain, 1994; Reference Iken,, Fabri and FunkIken and others, 1996). This paper describes a systematic, quantitative approach to the analysis of such data sets, which has until now been lacking in glaciological studies.
The BHRT framework of Stone and Clarke departs from standard ground-water models (e.g. Reference Cooper,, Bredehoeft, Papadopulos and BennettCooper and others, 1965; Reference Kamp,Kamp, 1976; Reference Kipp,Kipp, 1985), which are based on Darcy’s law and the assumption that water velocities are low; under the high-gradient conditions that arise during connection-drainage tests on glaciers, Reynolds numbers may be large and turbulent effects can play an important role. The BHRT model provides for a continuous transition between laminar- and turbulent-flow regimes and reduces to Darcy’s law at low Reynolds numbers.
Besides turbulent effects during a connection-drainage test, response testing on glaciers has additional complexity because the time-scale over which hydraulic head naturally varies in the subglacial environment can be similar to the time-scale of a response test. Determining the change in background head during a response test and accounting for this effect is an important step in the analysis of glacier response-test data. We describe our approach to this problem in the following section.
This paper contains only a brief statement of the forward model: the reader is referred to Reference Stone, and Clarke.Stone and Clarke (1993) for a comprehensive discussion of the BHRT model and its numerical method of solution. Here, we describe a systematic method for analyzing BHRT data and demonstrate its application to field data. The procedure was used to invert response-test data collected on Trapridge Glacier (61 °14′ N, 140 ° 20′ W), a small sub-polar glacier in Yukon Territory, Canada. We show results from inversions of eight data sets and describe how physical properties of the flow system are extracted from the final estimates of model parameters. We conclude by comparing our inversion results with reported estimates of subglacial hydraulic properties obtained by other means, both on Trapridge Glacier and elsewhere.
Methodology
Data Collection and Processing
We used pressure sensors suspended in boreholes to monitor water levels during response tests. Readings of borehole water pressure were collected every 0.0625 s during disturbances, while background trends and long-term recoveries were recorded at 2.0 s intervals. To facilitate comparisons with model solutions, each data set was fitted with an interpolating spline (Reference Press,, Flannery, Teukolsky and Vetterling.Press and others, 1989, p.88) and data having a uniform spacing of 0.125 s were generated from it. For connection-drainage tests, a constant offset was added to the data so that readings prior to connection correspond to a water-column height equal to the glacier thickness. For slug tests, the data were shifted so that water-pressure readings were converted to displacements relative to a pre-disturbance datum.
Under “typical” ground-water conditions, the hydraulic head at a particular point within an aquifer usually changes slowly with time. Over the relatively short time span of a response test it is, therefore, reasonable to assume that the disturbance is a brief perturbation to a constant background head. For a subglacial aquifer, however, this assumption can be untenable: glacier motion and diurnal cycles of meltwater input and discharge cause continual and sometimes large changes in hydraulic head at a given location. (A response test might be performed, for instance, during a rapidly rising limb in basal water pressure resulting from a period of enhanced meltwater production.) Such effects must either be modeled or be removed from the data before response-test results can be analyzed. Our approach is to remove background trends from the data whenever they can be determined.
Background trends in basal water pressure can be estimated from measurements of borehole water-level variations prior to a disturbance. Obviously, this can only be done after the borehole has been drilled, or if there are other communicating boreholes nearby. For the drainage tests considered in this paper, we did not have suitable boreholes nearby, and so are unable to determine background trends in subglacial water pressure at the times of these disturbances. However, since these connections took place rapidly—approaching equilibrium in about 1 min or less — the change in background pressure over such short time intervals is probably negligible, so results from these tests should still be valid. For slower drainage rates following a connection, this would not be true.
Borehole water levels were recorded before slug tests, and we apply this information to the data prior to inversion. Our procedure is illustrated in Figure 1 and is explained here. Data prior to initial disturbances, shown as dotted segments in Figure 1a and c, are fitted with straight lines. These straight-line fits approximate the background trends in basal water pressure at the times that the tests were performed. The trends are removed by subtracting the fitted straight lines from the entire data series, resulting in the adjustments shown in Figure 1b and d. The horizontal dashed lines in Figure 1b and d indicate datums, which are defined by the pre-disturbance water levels following removal of background trends.
Removal of background trends illustrated for two slug tests: (a) 90ST38A and (c) 90ST38E. The procedure is explained in the text. (b) For 90ST38A, the system was fully re-equilibrated at the time the slug was removed. (d) In the case of 90ST38E. the slug was removed when the water level was higher than its pre-disturbed value.

Forward Model
The model of Reference Stone, and Clarke.Stone and Clarke (1993) describes water flow in a borehole—subglacial aquifer system during a response test. In simplified form, the BHRT model is expressed by the following dimensionless equations:


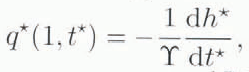

(Reference Stone, and Clarke.Stone and Clarke, 1993, equations (35) – (38)). Motion of water in the borehole is described by Equations (1), while Equations (2) governs radial water flow in the subglacial aquifer. Transfer of water between the borehole and the aquifer is expressed by Equations (3). The constitutive relation in Equations (4), which could be substituted into Equations (2) and (3), has been explicitly stated to show the allowance for non-Darcian behavior.
Equations (1) – (4) contain four dimensionless parameters: the borehole skin-friction parameter ζ the diffusivity parameter χ, the transmissivity parameter ϒ and the “Ergun” parameter ξ. In terms of actual physical quantities, these parameters are defined as follows:


The hydraulic properties in these expressions that are of primary interest are the hydraulic conductivity K, the specific storage S s and the flow-layer thickness b. The quantity B in Equation (8a) is a coefficient that determines the partitioning of terms in Equations (4) under conditions of laminar or turbulent flow. As discussed by Reference Stone, and Clarke.Stone and Clarke (1993, p. 332), B can be expressed in terms of the porosity n and a critical Reynolds number Re′, which is the Reynolds number corresponding to the transition between laminarand turbulent-flow regimes: B = 240(1 − n)/Re′. Substituting this expression into Equation (8a) yields

The boundary and initial conditions for the forward model have been described by Reference Stone, and Clarke.Stone and Clarke (1993, p. 333). As discussed in that paper, the model allows for either a constant-head or a no-flux outer-boundary condition. For the inversions presented in this paper, we have used a constant-head outer-boundary condition. Thus, we assume that at a sufficient distance from the borehole the pre-existing hydraulic head in the aquifer is unaffected by a response-test disturbance; this distance corresponds to the outer boundary radius.
Inversion Scheme
The forward model represents a non-linear functional relationship between the model parameters mi
and the predicted borehole water-level data di
. If the model accurately characterizes the geometry and physics of the subglacial water-flow system and if the initial conditions and model parameters are well known, then di
will closely approximate observed response-test data [![]() ]. To gauge the accuracy of the model and how well its inputs are known, a measure of the discrepancy between predicted and observed data is required. Our inversion scheme utilizes the following objective function for that purpose:
]. To gauge the accuracy of the model and how well its inputs are known, a measure of the discrepancy between predicted and observed data is required. Our inversion scheme utilizes the following objective function for that purpose:
where Φd is a measure of the data misfit, Φp is a measure of the misfit between initial “best-guess” model parameters and the current values for m i, and λ is an adjustable constant that determines the relative importance of the parameter and data-misfit terms. A detailed explanation of Equations (9) is given in the Appendix. The influence of λ on the final value of Φ is discussed below.
To minimize the objective function in Equations (9), inversion parameters are adjusted using a quasi-Newton method. The inversion algorithm that we use is a double precision optimization routine given by Reference Kahaner,, Moler and NashKahaner and others (1989. p. 372). We adjusted the accuracy level of the inversion algorithm to mesh with the forward model integration scheme; this was necessary to ensure that changes in inversion parameters, which are made by the inversion routine, produce numerically distinguishable changes in the forward model solution.
To evaluate the relative success of different models, we calculate a percentage misfit E%, defined as

The quantity E% indicates the relative accuracy of a given set of predicted data; smaller percentage misfits are associated with more accurately predicted data.
Inversion Parameters and Model Inputs
If the solution is to be physically plausible, all four dimensionless parameters must be non-negative. To enforce non-negativity of model parameters, we distinguish between in-version and model parameters, and we define the inversion parameters as the natural logarithms of the model parameters: hence, the inversion parameters are m 1 = In ζ, m 2 = In χ, m 3 = In ϒ and m 4 = In ξ. This scheme requires that antilogarithms of the inversion parameters be taken before computing forward-model solutions.
For inversions of connection-drainage data, we include a fifth parameter that specifies the time of the connection. In general, this quantity is not accurately known and it can significantly influence inversion results. By including the time of connection as an inversion parameter, we obtain an optimal estimate of when the borehole started to drain. However, because this quantity is not of hydrologic interest, we exclude it from subsequent discussions.
The uncertainties that we associate with the inversion parameters are based on plausible upper and lower limits for the dimensionless model parameters. We have selected plausible limits for ζ on physical grounds by considering only realistic values for the borehole radius. Plausible bounds for the other parameters were chosen based on reasonable extremes in forward-modeling results. The difference between the logarithms of the limits assigned to the plausible model parameters is the estimated uncertainty that we associate with a given inversion parameter: [![]() ], where, for example, [
], where, for example, [![]() ]. With this definition, better-constrained parameters, such as ζ, are associated with a smaller uncertainty.
]. With this definition, better-constrained parameters, such as ζ, are associated with a smaller uncertainty.
The forward model requires input of quantities other than the four dimensionless parameters. Material constants such as the density, viscosity and compressibility of water must he specified, as well as geometric quantities like the ice thickness and the aquifer inner and outer boundary radii. Values for these model inputs, which were held constant for all inversions, are listed in Table 1.
Model inputs held constant for inversions

In addition to the inputs listed in Table 1, the model also requires specification of the initial hydraulic head h 0 at the location and time that a particular response test was performed. This quantity is not a constant and must be known or estimated for each test. Table 3 lists the values of h 0, determined from field measurements, that were used in the inversions.
Initial estimates of model parameters and hydraulic head for inversions shown in Figure 4

Inversion Procedure
The inversion algorithm requires (1) a way of solving the forward problem, (2) a measure of model success in fitting the observed data and (3) initial estimates of model parameters. The BHRT model satisfies the first requirement and the second is provided by the objective function. The third requirement—providing initial estimates of model parameters—is handled using an iterative procedure, the details of which are described in Appendix B.
The iterative inversion procedure is illustrated in Figure 2 using data from slug test 90ST38A. (Individual response tests are distinguished using an alpha-numeric label: the first two numbers indicate the year that the test was performed, the following two-character string identifies the type of test, the next two numbers denote the borehole and the last character shows the sequential position in a series of slug tests.) Initial model-parameter estimates and associated values of Φ and E% are listed in Table 2.
Iterative inversion procedure illustrated with data from slug test 90ST38A (solid lines) and modeled results (dashed lines). Model input parameters are listed in Table 2. The procedure is explained in Appendix B.

Parameter estimates, objective function, and data misfit values for iterative inversions of slug test 90ST38A, as shown in Figure 2

The dashed line in Figure 2a is the forward model solution based on our initial parameter estimates. For this test, we began by trying to fit only the long-term trend, not the initial oscillations. The final set of parameters obtained by the first inversion gave the solution shown in Figure 2b; these were then used as the starting values for a second inversion. As can be seen in Figure 2b, after the first inversion the fit to the observed data was noticeably improved. Values of Φ and E% following the second inversion were only slightly different from the previous ones. In this particular case, we performed three additional inversions, resulting in the final solution shown in Figure 2c.
Influence of Trade-Off Parameter
By virtue of the parameter misfit term in the objective function in Equations (9), an optimal solution — the set of model parameters that results in the smallest value of the objective function — will not necessarily correspond to the smallest total data misfit. The non-linear nature of the forward model and its numerical method of solution forces a trade-off between fitting the observed data and stabilizing the search procedure. we have examined the degree to which the trade-off parameter A in Equation (9 influences the final value of Φ; our analysis is summarized in this section.
The influence of the trade-off parameter λ on the final values of Фd and Фp was assessed by varying only λ in repealed inversions of data from one response test (90ST38A); we performed 10 inversions, changing λ by one order of magnitude each time. The initial model-parameter estimates for these inversions were the same as those listed for Figure 2a in Table 2. We point out that for λ = 0.01 an inversion started with these initial parameter estimates produced the final set of parameters listed for Figure 2b in Table 2, and that the final parameters obtained in this inversion were substantially different from the initial estimates. Thus, this particular inversion approximates a worst-case scenario: the total parameter misfit is large, so the influence of λ should be strongly felt.
Final objective-function values resulting from these inversions were used to generate relationships between λ and the two misfit terms Φd and Φp (Fig. 3). These relationships show that the data misfit is virtually constant for λ ≤ 1, while it changes rapidly for λ > 10. Also, the parameter misfit is gradually reduced as λ is increased, because the requirement of closely matching initial parameter estimates becomes dominant. It is apparent that for λ ≤ 10−2 the parameter misfit term does not significantly contribute to the final value of Φ, since the data misfit is large relative to λΦp. On the other hand, for λ ≥ 1, the parameter-misfit term forces an appreciable increase in Φd and moves the solution away from the desired goal of fitting the data. Therefore, based on this analysis, we have used a constant value of λ = 0.01 for all inversions in this study.
Trade-off curve based on inversions of slug test 90ST38A data: size of data Φd and parameter Φp misfit terms as a function of trade-off parameter λ

Results
Inversion results are presented for eight response tests, four of each type of test, which were performed on Trapridge Glacier in the summer of 1990. The four connection-drainages were recorded in boreholes in close proximity — the maximum separation distance was 34.9 m (holes 38 and 59) and the minimum distance was 5.3 m (holes 23 and 38). Three of the four slug tests were performed in hole 38 in a single day — the first at 1448 h (90ST38A), the second at 1654 h (90ST38E) and the third at 1730 h (90ST38G). The starting points for inversions of these data sets are given in Table 3.
Estimated model parameters obtained by the inversions were used to generate final sets of predicted data. The final parameter estimates are listed in Table 4. Comparisons of predicted and observed data are shown in Figure 4, where we have re-dimensionalized the predicted data and shown them with dashed lines.
Connection-drainage and slug-test data (solid lines) and inversion results (dashed lines). Drainage tests shown in the lefthand column are: (a) 90CD23; (b) 90CD38; (c) 90CD58; (d) 90CD59. Horizontal dashed lines in the graphs in the lefthand column indicate the approximate ice-flotation level. Slug tests shown in the righthand column are: (e) 90ST29D; (f) 90ST38A; (g) 90ST38E; (h) 90ST38G.

In general, the correlations between observed data and the predicted final models are excellent; even when the finer details are not perfectly matched (e.g. Fig. 4e), the basic behavior is still adequately expressed, As can be seen in Table 4, final parameter estimates from a particular type of response test are generally consistent. However, for some of the parameters, substantially different values were obtained from the two different types of test, even when they were performed in the same borehole. These results suggest that there are significant differences between connection-drainage and slug-test disturbances, either in the hydraulic properties to which a particular type of response test is sensitive or in the extent and kind of system that is sampled.
Final estimates of model parameters and percentage misfits for inversions shown in Figure 4

Discussion
During a response test, friction between the borehole wall and the moving water column is accounted for by the skin-friction parameter ζ. The inversion algorithm, which tests a wide range of parameter values, rendered estimates for ζ that are very small in magnitude and only slightly different from the initial estimates used to start the inversions (suggesting a lack of sensitivity to that parameter). Such small values for ζ indicate that wall-friction effects are insignificant during a response test. Likewise, final estimates of the Ergun parameter ξ are negligibly small for slug tests, supporting the intuitive expectation that this type of disturbance is not associated with turbulent flow in the subglacial aquifer.
Subglacial hydraulic properties
Hydraulic properties of the subglacial flow layer, as it is characterized in the BHRT model, can be derived using Equations (5) – (8) and the estimated parameter values obtained from the inversions. The derived hydraulic properties are presented in Figure 5 and the basis for these results is discussed here.
Hydraulic properties derived from inversion results. Horizontal dashed lines indicate mean values, (a) Estimates of hydraulic conductivity obtained from connection drainage test values of ξ. For reasons explained in the text, these estimates were subsequently reduced by a factor of about 20. (b) Transmissivity estimates obtained from final values of ϒ, broken down to show hydraulic conductivity as a function of flow -layer thickness for both connection-drainage tests (CDT) and slug tests (ST). Each line represents the mean value of results from four individual tests of a particular type. Vertical error bars indicate standard deviations of the means. (c) Estimates of specific storage obtained from connection drainage test values of χ and ϒ. The actual value of specific storage is probably somewhat larger than these estimates, as discussed in the text. (d) Estimates of the flow-layer thickness obtained from connection-drainage test values of ξ and ϒ.

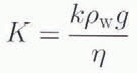
Figure 5a shows estimated values of hydraulic conductivity K obtained from Equation (8b) and the connection-drainage test values οf listed in Table 4. (Because slug tests do not induce turbulent-flow conditions, estimates of K based on slug-test values of ξ are unreliable and thus will not be utilized.) To generate the estimates shown in Figure 5a, we assigned plausible values to the other quantities that appear in Equation (8b). In porous media, a transition from laminar to turbulent flow occurs when 10 ≤ Re ≤ 100 (Marsily, 1986, p.71). We assume that the Reynolds number at which this transition takes place is Re′ = 55. A likely range for porosity of the Trapridge Glacier substrate is 0.2 ≤ n ≤ 0.4 (Reference Clarke,Clarke, 1987; Reference Murray, and Clarke,Murray and Clarke, 1995). We assume that n = 0.3. Based on a sedimentological size analysis of basal till from Trapridge Glacier, Reference Clarke,Clarke (1987) reported that the surface-to-volume ratio for fine-grained substrate material was S 0 = 2.825 × 10⁶ m −1. In this calculation, we assume that S 0 = 3.6 × 10⁶ m −1. The filter radius r f which represents the excavation at the borehole base due to drilling, is assumed to be comparable to the radius of a typical borehole. Thus we take r f = 0.05 m, as listed in Table 1. With these assignments, the calculated hydraulic conductivities fall within the range 3-20 × 10−3 m s−1, with a mean value of 1 × 10⁻² m s−1 (the dashed line in Figure 5a). We point out that this method of calculating K, using Equation (8b) and drainage-test estimates οf ξ, does not require any knowledge or assumption of the flow-layer thickness.
Intuitively, we expect that the flow layer is depleted of very fine-grained matrix material and mostly comprises sand- and gravel-sized particles, in which case the value of S 0 used in the previous calculations is inappropriate. (A typical diameter for coarse sand particles, say 1 mm, corresponds to S 0 = 6 × 10³ m−1, three orders of magnitude smaller than the value assumed above.) To investigate the particle-size composition of the flow layer, we invoke the Kozeny-Carman relation

(Reference Carman,Carman, 1956), assuming that it applies in a subglacial environment, and combine it with the usual definition of hydraulic conductivity
(e.g. Reference Freeze, and CherryFreeze and Cherry, 1979, p. 27) to obtain the following expression:

where ρw is the density of water, g is the acceleration due to gravity and η is the dynamic viscosity of water. For n = 0.3 and S 0 = 3 × 10⁶m−1, as assumed above, Equations (13) predicts that K = 6.7 × 10⁻⁹ m s−1, significantly smaller than the results we obtained using Equation (8b) and drainage-test estimates of ξ. This inconsistency can be resolved by combining Equations (13) and (8b); after some algebraic manipulation, we obtain

Now, for example, if we take ξ = 126.2 (Table 4, 90CD38) and the other quantities on the righthand side of Equations (14) are as given above, then, for n = 0.2-0.4, Equations (14) predicts that S 0 is in the range 2.9-7.1 × 10³ m−1. This result does not depend on an assumed value for K and it is consistent with the range of S 0 values expected for coarse-sand and fine-gravel sediment sizes. With this in mind, we again employ Equation (8b) to obtain estimates of hydraulic conductivity. However, this time we only consider values of n and S 0 for which Equations (8b) and (13) are in good agreement in terms of predicting K. Using the results from 90CD38 (ξ = 126.2) as an example, and spanning the range of plausible porosity values, we find that K = 1.6 × 10⁻³ m s−1 for n = 0.2 and S 0 = 3 × 10³ m−1 and K = 3.9 × 10⁻³ m s−1 for n = 0.4 and S 0 = 7 × 10³ m−1. In fact, for n = 0.35 and S 0 = 6 × 10³ m−1, values of ξ from the four drainage tests (Table 4) again lead to hydraulic conductivities in the range 3-20 × 10−3 m s−1, with a mean value of 1 × 10⁻³ m s−1. (As a consistency check. we note that these values of n and S 0 together with the Kozeny-Carman expression in Equations (13) predict K = 3.1 × 10⁻³ m s−1.)
Transmissivity T = Kb of the subglacial aquifer was extracted from Equations (7) using final estimates of the parameter ϒ and an assumed value of r w = 0.05 m for the borehole radius. Transmissivity estimates have been broken down in Figure 5b to show hydraulic conductivity as a function of flow-layer thickness for the two different types of response test. For each type of test, the corresponding line in Figure 5b is the mean value of results from the four individual tests of that type, with vertical error bars showing the standard deviations of the means. The mean transmissivity for the connection-drainage tests is 1.52 × 10⁻³ m2 s−1; for slug tests, the mean transmissivity is 7.75 × 10⁻⁵ m2 s−1.
For a given aquifer thickness, hydraulic conductivity estimates derived from drainage tests are roughly an order-of-magnitude larger than those estimated from slug tests (Fig. 5b). Differences in results from the two types of test are not due to Spatial heterogeneity or poorly performed tests, as evidenced by the consistency of final parameter values for a particular type of test, even when both types of test were performed in the same borehole (e.g. hole 38). One possible explanation for this difference is that subglacial conditions are altered during connection-drainage tests, in which case the two types of test sample physically different systems; turbulent water flow during a drainage test could mobilize and flush fine-grained material from the flow layer in the vicinity of the borehole. However, in this situation one would expect subsequent tests to show an increase in hydraulic conductivity, rather than the decrease indicated by slug-test results.
Another possible explanation is that the overpressure condition that exists during the early stages of a connection-drainage test temporarily promotes ice-bed separation in the vicinity of the borehole, thereby facilitating water flow along the ice bed interface, as well as through basal sediments. The following sequence of events satisfies physical intuition. A borehole is full of water until a connection is established. At the moment of connection, the pressure exerted on the glacier sole by water in the borehole exceeds the local ice-flotation pressure by about 11%. The resulting glacier uplift provides an additional course for water exiting the borehole, effectively increasing the transmissivity for a brief period of time. During this time, a part of the increase in T is due to expansion of the flow layer b′ = b + Δb where Δb is the height of the ice-bed separation. However, we expect that Δb is small in comparison with b (say ∼1%), in which case the transient increase in T is Primarily due to an elevated “effective” hydraulic conductivity.
Acknowledging the effect of temporary ice-bed separation, Figure 5b suggests that estimates of hydraulic conductivity from drainage tests should be reduced by a factor of about 20 (the ratio of the mean transmissivity values given above), if they are to be representative of the subglacial flow layer under normal pressure conditions. Applying this correction to the estimated conductivities shown in Figure 5a results in a revised mean value of K = 5 × 10⁻⁴ m s−1, which we consider to be a valid estimate of the hydraulic conductivity of the basal-flow layer.
Figure 5c shows Specific storage S s, of the subglacial flow layer derived using Equations (6) and (7) and the final estimates of χ and ϒ from connection-drainage tests. Estimates of S s from slug tests are notoriously unreliable, even to orders of magnitude (Reference Papadopulos,, Bredehoeft and Cooper,Papadopulos and others, 1973; Reference Freeze, and CherryFreeze and Cherry, 1979, p. 342; Marsily, 1986, p. 203; Reference Harvey,Harvey, 1992); thus, we exclude them from this discussion. Specific storage is obtained after dividing Equations (6) by Equations (7):

To attain the results presented in Figure 5c, we have assumed that b = 0.1 m and r w = r f. With these assumptions, estimates of specific storage are in the range 5-20 × 10−5 m−1, with a mean value of 1.2 × 10⁻⁴ m−1 (indicated by the dashed line in Figure 5C).
As a consequence of heterogeneity of hydraulic conditions at the glacier bed, we expect that specific storage of the overall glacier substrate may be somewhat underestimated by drainage-test results. To explain this point, consider the following: Ss
can be described in words as the volume of water that an aquifer releases from storage per unit volume of aquifer per unit decline in hydraulic head, and it is defined mathematically as [![]() ], where α and β are the compressibilities of the porous medium and water, respectively (Reference Freeze, and CherryFreeze and Cherry, 1979, p.59); also, the compressibility of fine-grained sediments is typically greater than that of coarse-grained sediments, in some cases by several orders of magnitude (cf. Reference Freeze, and CherryFreeze and Cherry, 1979, p.55). Hence, a porous medium comprising sand- and gravel-size particles will generally have less storage capacity than one comprising clay- and silt-size material.
], where α and β are the compressibilities of the porous medium and water, respectively (Reference Freeze, and CherryFreeze and Cherry, 1979, p.59); also, the compressibility of fine-grained sediments is typically greater than that of coarse-grained sediments, in some cases by several orders of magnitude (cf. Reference Freeze, and CherryFreeze and Cherry, 1979, p.55). Hence, a porous medium comprising sand- and gravel-size particles will generally have less storage capacity than one comprising clay- and silt-size material.
In a region lacking a well-developed conduit or “canal” (cf. Reference Walder, and FowlerWalder and Fowler, 1994) system, subglacial water will tend to follow the least resistive paths through the substrate material or along its contact with basal ice. Parts of the substrate depleted of fine-grained matrix material offer less resistance to water flow, relative to those parts containing a greater percentage of silt and clay-size particles, and likely form a network of preferential flow paths which constitute the subglacial drainage layer. Impulse disturbances, such as those imparted by connection-drainage and slug tests, affect only the relatively permeable zones within the substrate; longer-term stresses are required to obtain a response from the less-permeable regions bounding the flow zones. Hence, storage values inferred from drainage-test results are characteristic only of the fines-depleted flow zones and, on average, specific storage of the glacier substrate will be higher than that estimated from drainage tests, due to the greater percentage of fine-grained matrix material in regions that are not part of the active flow layer.
Estimates of the flow-layer thickness (Fig. 5d) can be obtained using the conductivity values shown in Figure 5a and the connection-drainage test relationship between K and b shown in Figure 5b, essentially combining results for the ξ and ϒ parameters and the assumptions that were discussed in connection with Figure 5a and b. (For connection- drainage tests, using revised estimates of K and T in this calculation is unnecessary, since both are corrected by an equal amount. Also, slug-test results cannot be used to estimate b by this method because the parameter ξ is insensitive to that type of test). Estimates of the flow-layer thickness are in the range 0.1 – 0.3 m, with a mean value of about 0.18 m (indicated by the dashed line in Figure 5d.)
Comparison with other Studies
Hydraulic properties of the substrate of Trapridge Glacier have been investigated by means other than response testing. Reference Murray, and Clarke,Murray and Clarke (1995) provided values for K and (indirectly) Ss based on laboratory measurements of a basal till sample. They reported K = 2.2 × 10⁻⁸ m s−1 and (α + nβ) = 6.4 × 10⁻⁶ Pa−1. As described above, the quantity (α + nβ) must be multiplied by ρw g to obtain specific storage; for ρw = 1000 kg m−3 and g = 9.8 m s−2, this calculation yields Ss = 6.3 × 10⁻² m−1. In another study. Waddingion and Clarke (1995) analyzed pressure fluctuations in boreholes that were not connected to the subglacial drainage system. They concluded that the hydraulic conductivity of the Substrate in these regions was approximately 1-7 × 10⁻⁹ m s−1 and reported compressibilities (p. 121; Table 4) that correspond to values of specific storage in the range ∼10−4 to 10−1 m −1.
The values of hydraulic conductivity reported in both of these studies are substantially lower (several orders of magnitude) than our estimate of K = 5 × 10⁻⁴ m s−1 for the basal-flow layer. The difference is understandable for the following reasons: the study of Reference Waddington, and Clarke.Waddington and Clarke (1995) concerned the substrate at the base of boreholes that did not connected with the subglacial drainage system; the substrate in the vicinity of such boreholes must be significantly less permeable (conductive) than the drainage layer, since the substrate in these regions resists water flow, even in the presence of substantial hydraulic gradients. The laboratory results reported by Reference Murray, and Clarke,Murray and Clarke (1995) were obtained from a sample of exposed basal till, which may not be representative of material comprising the drainage layer. Furthermore, as pointed out by Reference Fountain,Fountain (1994), laboratory experiments measure water flow only within the porous matrix and do not account for the possibility of additional routing along the ice—bed interface.
Our estimate of Ss lies at the low end of the range reported Reference Waddington, and Clarke.Waddington and Clarke (1995). and is smaller than the value obtained by Reference Murray, and Clarke,Murray and Clarke (1995). However, as explained above, the storage properties of the drainage layer are likely very different from those of the substrate in unconnected regions and the spatial mean value of Ss is probably underestimated by connection-drainage test results.
In general, estimates of the hydraulic properties of the drainage system beneath Trapridge Glacier compare favorably with results reported from recent studies on other glaciers: based on analyses of average water levels and water-level variations in boreholes on South Cascade Glacier, Washington State, U.S.A.. Reference Fountain,Fountain (1994) concluded that the hydraulic conductivity of a basal sediment layer of thickness ȼ0.1 m was in the range 10−7 to 10−4 m s 10−1; Reference Iken,, Fabri and FunkIken and others (1996) used an analytic solution to the standard radial diffusion equation (Reference Marsily.Marsily, 1986, p. 162). which applies to drainage from a borehole into a uniform sediment layer of fixed thickness b and unlimited lateral extent, to analyze slug-test data from Gornergletscher, Valais, Switzerland. For b = 0.1 m, their results suggest that K = 2 × 10⁻² m s−1, although they pointed out that this value may be too large due to the assumption of unlimited lateral extent of the sediment layer; Reference Hubbard,, Sharp., Willis, Nielsen and SmartHubbard and others (1995) analyzed the propagation velocity of diurnal pressure waves to estimate the hydraulic diffusivity (D = K/Ss , of a sediment layer that participates in water movement at the bed of Haut Glacier d’Arolla. Valais, Switzerland. They reported diffusivities in the range 7 × 10⁻² to 4 × 101 m2 s−1. Our estimates of K = 5 × 10⁻⁴ m s−1 and Ss = 1.2 × 10⁻⁴ m−1 correspond to a value of D = 4.2 × 100 m2 s−1.
Summary and Concluding Remarks
We have described an inverse approach for analyzing borehole response-test data and demonstrated use of the method with data collected on Trapridge Glacier. For response tests performed on glaciers, we have also shown that it is important to consider the background trend in basal water pressure during the course of the test as a fundamental part of the analysis procedure. Data from two different types of response test were examined; consistent differences between results from the two types of test stimulated further consideration of the subglacial processes associated with each type of test.
Inversions of data from both connection-drainage and slug tests resulted in a close match between the field observations and the inversion results, implying that the forward model characterization and final parameter estimates provide a reasonable hydrologic representation of the sub-glacial drainage system. Results of the inversions suggest that the subglacial drainage network of Trapridge Glacier can be described as a confined layer comprising coarse-sand- to fine-gravel-sized sediments, having a thickness of 0.1 – 0.3 m and a hydraulic conductivity of about 5 × 10⁻⁴ m s−1. Based on connection-drainage test results, specific storage of the flow layer was estimated to be roughly 1 × 10⁻⁴ m−1.
Consideration of the physical effects of a borehole connection suggests that drainage-test results are susceptible to overestimation of hydraulic conductivity and probably underestimate mean specific storage of the glacier substrate. Drainage-test estimates of K can be revised using transmissivity information derived from slug tests. However, this approach cannot be used to verify estimates of Ss because slug tests do not provide reliable information concerning specific storage.
Acknowledgements
This research was funded by the Natural Sciences and Engineering Research Council of Canada and by the U.S. National Science Foundation under grant DPP92-24244. We thank Parks Canada and the Yukon territorial Government for permission to conduct research in Kluane National Park. Logistical support for the field program was provided by the Kluane Lake Research Station, operated by the Arctic Institute of North America. We are grateful to B. Barron and R. Grubin of the National Center for Atmospheric Research for computing assistance, and to M. Meier and A. Fountain for helpful discussions. Comments by A. Iken stimulated many improvements to the manuscript.
APPENDICES
A. Objective Function
The objective function provides a measure of the discrepancy between predicted and observed data. The method of least squares is commonly employed for this purpose. The objective function that we use (Equations (9)) is based on a least-squares approach involving two separate terms, which are described in this Appendix.
The idea behind the method of least squares is to find the set of model parameters that leads to the smallest total data misfit

where N is the number of data. Typically, the individual data-misfit terms are weighted according to the estimated uncertainties in the observed data [![]() ], and the total misfit is normalized by dividing by N. These modifications, applied to Equation (A1), lead to the following objective function:
], and the total misfit is normalized by dividing by N. These modifications, applied to Equation (A1), lead to the following objective function:

The goal is to obtain the smallest value of Фd, since this minimizes the total misfit between predicted and observed data. However, for two reasons, it is necessary to modify Equation (A2) before we proceed. First, the differential equations that comprise the forward model are coupled, non-linear and stiff. The stiffness arises because diffusion terms in the PDE (2) are translated by divided differences into a large system of ODEs (Reference Hairer, and WannerHairer and Wanner, 1991, p. 5). Under these conditions, numerical integration fails if model parameters are too unrealistic. Thus, the inversion algorithm must be restricted to searching a region of model space in which numerical solutions are both plausible and feasible. Secondly, the inversions need to be regularized. Regularization assures that small changes in the data will produce only small changes in the model parameter estimates, so that the solution remains stable (Reference Tikhonov, and Arsenin.Tikhonov and Arsenin, 1977, p.48). To guide and regularize inversions, we use a second objective function, which measures the parameter misfit:

where M is the number of parameters. [![]() ] are preliminary, “best-guess” parameter values and [
] are preliminary, “best-guess” parameter values and [![]() ] are the uncertainties associated with each [
] are the uncertainties associated with each [![]() ] The final objective function
] The final objective function
includes a trade-off parameter λ, which is an adjustable constant that determines the relative importance of the parameter and data-misfit terms. Regularized, least-squares expressions like Equation (A4) are sometimes called “penalty functions” and are widely used in ground-water studies involving inversion for parameter identification (Reference Carrera, and Neuman.Carrera and Neuman, 1986; Reference Yeh.Yeh, 1986).
B. Iterative-inversion procedure
We start an inversion with a set of model parameters that is known from forward modeling to produce a reasonable fit to the observed data. At this stage, the estimated set of model parameters represents our best guess of what the final solution will be. When the first inversion is complete, the final set of model parameters will correspond to a minimum value of Φ. We then start a second inversion by setting initial estimates equal to the final parameter values that were previously obtained. When the second inversion is complete, we compare the final value of Φ with that of the first inversion. In most cases, the two values of Φ agree to our specified level of precision. (Changes in Φ smaller than the precision that we specify — four significant digits — correspond to parameter changes that do not appreciably alter the forward model solution). In a few cases, however, additional inversions are required to reach consistent final values of Φ; these situations arise when the parameter-misfit term is significant. The end result of this iterative procedure is a “best-fitting” model, in the sense that the final objective-function value depends almost entirely on the data-misfit term.
Although the iterative procedure produces a best-fitting model, there is still uncertainty in the final result. Optimization methods based on Taylor expansions, such as the quasi-Newton method that we use, are guided by information on how a function behaves near a given point; they lack detailed information about a function’s behavior over the entire region. These methods are sensitive to initial starting conditions, because the algorithm has only local information with which to search for a solution. Thus, the result of the inversion might be a local minimum of Φ instead of a global minimum. The algorithm that we use attempts to escape local minima by testing wide-ranging parameter values early in the inversion, then making more subtle changes as Φ becomes smaller; however, some uncertainty in the final solution is inevitable. Furthermore, there is also the possibility of non-uniqueness, as two or more solutions might produce equal-valued minima in Φ. Uncertainty and non-uniqueness are intrinsic to many inverse problems and, in general, require some compromise in extracting information from any data set (Reference Menke,Menke, 1989. p. 17). Monte Carlo or uniform grid-search techniques could be used to help locate a global minimum but these procedures would be impractical for inversions of multiple-response tests — the computational requirements of performing even a few thousand inversions of a single-data set are prohibitive. In the light of these considerations, we use the phrase “estimates of model parameters” when referring to an inverse solution.


