

INTRODUCTION
It is axiomatic that concern for and investment in biodiversity conservation varies greatly both between individuals and between countries, yet the reasons for this variation remain elusive. The current biodiversity crisis has united the world's nations in attempts, thus far with mixed success, to address it (Butchart et al. Reference Butchart, Walpole and Collen2010). It is apparent that the response to the problem is occurring at different rates in different countries and that simple economics are not the sole determinant of this variation. For example, richer countries spend more on conservation but have less biodiversity (McClanahan & Rankin Reference McClanahan and Rankin2016) and national-level success in protecting threatened species is largely unrelated to wealth (Rodrigues et al. Reference Rodrigues, Brooks and Butchart2014). National conservation effort varies by region (Lindsey et al. Reference Lindsey, Chapron, Petracca, Burnham, Hayward, Henschel, Hinks, Garnett, Macdonald, Macdonald and Ripple2017) and protected area cover appears to depend mainly upon an interaction between democratic strength and inequality (Kashwan Reference Kashwan2017). A greater understanding of this variation in state-level responses to biodiversity conservation might help identify means to increase the prevalence of positive conservation efforts (and thereby contribute to Aichi Target 1 of the Convention on Biological Diversity Strategic Plan for Biodiversity 2011–2020; CBD 2010), as well as being useful in conservation planning (Eklund et al. Reference Eklund, Arponen, Visconti and Cabeza2011; Lindsey et al. Reference Lindsey, Chapron, Petracca, Burnham, Hayward, Henschel, Hinks, Garnett, Macdonald, Macdonald and Ripple2017).
Although we are not aware of any single overriding theory to explain national-level variation in conservation responses, numerous hypotheses have been proposed to account for the adoption of more general concerns for the environment and pro-environmental behaviour (‘environmentalism’), both between individuals and between states (Table 1). The underlying metrics of such analyses are usually factors such as energy use, recycling, responses to pollution, willingness to pay, aesthetic appreciation of nature or ‘biospheric’ values towards the environment (Steg & Vlek Reference Steg and Vlek2009; Raymond & Kenter Reference Raymond and Kenter2016). Although there is much overlap, the literature examining individual-level variation in environmentalism focuses on personal characteristics and psychological variables such as attitudes, beliefs, values and norms (Schwartz Reference Schwartz1992; Dietz et al. Reference Dietz, Fitzgerald and Shwom2005; Schultz et al. Reference Schultz, Gouveia, Cameron, Tankha, Schmuck and Franěk2005; Heberlein Reference Heberlein2012). In contrast, national-level variation is usually explained by macro-level socioeconomic drivers (Pisano & Lubell Reference Pisano and Lubell2017). As the focus of this study is on national responses to conservation, we review these socioeconomic theories and use them as the basis of our analysis.
Some socioeconomic and societal correlates of broad environmentalism identified at national and individual levels. Numbers in parentheses in the first column link to those listed after the names of the explanatory variables in Table 2 to indicate which factor each explanatory variable was selected to represent in the models. GDP = gross domestic product.
The roots of environmentalism
At least three (not mutually exclusive) theories have been proposed to explain the development of broad environmentalism in terms of economic growth. Inglehart (Reference Inglehart1995; Reference Inglehart2000) proposed that environmental concerns and corresponding environmental behaviours are the results of post-materialistic values that are likely to be more prevalent in wealthier nations: once a certain level of economic security is met, individuals become free to develop post-materialistic values, which include support for movements such as feminism, human rights, animal welfare and environmentalism (Duroy Reference Duroy2008). The post-materialist hypothesis receives empirical support from a number of studies that find a positive relationship between environmentalism and post-materialist values (Abramson Reference Abramson1997; Kidd & Lee Reference Kidd and Lee1997). However, this link has been challenged (Dietz et al. Reference Dietz, Fitzgerald and Shwom2005). For instance, Davis (Reference Davis2000) found no difference between post-materialists and materialists in their perceived personal efforts regarding conservation or general ecological concerns, while Fairbrother (Reference Fairbrother2013) suggested that environmental concerns are highest in poorer nations. Inglehart (Reference Inglehart1995) also acknowledged that environmental concerns persist in poorer nations, but suggested that citizens of poorer countries develop environmental concerns over local issues that directly affect them, whereas in wealthy nations environmental concern is more likely to arise as an indirect consequence of affluence.
The prosperity hypothesis (Diekmann & Franzen Reference Diekmann and Franzen1999) predicts that environmental concern increases with economic development as a direct consequence of greater income and not due to the development of new values. This hypothesis is based upon standard economic theory, which reasons that the restoration of a damaged environment is not only a collective good but also a superior good, for which demand rises with income (Franzen & Meyer Reference Franzen and Meyer2010). Consequently, there should be a positive correlation between a country's wealth and its level of environmental responsibility. This is supported by evidence that pro-environmental views and willingness to pay for environmental protection increase with wealth both within and between countries (Kemmelmeier et al. Reference Kemmelmeier, Krol and Kim2002; Franzen Reference Franzen2003; Franzen & Meyer Reference Franzen and Meyer2010).
Both the post-materialism and prosperity hypotheses are also used to support the environmental Kuznets curve (EKC) hypothesis, which proposes that whilst environmental degradation initially rises with increasing income per capita, degradation levels stabilize before declining at higher income levels (Grossman & Krueger Reference Grossman and Krueger1995; Dinda Reference Dinda2004). An EKC has been identified for some environmental metrics like energy use, emissions and water quality (Luzzati & Orsini Reference Luzzati and Orsini2009; Orubu & Omotor Reference Orubu and Omotor2011; Apergis & Ozturk Reference Apergis and Ozturk2015), but has been contested as an empirical illusion (Stern Reference Stern2004) and fails to appear in other studies with the same or other environmental indicators (Koop & Tole Reference Koop and Tole1999; Kijima et al. Reference Kijima, Nishide and Ohyama2010; Ozturk & Al-Mulali Reference Ozturk and Al-Mulali2015), including those related to conservation (Dietz & Adger Reference Dietz and Adger2003; Mills & Waite Reference Mills and Waite2009).
All economic explanations of environmentalism face the inherent contradiction that while concern for the environment may increase with greater wealth, so too does environmental destruction, since economic development has been identified as one of the strongest correlates of biodiversity loss (Dietz et al. Reference Dietz, Rosa and York2007; Bradshaw et al. Reference Bradshaw, Giam and Sodhi2010). Furthermore, these affluence-based hypotheses have been challenged by Dunlap and Mertig (Reference Dunlap and Mertig1997) and Dunlap and York (Reference Dunlap and York2008), whose globalization hypothesis posits that environmental concerns are no longer confined to post-materialistic elites within wealthy nations and that there is no clear correlation between wealth and environmental concern.
Although none can be entirely divorced from economics, numerous other socioeconomic patterns have been proposed to explain environmentalism, both between and within nations (Table 1). Pinker (Reference Pinker2011) argues that long-term declines in human violence can be linked to a number of ‘civilizing’ historical and social trends, such as the development of the modern nation state and its associated judiciary, the empowerment of women and advances in education. Closely following the trend of declining violence against humans, Pinker (Reference Pinker2011) argues, is a decline in violence against animals and, perhaps in the longer term, this extends to a decline in violence against the environment. Pinker's (Reference Pinker2011) ideas overlap with the principles of world polity theory that highlights the global cultural diffusion of accepted institutional structures and modes of thinking (Shandra Reference Shandra2007; Givens & Jorgenson Reference Givens and Jorgenson2013) and how international organizations such as the UN fund and support domestic environmentalism as part of a ‘world environmental regime’ (Longhofer & Schofer Reference Longhofer and Schofer2010). World polity theory might explain why even countries with negligible interests in environmental matters generally have a government department charged with overseeing such issues.
A nation's linkage to world society is a strong predictor of the number of international environmental treaties it has ratified (Frank Reference Frank1999) and its level of environmental concern (Longhofer & Schofer Reference Longhofer and Schofer2010). Global institutionalization of the principle that nations bear responsibility for environmental protection may be more influential in driving national conservation agendas than the domestic processes of increasing affluence or environmental degradation (Frank et al. Reference Frank, Hironaka and Schofer2000). Both Pinker's (Reference Pinker2011) civilizing process and world polity theory require significant time over which to evolve, perhaps explaining why the age or perceived age of a country is positively correlated with environmentalism (Hershfield et al. Reference Hershfield, Bang and Weber2014).
Developing an overarching theory may be problematic given that other historical (Grove Reference Grove1996; Adams et al. Reference Adams, Aveling, Brockington, Dickson, Elliott, Hutton, Roe, Vira and Wolmer2004), political (Heath & Gifford Reference Heath and Gifford2006; Sapiains et al. Reference Sapiains, Beeton and Walker2016) and religious traditions (White Reference White1967; Hand & Van Liere Reference Hand and Van Liere1984) also shape environmental concerns and values both within and between countries (Manfredo et al. Reference Manfredo, Teel and Dietsch2016). Moreover, the direction of predictors of environmentalism can vary across countries with different income levels (Nawrotzki Reference Nawrotzki2012) or within countries over time (Kahn Reference Kahn2002; Franzen & Vogl Reference Franzen and Vogl2013). Furthermore, it appears that environmental concern does not always predict pro-environmental behaviour (Schultz et al. Reference Schultz, Gouveia, Cameron, Tankha, Schmuck and Franěk2005; Steg & Vlek Reference Steg and Vlek2009; Heberlein Reference Heberlein2012; Everard et al. Reference Everard, Reed and Kenter2016).
We assess the performance of these key hypotheses developed to explain the variation in broad environmentalism for explaining country-level variation in the more specific area of biodiversity conservation. While the drivers of variation in responses to biodiversity and wildlife have been explored in local contexts (Johansson et al. Reference Johansson, Rahm and Gyllin2013; Kansky et al. Reference Kansky and Knight2014) and predictors of broad environmentalism have been assessed at a multinational level (Gelissen Reference Gelissen2007; Nawrotzki Reference Nawrotzki2012; Givens & Jorgenson Reference Givens and Jorgenson2013; Harring Reference Harring2013; Hershfield et al. Reference Hershfield, Bang and Weber2014), studies of conservation responses at the national level are sparse. To our knowledge, the only conservation-specific response metrics that have been considered on a national level are biodiversity loss (Shandra et al. Reference Shandra, Leckband, McKinney and London2009; Butchart et al. Reference Butchart, Walpole and Collen2010; Rodrigues et al. Reference Rodrigues, Brooks and Butchart2014), domestic conservation spending (McClanahan & Rankin Reference McClanahan and Rankin2016), protected area cover (Kashwan Reference Kashwan2017) and a composite of these three metrics specifically with regards to megafauna conservation (Lindsey et al. Reference Lindsey, Chapron, Petracca, Burnham, Hayward, Henschel, Hinks, Garnett, Macdonald, Macdonald and Ripple2017). As previous studies of environmental behaviours show that different metrics respond to different socioeconomic drivers and influences (Hadler & Haller Reference Hadler and Haller2011), we consider multiple metrics of conservation responses. Specifically, we aim to further the understanding of the variation in country-level conservation efforts by assessing together additional and previously unconsidered metrics of national-level conservation responses alongside explanatory socioeconomic variables used in previous studies to predict variation between nations in broad environmentalism (Table 1).
METHODS
We collected socioeconomic and historical data for each of the world's nation states and used these in a multivariate regression analysis to model a number of variables related to national-level conservation responses or performance. Details of the response and explanatory variables selected, their sources and the specific hypotheses they were selected to test are given in Table 2. All analyses were conducted in R 3.0.1 (R Development Core Team Reference Development Core Team2014); model selection was implemented using the package ‘MuMIn’ (Bartoń Reference Bartoń2012). We modelled seven country-level response variables: per capita membership of environmental non-governmental organizations (NGOs); the number of International Union for Conservation of Nature (IUCN) organizations operating in the country; the extent to which Aichi Biodiversity Target 11 to protect biomes has been met; an index of ecosystem vitality; governmental spend on domestic conservation; governmental adoption of multilateral environmental agreements; and the enforcement of environmental regulations. These variables were selected because they include independent metrics that relate to a range of public and national responses to the biodiversity crisis, which have previously not been considered together in similar analyses. Additionally, data were available for each variable for a sufficiently large number of countries (over 90) to allow multivariate modelling. The seven response variables were not strongly inter-correlated (Table S1, available online). Based on previous studies of variation between nations in broad environmentalism and the hypotheses already reviewed (Table 1), we initially considered seven explanatory variables: gross domestic product (GDP); per-capita GDP (adjusted for purchasing power parity); country age; level of globalization; quality of governance; level of human development; and degree of post-materialism (Table 2). The Human Development Index was highly correlated with both per-capita GDP and globalization (r >0.8; Table S2) and therefore excluded, as data were available for fewer countries. The small sample size (n = 76 countries) of the only available multinational metric of post-materialism meant that including this variable in analyses would reduce statistical power. Thus, we assessed two sets of models: one fitting the five explanatory variables with large sample sizes (GDP, per-capita GDP, country age, globalization and governance) and the other with these five variables plus post-materialism. We included linear and quadratic terms of GDP and per-capita GDP to assess evidence of EKCs (Grossman & Krueger Reference Grossman and Krueger1995). We also tested interaction terms between: (i) GDP and governance; and (ii) per-capita GDP and governance.
Descriptions and sources of the response and explanatory variables used in the analyses. For the explanatory variables, the numbers in parentheses after the variable name link to those given in Table S1 to indicate which factor previously shown to predict broad environmentalism each was chosen to test. Small or non-independent polities (e.g. San Marino, Gibraltar) and recently created states that are included in the CIA World Factbook (https://www.cia.gov/library/publications/the-world-factbook) but for which many variables were missing (e.g. South Sudan, Somaliland) were removed from the analysis (n = 14). GDP = gross domestic product; IUCN = International Union for Conservation of Nature; NGO = non-governmental organization.

We used generalized linear models (GLMs) to model each response variable as a function of the two sets of explanatory variables. We standardized all explanatory variables to compare the effect size among explanatory variables and normalized GDP, per-capita GDP and country age using log10 transformation. Because NGO membership and the number of IUCN organizations are likely to vary with population size and because we could not model the per-capita values of these because per-capita GDP was included as a predictor (thus meaning that population size would appear on both sides of the regression equation, causing spurious correlations), the population size of each nation was also included as a predictor in these models to control for its effect, though we do not report its result. Statistical distributions assumed in the GLMs were based on the type of the response variables: normal for log10-transformed NGO membership, ecosystem vitality and environmental enforcement; negative binomial for the IUCN organizations; binomial for Aichi Target 11 progress and multilateral agreements; and Gamma for square root-transformed domestic conservation spending. We adopted a model selection approach (Burnham & Anderson Reference Burnham and Anderson2002). We generated a set of models with all possible parameter subsets, which were then fitted to the data using the GLMs and ranked by ΔQAICc (the difference between each model's corrected quasi-likelihood Akaike information criterion (QAICc) and QAICcmin, that of the ‘best’ model) for binomial GLMs to deal with over-dispersion and ΔAICc for others. We report the top ten models or all models with ΔAICc or ΔQAICc values <2 for each analysis. To investigate the effect of spatial autocorrelation, we calculated Moran's I for the residuals from the full models using the package ‘ncf’ (Bjørnstad Reference Bjørnstad2005) in R. The calculated Moran's I was small (|Moran's I| <0.3) up to the first 14 000 km in all the databases, indicating no more than a weak autocorrelation. Thus, we did not consider spatial autocorrelation explicitly in the models.
Considering the relatively strong positive correlations between governance, per-capita GDP and globalization (r = 0.71–0.77; Table S2), we also adopted a variation partitioning approach (Borcard et al. Reference Borcard, Legendre and Drapeau1992) to assess the unique and shared contributions of these three explanatory variables to explaining between-nation variation in conservation responses. We used R 2 for GLMs assuming normal distribution (NGO membership, ecosystem vitality and environmental enforcement) and McFadden's pseudo-R 2 for others. We excluded the quadratic and interaction terms of per-capita GDP.
RESULTS
Model selection yielded strong support for an effect of governance in explaining variation in almost all the response variables modelled. Governance was the only explanatory variable that was included in all models of all response variables with ΔAICc or ΔQAICc values <2 (Table S3). The response variables all showed a strong positive association with governance (Fig. 1(a)). The results also identified GDP as a significant predictor, as it was included in more than half the models with ΔAICc or ΔQAICc values <2, including the best models of six response variables (Fig. 1(b), Table S3).
Relationships between seven response variables reflecting conservation concerns and (a) governance, (b) GDP, (c) per-capita GDP, (d) country age and (e) globalization. Lines represent regression lines based on the estimated coefficients in the best models (Table S3). Lines are not shown for variables not included in the best models. The y-axes differ between response variables. GDP = gross domestic product; IUCN = International Union for Conservation of Nature; NGO = non-governmental organization; USD = US dollars.
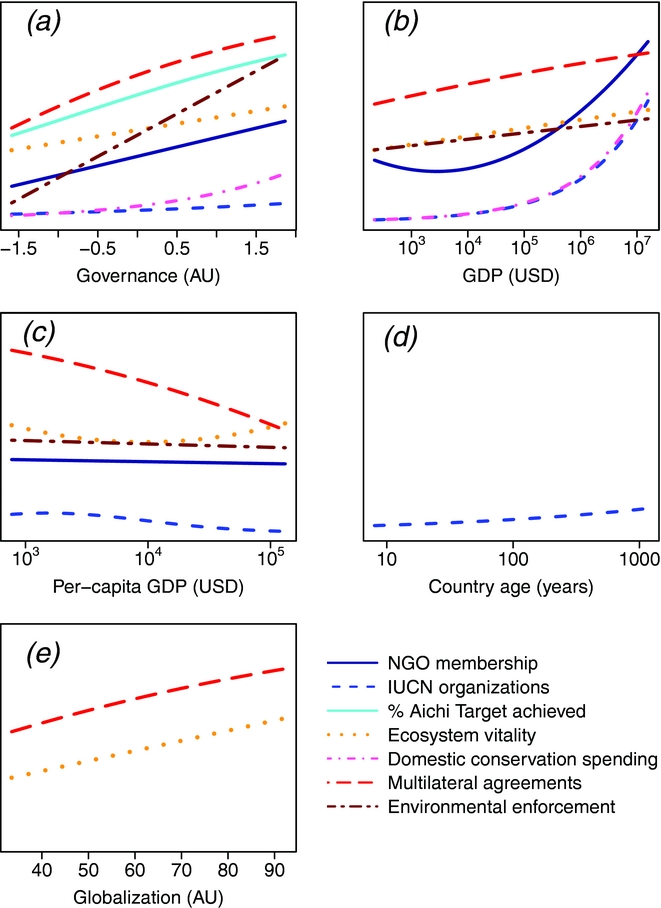
The same key role of governance was found in the models that included a measure of post-materialism, except in the case of the number of IUCN organizations (Table S4). Post-materialism itself failed to explain significant variation in any of the response variables (Table S4). We did not find clear evidence of an EKC for any of our conservation response variables besides ecosystem vitality, for which there was a weak indication of an EKC.
The variation partitioning showed that the unique contribution of governance was higher than that of per-capita GDP and globalization in accounting for variation in four of the seven response variables. However, for all but one response variable the variation was best explained by the three variables (governance, per-capita GDP and globalization) combined, rather than any one of them alone (Fig. 2).
Results of variation partitioning for (a) NGO membership, (b) IUCN organizations, (c) % Aichi Target achieved, (d) ecosystem vitality, (e) domestic conservation spending, (f) multilateral agreements and (g) environmental enforcements, in terms of fractions of variation explained independently and jointly by governance, per-capita GDP and globalization. GDP = gross domestic product; IUCN = International Union for Conservation of Nature; NGO = non-governmental organization.
DISCUSSION
Our analyses yielded equivocal support for the largely economic hypotheses that have been developed to explain variation in broad environmentalism. GDP received support in models of only some response variables, including for conservation spending, mirroring the results of McClanahan and Rankin (Reference McClanahan and Rankin2016). Post-materialism failed to explain variation in any of the variables modelled. Globalization also failed to garner much support from the data as being a useful predictor. Country age was the best predictor of the number of IUCN organizations within a country, which lends support to the observation by Herschfield et al. (Reference Hershfield, Bang and Weber2014) that country age is a predictor of public environmental concern. However, country age was a poor predictor of other conservation metrics and effective environmental organization may not necessarily reflect underlying public environmental concern (Longhofer & Schofer Reference Longhofer and Schofer2010). Instead, governance was found to be the best predictor across almost all variables, suggesting that world polity theory and Pinker's (Reference Pinker2011) ‘civilising process’ might be useful frameworks with which to explore further the between-nation variation in conservation responses and performance. The extent to which governance was a better predictor of responses to biodiversity conservation than economic wealth was unexpected and cannot be explained by covariance between governance, per-capita GDP and globalization, since variation partitioning revealed that, in four out of the seven response variables, the independent contribution of governance to explaining variation in response variables was far greater than that of the other two variables. Governance has been shown to be an important predictor of biodiversity loss (Smith et al. Reference Smith, Muir, Walpole, Balmford and Leader-Williams2003), deforestation rates (Wright et al. Reference Wright, Sanchez-Azofeifa, Portillo-Quintero and Davies2007; Umemiya et al. Reference Umemiya, Rametsteiner and Kraxner2010), protected area effectiveness (Barnes et al. Reference Barnes, Craigie and Harrison2016) and poaching (Burn et al. Reference Burn, Underwood and Blanc2011), but as far as we are aware, ours is the first analysis to suggest that governance outperforms more purely economic variables in explaining a range of metrics of conservation effort and investment across most of the world's nations.
Although the causal links between governance and biodiversity conservation remain unclear, there are several plausible mechanisms. The relationship between biodiversity and corruption is complex and poorly understood (Smith & Walpole Reference Smith and Walpole2005; Barrett et al. Reference Barrett, Gibson, Hoffman and McCubbins2006), but willingness to make economic sacrifices for environmental protection appears to be strongly affected by individual political trust (Harring Reference Harring2013). The over-centralization typical of countries with lower governance scores may inhibit local conservation actions (Everard Reference Everard2015; Zheng & Cao Reference Zheng and Cao2015) and in these states conservation policy may not be supported by the development of legal standards and procedures (Otto et al. Reference Otto, Shkaruba and Kireyeu2011). Effective governance might promote the growth of agricultural yields while minimizing the spread of uncontrolled, particularly damaging agriculture (Ceddia et al. Reference Ceddia, Bardsley, Gomez-y-Paloma and Sedlacek2014). Internal strife and conflict, the rates of which are explicitly captured in governance statistics, have generally negative impacts on biodiversity (Dudley et al. Reference Dudley, Ginsberg, Plumptre, Hart and Campos2002). On a local scale, better governance may increase the strength of local institutions and improve common-pool resource management, particularly where property rights are lacking (Ostrom et al. Reference Ostrom, Janssen and Anderies2007). Likewise, less effective governance undermines sustainable harvest (Nelson et al. Reference Nelson, Lindsey and Balme2013; Schuhbauer & Sumaila Reference Schuhbauer and Sumaila2016) and incentive-based conservation (Ebeling & Yasué Reference Ebeling and Yasué2009; Duchelle et al. Reference Duchelle, Cromberg, Gebara, Guerra, Melo, Larson, Cronkleton, Börner, Sills, Wunder and Bauch2014). Finally, improved quality of governance may be associated with greater engagement with international conservation agreements. For example, European countries must achieve an acceptable level of governance before they can accede to the European Union, upon which they are bound to strict conservation legislation that has been shown to be successful (Donald et al. Reference Donald, Sanderson, Burfield, Bierman, Gregory and Waliczky2007), although such legislation is not always enforced (López-Bao et al. Reference López-Bao, Blanco, Rodríguez, Godinho, Sazatornil, Alvares, García, Llaneza, Rico, Cortés and Palacios2015). Democracies perform better than other systems of government in joining and implementing international conservation agreements and in protecting land for wildlife (Neumayer Reference Neumayer2002a).
Our finding that globalization correlates with some conservation responses (multilateral agreements and ecosystem vitality) corroborates Neumayer (Reference Neumayer2002b), who found a positive association between trade openness and the ratification of multilateral environmental agreements. However, the absence of a relationship between globalization and our other response variables suggests that economic, social and political connectivity by themselves do not increase conservation efforts. Instead, if conservation responses have spread around the globe, it might be down to the influence of specific actors, such as international environmental organizations (Shandra et al. Reference Shandra, Leckband, McKinney and London2009; Givens & Jorgenson Reference Givens and Jorgenson2013). Given the significance of governance identified here, the influence of world polity on conservation may also have occurred indirectly via the building of conservation capacity through democratic institutions and governance systems (Dunlap & York Reference Dunlap and York2008). This link is supported by the finding that international NGOs help reduce deforestation and do so increasingly at higher levels of democracy (Shandra Reference Shandra2007).
Conservation responses may also be influenced by other forms of capacity, however. Environmental organizations, for example, appears to depend heavily on the availability of financial resources, the concentration of individuals in populated urban areas (Gillham Reference Gillham2008) and levels of education and awareness (Brady et al. Reference Brady, Verba and Schlozman1995; Duroy Reference Duroy2008). These factors, which we did not specifically test here, might also account for why the number of IUCN organizations did not correlate with governance as strongly as our other response variables. Furthermore, all these factors identified that occur at the national level may overshadow the influence of post-materialist values at the individual level (Kemmelmeier et al. Reference Kemmelmeier, Krol and Kim2002), thus perhaps explaining why we fail to find an effect of post-materialism here. Alternatively, this might be because conservation problems have both materialist and non-materialist dimensions in both rich and poor nations (Martinez-Alier & Guha Reference Martinez-Alier and Guha1997; Dunlap & York Reference Dunlap and York2008). Indeed, the range of conservation motivations is reflected in the many types of (materialist and non-materialist) ecosystem services identified across all societies (Crossman et al. Reference Crossman, Burkhard, Nedkov, Willemen, Petz, Palomo, Drakou, Martín-Lopez, McPhearson, Boyanova and Alkemade2013; Raymond & Kenter Reference Raymond and Kenter2016). Moreover, given that post-materialist values and resulting environmental behaviours are supposed to be the products of prosperity (Inglehart Reference Inglehart1995; Reference Inglehart2000), the lack of a clear relationship between our conservation responses and per-capita wealth refutes the post-materialism hypothesis.
We also found no evidence for an EKC for conservation responses. Ecosystem vitality was the only variable that showed a relationship resembling a weak EKC, but this effect may be down to the indices of water pollution and air quality, which make up the majority of the ecosystem vitality index (Morse Reference Morse2017) and have previously been found to follow the EKC, rather than biodiversity. Along with economic growth driving increasing environmental concern and demand, a key tenant of the EKC, is that technological progress eventually reduces environmental degradation. However, technological progress has not yet produced similar results for conservation, owing to slow speciation rates (Dietz & Adger Reference Dietz and Adger2003), competitive exclusion of non-human species and challenges involved in habitat restoration (Czech Reference Czech2008), which might explain the lack of an EKC for biodiversity metrics. Indeed, wealth appears only to start reducing biodiversity loss once a minimal level of institutional quality has been achieved (Gren et al. Reference Gren, Campos and Gustafsson2016), again emphasizing the significance of governance in determining conservation outcomes. However, our other responses, which relate more to conservation concern and effort, also showed no EKC relationship. This finding suggests that conservation efforts will not readily decline as poorer nations develop and that greater wealth does not necessarily inspire greater conservation efforts, despite the notion that richer people may be more willing to pay for conservation (Jacobsen & Hanley Reference Jacobsen and Hanley2009; Franzen & Meyer Reference Franzen and Meyer2010). Lastly, again departing from an EKC, some poorer nations may prioritize conservation for economic reasons (such as ecotourism) and, unlike other forms of environmental degradation, the direct links between biodiversity loss and human well-being (Díaz et al. Reference Díaz, Fargione, Chapin and Tilman2006) may be appreciated differently by citizens and policy makers across the world.
We did not identify inequality as being one of the key hypothesized drivers of environmentalism (hence we did not account for it in our analysis), but inequality may also influence conservation responses. Environmental performance of nations appears to increase with equality (Morse Reference Morse2017), but protected area cover also depends on the strength of democracy (Kashwan Reference Kashwan2017). In countries with strong democracies, low inequality is associated with higher protected area cover, but in weak democracies, higher inequality is associated with greater protected area cover (Kashwan Reference Kashwan2017), possibly because establishing conservation areas may be easier in areas of weaker property rights, greater power associated with elites (including environmental organizations) (Sandbrook Reference Sandbrook2017) and limited civic ability to contest (Kashwan Reference Kashwan2017). This result challenges our findings by demonstrating that some conservation responses can proliferate under less effective governance. However, protected area cover is also associated with remoteness (Joppa & Pfaff Reference Joppa and Pfaff2009) and tourism attractiveness (Baldi et al. Reference Baldi, Texeira, Martin, Grau and Jobbágy2017), suggesting a degree of strategic planning or opportunism that deserves greater exploration. Besides, the size of protected area coverage is not necessarily indicative of its quality (De Santo Reference De Santo2013); instead, local governance seems to be a key driver of conservation and social outcomes (Oldekop et al. Reference Oldekop, Holmes, Harris and Evans2016).
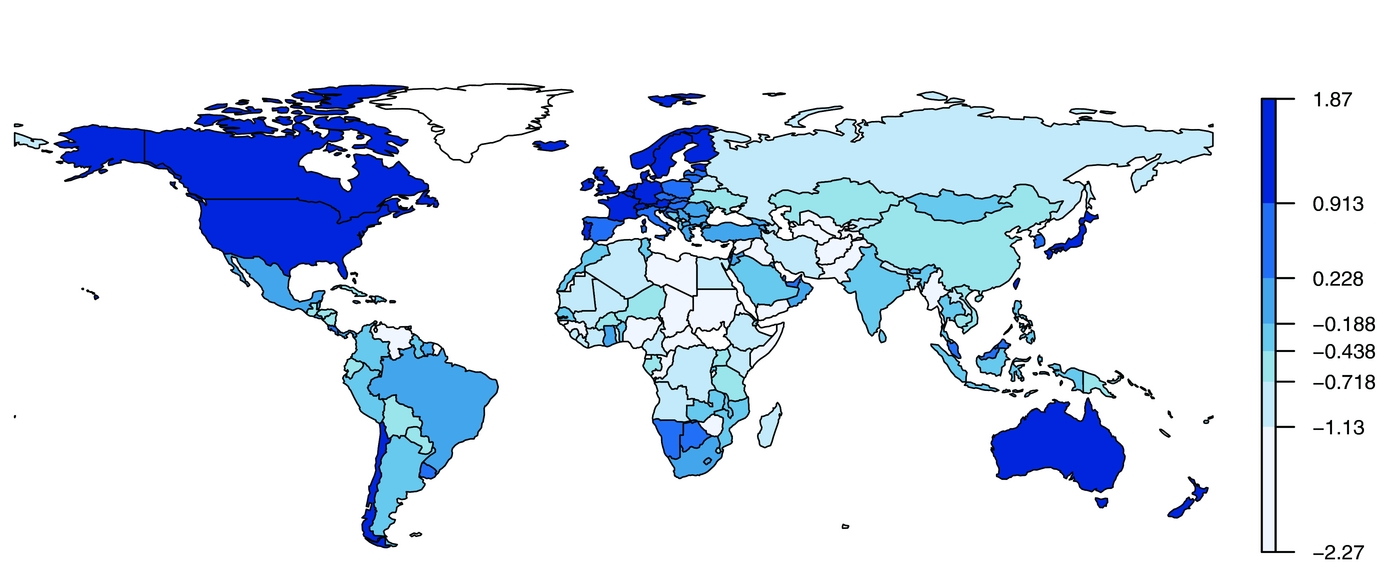
Wealthier countries tend on average to have higher levels of governance, but there is a sufficient number of wealthy countries with less effective governance and poor countries with effective governance to justify treating governance as an informative metric in its own right and not simply a surrogate of wealth. Given the importance of governance in explaining countries’ conservation responses and investment, this provides important insights into future changes in global conservation activities. Many countries in biodiversity-rich regions, such as South Asia, sub-Saharan Africa and Latin America and the Caribbean, now have rapidly growing economies, posing serious threats to biodiversity in these regions (Bradshaw et al. Reference Bradshaw, Giam and Sodhi2010). However, governance in these regions is generally low (Fig. 3), suggesting that their levels of positive conservation responses and investment are unlikely to increase in the near future. This suggests a further challenge to achieving the Aichi Biodiversity Targets, which aim to improve the status of biodiversity and enhance the implementation of effective biodiversity strategies and action plans by 2020 (CBD 2010).
The global distribution of the World Bank's worldwide governance indicators (2013 values).
Nonetheless, governance is dynamic and can change within countries over time (Inglehart & Welzel Reference Inglehart and Welzel2005). Whilst the potential for improved governance is encouraging for conservation, periods of instability and armed conflict can easily threaten biodiversity (Loucks et al. Reference Loucks, Mascia, Maxwell, Huy, Duong, Chea, Long, Cox and Seng2009; Brashares et al. Reference Brashares, Abrahms, Fiorella, Golden, Hojnowski, Marsh, McCauley, Nuñez, Seto and Withey2014) and even in wealthy, well-governed states environmental regulations can readily be disregarded, diminished and discarded (López-Bao et al. Reference López-Bao, Blanco, Rodríguez, Godinho, Sazatornil, Alvares, García, Llaneza, Rico, Cortés and Palacios2015; Chapron et al. Reference Chapron, Epstein, Trouwborst and López-Bao2017). Wealthy, well-governed states may also appear to superficially improve their conservation performance by transferring the ecological footprint of their consumption and industry to poorer, less well-governed nations in ‘unequal ecological exchange’ (Jorgenson Reference Jorgenson2016). Scrutinizing such patterns further and improving the transparency of transnational supply chains would help tackle this problem. The nature of conservation governance is also subject to change (Agrawal et al. Reference Agrawal, Chhatre and Hardin2008; Duffy Reference Duffy2014) with sometimes unintended negative consequences, such as perverse incentives (Gordon et al. Reference Gordon, Bull, Wilcox and Maron2015) or stakeholder resentment (Bennet & Dearden Reference Bennett and Dearden2014). Existing local governance structures can also outperform centralized state regimes (such as protected areas) in some places (Schleicher et al. Reference Schleicher, Peres, Amano, Llactayo and Leader-Williams2017). These effects should be appreciated when considering new forms of environmental governance, including digital crypto-governance, which has been tipped to improve environmental record keeping and reduce corruption with blockchain technology (Chapron Reference Chapron2017). The digital world is also increasingly offering new ways for individuals to engage with conservation online, presenting opportunities for increased participation (Baynham-Herd Reference Baynham-Herd2017), but also new challenges, including for conservation governance (Büscher Reference Büscher2017).
We suggest that metrics relating to governance might also be of considerable use in conservation planning. Like economic costs (Naidoo et al. Reference Naidoo, Balmford, Ferraro, Polasky, Ricketts and Rouget2006), governance scores could be used for assessing where conservation investments and capacity building would most profitably be directed and for determining the types of conservation action (capacity development or practical delivery) that are most likely to bear fruit (Eklund et al. Reference Eklund, Arponen, Visconti and Cabeza2011; Garnett et al. Reference Garnett, Joseph, Watson and Zander2011). Indeed, there is evidence that international aid for biodiversity conservation is already being targeted at recipient countries that have higher levels of governance (Miller et al. Reference Miller, Agrawal and Roberts2013). Wider recognition of the link between governance and conservation may encourage greater collaboration between conservation interests and those working to promote better governance. Environmental NGOs have already contributed to this process and have helped construct a world polity that speeds up the transfer of conservation as a universal principle between nations (Boli & Thomas Reference Boli and Thomas1997; Longhofer & Schofer Reference Longhofer and Schofer2010; Givens & Jorgenson Reference Givens and Jorgenson2013). At the local level, working to improve conservation governance might also prove more productive than trying to generate shifts in conservation values (Manfredo et al. Reference Manfredo, Bruskotter, Teel, Fulton, Schwartz, Arlinghaus, Oishi, Uskul, Redford, Kitayama and Sullivan2017). Lastly, we suggest our findings should promote further scrutiny regarding the notion that through economic growth alone we will escape from this biodiversity crisis. There is more to conservation than markets: governance must be considered alongside growth.
ACKNOWLEDGEMENTS
We are very grateful for the constructive comments that we received from Guillaume Chapron, an anonymous second reviewer and the Associate Editor, Aaron MacNiel.
FINANCIAL SUPPORT
No funding was required for this research. WJS is funded by Arcadia. ZBH is funded by the Natural Environment Research Council (NERC).
CONFLICT OF INTEREST
None.
ETHICAL STANDARDS
This study did not involve any human or animal subjects and all data analysed were freely available online.
Supplementary Material
To view supplementary material for this article, please visit https://doi.org/10.1017/S037689291700056X


 Open access