
Use of stated preferences to value public goods can be traced back to proposals by Bowen (Reference Bowen1943) and Ciriacy-Wantrup (Reference Ciriacy-Wantrup1947) with the first application of contingent valuation attributed to Davis' (Reference Davis1963) use of questionnaires to value recreational hunting opportunities in the Maine woods. Throughout the intervening period, use of stated preferences to measure individual values for public goods has been challenged because of the hypothetical nature of the exercise.Footnote 1 In extending Thurstone's (Reference Thurstone1931) efforts to derive indifference curves through questioning of individuals about tradeoffs they would make, Bowen (Reference Bowen1943, p. 44) noted that “the difficulty with this approach is … the possibility that verbal preferences would differ significantly from actual choices in a real situation.” Following closely on the heels of Davis' initial field application of the contingent valuation method, Scott (Reference Scott1965, p. 37) lambasted stated preferences as a tool for recreational management with an oft-repeated quip: “Ask a hypothetical question and you get a hypothetical answer.” And more recently, in an assessment of stated preferences in an article in Journal of Economic Perspectives to which I will refer frequently in this presentation, Hausman (Reference Hausman2012, p. 44) concluded that “The nature of a survey is that it asks a hypothetical question … put simply, what people say is different from what they do.” Countering this skepticism is a tremendous body of literature that has emerged in recent decades supporting the view that “contingent valuation done appropriately can provide a reliable basis for gauging what the public is willing to trade off to obtain well-defined public goods” (Carson Reference Carson2012, p. 40) and that contingent valuation surveys “can produce estimates reliable enough to be the starting point of a judicial process of damage assessment” (Arrow et al. Reference Arrow, Solow, Portney, Leamer, Radner and Schuman1993, p. 4610).
Whereas the other papers presented at this conference are likely to be technical and focused on specific policies and empirical tests of theory, my objective in this presentation is to “sell” an idea by drawing from a broad literature. I present a group of parallel anomalous behaviors that have been observed in contingent valuation responses and actual choice settings and argue that stated preferences should be evaluated for their consistency with actual choices rather than relying solely on predictions from rational choice theory. I acknowledge that this basic argument is not novel and, indeed, has been suggested over the years by a number of authors (e.g., Carson Reference Carson2007, Reference Carson2012, Kling, Phaneuf, and Zhao Reference Kling, Phaneuf and Zhao2012, Haab et al. Reference Haab, Interis, Petrolia and Whitehead2013). Those previous efforts have tended to focus on a limited set of parallel anomalies (usually one) or the most prominent anomalies, which I refer to as “the Big Three.” I propose that there is enough accumulated evidence to infer that such parallel behaviors prevail more broadly and that it is useful to systematically present the breadth of this phenomenon as a means to assess the validity of stated preferences. Rather than reactively addressing the anomalies one by one as “problems” with stated preferences, as has often been done in the past, I believe that the evidence that similar behaviors arise in stated-preference, experimental-laboratory, and real-choice settings should be viewed as a strength of stated-preference methods such as contingent valuation and provide the basis for a productive research agenda.
Validity Concepts in Stated Preferences
A conundrum arises with respect to testing the validity of stated-preference methods such as contingent valuation. As noted by Bishop (Reference Bishop, Champ, Boyle and Brown2003, p. 539–540), “true economic values are unobservable … Economists and other social scientists cannot see into people's heads” so it is impossible to assess the validity of stated preferences against “true” underlying preferences. Other means of validity assessment must be applied. At least since Mitchell and Carson's seminal book, Using Surveys to Value Public Goods: The Contingent Valuation Method (Reference Mitchell and Carson1989), a widespread approach to assessing the validity of stated preferences has been to extend the criterion, convergent, and construct validity concepts used in psychometrics. Paraphrasing Table 1 in Kling, Phaneuf, and Zhao (Reference Kling, Phaneuf and Zhao2012), criterion validity asks whether the measure relates well with another measure that is considered a legitimate criterion. In contingent valuation, this has translated into whether the estimate generated by a stated-preference method is the same as the willingness-to-pay value that would be generated if real payment is made. Convergent validity asks whether the stated-preference measure correlates well with willingness-to-pay values estimated using a revealed-preference method such as travel costs. Construct validity assesses whether the measure correlates well with expectations predicted by theory. For example, one would expect that willingness to pay for an environmental good would increase with income, use of the good, and the magnitude of the change in provision of the good.
Conventionally, validity assessments that used this framework of criterion, convergent, and construct validity attended to the validity concepts independently. However, with the advent of behavioral economics as a challenge to neoclassical economic theory, it became apparent that there could be an inherent conflict between the criterion and construct validity concepts. Criterion validity tests stated preferences against how people actually value things while construct validity tests against a normative theory of ideal valuation. Conflict arises between the two tests if actual behavior does not correspond to theoretically predicted behavior, which has often been the case for behavioral economic observations of actual behavior versus predictions from neoclassical economic theory. This is the conflict that is of interest here. As Randall (Reference Randall1998, p. 202) wrote, stated-preference responses should be evaluated for consistency with actual choices rather than with theoretical predictions of “ideal individual behavior or of ideal values.” My purpose here is to identify a select set of examples in which so-called behavioral anomalies—observed choices that do not comport with standard microeconomic rational-choice theory—are demonstrated in both stated preferences and actual choices.
My presentation of these parallel anomalies is divided into two parts. The first addresses what I refer to as “the Big Three” anomalies: (i) disparity of willingness to accept (WTA) compensation and willingness to pay (WTP) for an equivalent change in the level of a public good, (ii) reversals of preference and elicitation effects, and (iii) embedding and the incremental adding-up test. My strategy is to devote some time to these three anomalies to ground my “sales pitch” in a body of visible and much-vetted literature and to, at points, interject my own perspective. While my presentation of this historical context mirrors previous discussions in the literature (e.g., Carson Reference Carson2007, Haab et al. Reference Haab, Interis, Petrolia and Whitehead2013), it also provides a helpful foundation for my thesis. I then turn to four lesser-known parallel anomalies that I and others have investigated in recent years. Two of these, ordering effects and pure altruism, arose first in contingent valuation and then were demonstrated in actual choices. The other two, decoy effects and social-norm nudges, originated in studies of actual choice settings and then were replicated in stated-preference settings. Due to space constraints, I characterize the main themes for these lesser-known anomalies rather than exhaustively explore each of them.
The “Big Three” Parallel Anomalies
The WTA-WTP Disparity
The empirical disparity between WTA and WTP provides an appropriate starting point because it is emblematic of the thesis of parallelism between contingent values and actual choices as well as the tendency of some economists to dismiss stated-preference methods because their results do not comport well with neoclassical economic theory. In introducing his “skeptical” assessment that “answers to contingent valuation surveys do not actually reflect stable or well-defined preferences,” Hausman (Reference Hausman2012, p. 46) succinctly sets up the issue:
Contingent valuation questions can be phrased in two broad ways: the willingness-to-pay approach seeks to discern what the respondent would pay to avoid a negative outcome (or to achieve a positive outcome), while the willingness-to-accept approach seeks to discern how large a payment the respondent would need to receive in order to accept the negative outcome (or not to receive a positive outcome). Basic economic theory suggests that these two approaches should give (approximately) the same answer, but both supporters and skeptics of contingent value methods recognize that large and persistent disparities commonly arise in answers to contingent valuation surveys.
Recognition of disparity between these two measures of welfare change arose in the 1970s with early research of contingent valuations using surveys. Applying what was then referred to as the Davis (Reference Davis1963) method of directly measuring consumers' surplus, Brown and Hammack (Reference Brown and Hammack1973) and Hammack and Brown (Reference Hammack and Brown1974) sent a questionnaire to nearly 5,000 individuals who had hunted in the Pacific Flyway in 1967. This effort produced 2,455 usable responses for a response rate of 50 percent. The survey set up an “entirely fictitious situation” (Hammack and Brown Reference Hammack and Brown1974, p. 91) and hence violated the current concept of consequentiality (see footnote 1). Two valuation questions were presented to each participant. First, the hunters were asked to indicate on a payment ladder the “smallest amount you think you would take to give up your right to hunt waterfowl for a season” with values on the ladder ranging from zero to “Over $1,000.” Respondents who answered “Over $1,000” were prompted to write in a value. That WTA question was followed by questions regarding their actual total cost expended for waterfowl hunting in the previous season and the follow-up WTP question: “About how much greater do you think your costs would have had to have been before you would have decided not to have gone hunting at all during that season?” A payment ladder identical to the one used for the WTA question was used to elicit their WTP values. After eliminating protest responses and extreme outliers (e.g., $1 million), they found mean WTA and WTP values of $1,044 and $247 respectively.
The disparate WTA and WTP values in Brown and Hammack (Reference Brown and Hammack1973) and Hammack and Brown (Reference Hammack and Brown1974) were initially met with skepticism from resource and environmental economists. Referring to expectations stemming from Willig's (Reference Willig1976) demonstration that WTP and WTA should be proximate for normal private goods and Randall and Stoll's (Reference Randall and Stoll1980) extension of those arguments to public goods, many blamed the observed deviation on use of stated-preference survey instruments. Dwyer and Bowes (Reference Dwyer and Bowes1978, p. 1009) argued that “the precise explanation for the wide difference is not yet known, but weakness in the survey instruments seems likely.” Brookshire et al. (Reference Brookshire, Randall and Stoll1980, p. 488) suggested that survey methods that attempt to measure WTA compensation “do not appear to collect reliable value data.” Simultaneously, early studies that used contingent valuation continued to demonstrate wide disparities (e.g., Rowe, d'Arge, and Brookshire Reference Rowe, d'Arge and Brookshire1980, Heberlein and Bishop Reference Heberlein and Bishop1986).
Contemporaneously and apparently in isolation from efforts employing contingent valuation, the WTA-WTP disparity for private goods and risks was a cornerstone of initial forays into behavioral economics (e.g., Thaler Reference Thaler1980) and prospect theory (Kahneman and Tversky Reference Kahneman and Tversky1979). In an article providing evidence from economics experiments of an “unexpected disparity” between WTP and WTA, Knetsch and Sinden (Reference Knetsch and Sinden1984) brought the two lineages together. In describing the motivation for their research, they referenced the above mentioned findings for contingent valuation and arguments that the unexpected observed disparity was due to application of hypothetical surveys. They then reported on a series of simple, real-money experiments in which subjects made choices between small-value goods (so that any income effect would be minimized), including one involving buying and selling a lottery ticket (Knetsch and Sinden Reference Knetsch and Sinden1984, p. 510):
One half of the participants … were asked to pay $2 to keep their ticket in the drawing for the prize. They had the option of paying if they thought that this opportunity was worth $2 to them, or refusing to pay if they felt it was worth less than $2 to them. Credit was arranged for those short of cash but desiring to pay. … The other half of the participants were allowed to take part in the raffle without any cost (that is, free) but they were each offered $2 to forego their chance, that is, to give up their entitlement.
Exactly half of the respondents in the purchase setting bought the ticket for $2. Given the random distribution of buyer and seller assignments and the assumption of a random distribution of tastes, the percentage of people willing to sell their tickets for $2 should also have been 50 percent if there was no WTA-WTP disparity. That was not the case. In the selling treatment, 76 percent of the participants refused to sell the ticket for $2. After demonstrating this asymmetry in actual choice settings, the authors related their evidence back to the endowment effect proposed in Thaler (Reference Thaler1980) in which a good is ascribed increased value when it becomes part of an individual's endowment (see also Kahneman, Knetsch, and Thaler Reference Kahneman, Knetsch and Thaler1991) and suggested that their results provided a “substantial empirical basis” for loss aversion, i.e., “the common observation that a loss has a greater subjective effect than an equivalent gain” (Knetsch and Sinden (Reference Knetsch and Sinden1984, p. 516), citing Kahneman and Tversky (Reference Kahneman and Tversky1982, p. 166)).
In subsequent decades, literally hundreds of studies on the WTA-WTP gap were conducted using a wide range of goods, including lotteries, ordinary private goods, health and safety, and public and nonmarket goods. Those studies demonstrated a large average WTA-WTP ratio of 7.17 (median 2.60, N = 201) across all goods (Horowitz and McConnell Reference Horowitz and McConnell2002) and provided fodder for meta-analyses (Horowitz and McConnell Reference Horowitz and McConnell2002, Sayman and Öncüler Reference Sayman and Öncüler2005, Tunçel and Hammitt Reference Tunçel and Hammitt2014). Horowitz and McConnell (Reference Horowitz and McConnell2002, p. 426) summarized this body of literature as showing that “usually WTA is substantially higher than WTP, and almost all [authors] have remarked that the WTA/WTP ratio is much higher than their economic intuition would predict.” One particularly relevant highlight from this literature is that a meta-analysis of the WTA-WTP ratios reported in more than 200 studies determined that the equality of ratios for real goods and “hypothetical” choices could not be rejected (Horowitz and McConnell Reference Horowitz and McConnell2002). The results from Tunçel and Hammitt (Reference Tunçel and Hammitt2014) were somewhat more equivocal.Footnote 2 Nevertheless, a key finding is that the WTA-WTP gap persists in stated preferences and actual choices.
A range of explanations for persistence of the WTA-WTP disparity has been proposed, including explanations from neoclassical economic theory (Hanemann Reference Hanemann1991), psychological perspectives on losses versus gains (Tversky and Kahneman Reference Tversky and Kahneman1981), uncertainty in preferences (DuBourg, Jones-Lee, and Loomes Reference DuBourg, Jones-Lee and Loomes1994), and costly information (Kolstad and Guzman Reference Kolstad and Guzman1999) in dynamic settings (Zhao and Kling Reference Zhao and Kling2001). No single argument has surfaced as a dominant explanation, and my sense is that the observed and largely persistent disparity is driven by a number of factors.
Preference Reversals and Elicitation Effects
Research into the parallel anomalies of preference reversal in behavioral economics and elicitation effects in contingent valuation followed a similar path. Each result was initially unexpected and discounted. Yet the anomalous findings persisted after further experimentation in the respective disciplines, which considered them separately. Subsequently, both anomalies were recognized as being related to violations of the principle of procedure invariance in measurement.
Procedure invariance is a basic foundation of rational choice theory. It requires that normatively equivalent procedures for assessing preferences should give rise to the same preference order. If A is preferred to B in a choice between the two, the selling price of A should exceed the selling price of B (Tversky, Sattath, and Slovic Reference Tversky, Sattath and Slovic1988, Tversky, Slovic, and Kahneman Reference Tversky, Slovic and Kahneman1990). Invariance holds for objective physical measures such as weight—if a balance shows that A is heavier than B, independent weighing of A and B should demonstrate the same—but is not always supported when it comes to measuring preferences.
Preference reversal, most commonly attributed to Lichtenstein and Slovic (Reference Lichtenstein and Slovic1971), originated in “multidimensional” lotteries that varied in payoffs and probabilities (Seidl Reference Seidl2002). Using hypothetical lotteries in a psychology laboratory setting and actual money choices made by patrons outside a casino, Lichtenstein and Slovic (Reference Lichtenstein and Slovic1971) found that participants violated procedure invariance for gambles that involved a high chance of winning a modest amount of money versus a small chance of winning a relatively large amount of money. When asked to choose between the two, the majority of the participants preferred the high chance of winning a modest amount while independently elicited selling prices for the two gambles showed that participants required a higher price to give up the low chance of a relatively large payoff.
Lichtenstein and Slovic's (Reference Lichtenstein and Slovic1971) results, which have been replicated in numerous experiments involving actual and hypothetical settings, were initially challenged by economists. However, in a high-profile experimental economic study of preference reversals that was designed to discredit the results of psychologists as applied to economics, Grether and Plott (Reference Grether and Plott1979, p. 634) were surprised by their results:
Needless to say, the results we obtained were not those we expected when we initiated this study. Our design controlled for all the economic-theoretic explanations for the phenomenon which we could find. The preference reversal phenomenon, which is inconsistent with the traditional statement of preference theory, remains.
The same results have been demonstrated in other contexts (e.g., Tversky, Slovic, and Kahneman Reference Tversky, Slovic and Kahneman1990, List Reference List2002), indicating that the “preference reversal phenomenon is an example of a general pattern rather than a peculiar characteristic of choice between bets” (Tversky and Thaler Reference Tversky and Thaler1990, p. 206).
A number of competing hypotheses have been offered to explain preference reversals without a dominant explanation emerging. They include the notions that preferences are constructed in the elicitation process such that different elicitation mechanisms invoke different decision heuristics for weighting attributes of multidimensional objects, broader issues of joint versus separate valuation, intransitivity of preferences, violations of expected utility, and incentive-compatibility of elicitation mechanisms used in experiments (Seidl Reference Seidl2002).
The parallel result in the literature on contingent valuation is the longstanding and persistent finding that the response format used to elicit the values systematically affects reported WTP (Boyle Reference Boyle, Champ, Boyle and Brown2003). Notably, a pattern has emerged that shows that dichotomous-choice values exceed values elicited through other formats such as payment cards and open-ended questions (Champ and Bishop Reference Champ and Bishop2006). For example, Welsh and Poe (Reference Welsh and Poe1998) found that dichotomous-choice contingent valuation elicitation methods provided an estimated value for improvements to hydrologic flows in the Grand Canyon of $91 while payment cards and open-ended questions led to much lower values of $46 and $32 respectively. Such results have been used to dismiss contingent valuation as a means of eliciting public goods. McFadden and Leonard (Reference McFadden, Leonard and Hausman1993, p. 166) wrote that “If contingent valuation is valid, the open-ended [state your WTP] and close-ended [yes or no to a given dollar amount] [formats] should give comparable distributions of stated WTP.” They concluded (Reference McFadden, Leonard and Hausman1993, p. 191) that “the contingent valuation methods now in common use give a mutually inconsistent distribution of WTP.” It is interesting to note, however, that this may be a broader problem associated with valuing public goods rather than a problem specific to stated preferences. Champ and Bishop (Reference Champ and Bishop2006) elicited actual donations to a public good (WTP for wind-generated electricity) using dichotomous-choice and payment-card formats and found, like Welsh and Poe (Reference Welsh and Poe1998), that actual donations elicited using the dichotomous-choice format were significantly higher than those obtained using payment cards (a mean of $86 versus $36).
For much of their co-existence, preference reversals and elicitation effects have been treated as distinct phenomena. Irwin et al. (Reference Irwin, Slovic, Lichtenstein and McClelland1993) bridged this gap by exploring preference reversals in stated preferences for public goods. They demonstrated that procedure invariance does not hold in choices between environmental and nonenvironmental commodities. They expected that consumer goods would be preferred to environmental goods when WTP values were elicited for the goods separately. However, they argued that environmental goods would be preferred over consumer goods when consumers were asked to compare the two. Those expectations generally were borne out in between-subject and within-subject tests, which the authors linked to differences between traditional open-ended valuation methods and dichotomous-choice contingent valuation methods. Recognition of the parallel natures of preference reversals and elicitation effects was further highlighted in List (Reference List2002).
Embedding and the Adding-up Test
In an influential and controversial study, Kahneman and Knetsch (Reference Kahneman and Knetsch1992) brought attention to a response pattern in contingent valuation research they called the embedding effect, also referred to in the literature as a part-whole effect, which occurs when “the same good is assigned a lower value if WTP for it is inferred from WTP for a more inclusive good rather than if the particular good is evaluated on its own” (p. 58). The authors demonstrated this effect using a split-sample contingent valuation survey. For one sample, they first elicited a value for a comprehensive good they called “environmental services.” They then asked respondents to indicate how much of their value for “environmental services” could be attributed to a subset good called “improve disaster preparedness.” Finally, the same respondents were asked how much of their value for “improving disaster preparedness” could be attributed to a further subset called “improve rescue equipment, personnel.” Since each of the latter goods is a proper subset of the previous good valued, I hereafter refer to them as large (L), medium (M), and small (S), respectively (L ⊃ M ⊃ S). A second subsample of respondents was asked to value M and then S, and a third valued S only. In this study, the average valuation of S was significantly lower when it was presented third relative to being presented second or alone; the central measures varied by a factor of 8 to 16. This result led the authors to conclude that values obtained by the widely used contingent valuation method were “arbitrary and consequentially useless” (Kahneman and Knetsch Reference Kahneman and Knetsch1992, p. 68).
To formally evaluate this phenomenon's consistency with or departure from economic theory, Diamond et al. (Reference Diamond, Hausman, Leonard, Denning and Hausman1993) and Diamond (Reference Diamond1996) formulated the embedding problem as an incremental adding-up test: WTP for good A plus WTP for good B once the consumer has paid for and obtained good A, when valued separately, is equal to WTP for the two goods combined. They demonstrated the structure of this test and provided the following analogy.
Consider asking one group of people how much they are willing to pay for a cup of coffee. Ask a second group how much they would be willing to pay just for a doughnut if they had already been given a cup of coffee. Ask a third group how much they would be willing to pay for a cup of coffee and a doughnut. The value obtained from the third group should be equal to the sum of the values obtained from the first two groups if the answers people give reflect underlying economic preferences. (Diamond et al. Reference Diamond, Hausman, Leonard, Denning and Hausman1993, p. 46)
The incremental adding-up test remains central to ongoing debate over the validity of contingent valuation. As an example, Hausman (Reference Hausman2012, p. 48) wrote: “My view is that until contingent valuation surveys can reliably pass the [incremental] adding-up test … to demonstrate that embedding is not present, the results do not indicate stable or coherent individual preferences.”
Only a few contingent valuation applications have allowed assessment of the incremental adding-up test. To some extent, this shortage can be attributed to the complexities of employing such a test in the field. Two studies to date have allowed for proper statistical evaluations (according to Desvousges, Mathews, and Train Reference Desvousges, Mathews and Train2015). The first, by Diamond et al. (Reference Diamond, Hausman, Leonard, Denning and Hausman1993), failed to reject incremental adding-up in a two-increment test (A + B) but rejected it in a three-increment test (A + B + C). More recently, a study by Desvousges, Mathews, and Train (Reference Desvousges, Mathews and Train2015) rejected the incremental adding-up test using a four-increment test (A + B + C + D). Thus, the results regarding adding-up tests are mixed when applied in a stated-preference setting.
Particularly noteworthy from the perspective of my thesis is Bateman et al. (Reference Bateman, Munro, Rhodes, Starmer and Sugden1997), which applied the incremental adding-up test to private goods using an incentive-compatible Becker-DeGroot-Marschak (BDM) elicitation mechanism. Interestingly, this application of a laboratory economic experiment paralleled Diamond et al.'s (Reference Diamond, Hausman, Leonard, Denning and Hausman1993) analogy, substituting pizza for the doughnut and coffee and dessert at a local restaurant for the coffee. In this carefully constructed study, the incremental adding-up test was rejected in three of the four tests conducted.
To me, Bateman et al.'s (Reference Bateman, Munro, Rhodes, Starmer and Sugden1997) results are especially important. Rejection of the incremental adding-up test in a private-good incentive-compatible setting suggests, as noted by Bateman et al. (Reference Bateman, Munro, Rhodes, Starmer and Sugden1997, p. 331) in their concluding sentences, that the “phenomenon may not be attributable simply to problems with the contingent valuation method … Instead, it may be a symptom of some fundamental property of individuals' preferences which conventional theory does not allow.”
Four Lesser-known Parallel Anomalies
Having established the foundation for parallel anomalies for some widely investigated phenomena in studies of actual and stated preferences, I now jump ahead many years and turn my attention to four lesser-known sets of parallel anomalies that I have investigated with a number of colleagues in recent years.
Ordering Effects
Sequencing and ordering effects are some of the earliest “anomalies” observed in contingent valuation responses (e.g., Brookshire et al. Reference Brookshire, d'Arge, Schulze, Thayer and Smith1981). Both relate to the repeated finding that the order in which goods are presented to respondents affects the values ascribed to each good. Sequencing pertains to inclusive lists in which goods are presented as additions to (or subtractions from) goods previously presented in the list, such as the list format used in Kahneman and Knetsch (Reference Kahneman and Knetsch1992). In such cases, economic theory indicates that the question order can affect incremental values because income, the level of private and public goods available, and consumers' utility change over the course of the valuation exercise, introducing substitution and income effects. Ordering effects pertain to exclusive lists in which goods are presented as alternatives to any other goods presented on the list. In that case, the level of income, private and public goods, and status-quo utility are held constant throughout the valuation exercise. According to rational choice theory, the order in which goods are presented for valuation should have no effect on their values as long as the exclusive valuation tasks are seen as independent.
In Bateman et al. (Reference Bateman, Cole, Cooper, Georgiou, Hadley and Poe2004), we set out to systematically explore ordering effects in a controlled contingent valuation exercise in which we surveyed students at University of East Anglia in England regarding improvements to an open-access lake located on the campus grounds. Three nested improvements, referred to here as small (S), medium (M), and large (L), were considered: S was nested in (was a subset of) M, which was nested in L. Roughly one-half of the sample (N = 34) received a top-down presentation (L→M→S) and the other half (N = 36) received a bottom-up presentation (S→M→L) of the improvements. An exclusive-list format was used throughout. Due to space constraints, I limit the discussion to comparing values for S and L in the top-down (TD) and bottom-up (BU) orderings.
Figure 1 presents the mean value estimates and corresponding standard errors for S and L in both orderings. The difference of mean, difference of median, and multivariate analysis statistical tests (multivariate random-effects Tobit panel data) reject the null hypothesis that WTP BU (S) = WTP TD (S). However, application of the tests to the null hypothesis WTP BU (L) = WTP TD (L) resulted in rejection only in the multivariate analysis. Therefore, the typical finding from previous sequencing and ordering studies was maintained: the small good was valued more highly when presented first than when it followed presentation of a more-comprehensive bundle. The results for the large good were more equivocal. The data presented in Figure 1 were collected using an open-ended question regarding WTP for a coercive tax in a controlled setting on campus, but Bateman et al. (Reference Bateman, Cole, Cooper, Georgiou, Hadley and Poe2004) reported similar results from a field study that used a double-bounded dichotomous-choice format.
Top-down and Bottom-up Ordering Effects on Willingness to Pay for Small and Large Improvements to an Open-access Lake in England

Clark and Friesen (Reference Clark and Friesen2008) extended Bateman et al.'s (Reference Bateman, Cole, Cooper, Georgiou, Hadley and Poe2004) study of ordering effects to familiar private goods using an incentive-compatible BDM mechanism in a controlled laboratory experimental economics setting. They chose familiar goods based on the assumption that, unlike preferences for public goods, preferences for familiar goods would be relatively “stable, well-defined, consistent, and context independent” (Clark and Friesen Reference Clark and Friesen2008, p. 197) and therefore less subject to error associated with inexperience with the good in question. In this study, the small good (S) was a ten-box pack of 200-milliliter Minute-Maid-brand orange juice drinks. The large good (L) was a bundle of S and other goods, consisting of a set of gel ink pens, white-out correction tape, and a disposable 35-millimeter camera. As such, S was a proper subset of L. As in Bateman et al. (Reference Bateman, Cole, Cooper, Georgiou, Hadley and Poe2004), a medium good (good L without the camera) was also valued but is not discussed here.
For the most part, Clark and Friesen's (Reference Clark and Friesen2008) results for familiar goods paralleled those of Bateman et al. (Reference Bateman, Cole, Cooper, Georgiou, Hadley and Poe2004). WTP for S was significantly larger when it was valued first in a sequence of nested goods (mean WTP BU (S) = $2.40 (Canadian dollars), standard deviation = 0.356) than when it was valued after more-inclusive goods (WTP TD (S) = $1.67 (0.172)) using the difference of means, difference of medians, and multivariate analysis. Also as in Bateman et al. (Reference Bateman, Cole, Cooper, Georgiou, Hadley and Poe2004), the null hypothesis WTP BU (L) = WTP TD(L) could not be rejected using difference of mean or median tests but was rejected using multivariate analyses (a random-effects Tobit panel-data model). However, in contrast to the results of Bateman et al. (Reference Bateman, Cole, Cooper, Georgiou, Hadley and Poe2004) depicted in Figure 1, the value of L was greater when it was presented last: WTP BU (L) = $7.01 (0.753) versus WTP TD (L) = $6.07 (0.581). Based on their results, Clark and Friesen (Reference Clark and Friesen2008, p. 204) suggested that order effects were not limited to contingent valuation applications and rather could be “a more general preference anomaly to which people are prone.”
Pure Altruism
A common assertion that has been supported to some extent by empirical evidence (e.g., Holmes Reference Holmes1990, Shabman and Stephenson Reference Shabman and Stephenson1994, Ojea and Loureiro Reference Ojea and Loureiro2007) is that altruistic motives—a preference for the utility of some other people—elevate WTP for public safety and environmental improvements. For example, McConnell (Reference McConnell1997) reported the results of a split-sample survey that showed that 76.1 percent of the respondents were willing to pay a tax to support a program for harbor porpoises if the porpoises could be seen; their WTP dropped significantly, to 67.7 percent, when they were informed that the porpoises were rarely if ever seen. McConnell (Reference McConnell1997, p. 24) interpreted the 7 percent decline in positive votes as “consistent with altruism as a motive … some proportion of respondents is altruistic, choosing not to pay to help protect the harbor porpoise when others do not see it and hence do not gain from its protection.”
Building on theoretical arguments by Bergstrom (Reference Bergstrom and Jones-Lee1982), Jones-Lee (Reference Jones-Lee1991, Reference Jones-Lee1992), and Milgrom (Reference Milgrom and Hausman1993), Johannesson, Johansson, and O'Conor (Reference Johannesson, Johansson and O'Conor1996, p. 264) raised the counter-possibility that, ceteris paribus, pure altruismFootnote 3 can lower an individual's WTP for a public program in a coercive tax setting:
His total WTP for a uniform public risk reduction of the same magnitude will fall short of $t if he believes that others are willing to pay less than $t but will still be forced to pay that amount ($t) for the project. This is because those other individuals, for whom he cares, will then experience a lower utility if the program is implemented. In turn, this decrease in the utility of others reduces the pure altruist's WTP for the public safety project. To our knowledge, this fact has been overlooked by previous authors within the field.
Messer, Poe, and Schulze (Reference Messer, Poe and Schulze2013) referred to this as the Johannesson et al. conjecture. Technically, one could argue that this conjecture does not fully comply with the definition of an economic anomaly—“a fact or observation that is inconsistent with [economic] theory” (Thaler Reference Thaler1992, p. 2)—since its prediction derives from a formal economic model of individual-choice other-regarding preferences. But such reasoning does not comport with the portrayal of a rational, narrowly self-interested economic person (i.e., homo economicus) in which motives do not matter, and thus it is considered anomalous for the purposes of this presentation.
Johannesson, Johansson, and O'Conor (Reference Johannesson, Johansson and O'Conor1996) provided “rough” (their term) empirical support for the preceding conjecture by following a dichotomous choice-valuation question regarding a public risk-reduction program with a question about whether respondents believed they were willing to pay more or less for the risk-reduction program than the average car owner. They did not incorporate the responses into the econometric modeling of the dichotomous-choice response function; instead, they used the average response to this question to motivate a discussion of why contingent values for a public safety program might fall below values for a private safety program that provided an equal reduction in risk (Johannesson, Johansson, and O'Conor Reference Johannesson, Johansson and O'Conor1996, p. 273):
Of our respondents, 33 percent (24 percent) believed that their own WTP exceeds (falls short of) the average WTP for the public safety measure, while 43 percent believed that their WTP is about the same as the average WTP. Thus there is a tendency to overestimate one's own WTP relative to the WTP of others. This tendency should, ceteris paribus, cause the average WTP for the public safety program to fall short of the average WTP for the private safety device if respondents are true altruists.
They offered this conjecture to rationalize their finding that average WTP for a private safety device was higher than average WTP for a public program that provided an equivalent reduction in risk for others. The results of earlier studies that demonstrated a similar pattern for private and public risk-reduction programs were attributed to free-riding in the public program (e.g., Jones-Lee, Hammerton, and Philips Reference Jones-Lee, Hammerton and Philips1985).
In Messer et al. (Reference Messer, Poe, Rondeau, Schulze and Vossler2010), we sought to test the Johannesson et al. conjecture using experimental economic techniques. We developed a random-price voting mechanism that was amenable to a coercive tax setting—essentially, a public majority-rule version of the private-good BDM mechanism. As in the BDM, our voting mechanism exhibited the parallel attributes of being theoretically incentive-compatible and empirically demand-revealing. Individuals indicated the highest uniform tax (bid) at which they would vote for a public good, which represented their maximum WTP in a coercive tax setting. The actual coercive tax to be imposed was drawn from a known distribution. If a majority of the participants indicated willingness to bid equal to or higher than the randomly drawn tax, the public good was provided and the tax was collected from all individuals. Otherwise, the public good was not provided and the individuals paid nothing. The distribution of the induced values was common knowledge. Because the experiment involved only monetary payoffs, there was no opportunity for paternalistic altruism. Hence, the observed effects could be attributed to pure altruism, which was the focus of the Johannesson et al. conjecture.
Our random-price voting experiments were conducted in groups of three individuals, and we allowed the induced payoffs to be either homogeneous (e.g., payoffs of $5 for each individual) or heterogeneous (payoffs of $2, $5, and $8) for the voting groups. The results for gains in WTP, which are shown in Figure 2, empirically support the Johannesson et al. conjecture, and similar results were found under the other three treatments considered: WTA losses, WTP to avoid losses, and WTA not experiencing gains. In the figure, perfect demand revelation is represented by the dotted line that equates the induced values to the average monetary bids. Values above (below) the line indicate bids that exceeded (fell short of) the induced value.
Induced Values and Average Bids for Individual i and Other Individuals (j and k) for the Homogeneous and Heterogeneous Treatments
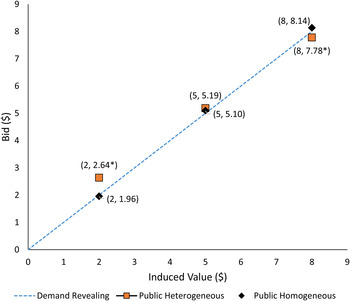
In the three homogeneous settings—(2, 2, 2), (5, 5, 5), and (8, 8, 8) (the first entry in each triplet of values is the induced value of the respondent and the last two are the induced values for the other members in the respondent's group)—in which all individuals in the voting group received the same payoff, the mean values were not significantly different from the induced values, as would be expected in a pure altruistic setting. For example, the average bid for individuals in the high-value homogeneous setting (8, 8, 8) was $8.14, which was not significantly different from $8.00. It is important to note that bids in a single-voter setting (analogous to the private BDM) also were not significantly different from the induced values, as noted in other studies (e.g., Irwin et al. Reference Irwin, McClelland, McKee, Schulze and Norden1998).
In contrast, the pattern of bids we found for the heterogeneous setting supported the Johannesson et al. conjecture that pure altruism affects stated WTP in predictable ways. The high-value and low-value bidders in heterogeneous treatments tended to bid differently than those in comparable homogeneous treatments. Specifically, in a manner consistent with not wanting to impose net costs on other less-fortunate members of the group, subjects with induced values of $8.00 in the heterogeneous setting (8, 2, 5) entered an average bid of $7.78, which is significantly lower than the average bid of $8.14 in the homogeneous setting. At the other extreme, subjects who had the low induced value of $2.00 in the same heterogeneous group (2, 5, 8) significantly overbid ($2.64) relative to their peers in the homogeneous setting in a manner consistent with pure altruism. In essence, they “took one for the team” by bidding more than their induced values. The behavior of the middle-value voters was not strongly affected by variation in the payoff vector. For symmetric payoffs (i.e., 8 – 5 = 3 = 5 – 2) such as those depicted in Figure 2, the mean bids were not significantly different from the $5.00 induced value.
Asymmetric Dominance
In Bateman, Munro, and Poe (Reference Bateman, Munro and Poe2008), we reversed direction. Instead of exploring whether supposed anomalous behaviors observed in stated preferences could be replicated in actual choices, we examined whether “a particular choice set phenomenon widely demonstrated in the market and psychological literature and borne out in experimental economic settings and real market observations carries over to hypothetical nonmarket valuation and public goods settings” (Bateman, Munro, and Poe Reference Bateman, Munro and Poe2008, p. 115). Our vehicle for the study was the concept of asymmetric dominance, which is a subset of the broader category of decoy effects.
Rational theories of choice posit that preferences for two options should not depend on the presence or absence of a third option. That is, if a person chooses c (the competitor) when presented with a binary choice set B = {c,t}, t (the target) cannot be chosen in an expanded choice set E = {c,t,d}. For individual choices, this principle has been referred to as expansion consistency (Sen Reference Sen1982); for aggregated choices made by groups, it is referred to as the regularity condition (Huber, Payne, and Puto Reference Huber, Payne and Puto1982). A “decoy effect” is associated with d when c is chosen in the binary setting and t is chosen from the expanded choice set. This can be viewed as a violation of procedure invariance. Studies have documented the existence of decoy effects in a range of decision-making contexts, including hypothetical and actual human choice settings (Simonson and Tversky Reference Simonson and Tversky1992) and for mating calls and sexual selection by frogs (Lea and Ryan Reference Lea and Ryan2015). Collectively, this body of research demonstrates that choices can be based on comparative, context-dependent criteria rather than on independent valuations of the options. Moreover, this choice phenomenon does not appear to be limited to humans. We may be hard-wired to make relative rather than absolute valuations.
Asymmetric dominance is a special case of the decoy effect. Assume that a choice set initially consists of two goods, c and t, with good c having less of attribute 1 than good t but more of attribute 2. Assuming heterogeneous Lancasterian-type preferences over the attributes, some individuals faced with the binary choice set B = {c,t} will choose good c while others will choose good t. Now introduce a third decoy good, d, that is asymmetrically dominated by t. That is, d is inferior to t for both attributes but has more of attribute 1 and less of attribute 2 than good c. When presented with an expanded choice set E = {c,t,d}, none of the individuals should choose d because they could do better by choosing t. Note that, to conform with expansion consistency, the addition of good d to the choice set should not influence an individual's choice between c and t (i.e., d is an irrelevant alternative in the choice between c and t). However, contrary to these theoretical expectations, numerous studies of a variety of choice settings, including real market purchases (Doyle et al. Reference Doyle, O'Connor, Reynolds and Bottomley1999), political candidates (O'Curry and Pitts Reference O'Curry and Pitts1995), job candidates (Highhouse Reference Highhouse1996), policy issues (Herne Reference Herne1997), and foraging activities by birds and bees (Shafir, Waite, and Smith Reference Shafir, Waite and Smith2002), have demonstrated that inclusion of an asymmetrically dominated good in a choice set systematically affects preferences for c and t. Specifically, when a third, asymmetrically dominated good is introduced into a binary choice set, preferences shift in favor of t.
As an example of the effect of introducing an asymmetrically dominated good into a binary choice set, Simonson and Tversky (Reference Simonson and Tversky1992) conducted a choice study using actual pens and cash. Subjects were asked to choose between $6 and a pen. In the binary choice set, the pen was an elegant Cross brand. The expanded choice set added a lesser-known brand of pen selected specifically for its unattractiveness. In the binary choice setting, the Cross pen was chosen 36 percent of the time. In the expanded choice setting that included the “inferior” pen, 46 percent chose the Cross pen instead of money, a statistically significant increase. Only 2 percent of the respondents chose the other pen. Overall, Simonson and Tversky (Reference Simonson and Tversky1992, p. 287) concluded that the “tendency to pay cash for a good can be increased by the introduction of an inferior alternative.”
In a contingent valuation field study of open-access lakes (called broads) in Norfolk, England, we explored whether Simonson and Tversky's (Reference Simonson and Tversky1992) results extended to stated preferences for public environmental goods (Bateman, Munro, and Poe Reference Bateman, Munro and Poe2008). In an in-person, on-site survey, visitors to Ranforth Broad were presented with several measures aimed at improving visitors' experiences. Each option consisted of two attributes that would be improved relative to present levels to different extents: attribute 1 related to the population of birds found at the broad measured in number of birds and attribute 2 related to an increase in plant cover at the lake measured in a percentage increase in area over the current level. A split-sample approach was used to explore asymmetric dominance effects in the choice sets: B = {c,t} and E = {c,t,d}. Under option c, the broad would support 100 additional birds and a 30 percent increase in plant coverage (represented by c = (100, 30)). Option t (150, 20) offered a relatively greater increase in the bird population and a smaller increase in plant cover. The decoy, d = (140, 15), was asymmetrically dominated; it was inferior to t in both attributes and was superior in attribute 1 and inferior in attribute 2 to c.
Under the binary choice set, 48 percent of respondents chose c and 52 percent chose t (N = 130). A separate group of respondents (N = 140) considered the expanded choice set, and in that case only 30 percent chose c and 70 percent chose t. Just one respondent (less than 1 percent) chose d. Obviously, the asymmetric dominance effect extended to stated preferences for public goods.
We further investigated whether inclusion of an asymmetrically dominated decoy affected WTP for the option that individuals indicated preferring. Because the respondents only specified a WTP value for their preferred option, we accounted for selection effects using an endogenous switching model. The results of this analysis supported Simonson and Tversky's (Reference Simonson and Tversky1992) finding for actual choices: addition of a decoy had a strong and significant upward effect on WTP for the target good, t. Thus, our results in the stated-preference setting paralleled actual behavior in a manner that is inconsistent with the rational economic theory of choice.
Nudges and Social Norms
The expansion of behavioral economics has led to the related concept of using “nudges” to influence people's behavior in ways that choosers agree would make them better off. Thaler and Sunstein (Reference Thaler and Sunstein2008, p. 5–6) described a nudge as “any aspect of the choice context that alters people's behavior in predictable ways without forbidding any options or changing their economic incentives.” They further added that nudges must be easy to implement, cheap to avoid, and not mandatory. A well-established nudge in economic studies is to use peer comparisons and social norms to induce conservation of privately purchased goods such as energy and household water supplies for which excess consumption leads to collective negative externalities. Using large-scale randomized experiments, several studies found that individuals respond systematically to information about their rates of consumption and degree of impact relative to a social norm. For example, in a randomized field experiment in Atlanta, Georgia, during a drought, Ferraro and Price (Reference Ferraro and Price2013) found that a message that compared a household's water consumption to consumption by other households in the county led to a decrease in water consumption by an amount equivalent to the decrease expected if the average price increased 12–15 percent.
Our exploration (Ho et al. Reference Ho, Taber, Poe and Bento2015) of parallel anomalies related to nudges applied such social-norm messages to household energy consumption. In particular, we sought to extend Costa and Kahn's (Reference Costa and Kahn2013) randomized field study of electricity users in California to determine whether anomalous effects arose in contingent valuation and laboratory experimental economic settings. Costa and Kahn's study was particularly intriguing; it not only demonstrated a notable effect of social-norm messaging on average energy consumption (a 2.1 percent decline on average) but also showed that, in response to the messaging, politically liberal individuals reduced their consumption of electricity more than politically conservative individuals. In other words, the responses to the social norm appeared to be systematically heterogeneous.
The broad objective of our contingent valuation survey (Ho et al. Reference Ho, Taber, Poe and Bento2015) was to gather information from participants that would allow us to calculate the carbon footprint of each respondent's household and then elicit each respondent's WTP for green electricity after receiving information about his or her carbon footprint and, in some treatments, the carbon footprint of another survey participant. The median estimated emission of carbon dioxide for the entire sample was 17.9 tons per household per year. The only emission information provided to subjects in the control group was their own carbon footprints. Subjects in the treatment groups were additionally informed that “Others like you who took this survey in the past had a carbon footprint of x tons per year” and whether their emissions were more or less than that amount. The x value represented the social norm and was randomly assigned as either high (26 tons) or low (11 tons). The contingent values for purchases of green electricity were elicited following the methods used in Champ and Bishop (Reference Champ and Bishop2006).
The results of this study identified a strong social-norm response. For each ton of carbon dioxide respondents were led to believe that they had exceeded emissions by others (i.e., “my footprint” minus x), purchases of green electricity increased by around 4 kilowatt hours. As in Costa and Kahn (Reference Costa and Kahn2013), self-identified democrats were more responsive to social-norm nudges than non-democrats. Because contingent valuations allow one to collect greater information about individual households relative to randomized field trials, we were able to identify any heterogeneity in responses to the social norm across numerous dimensions. We found such heterogeneity for the number of children in a household and the gender, age, income, education, and degree of environmentalism (as measured by scores on the New Environmental Paradigm scale) of the heads of households.
In a laboratory experiment in the same study (Ho et al. Reference Ho, Taber, Poe and Bento2015), we sought to replicate contingent valuation conditions in a nonenvironmental setting. The experiment consisted of two parts. First, groups of subjects purchased “private commodities” (analogous to consumption of energy in the environmental setting) that generated a negative public externality (analogous to carbon dioxide emissions) for the group. To introduce heterogeneity in consumption (and generation of negative external impacts), individuals were randomly assigned as having high, medium, or low demand for the private commodity. At the end of the first part of the experiment, which consisted of five rounds, the participants tallied their total consumption on a “passing sheet.” In the second part of the experiment, each subject was given another participant's passing sheet (no identification of the participant was provided) as the social-norm message. The participants then had an opportunity to contribute to a fund that would reduce the harm created by the negative externality (analogous to buying green electricity).
The results of our experiment were consistent with the results of the randomized field trial of Costa and Kahn (Reference Costa and Kahn2013) and our contingent valuation survey. Individuals who received a passing sheet reflecting lower total consumption than their own contributed significantly more to the public good in the second part of the experiment. Because the participants in the laboratory experiment came from a relatively homogeneous population (Cornell University students), we could not use this data to explore heterogeneity in response patterns across socio-demographic characteristics.
For me, this work on nudges and social-norm messaging provides the best framework for addressing future anomalies arising in actual- and stated-preference public-good research. Identification of similar patterns in actual choices made in field settings, real-money studies in experimental economics laboratory settings devoid of context, and contingent valuation surveys will lend validity to each method and reinforce the actuality of the anomalies.
Concluding Thoughts
I deliberately covered a lot of ground in this presentation to convey a sense of the extent to which choice anomalies in revealed and stated choice settings exhibit similar patterns. My hope is that the collection of parallel anomalies assembled here provides compelling evidence that stated preferences are, in fact, quite good at matching anomalous behavior in actual choices and vice versa. The parallelism demonstrated by this body of work indicates that stated-preference methods capture complex, if perhaps unexpected, elements of human decision-making that are also found in actual public and common-good settings and hence that stated preferences should not be discounted because the observed response patterns are not consistent with the rational choice theory. Instead, the anomalies should be accepted—indeed embraced—as possible reflections of actual choices and explored systematically in actual-choice and laboratory settings.


 Open access