


Introduction
Starting at the end of the blastula period (i.e. at ∼4.3–4.7 h post-fertilization; hpf), epiboly is the first of the large-scale coordinated morphogenetic cell movements that occur during the development of zebrafish (Danio rerio) embryos (Kimmel et al., Reference Kimmel, Ballard, Kimmel, Ullmann and Schilling1995; Solnica-Krezel, Reference Solnica-Krezel2006; Lepage and Bruce, Reference Lepage and Bruce2010; Bruce, Reference Bruce2016; Bruce and Heisenberg, Reference Bruce and Heisenberg2020). At this time, the embryo comprises a large yolk cell on the top of which (at the animal pole; AP), sits a mass of cells called the blastoderm. The blastoderm consists of a population of inner cells called the deep cells and an outer layer of enveloping cells along with a yolk syncytial layer (YSL; derived from marginal blastomeres that collapsed at ∼3 hpf) at the blastoderm/yolk cell margin (Dev Dasgupta and Singh, Reference Dev Dasgupta and Singh1981; Kimmel et al., Reference Kimmel, Ballard, Kimmel, Ullmann and Schilling1995). Epiboly starts when the yolk cell begins to dome internally into the blastoderm. This yolk cell doming movement pushes the deep cells radially outward. The YSL also domes and forms an internal YSL (I-YSL), which underlies the deep cells and an external YSL (E-YSL), which is located between the enveloping layer (EVL) cells and yolk cell (Kimmel et al., Reference Kimmel, Ballard, Kimmel, Ullmann and Schilling1995; D’Amico and Cooper, Reference D’Amico and Cooper2001; Sakaguchi et al., Reference Sakaguchi, Mizuno, Takeda and Solnica-Krezel2002; Carvalho and Heisenberg, Reference Carvalho and Heisenberg2010). The deep cells, EVL, and YSL all migrate over the yolk cell until they reach its equator. At this time (i.e. ∼50% epiboly), the epibolic movement of these cells pauses temporarily, while the lateral cells converge on the dorsal side of the embryo to form the embryonic shield (Montero et al., Reference Montero, Carvalho, Wilsch-Bräuninger, Kilian, Mustafa and Heisenberg2005). Following this coordinated cell movement, epiboly then resumes and continues towards the vegetal pole (VP) until the entire yolk cell is surrounded by cells (i.e. 100% epiboly; Kimmel et al., Reference Kimmel, Ballard, Kimmel, Ullmann and Schilling1995; D’Amico and Cooper, Reference D’Amico and Cooper2001; Sakaguchi et al., Reference Sakaguchi, Mizuno, Takeda and Solnica-Krezel2002; Carvalho and Heisenberg, Reference Carvalho and Heisenberg2010). Even though some of the earliest descriptions of epiboly in teleost fish were first published more than a century ago (Morgan, Reference Morgan1895), the precise mechanisms involved in (and the forces that drive) this process, are still not well understood. However, some of the components, including cytoskeletal elements (Strähle and Jesuthasan, Reference Strähle and Jesuthasan1993; Solnica-Krezel and Driever, Reference Solnica-Krezel and Driever1994; Cheng et al., Reference Cheng, Miller and Webb2004; Bonneau et al., Reference Bonneau, Popgeorgiev, Prudent and Gillet2011; Lee, Reference Lee2014; Fei et al., Reference Fei, Bae, Parent, Wan, Goodwin, Theisen, Tanentzapf and Bruce2019), scaffold proteins (Lambaerts et al., Reference Lambaerts, Van Dyck, Mortier, Ivarsson, Degeest, Luyten, Vermeiren, Peers, David and Zimmermann2012), transcription factors (Bruce et al., Reference Bruce, Howley, Dixon Fox and Ho2005; Lachnit et al., Reference Lachnit, Kur and Driever2008; Wilkins et al., Reference Wilkins, Yoong, Verkade, Mizoguchi, Plowman, Hancock, Kikuchi, Heath and Perkins2008), enzymes (Holloway et al., Reference Holloway, Gomez de la Torre Canny, Ye, Slusarski, Freisinger, Dosch, Chou, Wagner and Mullins2009) and various genes (Erter et al., Reference Erter, Solnica-Krezel and Wright1998; Bruce et al., Reference Bruce, Howley, Dixon Fox and Ho2005; Ebert et al., Reference Ebert, McAnelly, Srinivasan, Linker, Horne and Garrity2008; Hong et al., Reference Hong, Levin, Brown, Wan, Sherman, Huang, Lempicki and Feldman2010; Popgeorgiev et al., Reference Popgeorgiev, Bonneau, Ferri, Prudent, Thibaut and Gillet2011) that are (or suggested to be) involved, have now been identified. Whereas epiboly was first studied extensively in the Goldsinny wrasse (Ctenolabrus rupestris; Morgan, Reference Morgan1895) and Atlantic killifish (Fundulus heteroclitus; Trinkaus, Reference Trinkaus1951, Reference Trinkaus1984; Betchaku and Trinkaus, Reference Betchaku and Trinkaus1978, Reference Betchaku and Trinkaus1986; Keller and Trinkaus, Reference Keller and Trinkaus1987) the zebrafish is now one of the more popular fish models used to investigate this process (Strähle and Jesuthasan, Reference Strähle and Jesuthasan1993; Solnica-Krezel and Driever, Reference Solnica-Krezel and Driever1994; Solnica-Krezel et al., Reference Solnica-Krezel, Stemple, Mountcastle-Shah, Rangini, Neuhauss, Malicki, Schier, Stainier, Zwartkruis, Abdelilah and Driever1996; Kane et al., Reference Kane, Hammerschmidt, Mullins, Maischein, Brand, van Eeden, Furutani-Seiki, Granato, Haffter, Heisenberg, Jiang, Kelsh, Odenthal, Warga and Nüsslein-Volhard1996; Zalik et al., Reference Zalik, Lewandowski, Kam and Geiger1999; Kane and Adams, Reference Kane, Adams and Solnica-Krezel2002; Cheng et al., Reference Cheng, Miller and Webb2004; McFarland et al., Reference McFarland, Warga and Kane2005; Wilkins et al., Reference Wilkins, Yoong, Verkade, Mizoguchi, Plowman, Hancock, Kikuchi, Heath and Perkins2008; Bonneau et al., Reference Bonneau, Popgeorgiev, Prudent and Gillet2011; Li et al., Reference Li, Shao and Shi2017; Fei et al., Reference Fei, Bae, Parent, Wan, Goodwin, Theisen, Tanentzapf and Bruce2019; Rutherford et al., Reference Rutherford, Wong and Bruce2019).
We have previously reported that, during epiboly in zebrafish, three F-actin-based structures appear when the blastoderm migrates past the embryonic equator (Cheng et al., Reference Cheng, Miller and Webb2004). These include two ring-like F-actin structures that form at the deep cell and EVL margins of the blastoderm, and a punctate actin band that develops in the E-YSL. Treatment of embryos with the actin polymerization inhibitor, cytochalasin B, results in the disruption of all three F-actin structures and a slowing of the normal progression of epiboly (Cheng et al., Reference Cheng, Miller and Webb2004). We also showed by Nomarski differential interference contrast (DIC) microscopy that the surface of the E-YSL appears to be ‘highly folded’ during epiboly and that the punctate actin band is colocalized with a zone of endocytosis (Cheng et al., Reference Cheng, Miller and Webb2004), a process first suggested to play an important role in epiboly of the YSL in Fundulus embryos (Betchaku and Trinkaus, Reference Betchaku and Trinkaus1986). Here, we report our new findings on the effects of cytochalasin B on the actin-based structures and endocytosis in live embryos. In addition, to investigate the localization of actin in the E-YSL in greater detail, immunogold labelling in conjunction with transmission electron microscopy (TEM) was used. Furthermore, we present scanning electron microscopic (SEM) images of the surface of the E-YSL during epiboly in normally developing embryos and in those treated with cytochalasin B or the Ca2+ chelator, 5,5′-dibromo-BAPTA. Together, our data support the suggestion that actin-based endocytosis by microvilli-like protrusions in the surface membrane of the E-YSL plays an integral role in zebrafish epiboly, and that this process might in some way be regulated by Ca2+.
Materials and methods
Egg collection and dechorionation
Wild-type (AB strain) zebrafish (Danio rerio) were obtained from the Zebrafish International Resource Centre (University of Oregon, Eugene, OR, USA). Adult fish were maintained on a 14-h light/10-h dark cycle to stimulate spawning. The fertilized eggs were collected and dechorionated using well established protocols (Westerfield, Reference Westerfield2000) and maintained in 30% Danieau’s solution (19.3 mM NaCl, 0.23 mM KCl, 0.13 mM MgSO4·7H2O, 0.2 mM Ca(NO3)2·4H20 and 1.67 mM HEPES, pH 7.2) until they reached 30% or 75% epiboly (i.e. at ∼4.7 hpf and ∼8 hpf, respectively). All the procedures used in this study with zebrafish were conducted in accordance with the guidelines and regulations outlined by the Animal Ethics Committee of HKUST, and the Department of Health, Hong Kong.
SEM
SEM was used to investigate the morphology of the E-YSL surface of untreated embryos at 30% or 75% epiboly. In addition, in some experiments, embryos were incubated at ∼50% epiboly (∼5.3 hpf) with 30% Danieau’s solution containing 7.5 µg/ml or 10 µg/ml cytochalasin B (from a stock of 5 mg/ml prepared in DMSO; Sigma-Aldrich Inc., St. Louis, MO, USA) or with DMSO (diluted to 1:500; control), as described previously (Cheng et al., Reference Cheng, Miller and Webb2004). Alternatively, at the early shield stage (∼6 hpf) the yolk cell of embryos was injected with 2 nl 5,5′-dibromo-BAPTA (tetrapotassium salt; Thermo Fisher Scientific, Waltham, MA, USA) from a stock of 150 mM prepared in double-distilled water. At the shield stage, the volume of the yolk and YSL was estimated to be ∼74 nl (assuming the diameter of an embryo to be ∼625 µm). As the water percentage of early zebrafish embryos was reported to be ∼70% (Leung et al., Reference Leung, Webb and Miller1998), microinjection of 150 mM 5,5′-dibromo-BAPTA would produce a final concentration of ∼5 mM within the embryo, as described by Cheng et al. (Reference Cheng, Miller and Webb2004).
Just prior to fixation, embryos were treated with full-strength Danieau’s solution (58 mM NaCl, 0.7 mM KCl, 0.4 mM MgSO4·7H20, 0.6 mM Ca(NO3)2·4H20 and 5.0 mM HEPES, pH 7.2) containing 3% H2O2 (18132; Honeywell Riedel-de Haën, Seelze, Germany) for 2 min. The embryos were then fixed by incubation with 0.1 M cacodylate buffer (C-0250; Sigma-Aldrich Inc., pH 7.3) containing 10% sucrose and 3% glutaraldehyde for 4 h at room temperature, followed by 1 h at 0–4°C. They were then washed with 0.1 M cacodylate buffer alone for 1 h on ice. The embryos were post-fixed with 0.1 M cacodylate buffer containing 0.9% sodium chloride and 2% osmium tetroxide (19172; Electron Microscopy Sciences, Hatfield, PA, USA) for 2 h on ice followed by three 5-min washes with 0.1 M cacodylate buffer alone. The embryos were dehydrated through a series of increasing concentrations of ethanol (50%, 70%, 85% and 95%), followed by three 20-min incubations with 100% ethanol on ice. Following dehydration, the embryos were dried using a critical point drier (Bal-Tec CPD 030; Bal-Tec AG; Balzers; Germany) and then coated with a gold–palladium mixture using a sputter coater (Bal-Tec SCD 005; Bal-Tec AG). The samples were then mounted on a Leica Stereoscan S440 scanning electron microscope for image acquisition. The short-axis width of the E-YSL membrane protrusions was measured at the widest location of each protrusion using ImageJ software (National Institutes of Health, Bethesda, MD, USA; https://imagej.nih.gov).
Immunogold TEM
Embryos were fixed with 0.1 M phosphate buffer (P5244, Sigma-Aldrich Inc.; pH 7.3) containing 4% sucrose and 4% paraformaldehyde for 4 h at 4°C. They were then washed for 3 × 5 min with 0.1 M phosphate buffer containing 10% sucrose at room temperature. The embryos were then dehydrated through a graded ethanol series (50%, 70% and 90%), followed by three 15-min incubations in 100% ethanol at room temperature. They were then infiltrated with a 1:1 (v/v) mixture of 100% ethanol/LR White acrylic resin (L-9774; Sigma-Aldrich Inc.) for 1 h at room temperature and then with pure LR White resin twice each for 1 h followed by an overnight incubation at room temperature. Finally, the embryos were polymerized at 37°C for 96 h in gelatin capsules (70102; Electron Microscopy Sciences).
Semi-thin (1 µm) sections were cut with a diamond knife (Semi-thin; Diatome USA, Hatfield, PA, USA), and then stained with toluidine blue O (22050; Electron Microscopy Sciences) for 1 min, after which they were observed under a Nikon Labophot microscope. Ultra-thin (70–90 nm) sections were cut using a Leica Reichert Ultra-cut microtome with a diamond knife (Ultra-thin; Diatome USA). Each ultra-thin section was mounted on a gold grid (200 mesh; FF200-Au; Electron Microscopy Sciences). These grids were subsequently incubated in a blocking solution comprising phosphate-buffered saline (PBS; pH 7.3) containing 5% goat serum for 20 min at room temperature. They were then rinsed three times with PBS and incubated with the blocking solution containing an anti-actin antibody (A-2066; Sigma-Aldrich Inc.) at 1:10 dilution for 40 min at room temperature. After washing three times with PBS each for 5 min, the grids were then incubated in a blocking solution containing AuroProbe EM-labelled 10 nm gold-conjugated goat anti-rabbit IgG (RPN421; Amersham plc., Buckinghamshire, UK) at a 1:20 dilution for 40 min at room temperature. The grids were then rinsed for 2 × 10 min with PBS, followed by rinsing for 3 × 10 min in double-distilled H2O, all at room temperature. The sections were stained with 2% aqueous uranyl acetate (22400; Electron Microscopy Sciences) for 2 min and then 2% lead citrate (17800; Electron Microscopy Sciences) for 1 min, after which they were visualized and photographed using a Jeol 100 SX electron microscope operating at 80 kV using Kodak T-MAX film.
Labelling live embryos with rhodamine–actin and fluorescein isothiocyanate (FITC)–dextran
Dechorionated embryos were maintained at ∼28.5°C in 30% Danieau’s solution. In one series of experiments, the endocytic vesicles were labelled by incubating embryos at ∼30% or 75% epiboly in 30% Danieau’s solution containing 10 mg/ml fluorescein isothiocyanate (FITC)-tagged dextran (10 kDa) for 30 min, after which the embryos were washed briefly with 30% Danieau’s solution and images were acquired immediately at the blastoderm margin. In another series of experiments, the total actin was labelled by injecting rhodamine–actin at the single-cell stage and the endocytic vesicles were labelled by incubating embryos at ∼30% epiboly in 30% Danieau’s solution containing 10 mg/ml FITC-tagged dextran (10 kDa). Embryos were washed briefly (as described above) and then imaged at the blastoderm margin immediately (time = 0 min) and after 10 min. In another series of experiments, embryos were injected with rhodamine–actin and incubated with FITC-tagged dextran (10 kDa), as described above. When they reached 50% epiboly, they were then incubated with 30% Danieau’s solution containing either 10 µg/ml cytochalasin B or DMSO (at 1:500 dilution; controls) at 28°C in the dark until they reached ∼8 hpf, when the control embryos reached ∼75% epiboly. Images were then acquired at the blastoderm margin.
In all these experiments, embryos were held in the correct orientation for microinjection and imaging in custom-built viewing chambers; these along with the microinjection procedure used, are described by Webb and Miller (Reference Webb and Miller2013a). Fluorescence images were collected using a Nikon C1 laser scanning confocal system mounted on a Nikon Eclipse 90i microscope. Rhodamine or FITC fluorescence was visualized using excitation/emission wavelengths of 543/570 nm or 488/515–530 nm, respectively.
Measuring the diameter of endocytosed vesicles
Embryos were incubated with FITC–dextran and images were acquired using the Nikon C1 scanning confocal system described above. Single confocal sections from a stack of collected images were then saved as individual 8-bit greyscale TIF files using the Nikon EZ-C1 View software (version 2.10, Build 240; Nikon Corporation, Tokyo, Japan). In an 8-bit image, the value 0 indicates no contribution from a colour (in this case, green) and the value 255 indicates the maximum intensity of the colour. The TIF files were then imported into ImageJ software for subsequent image analysis. The image files were first converted from 8-bit greyscale into 1-bit images with a green pseudocolour using the Look-Up Table (LUT) Panel 2.2 Plug-in and a custom-built LUT. The latter LUT was designed to convert pixels of values below an intensity of 100 to zero, and to convert the pixels of values of 100 or above to the highest intensity, i.e. 255, but only in the green channel. This resulted in the downscale of an 8-bit image with 256 colours (28 = 256) into a 1-bit image with just two colours (21 = 2). The LUT was plotted in Microsoft Excel and saved as a .txt (Tab delimited) file. The .txt file extension was then changed to .lut format for recognition by the LUT Panel 2.2 Plug-in in ImageJ.
The pixel areas and quantities of individual groups of pixels (n = 250) were counted in three separate image files. A pixel was considered to be the neighbour of the central pixel only if it appeared in either one of the eight nearest neighbour positions in a 3 × 3 kernel. The quantities of different groups of pixel areas were sorted, and the pixel area was calculated to obtain the radius, using the area of a circle (Area = πr2) for approximation. The diameter of the individual pixel area was then calculated by multiplying the radius (r) by 2. The actual dimension of a single pixel in the 512 × 512 pixel Nikon confocal scan using a ×40 water immersion objective is ∼0.7 µm. Therefore, the calculated diameter was converted into an actual diameter by multiplying by a factor of 0.7. The relative population sizes were then plotted as a percentage against the approximate diameters of the endocytosed vesicles.
Statistical analysis and figure preparation
Numerical data were imported to Microsoft Office Excel version 2210 (Microsoft Corp., Redmond, WA, USA) for graph plotting, and into Minitab version 21.1 (Minitab LLC, State College, PA, USA) for statistical analysis. As the data did not follow a normal distribution, they were compared with the Mann–Whitney U-test. Figures were prepared using CorelDRAW version 24 (Corel Corp., Ottawa, ON, Canada).
Results
Identification of the membrane surface structure of the E-YSL by SEM and TEM
The surface structural features of the yolk cell membrane (YCM) region of the E-YSL were examined by SEM (Figure 1A). At ∼30% epiboly (Figure 1Ab) a relatively wide and diffuse region of branching microvilli-like protrusions of the YCM at the E-YSL was observed. This is shown at both low and higher magnification (Figure 1Ab,Ab′). At 75% epiboly (Figure 1Ae,Ae′), the membrane surface protrusions were still apparent, but here they were more closely packed and compact. Indeed, the width of this membrane protrusion region decreased from ∼51.0 ± 2.3 µm (n = 6) at 30% epiboly (Figure 1Ab) to ∼9.9 ± 1.8 µm (n = 4) at 75% epiboly (Figure 1Ae). The narrowing of the region from 30% epiboly to 75% epiboly was coincident with the formation of the punctate actin band at the E-YSL, shown previously by incubation of fixed embryos with FITC-tagged phalloidin (Cheng et al., Reference Cheng, Miller and Webb2004) and here by the injection of rhodamine–actin into live embryos (compare Figure 1Ab, 1Ae with Figure 1Ac, 1Af, respectively). This suggests that the membrane protrusions in the E-YSL might contain actin-based cytoskeletal components.
Morphology of the membrane surface protrusions and localization of actin in the E-YSL during epiboly. (Aa, Ad) Schematic illustrations of embryos at (Aa) 30% and (Ad) 75% epiboly. The regions bounded by the black squares show the regions imaged using scanning electron microscopy (SEM; in panels Ab, Ae) and confocal microscopy of rhodamine–actin fluorescence (in panels Ac, Af), at (Ab, Ac) 30% epiboly and (Ae, Af) 75% epiboly. The size of the region encompassing the membrane surface protrusions and punctate actin band are indicated by white and yellow measurement lines, respectively. In (Ab, Ae) the regions bounded by the white rectangles are shown at a higher magnification in (Ab′, Ae′). In (Ac, Af), the white arrowheads indicate the leading margins of the enveloping layer cells. (B) Visualization of actin in the E-YSL using immunogold labelling in conjunction with transmission electron microscopy (TEM). (Ba) The surface membrane protrusions in the E-YSL and part of a marginal EVL cell are shown. The region bounded by the black square is shown at a higher magnification in (Bb). In (Bb), the black arrowheads indicate the localization of actin clusters. Scale bars are 250 µm (Aa, Ad), 50 µm (Ab, Ac, Ae, Af), 10 µm (Ab′, Ae′), 1 µm (Ba), and 0.1 µm (Bb).

Immunogold TEM was used to investigate the localization of actin in the E-YSL in further detail (Figure 1B). Figure 1Ba shows a TEM image of the E-YSL and part of a marginal EVL cell. Membrane protrusions are apparent in the former. The region bounded by the black dashed square is shown at a higher magnification (Figure 1Bb), and it demonstrates the localization of immunogold labelled actin in clusters at the membrane surface (mainly in the protrusions) and in deeper locations of the E-YSL (see black arrowheads).
The punctate actin band colocalizes with a zone of endocytosis in the E-YSL
When embryos were incubated for 30 min in a solution of FITC-labelled dextran at 30% epiboly, there was some but relatively little internalization of the marker dye (i.e. that would indicate incorporation of extracellular material by some form of endocytosis) at the blastoderm margin (Figure 2Aa). However, when the same embryo was incubated with FITC-labelled dextran for 30 min again at 75% epiboly, a more distinct zone of dye internalization was visible (Figure 2Ab). The dye-containing intracellular vesicles ranged between ∼1.0 µm and ∼4.5 µm in diameter and their mean diameter was estimated to be 1.29 ± 0.53 µm (n = 250; Figure 2Ac).
In another series of experiments, embryos that had been injected with rhodamine–actin at the one-cell stage were incubated with FITC-labelled dextran for 30 min starting at ∼60% epiboly. They were visualized immediately (i.e. time = 0 min; Figure 2Ba–Bc) and after 10 min (Figure 2Bd–Bf). When embryos were visualized at t=0 min, the punctate band of actin at the EVL margin (in red; Figure 2Ba) and the zone of FITC-labelled dextran internalization (in green; Figure 2Bb) were relatively well colocalized, as shown by the amount of yellow (red plus green) fluorescence shown in the merged view (Figure 2Bc). However, when embryos were visualized at t = +10 min (Figure 2Bd–Bf), what were presumed to be dye-containing internalized vesicles were more diffusely dispersed towards the animal pole (Figure 2Be,2Bf), suggesting that the trafficking of internalized vesicles is directional and highly dynamic.
Effect of cytochalasin B on the localization of F-actin and endocytosis
We have previously reported the effect of cytochalasin B on F-actin organization and epiboly in fixed rhodamine–phalloidin-labelled embryos (Cheng et al., Reference Cheng, Miller and Webb2004). Here, we present new data to show the effects of cytochalasin B on actin localization and endocytosis in live embryos (Figure 2C). Therefore, embryos were injected with rhodamine–actin at the single-cell stage and then treated with 10 µg/ml cytochalasin B (stock prepared in DMSO) or DMSO alone (at 1:500 dilution; control) at 50% epiboly (n = 5 for each). Embryos that were incubated with 30% Danieau’s solution containing DMSO, completed epiboly at the same rate and were morphologically comparable with embryos incubated in Danieau’s solution alone. These embryos also contained a similar punctate band of actin at the EVL margin and zone of endocytosis to the untreated controls (for example, compare Figure 2Ca,2Cb with Figures 1f and 2Ab). In contrast, cytochalasin B treatment led to the disorganization of the punctate band of actin near the EVL margin (Figure 2Cd). Cytochalasin B also resulted in the disruption of the zone of endocytosis (compare Figure 2Ce with the DMSO control, Figure 2Cb). Epiboly of the cytochalasin B-injected embryos halted at the shield stage, i.e. ∼30 min after injection. The development of these embryos was arrested for ∼1.5–2 h and then they lysed through the unoccluded yolk cell at the VP (data not shown).
The internalization of a 10-kDa FITC-labelled dextran in the absence or presence of cytochalasin B during epiboly. (A) Embryos were incubated with FITC-labelled dextran at (Aa) 30% or (Ab) 75% epiboly for 30 min and imaged at the blastoderm margin (n = 5 for each). (Ac) Histogram showing the size distribution of the internalized vesicles. (B) Embryos were injected with rhodamine-labelled actin at the single-cell stage and then bathed in FITC-labelled dextran at ∼75% epiboly. Images were acquired (Ba–Bc) immediately after or (Bd–Bf) 10 min after FITC–dextran removal, and show the localization of (Ba, Bd) total actin (Bb, Be) endocytosis and (Bc, Bf) the actin and endocytosis images when merged. (C) Effect of cytochalasin B on the localization of actin and endocytosis during epiboly. Embryos were injected with rhodamine-labelled actin and bathed in FITC-labelled dextran, as described in (B). At 50% epiboly some embryos were incubated with (Ca–Cc) DMSO (control) whereas others (Cd–Cf) were incubated with 5 µg/ml cytochalasin B. Images were acquired at ∼8 hpf, when the control embryos reached ∼75% epiboly. In (A–C), the dashed white lines indicate (when possible) the leading margin of the enveloping layer cells. In (B, C) the yellow and white measurement lines indicate the size of the region of highest red and green fluorescence, respectively, and the black measurement lines indicate the approximate region of overlap between the two. Scale bars, 50 µm.

Effect of treatment with cytochalasin B or 5,5´-dibromo-BAPTA on the morphology and size of individual membrane protrusions in the E-YSL
We have previously reported that treatment with cytochalasin B or 5,5′-dibromo-BAPTA affects epiboly and the organization of F-actin (Cheng et al., Reference Cheng, Miller and Webb2004). Therefore, here we investigated the effect of these drugs on the morphology of the membrane protrusions of the E-YSL using SEM (Figure 3). In DMSO control embryos, the mean short-axis dimension of the individual membrane microvilli-like protrusions was ∼0.59 ± 0.03 µm (n = 20; Figure 3a). When embryos were treated with cytochalasin B at 7.5 µg/ml or 10 µg/ml, the morphology of the microvilli-like protrusions was altered in a dose-dependent manner (Figure 3b,c). As the concentration was increased, the membrane protrusions lost their microvilli-like appearance and appeared as larger amorphous protuberances of the E-YSL surface (Figure 3b,c). The width of the short-axis dimension of the individual projections was 0.83 ± 0.05 µm and 2.07 ± 0.12 µm in the 7.5 µg/ml and 10 µg/ml cytochalasin B-treated embryos, respectively (n = 20 for each; see Figure 3e). Indeed, at 10 µg/ml cytochalasin B, the short-axis-dimension of the individual membrane surface projections structures was increased by ∼4-fold when compared with the distinct microvilli-like protrusions of the DMSO control (Figure 3e). These results suggest that actin might be important for maintaining the structural integrity and therefore the function of the microvilli-like protrusions in the E-YSL plasma membrane.
The effect of cytochalasin B and 5,5′-dibromo-BAPTA on the morphology of the membrane surface protrusions in the E-YSL at 75% epiboly. Scanning electron microscopy images showing the region of the E-YSL in (a) a representative DMSO-treated control embryo and in embryos incubated with (b, c) cytochalasin B at (b) 7.5 µg/ml or (c) 10 µg/ml, or (d) injected with 5,5′-dibromo-BAPTA to a final concentration of 5 mM. Scale bar is 10 µm. (e) Bar chart with mean ± SEM and individual data points to show the effect of cytochalasin B on the width of the short-axis dimension of the E-YSL membrane surface protrusions (examples indicated by the yellow measurement lines in panels a–c) when compared with the control. Asterisks indicate cytochalasin B data that are significantly different from the control at *P < 0.001 and **P < 0.0001, as determined by the Mann–Whitney U-test.

In the 5,5′-dibromo-BAPTA-injected embryos, the E-YSL surface had a dramatically different appearance when compared with the controls, as it completely lacked any form of microvilli-like protrusions (Fig 3d). These results suggest that Ca2+ might be important for organizing and/or maintaining the actin-based cytoskeleton of the microvilli-like protrusions.
Discussion
The role of the E-YSL in epiboly in fish embryos has been a topic of interest for several decades. Over 40 years ago, Betchaku and Trinkaus (Reference Betchaku and Trinkaus1978) reported that in Fundulus, the E-YSL had a highly undulated surface populated by randomly oriented, interconnected microfilaments, some of which are attached to the plasma membrane. Twenty years later, in another teleost fish, the medaka (Oryzias latipes), a punctate zone of cortical actin was shown to be associated with a dense concentration of microvilli on the highly convoluted surface of the YSL (Cooper and Kimmel, Reference Cooper, Kimmel, Soll and Wessels1998). More recently, we showed with Nomarski DIC microscopy that the E-YSL in zebrafish also appears to possess what we described at the time as ‘surface folds’ (Cheng et al., Reference Cheng, Miller and Webb2004).
Here, the membrane surface structures of the E-YSL were examined at a higher magnification using both SEM and TEM (Figure 1). We showed by SEM that the E-YSL membrane surface appears as a band of a densely interwoven network of branching microvilli-like protrusions, which is in the same location and of a similar animal–vegetal dimension as the punctate actin band observed previously in fixed embryos (Cheng et al., Reference Cheng, Miller and Webb2004) and here in live embryos (Figure 1Ac,f). We also confirmed the presence of actin in the E-YSL membrane protrusions by TEM of immunogold-labelled embryos (Figure 1B). A similar TEM image of the E-YSL membrane protrusions was shown by Köppen et al. (Reference Köppen, Fernández, Carvalho, Jacinto and Heisenberg2006). Our data showed clusters of actin structures in the E-YSL region, both at the membrane surface associated with the protrusions, and in deeper sub-surface locations. Furthermore, we showed that the integrity of the membrane protrusions was disrupted by treatment with cytochalasin B, an F-actin inhibitor (Löw et al., Reference Löw, Dancker and Wieland1975). Therefore, our new data provide more evidence to suggest that the surface protrusions might be intimately associated with actin, and that their structural integrity is essential for the normal progression of epiboly. The fact that similar microvilli-like protrusions have been reported at the E-YSL surface of medaka (Oryzias latipes; Cooper and Kimmel, Reference Cooper, Kimmel, Soll and Wessels1998) and Fundulus (Betchaku and Trinkaus, Reference Betchaku and Trinkaus1978), suggests that they might be a common feature of epiboly in teleost fish, and as such they might play a key role in this process.
While the exact role of actin in endocytosis is not yet fully understood, it has been suggested that it plays an essential role in this process. For example, it might help to generate the contractile forces required to: induce the invagination of the plasma membrane; pinch off the invaginations to produce vesicles; and/or drive the detached vesicles away from the plasma membrane (reviewed by Qualmann et al., Reference Qualmann, Kessels and Kelly2000; Jeng and Welch, Reference Jeng and Welch2001; Schafer, Reference Schafer2002; King and Kay, Reference King and Kay2019; Wu and Chan, Reference Wu and Chan2022). We suggest that, in zebrafish, these various functions of actin contribute to the remodelling of the E-YSL microvilli-like protrusions as epiboly proceeds (compare Figure 1Ab′ with 1Ae′). The results from our TEM examination are compatible with this suggestion, as actin clusters were found both at the membrane surface associated with the microvilli-like protrusions, and in deeper sub-surface locations (Figure 1B).
When embryos were bathed in a 10-kDa fluorescent dextran solution it was clearly demonstrated that the E-YSL punctate actin band colocalizes with a zone of endocytosis (Cheng et al., Reference Cheng, Miller and Webb2004). Such a zone of endocytosis during epiboly was first reported in Fundulus embryos by Trinkaus (Reference Trinkaus1984), who suggested that this process might play a major role in epiboly by removing the YCM in front of the advancing EVL margin. More recently, a similar region of endocytosis was visualized during epiboly in zebrafish incubated with Lucifer yellow (Solnica-Krezel and Driever, Reference Solnica-Krezel and Driever1994), fluorescent dextran (Cooper and D’Amico, Reference Cooper and D’Amico1996), or lectin–TRITC (Marsal et al., Reference Marsal, Hernández-Vega, Pouille and Martin-Blanco2021). Epiboly was shown to continue normally in embryos treated with the microtubule depolymerizing agent nocodazole and so it does not appear to be dependent on microtubules (Solnica-Krezel and Driever, Reference Solnica-Krezel and Driever1994). However, it is clear from our previous low magnification and current high magnification data that this region of endocytosis is associated with a distinct actin-based structure and its membrane internalization function is sensitive to cytochalasin B, which disrupts the integrity of the microfilament-based cytoskeleton in the E-YSL (Cheng et al., Reference Cheng, Miller and Webb2004; Figure 2C).
Several aspects of our observations combine to suggest that the surface endocytosis at the E-YSL might be a form of macropinocytosis. This term refers to the formation of large irregular endocytic vesicles (called macropinosomes) generated by the formation of what has been described as ‘extreme deformations’ or ‘ruffling domains’ of the plasma membrane by an actin-dependent process (Amyere et al., Reference Amyere, Mettlen, Van Der Smissen, Platek, Payrastre, Veithen and Courtoy2002; Lim and Gleeson, Reference Lim and Gleeson2011; Marques et al., Reference Marques, Grinstein and Freeman2017; Swanson and King, Reference Swanson and King2019; Mylvaganam et al., Reference Mylvaganam, Freeman and Grinstein2021). Our structural and functional modulation experiments together support the suggestion that macropinocytosis might be taking place at the E-YSL surface during zebrafish epiboly.
An additional observation supporting this suggestion comes from the size of the internalized vesicles (Figure 2Ac). It has been reported that macropinosomes that form at sites of membrane ruffling often range in size between 0.2 µm to 6.0 µm in diameter (Swanson and King, Reference Swanson and King2019). This is the same general size range as the vesicles we measured in the E-YSL of zebrafish, i.e. ∼1.0–4.5 µm. In contrast, the micropinosomes found in other types of endocytosis, such as clathrin-mediated and caveolin-mediated endocytosis, and pinocytosis, are much smaller and more uniform in size. Indeed, the micropinosomes involved in clathrin-mediated or caveolin-mediated endocytosis during early cytokinesis in zebrafish are only ∼0.1 µm in diameter (Feng et al., Reference Feng, Schwarz and Jesuthasan2002). In addition, the uniform size and shape of micropinosomes are due to the mechanism of their formation. For example, during clathrin-mediated endocytosis, micropinosomes are formed by the recruitment of clathrin (a triskelion coat protein), onto an endocytic site to form a relatively uniform-sized ‘basket’ (Brodsky et al., Reference Brodsky, Chen, Knuehl, Towler and Wakeham2001). In contrast, the formation of macropinosomes relies on membrane surface protrusions and so they are usually larger and more varied in size and shape (Swanson and Watts, Reference Swanson and Watts1995; Amyere et al., Reference Amyere, Mettlen, Van Der Smissen, Platek, Payrastre, Veithen and Courtoy2002). This provides cells with a mechanism for non-selectively internalizing relatively large amounts of solutes or membranes compared with other forms of endocytosis (Lim and Gleeson, Reference Lim and Gleeson2011).
Additional evidence for the YSL endocytosis being macropinocytosis comes from work by Kenyon et al. (Reference Kenyon, Campos, Bull, Williams, Stemple and Clark2015) and Marsal et al. (Reference Marsal, Hernández-Vega, Pouille and Martin-Blanco2021) as they both showed that Rab5ab (a member of the small GTPase family of enzymes) is required for endocytosis of the YCM during epiboly in zebrafish embryos, and Rab5 is reported to play a role in macropinocytosis (Maxson et al., Reference Maxson, Sarantis, Volchuk, Brumell and Grinstein2021). Therefore, our new data support previous reports that the high levels of localized endocytosis that take place in the zebrafish E-YSL during epiboly closely match the unique characteristics of macropinocytosis described in the literature (Swanson and Watts, Reference Swanson and Watts1995; Amyere et al., Reference Amyere, Mettlen, Van Der Smissen, Platek, Payrastre, Veithen and Courtoy2002; Lim and Gleeson, Reference Lim and Gleeson2011; Swanson and King, Reference Swanson and King2019), and we suggest that this process is mediated by the actin-based microvilli-like protrusions.
In Fundulus, the zone of endocytosis was reported to be present throughout the whole of epiboly (Trinkaus, Reference Trinkaus1984). In addition, in zebrafish embryos incubated with lectin–TRITC, endocytosis was observed as early as a sphere stage (Marsal et al., Reference Marsal, Hernández-Vega, Pouille and Martin-Blanco2021). We did not investigate when endocytosis first began, but our data indicated that relatively little endocytosis occurred at 30% epiboly when compared with 75% epiboly. A similar increase in endocytosis as epiboly progressed was shown when embryos were incubated with the lectin–TRITC (Marsal et al., Reference Marsal, Hernández-Vega, Pouille and Martin-Blanco2021). Our previous data from zebrafish indicated that the distinct punctate actin band only appears after the shield stage but then it persists to the end of epiboly (Cheng et al., Reference Cheng, Miller and Webb2004). We suggested that, in zebrafish, this might be because between the sphere and shield stage, only ∼13% of the YCM is removed, whereas between the shield stage and the end of epiboly, the remaining ∼87% is internalized (Cheng et al., Reference Cheng, Miller and Webb2004). Therefore, there might be some endocytosis during the early stages of epiboly, but then considerably more occurs from the shield stage to the end of epiboly. To achieve this removal of the majority of the yolk cell plasma membrane, a highly organized system of rapid endocytosis is required. Here, we suggest that a combination of macropinocytosis and vesicle trafficking removes the YCM ahead of the advancing blastoderm margin. This might therefore contribute to the driving force required to move the connected margin of the EVL towards the VP and therefore help to drive epiboly by the constriction of the E-YSL, as previously suggested (Betchaku and Trinkaus, Reference Betchaku and Trinkaus1978, Reference Betchaku and Trinkaus1986). Furthermore, more recently, Marsal et al. (Reference Marsal, Hernández-Vega, Pouille and Martin-Blanco2021) proposed that epiboly of the EVL and DCs is driven by the contraction of the E-YSL and the difference in ‘stiffness’ between the EVL and YCM, and that Rab5ab-mediated endocytosis plays a role in internalizing and reducing the latter.
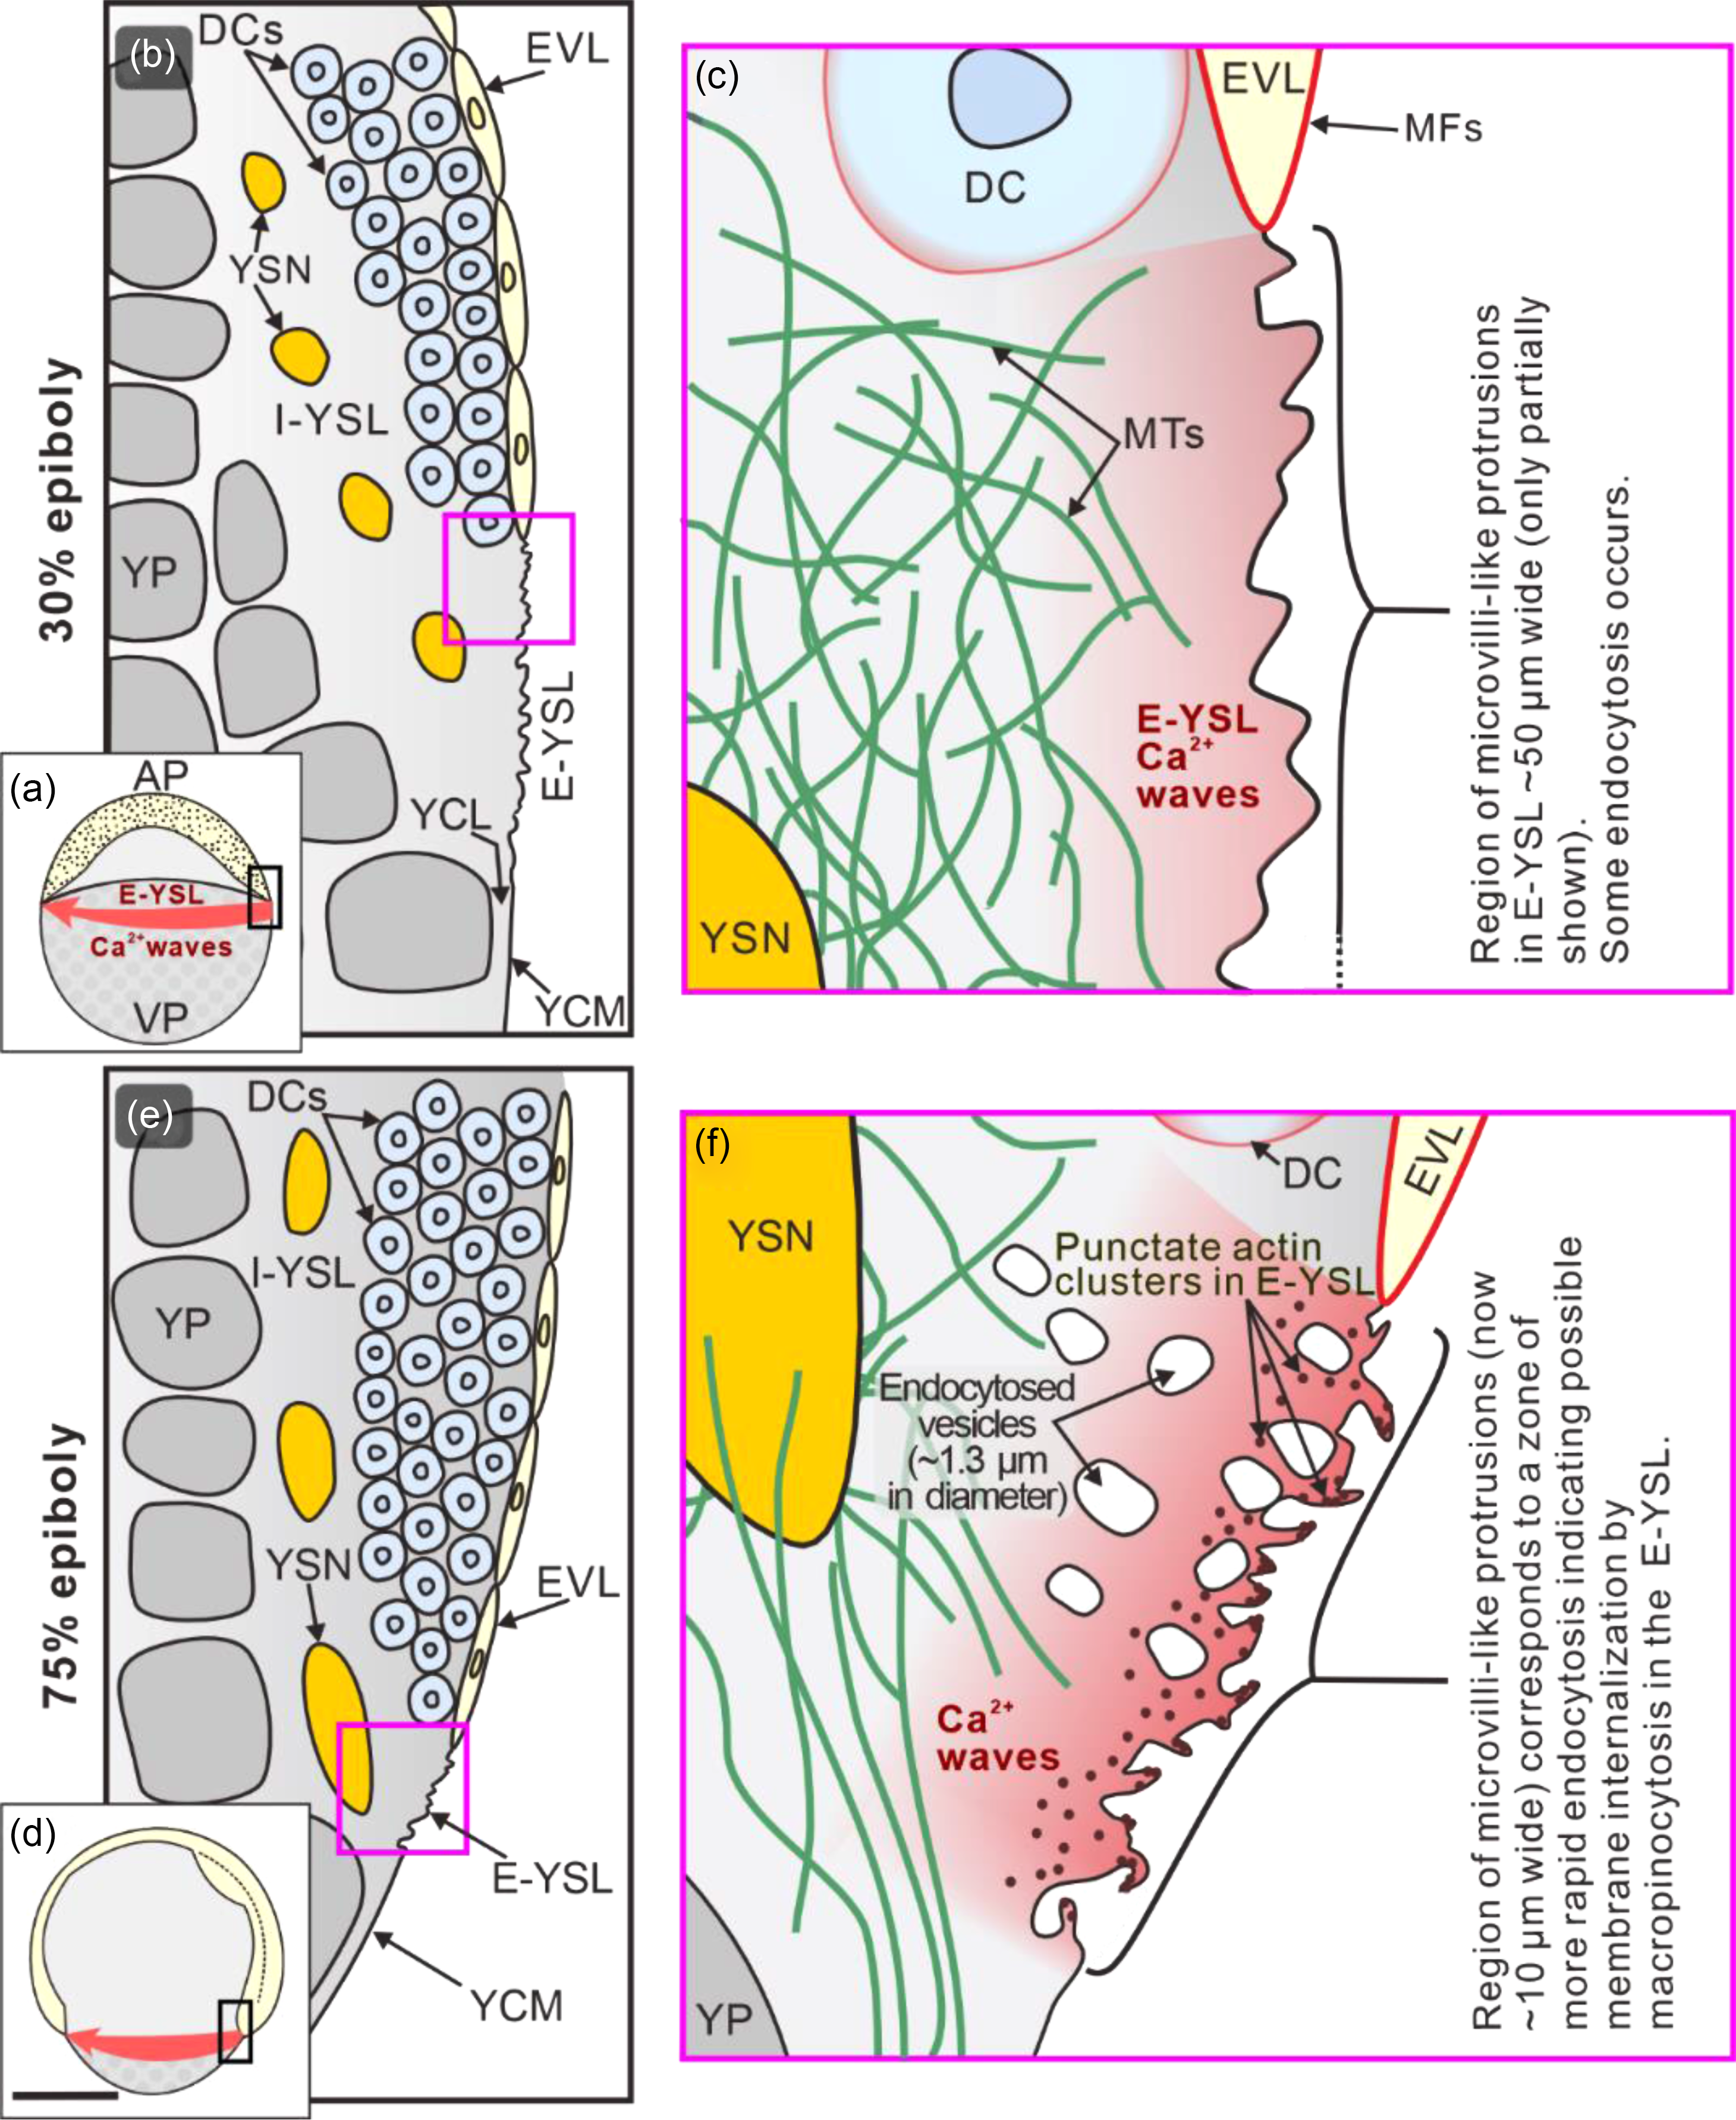
In Fundulus, it was postulated that ‘a circumferential wave of vegetally directed contraction’ plays a role in driving epiboly (Trinkaus, Reference Trinkaus1984). A similar process might occur in zebrafish as we have previously demonstrated that a rhythmic series of intercellular Ca2+ waves travel around the blastoderm margin of zebrafish embryos during epiboly (Gilland et al., Reference Gilland, Miller, Karplus, Baker and Webb1999; Webb and Miller, Reference Webb and Miller2003; Yuen et al., Reference Yuen, Webb, Chan, Thisse, Thisse and Miller2013, and reviewed by Webb and Miller, Reference Webb and Miller2013b). Although some of these waves were reported to propagate through the deep marginal cells (Webb and Miller, Reference Webb and Miller2003), others were confirmed to traverse the E-YSL (Yuen et al., Reference Yuen, Webb, Chan, Thisse, Thisse and Miller2013). The possible role of these Ca2+ signals on zebrafish epiboly was subsequently investigated and we showed that treatment with the Ca2+ chelator, 5,5′-dibromo-BAPTA or the inositol 1,4,5-trisphosphate receptor (IP3R) antagonist, 2-APB, resulted in the E-YSL Ca2+ signals being almost completely knocked down. Furthermore, following such treatment, epiboly was arrested at the shield stage and the E-YSL actin band was absent (Cheng et al., Reference Cheng, Miller and Webb2004; Yuen et al., Reference Yuen, Webb, Chan, Thisse, Thisse and Miller2013). More recently, it was shown that the release of Ca2+ from the endoplasmic reticulum (ER) in the YSL is controlled by the apoptosis inhibitor Nrz, a homologue of B-cell lymphoma 2 (Bcl-2). This interacts directly with IP3R Type 1 in the ER membrane and in this way controls the formation of actin–myosin cables and cell movements during epiboly (Popgeorgiev et al., Reference Popgeorgiev, Bonneau, Ferri, Prudent, Thibaut and Gillet2011). Here, our new SEM data showed that 5,5′-dibromo-BAPTA completely disrupted the membrane surface protrusions (Figure 3d), which might help to explain why epiboly was arrested. It has previously been shown that Ca2+ released from intracellular Ca2+ stores triggers macropinocytosis in the growth cones of chick dorsal root ganglion neurons (Kabayama et al., Reference Kabayama, Nakamura, Takeuchi, Iwasaki, Taniguchi, Tokushige and Mikoshiba2009). Therefore, we suggest that, in zebrafish, the Ca2+ waves that traverse the E-YSL during epiboly might in some way regulate actin-based contraction processes, including macropinocytosis. For the latter, we suggest that this is responsible for the large-scale removal of the YCM in the E-YSL that is an integral part of zebrafish epiboly. Our findings and proposed actin-mediated membrane internalization mechanism are summarized in the schematic shown in Figure 4.
Schematic to summarize our new findings and suggestions regarding the membrane surface protrusions, endocytosis and actin in the E-YSL during epiboly. The illustrations show embryos at (a–c) 30% epiboly and (d–f) 75% epiboly. The regions bounded by the black rectangles in (a) and (d) are shown at a higher magnification in (b) and (e), respectively, and the regions bounded by the pink squares in (b) and (e) are shown at a higher magnification in (c) and (f), respectively. AP, animal pole; VP, vegetal pole; DCs, deep cells; EVL, enveloping layer; E-YSL, external yolk syncytial layer; I-YSL, internal yolk syncytial layer; MTs, microtubules; MFs, microfilaments; YCM, yolk cell membrane; YCL, yolk cytoplasmic layer; YP, yolk platelets; YSN, yolk syncytial nuclei. Gilland et al. (Reference Gilland, Miller, Karplus, Baker and Webb1999) and Yuen et al. (Reference Yuen, Webb, Chan, Thisse, Thisse and Miller2013) were the first to visualize Ca2+ waves traversing the blastoderm margin (including E-YSL), whereas the presence of a network of MTs in the E-YSL was first reported by Solnica-Krezel and Driever (Reference Solnica-Krezel and Driever1994). Scale bar, 250 µm (a, d); other images not drawn to scale.
Acknowledgements
The zebrafish were supplied by the Zebrafish International Resource Centre, supported by grant # RR12546 from the NIH-NCRR.
Financial support
This work was supported by the Hong Kong Research Grants Council General Research Fund (grant numbers HKUST6279/03M, 16100719). We also acknowledge funding from the Hong Kong Innovation and Technology Commission (ITCPD/17–9).
Competing interests
None declared.
Ethical standard
The authors assert that all procedures contributing to this work comply with the ethical standards of the relevant nationals and institutional guides on the care and use of laboratory animals.


 Open access