

Introduction
Rye (Secale cereale L.), as a crop with excellent agronomic and quality characteristics, harbours abundant genetic variation (Hawliczek et al. Reference Hawliczek, Borzęcka, Tofil, Alachiotis, Bolibok, Gawroński, Siekmann, Hackauf, Dušinský, Švec and Brągoszewska2023; Niedziela and Bednarek Reference Niedziela and Bednarek2023; Sabaghnia and Janmohammdi Reference Sabaghnia and Janmohammdi2025). Its core advantages lie in its strong environmental adaptability and stress resistance, integrating cold hardiness and disease resistance, while simultaneously possessing grain high-yield potential and nutritional balance (Goncharenko et al. Reference Goncharenko, Chernykh, Makarov, Bykova, Karpushina and Yashina2022; Bulanov and Voylokov Reference Bulanov and Voylokov2024; Shabolkina et al. Reference Shabolkina, Shevchenko, Bisharev and Anisimkina2024). Compared with similar forages such as dual-purpose (grain and forage) oats, rye exhibits superior performance in key agronomic traits including spikelet number and thousand-kernel weight (TKW; Goncharenko et al. Reference Goncharenko, Chernykh, Makarov, Bykova, Karpushina and Yashina2023; Kuter et al. Reference Kuter, Ahsan, Tosun, Karagöz, Gümüş, Raza, Güvenç and Akkaş2023; Wu, Li et al. Reference Wu, Li, Su, Li, Liu, Chen, Xu, Jiang, Pu, Jiang, Jiang, Chen, Wei and Ma2025). Moreover, its grains are rich in proteins, dietary fibre and unique bioactive components (e.g., substances with antioxidant and hypoglycaemic functions), demonstrating significant value in both functional food development and forage nutrition supply (Aydin et al. Reference Aydin, Demir, Akdag, Gokmen, Sayaslan, Bayrac, Sönmez and Türkoğlu2024; Sabaghnia and Janmohammdi Reference Sabaghnia and Janmohammdi2025). Additionally, indicators such as its flour rheological properties and dough processing performance provide a foundation for expanding application scenarios (Miedaner, Reif et al. Reference Miedaner, Reif and Rabenstein2021; Arrigoni et al. Reference Arrigoni, Arata, Martínez and Lázaro2025; Gholizadeh Vazvani et al. Reference Gholizadeh Vazvani, Dashti, Saberi Riseh and Loit2025; Hegde et al. Reference Hegde, Kudva, Nayak, Sampathila and Thalengala2025).
Qinghai Province is located in the northeastern part of the Qinghai-Tibet Plateau. As a typical agricultural region in this area, the Hehuang Valley possesses the unique geographical characteristic of being a transition zone from the Loess Plateau to the Qinghai-Tibet Plateau, along with alpine climatic properties (Li, Liu et al. Reference Li, Liu, Liu, Li, Li and Zhang2024; Zhang et al. Reference Zhang, Li, Yu and An2025; Wu, Lü et al. Reference Wu, Lü, Liu, Wuda, Li, Zhao, Huang, Li, Hu, Du, Li, Chen, Luo, Raza and Yin2025). However, constrained by natural conditions such as cold and arid climate, water resource scarcity and short crop growing seasons (Liu, Yan et al. Reference Liu, Yan, Dong, Zhang and Zhang2024; Wu, Liu et al. Reference Wu, Liu, Wang, Zhang, Hou, Ren and Zhou2025), coupled with the lack of superior forage germplasm resources and relatively backward breeding technology, dual-purpose (grain and forage) forage varieties in this region are confronted with the problems of reduced genetic diversity and narrow genetic background, resulting in long-term difficulties in improving forage yield and quality (Wu et al. Reference Wu, Liu, Sun, Zhou, Liu, Zhang, Zhang, Peng, Huang and Ma2019; Li et al. Reference Li, Zhang, Wang, Huang, Li, Ji, Yang, You, Yan, Chen, Gou, Lei, Ji, Li, Wu, Zhang, Chang, Li, Xiong, Xiong, Han, Chen, Sun, Wu and Bai2025; Lu et al. Reference Lu, Zheng, Zhao, Tang, Zhang and Xie2025). Against this background, exploring the excellent genes of rye germplasm has become a key pathway for broadening the genetic diversity of forages and enhancing their yield, quality and disease resistance (Liu et al. Reference Liu, Liu, Zhang, Yang, Qi, Liang, Wei and Zhou2022, Reference Liu, Jiang, Zhong, Y, Liu and Chen2025). Specifically, the 12 key traits selected in this study (including protein content, formation time, hardness, TKW, etc.) are closely related to the breeding goals of high-yield and high-quality dual-purpose forages in the Qinghai-Tibet Plateau: protein content is the core indicator of forage nutritional (Shabolkina et al. Reference Shabolkina, Shevchenko, Bisharev and Anisimkina2024; Sabaghnia and Janmohammdi Reference Sabaghnia and Janmohammdi2025); Formation time and hardness index are key indices reflecting dough processing performance, which are crucial for expanding the application scenarios of rye as both grain and forage (Goncharenko et al. Reference Goncharenko, Chernykh, Makarov, Bykova, Karpushina and Yashina2022; Aydin et al. Reference Aydin, Demir, Akdag, Gokmen, Sayaslan, Bayrac, Sönmez and Türkoğlu2024); TKW and other agronomic traits are the basis of yield formation, and their stability directly affects the yield potential of rye in the alpine environment (Goncharenko et al. Reference Goncharenko, Chernykh, Makarov, Bykova, Karpushina and Yashina2023; Kuter et al. Reference Kuter, Ahsan, Tosun, Karagöz, Gümüş, Raza, Güvenç and Akkaş2023).The systematic analysis of these traits is essential to achieve the research goal of screening superior germplasm suitable for the Qinghai-Tibet Plateau.
Current research on rye germplasm still has three significant limitations, which are difficult to support the forage breeding needs of the Qinghai-Tibet Plateau: first, previous studies on the agronomic traits of rye in the Qinghai-Tibet Plateau region were mostly limited to some varieties from this region and its surrounding areas, and there was a lack of systematic evaluation of rye germplasm collected globally with wide geographical origins, resulting in the inability to tap into broad-spectrum genetic potential (Guo et al. Reference Guo, Tian and Du2017, Reference Guo, Tian, Zhang and Du2018; Smith et al. Reference Smith, Johnson and Peterson2020). Second, most existing studies have separately analysed yield-related traits (e.g., TKW) or quality-related traits (e.g., protein content), while lacking multi-year continuous observations and combined cluster analysis of multiple key traits (covering agronomic and quality traits). This makes it impossible to comprehensively screen for superior germplasm with both high yield and superior quality (Wang et al. Reference Wang, Zhang and Liu2021); Third, although previous studies have proposed that rye can be used as a parent for dual-purpose (grain and forage) forage crops, they have not clarified the specific group classification and the association with superior traits. This has resulted in low efficiency in germplasm screening during breeding practices (Li et al. Reference Li, Rabanus-Wallace and Hackauf2021). Based on the aforementioned research gaps, this study took 189 rye landraces of global origin as research objects. Through systematic observation, cluster analysis and comprehensive evaluation of 12 key agronomic and quality traits over a 3-year period, the study aims to screen out superior rye germplasm suitable for the Qinghai-Tibet Plateau environment, clarify the core groups of germplasm with high yield and superior quality, and provide basic materials and theoretical support for broadening the genetic basis of forages in this region and improving breeding efficiency. The core objective of this study is to explore the broad-spectrum genetic potential of global rye germplasm resources, and to select outstanding germplasm materials that have strong adaptability to the high-altitude environment of the Qinghai-Tibet Plateau. This will further enrich the genetic diversity of rye germplasm resources in the Qinghai-Tibet Plateau. In this study, the local rye varieties from China were not included in the analysis. Compared with previous studies, this study has three key innovations: first, it breaks the regional limitation of previous germplasm evaluation, adopting globally sourced rye landraces to systematically tap the broad-spectrum genetic potential; second, it conducts multi-year continuous observation and combined cluster analysis of 12 key agronomic and quality traits, realizing comprehensive screening of high-yield and high-quality germplasm; third, it clarifies the specific group classification of rye germplasm and its association with superior traits, which effectively improves the efficiency of germplasm screening in breeding practice, filling the research gap of systematic screening of superior rye germplasm in the Qinghai-Tibet Plateau.
Materials and methods
Experimental materials
The 189 rye accessions used in the test were collected from 36 countries or regions (rye landraces with preferable traits for pre-breeding), distributed across Europe (13%), Asia (3%), Africa (1%), North America (2%) and South America (1%), and provided by the Qinghai Provincial Key Laboratory of Crop Molecular Breeding. Among them, the accessions from Macedonia were the most abundant, accounting for 19%, followed by those from Turkey and Germany, which accounted for 12% and 7%, respectively (Fig. 1). Detailed information on the origin of the test rye accessions is shown in Supplementary Table 1.
Score of the tested rye 1:Macedonia, 2:Kazakhstan, 3:Republika Srpska Bosnia and Herzegovina, 4:Uktaine, 5:Iran, 6:Spain, 7:South Africa, 8:Mexico, 9:Afghanistan,10: Serbia,11:United States, 12:Turkey, 13:Poland, 14:Russia, 15:Romania, 16:Germany, 17:Chile, 18:Canada, 19:France, 20:Brazil, 21: Austria, 22: Hungary, 23: United Kingdom, 24: Greece, 25: Pakistan, 26: Israel, 27: Finland, 28: Latvia, 29: Netherlands, 30: Sweden, 31: Bulgaria, 32: India, 33: Portugal, 34: Belgium, 35: Montenegro, 36: Federacija Bosne i Hercegovine Bosnia and Herzegovina.

Figure 1 Long description
The map displays the global distribution of rye accessions, marked by numbered red dots across different continents. In Europe, numerous dots are concentrated, indicating a high number of accessions, particularly in central and eastern regions. Notable numbers include 30, 31 and 32 in central Europe. In Asia, dots are scattered with numbers like 2 and 5. North America shows a few dots, such as 11 and 18. South America has a dot marked as 17. Africa has a single dot labeled 20. The map includes a scale bar indicating distances in kilometers and a north arrow for orientation.
Experimental description
This study was conducted continuously for 3 years from 2022 to 2024 at the Haidong Ecological Agriculture Experimental Station of the Northwest Institute of Plateau Biology, Chinese Academy of Sciences, which is located in the Hehuang Valley of Qinghai. The station is situated at 102°19′36″E longitude and 36°28′30″N latitude, with an altitude of 2016 m. It has an annual average temperature of 3–9℃, an annual average precipitation of 319–532 mm, an evaporation capacity of 1276–1861 mm, an annual average sunshine duration of 2708–3636 h and a frost-free period of approximately 130–150 days. The soil fertility of the experimental field at the station is uniform; mechanical plowing was performed before sowing, and manual sowing was adopted. Field management measures such as fertilization, weeding, irrigation and pest and disease control were consistent with those of conventional field production.
Determination of grain traits
After rye harvesting and threshing, impurities such as broken grains and stone particles were removed. Each sample for determination was fully mixed and stored in a cool place. For each accession, 1000 complete grains were randomly selected, and the grain phenotypic traits (grain area, perimeter, length and width) were determined using an intelligent seed test and analysis system (Model number: TPKZ-3). The TKW was measured with a one-ten-thousandth electronic balance (BSA224S, Sartorius, Germany). Grain quality-related indices (moisture content, crude protein content, stable time, formation time, hardness index and test weight) were determined using a wheat grain seed analyzer (Model number: MARVIN-U), with each measurement being repeated three times.
Comprehensive evaluation
The selected evaluation indices were subjected to standardization processing to obtain the membership values of each rye evaluation index (Li et al. Reference Li, Liu, Shi, Shi, Han, Liu and Wei2023; Dong et al. Reference Dong, Shi, Bao, Fu, You, Li, Ren, Li and Chen2024). The specific calculation is shown in the following formula:
 \begin{equation*}{A_{{\text{xi}}}} = \frac{{{X_i} - {X_{i{\text{min}}}}}}{{{X_{i{\text{max}}}} - {X_{i{\text{min}}}}}}\end{equation*}
where, A ix represents the membership value of rye after standardization, Xᵢ represents the laboratory-measured value of each rye index to be evaluated, and Xᵢ imax and Xᵢ imin represent the two extreme values (maximum value and minimum value) of the i-th index, respectively.
Statistical analysis
Data were initially organized using Microsoft Excel 2020. Statistical analyses, including significance and correlation analysis, were performed using SPSS 23.0 (IBM Corp., USA). Comparisons among different treatments were made using Duncan’s new multiple range test (P < 0.05). Graphs were generated using SigmaPlot 12.5 (Systat Software Inc., USA).
Results
Analysis of grain agronomic traits of tested rye
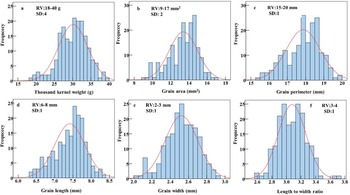
The coefficients of variation (CV) for TKW and grain area (GA) of the tested rye were high, reaching 13% and 12%, respectively. The TKW had the largest variation range, with a difference of 22 g, while the GA also showed a difference of 8 mm2(Table 1). The distribution of TKW and GA among tested materials is shown in Fig. 2. TKW > 35 g accounted for 10%, and three accessions had high TKW, reaching 40 g, 39 g and 39 g, respectively. The annual variation analysis of TKW showed that 40% of the tested rye had an annual increase over 3 years, with an increase range of 1–10 g; two accessions had an increase of 9 g and 10 g, respectively. GA >15 mm2 accounted for 10%, and three accessions had large GA being 17 mm2, 17 mm2 and 16 mm2 respectively. The annual variation analysis of GA showed that 56% of the tested rye had an annual increase, with an increase range of 1–7 mm2; two accessions had an increase of 5 mm2 and 7 mm2, respectively. Grain perimeter (GP) >19 mm accounted for 10%, and three accessions had large perimeters, all reaching 20 mm. The annual variation analysis of GP showed that 48% of the tested rye had an annual increase, with an increase range of 0–4 mm. The analysis of variance (ANOVA) showed that variety effect and the interaction effect between interannual (year) and variety had extreme impacts on TKW, GA, GP and grain length (GL), while their impacts on GL/grain width (GW) were not(Table 1).
Change in agronomic and quality traits of tested rye grain

Table 1 Long description
The table summarizes rye grain agronomic, size/shape, moisture, protein, dough-mixing, hardness, and test-weight traits using mean, maximum, minimum, coefficient of variation (CV), and trait range, plus significance of effects from years, varieties, and their interaction. Mean thousand-kernel weight was 30 g (18–40; CV 13; range 22), and grain size averaged 13 mm² area (9–17) with 18 mm perimeter (15–20). Grain length averaged 7 mm (6–8) and width 3 mm (2–3), with a mean length-to-width ratio of 3 (3–4). Moisture content averaged 7% (6–8) and crude protein 16% (13–20). Mixing traits showed higher variability: stable time averaged 6 min (3–10; CV 22) and formation time 2 min (1–3; CV 21). Hardness index averaged 66 (48–74) and test weight 799 g/L (766–832) with the lowest CV (1). Year effects were significant for every trait, while variety and year-by-variety effects were significant for all traits except grain width and the length-to-width ratio, where those effects were not significant.
TKW: Thousand kernel weight; GA: Grain area; GP: Grain perimeter; GL: Grain length; GW: Grain width; GL/GW: Length-to-width ratio; MC: Moisture content; CP: Crude protein; ST: Stable time; FT: Formation time; HI: Hardness index; TW: Test weight; CV: Coefficient of variation; TR: Trait range; Years: years effect; Varieties: varieties effect; Y × V: The interaction of years and varieties. ns: P > 0.05, and ***P < 0.001.
Agronomic traits of tested rye grain RV: Range of variation; SD: Standard deviation.

Figure 2 Long description
A Text on the plot: RV:18-40 g; SD:4. The horizontal axis represents Thousand kernel weight (g) and the vertical axis represents Frequency. The horizontal axis ranges from 15 to 40. The vertical axis ranges from 0 to 25. The histogram bars are grouped into equal-width bins across the axis. The tallest bars are around 28 to 32. The bar heights decrease toward both lower values near 15 to 20 and higher values near 36 to 40. The overlaid curve is highest near 30. b Text on the plot: RV:9-17 mm superscript 2; SD:2. The horizontal axis represents Grain area (mm superscript 2) and the vertical axis represents Frequency. The horizontal axis ranges from 8 to 18. The vertical axis ranges from 0 to 30. The histogram bars are grouped into equal-width bins across the axis. The tallest bars are around 13 to 15. The bar heights decrease toward lower values near 8 to 10 and higher values near 16 to 18. The overlaid curve is highest near 14. c Text on the plot: RV:15-20 mm; SD:1. The horizontal axis represents Grain perimeter (mm) and the vertical axis represents Frequency. The horizontal axis ranges from 15 to 20. The vertical axis ranges from 0 to 30. The histogram bars are grouped into equal-width bins across the axis. The tallest bars are around 18 to 19. The bar heights decrease toward lower values near 15 to 16 and higher values near 19.5 to 20. The overlaid curve is highest near 18.5. d Text on the plot: RV:6-8 mm; SD:1. The horizontal axis represents Grain length (mm) and the vertical axis represents Frequency. The horizontal axis ranges from 6.0 to 8.4. The vertical axis ranges from 0 to 25. The histogram bars are grouped into equal-width bins across the axis. The tallest bars are around 7.2 to 7.8. The bar heights decrease toward lower values near 6.0 to 6.6 and higher values near 8.0 to 8.4. The overlaid curve is highest near 7.5. e Text on the plot: RV:2-3 mm; SD:1. The horizontal axis represents Grain width (mm) and the vertical axis represents Frequency. The horizontal axis ranges from 2.0 to 3.0. The vertical axis ranges from 0 to 25. The histogram bars are grouped into equal-width bins across the axis. The tallest bars are around 2.4 to 2.7. The bar heights decrease toward lower values near 2.0 to 2.2 and higher values near 2.8 to 3.0. The overlaid curve is highest near 2.5. f Text on the plot: RV:3-4; SD:1. The horizontal axis represents Length to width ratio and the vertical axis represents Frequency. The horizontal axis ranges from 2.6 to 3.6. The vertical axis ranges from 0 to 25. The histogram bars are grouped into equal-width bins across the axis. The tallest bars are around 3.0 to 3.2. The bar heights decrease toward lower values near 2.6 to 2.8 and higher values near 3.4 to 3.6. The overlaid curve is highest near 3.1.
Analysis of grain quality traits of tested rye
The CV for the stable time (ST) and formation time (FT) of the tested rye grains were high, reaching 22% and 20%, respectively. The variation ranges of all quality traits are shown in Table 1. The distribution of crude protein content (CP), ST and FT among tested materials is shown in Fig. 3. CP >18% accounted for 11%, and three accessions had high CP, reaching 20%, 20% and 19%, respectively. The annual variation analysis of CP showed that 9% of the tested rye had an annual increase over 3 years, with an increase range of 0–2%; all three accessions had an increase of 2%. ST >8 min accounted for 12%, and three accessions had ST of 10 min, 8 min and 8 min, respectively. The annual variation analysis of ST showed that 10% of the tested rye had an annual increase over 3 years, with an increase range of 1–4 min, two accessions had an increase of 4 min and 3 min, respectively. FT <2 min accounted for 6%, and three accessions had low FT, all being 1 min. The annual variation analysis of FT showed that 11% of the tested rye had an annual decrease, with a decrease range of 0–1 min, two accessions all had a decrease of 1 min. Regarding test weight (TW), only one tested rye exhibited an annual increase over the 3 years. The ANOVA showed that interannual (year) effect, variety effect and the interaction effect between interannual and variety all had extremely impacts on moisture content (MC), CP, ST, FT, hardness index (HI) and TW (Table 1).
Quality traits of tested rye grain RV: Range of variation; SD: Standard deviation.

Figure 3 Long description
The image A showing a histogram with a fitted curve. Text: a, RV:6.8 percent, SD:1. The horizontal axis label is Moisture content (percent). The vertical axis label is Frequency. The horizontal axis range is 6.0 to 8.5. The vertical axis range is 0 to 25. The bars form a single main cluster between about 6.5 and 8.0, with the tallest bars around about 7.0 to 7.5. The image B showing a histogram with a fitted curve. Text: b, RV:13.20 percent, SD:1. The horizontal axis label is Crude protein (percent). The vertical axis label is Frequency. The horizontal axis range is 12 to 20. The vertical axis range is 0 to 25. The bars form a single main cluster between about 14 and 19, with the tallest bars around about 16 to 18. The image C showing a histogram with a fitted curve. Text: c, RV:3.10 min, SD:1. The horizontal axis label is Stable time (min). The vertical axis label is Frequency. The horizontal axis range is 0 to 12. The vertical axis range is 0 to 25. The bars form a single main cluster between about 2 and 8, with the tallest bars around about 4 to 6. The image D showing a histogram with a fitted curve. Text: d, RV:1.3 min, SD:1. The horizontal axis label is Formation time (min). The vertical axis label is Frequency. The horizontal axis range is 1.0 to 3.5. The vertical axis range is 0 to 25. The bars form a single main cluster between about 1.5 and 3.0, with the tallest bars around about 2.0 to 2.5. The image E showing a histogram with a fitted curve. Text: e, RV:68.74 percent, SD:4. The horizontal axis label is Hardness index (percent). The vertical axis label is Frequency. The horizontal axis range is 45 to 75. The vertical axis range is 0 to 30. The bars form a single main cluster between about 58 and 72, with the tallest bars around about 65 to 70. The image F showing a histogram with a fitted curve. Text: f, RV:766.832 g L superscript negative 1, SD:11. The horizontal axis label is Test weight (g L superscript negative 1). The vertical axis label is Frequency. The horizontal axis range is 760 to 840. The vertical axis range is 0 to 30. The bars form a single main cluster between about 780 and 820, with the tallest bars around about 795 to 805.
Comprehensive evaluation of grain traits of tested rye
There were 35 accessions with a comprehensive evaluation index >50%, accounting for 19% of the total population. The top 10 accessions with high comprehensive evaluation and their ranking are shown in Fig. 4a. The top 3 accessions in the comprehensive evaluation ranking all had evaluation indices of 51%. The lowest comprehensive evaluation index was 47%. The comparison of comprehensive evaluation indices between the top 3 accessions and the lowest one is shown in Fig. 4b.
Multicriteria evaluation of agronomic and quality traits in tested rye grains CEI: Comprehensive evaluation index, “*”: P < 0.05.

Figure 4 Long description
The image A showing a bar graph labeled a. The vertical axis label is Comprehensive evaluation index percent, with tick labels 0, 10, 20, 30, 40, 50, 60. The horizontal axis label is Variety number. A legend shows CE greater than or equal to 50 percent and The top 10 accession. Multiple vertical bars are plotted across the variety numbers and a series of point markers connected by a line is plotted near the top of the bars. The image B showing a bar graph labeled b. The vertical axis label is Comprehensive evaluation index percent, with tick labels 0, 10, 20, 30, 40, 50, 60, 70. The horizontal axis label is Variety number. A legend shows Top 3 accession. Four vertical bars are plotted at variety numbers 37, 87, 114, 147. The bar heights are 51 percent at 37, 51 percent at 87, 51 percent at 114 and 47 percent at 147. A bracket annotation spans the first three bars and another bracket spans from the first bar to the fourth bar, with an asterisk above the bracket.
Cluster analysis was performed on the tested rye accessions using the Euclidean distance and unweighted pair-group method with arithmetic mean (UPGMA) (Fig. 5). The results showed that the 189 rye materials were divided into four clusters. Cluster II contained 139 materials, accounting for 72% of the total population, with high values in TKW, GA, GP, GL, GW and MC. Cluster III included 22 materials, accounting for 12% of the total, and exhibited high performance in TKW, GA, GP, GL, GW, ST, HI and TW. Both cluster II and III showed superior grain traits compared with other clusters, and materials with high comprehensive evaluation (50% and above) were mainly concentrated in these two clusters, 19 in cluster II and 16 in cluster III. Additionally, among the top 10 materials in the comprehensive evaluation ranking, two belonged to cluster II and eight were from cluster III.
Cluster analysis of the tested rye accessions.

Figure 5 Long description
The image is a circular dendrogram representing a cluster analysis of rye accessions. The dendrogram is divided into four distinct clusters, labeled I, II, III and IV. Cluster I is depicted in blue, located at the bottom right section of the circle. Cluster II, shown in red, occupies the top left and upper sections, forming the largest portion of the dendrogram. Cluster III is in green, positioned to the right of Cluster I. Cluster IV, in purple, is a small section located at the top right. The branches extend outward from a central point, with each cluster branching into smaller sub-branches, indicating the hierarchical relationships among the accessions. The outermost tips of the branches are labeled with accession identifiers, though the specific labels are not legible in the image. The scale bar at the bottom center provides a reference for branch length, indicating the degree of similarity or distance between the accessions.
Discussion
This study investigates rye landraces with preferable traits for pre-breeding, which have stable high-yield and high-quality traits and can be directly used as parental materials for breeding. The core conclusions are as follows: (1) The tested rye materials have rich genetic diversity, and the variation level of key traits (ST, FT, TKW, GA) is higher than that of local and European rye populations reported in previous studies; (2) three core germplasms with synergistic inheritance of high yield and high quality were screened, which broke the previous cognitive limitation that high yield and high quality are difficult to balance in rye; (3) Clusters II and III were identified as core selection regions for high-yield and high-quality rye, realizing a breakthrough from individual plant screening to cluster localization. These findings fill the research gap in systematic evaluation of cross-regional rye germplasm in the Qinghai-Tibet Plateau, broaden the genetic basis of local forage breeding and provide direct parental materials and theoretical support for directional breeding of dual-purpose (grain and forage) rye varieties.
The genetic diversity of the tested global rye landraces was significantly higher than that of local rye varieties in the Qinghai-Tibet Plateau and its surrounding areas, as well as European cultivated rye populations. Specifically, the CV of TKW (13%) and GA (12%) of the tested materials was higher than the CV of TKW in local rye (8–17%) (Smith et al. Reference Smith, Johnson and Peterson2020) and European Lo7 population (10%) (Miedaner et al. Reference Miedaner, Vasquez, Castiblanco, Castillo, Foroud, Würschum and Leiser2021); the CV of CP (8%) was higher than that of Chinese Weining cultivated rye population (7%) (An et al., Reference An, Xu and Xu2011). Notably, rye germplasm from regions such as Europe showed high variation characteristics in TKW and CP, which can provide a broader source of excellent genes for the breeding of cold-tolerant and barren-tolerant forage varieties on the Qinghai-Tibet Plateau, solving the problem of narrow genetic background of parental materials for previous forage breeding in this region (Hawliczek et al. Reference Hawliczek, Borzęcka, Tofil, Alachiotis, Bolibok, Gawroński, Siekmann, Hackauf, Dušinský, Švec and Brągoszewska2023; Fan et al. Reference Fan, Sun, Zheng, Song, Zhang and Bian2024).
TKW is a key indicator of rye yield formation, and CP is the core quality trait determining the economic value of rye as a dual-purpose forage. Previous studies have mostly focused on single-trait screening, failing to realize synergistic screening of high yield and high quality. For example, Wang et al. (Reference Wang, Zhang and Liu2021) screened high-yield European rye materials with TKW of 35 g, but CP was only 15%; Vega-García et al. (Reference Vega-García, López-González, Morales-Almaraz and Arriaga-Jordán2021) reported high-quality rye materials with CP of 18%, but TKW was less than 32 g. An et al. (2025) confirmed that genes on the 1RS chromosome of rye can significantly increase crop TKW, but the specific variation characteristics of TKW in rye landraces from different geographical origins, especially the synergistic variation law of TKW and CP, have not been clarified. This study made up for this deficiency: three core germplasms were screened, with TKW of 36 g and CP of 18%, which not only exceeded the single high-yield or high-quality materials reported in previous studies (Zhou et al. Reference Zhou, Zhu, Chen, Ge, Li and Dong2007; Sun et al. Reference Sun, Miao, Yang and Gao2008), but also comply with the industry standard for high-quality forages (CP ≥17%). Only rye materials with a CP ≥17% can comply with the industry standards for high-quality forages (Vega-García et al. Reference Vega-García, López-González, Morales-Almaraz and Arriaga-Jordán2021; Kruppa et al. Reference Kruppa, Orosz, Bencze, Kruppa, Kruppa, Lantos, Bóna and Futó2025). The three core germplasms screened in this study have CP content of 18%, which is 1–3% higher than the high-quality materials reported by Vega-García et al. (Reference Vega-García, López-González, Morales-Almaraz and Arriaga-Jordán2021), confirming the feasibility of synergistic inheritance of high yield and high quality in rye, and revising the previous cognitive limitation that high yield and high quality are difficult to balance in rye (Li et al. Reference Li, Rabanus-Wallace and Hackauf2021).
This study investigates rye landraces with preferable traits for pre-breeding, which have stable high-yield and high-quality traits and can be directly used as parental materials for breeding (Islam et al. Reference Islam, Chakrabarty, Akter, Khalequzzaman, Khan Prince, Pittendrigh, Tomita and Ali2025; Wang et al. Reference Wang, Lee, Choi, Yi, Desta, Shin, Lee, Jeon and Yoo2025). Previous studies on rye germplasm mostly limited to the screening of superior individual plants, without clarifying their group affiliation, resulting in low-breeding screening efficiency (Smith et al. Reference Smith, Johnson and Peterson2020; Sobczyk et al. Reference Sobczyk, Hanek, Brukwiński, Banaszak, Krysztofik and Stojałowski2025). An et al. (2025) reported that there are key gene clusters regulating yield and quality in rye genome, but did not correlate them with specific cluster groups. Based on cluster analysis, this study identified clusters II and III as core selection regions for high-yield and high-quality rye. The proportion of materials with TKW ≥36 g in cluster II was 6%, which was twice the proportion of high-yield materials in the whole population reported in previous studies (Guo et al. Reference Guo, Tian and Du2017, Reference Guo, Tian, Zhang and Du2018). The proportion of materials with CP ≥18% was 7%, which was three times that of previous studies (Vega-García et al. Reference Vega-García, López-González, Morales-Almaraz and Arriaga-Jordán2021). The core innovation in realizing the transformation from individual plant screening to cluster localization: subsequent breeding programmes can directly target clusters II and III, thereby markedly reducing both screening and time costs, and providing a population basis for exploring key genes regulating high-yield and high-quality traits. The results of ANOVA showed that year effect, variety effect and their interaction had extreme impacts on most grain traits (TKW, GA, GP, MC, CP, ST, FT, HI and TW). The annual variation analysis showed that 40% of the tested rye had an annual increase in TKW, 56% had an annual increase in GA and 9% had an annual increase in CP. The year effect mainly affected the stability of trait expression: in the alpine environment of the Qinghai-Tibet Plateau, the variation amplitude of TKW and CP in 3 years was 1–10 g and 0–2%, respectively, which indicated that the screened high-yield and high-quality germplasm had relatively stable trait expression and strong adaptability to the local alpine climate, providing a guarantee for their practical application in breeding. Based on the findings of this study, the following specific research directions are proposed for subsequent work: (1) focus on clusters II and III, combine rye reference genome data (An et al., 2025), conduct gene mapping of TKW- and CP-related traits, and clone key regulatory genes to provide molecular markers for marker-assisted breeding; (2) carry out multi-year verification tests on the three core high-yield and high-quality germplasms, clarify their adaptability in different ecological regions of the Qinghai-Tibet Plateau and optimize planting supporting technologies and (3) expand the scope of germplasm collection, include Chinese local rye germplasm for comparative analysis, further explore the genetic differences between global and local germplasm, and construct a more comprehensive rye germplasm resource bank for the Qinghai-Tibet Plateau forage breeding.
Conclusions
Cluster analysis and comprehensive evaluation of 189 globally sourced rye landraces showed abundant genetic variation in their grain traits. Specifically, CV of ST, 22%, FT, 20%, TKW, 13% and GA, 12% exceeded 10%, indicating significant genetic differences among germplasm individuals. This study screened nine superior rye germplasms with clear breeding application value, including three high-TKW parental materials (TKW ≥39 g), three high- CP basic materials for triticale breeding (CP ≥19%) and three dual-excellent parental materials with both high yield and superior quality (TKW ≥35 g, CP ≥ 18%). Additionally, the top 3 germplasms in comprehensive evaluation (comprehensive evaluation index 51%) and two core clusters (cluster II and III) were identified as high-yield and high-quality germplasm candidate pools, among which cluster II contained 136 materials (72% of the total) and cluster III contained 22 materials (12% of the total), both with superior grain trait performance. These 9 screened superior germplasms and two core clusters directly provide targeted parental materials and efficient selection targets for the genetic improvement of dual-purpose (grain and forage) forages in the Qinghai-Tibet Plateau, effectively broadening the genetic background of local forage breeding materials and providing practical technical support for the sustainable development of grassland animal husbandry in this region.
Supplementary material
The supplementary material for this article can be found at https://doi.org/10.1017/S1479262126100677.
Acknowledgements
This work was supported by the Project of Qinghai Provincial central guide local science and technology development funds project (2025ZY002), the Youth Innovation Promotion Association of the Chinese Academy of Sciences under grant number Y2023116 and Qinghai Province’s Kunlun Talents-High-end Innovative and Entrepreneurial Talents Program (QHKLYC-GDCXCY-2025-172).
Author contributions
X.L.: conceptualization, methodology, investigation, formal analysis, writing original draft and editing. F.Y.: writing original draft, methodology, investigation, review. S.Y, M.S., Q.W. and C.Z.: methodology, investigation, writing review and editing. L.W.: conceptualization, investigation. D.L.: methodology, investigation, formal analysis. R.L.: conceptualization, supervision, writing review. H.Z.: formal analysis, supervision. Y.S.: conceptualization, methodology, formal analysis. J.S. and W.C.: conceptualization, methodology, formal analysis, supervision, writing original draft, writing review and editing, funding acquisition.
Competing interests
The authors declare that they have no known competing financial interests or personal relationships that could have appeared to influence the work reported in this paper.