


Introduction
In the Netherlands, sea-level rise was already an important research subject more than a century ago. In the 19th century, the Dutch pioneer of terp research Acker Stratingh described gradual sea-level rise and the accompanying raising of terps (Acker Stratingh, Reference Acker Stratingh1849: 233). In the early 20th century, the archaeologist Van Giffen used sedimentological data obtained from investigations in artificial dwelling mounds, or terps,Footnote 1 in the northern Netherlands and elsewhere in the Wadden Sea region to calculate the relative sea-level rise (RSLR) or, as it was called at the time, the subsidence coefficient, for different areas in the Wadden Sea region (Van Giffen, Reference van Giffen1910, Reference van Giffen1933). After Van Giffen, the interest of terp archaeologists in sea-level rise declined.
Basal peat sea-level studies
Sea-level research in the Netherlands came to be more in the foreground of scientific interest with the publications by Bennema (Reference Bennema1954) and Jelgersma (Reference Jelgersma1961). These sea-level studies were based on sea-level indicator (SLI) data from basal peat overlying a compaction-free sand subsurface of the Pleistocene. Basal peat itself is compaction-prone (Koster et al., Reference Koster, de Lange, Harting, de Heer and Middelkoop2018), and thus the contact surface between the Pleistocene sand and basal peat is preferred for reconstruction. This reference water level (RWL) is considered as a SLI in the case that the beginning of peat growth on the Pleistocene surface was controlled by sea-level rise and not by local groundwater effects (Van de Plassche, Reference van de Plassche1980, Reference van de Plassche1982, Reference van de Plassche and Van de Plassche1986; Kiden et al., Reference Kiden, Denys and Johnston2002; Behre, Reference Behre2003, Reference Behre2007; Baeteman et al., Reference Baeteman, Waller and Kiden2011; Vis et al., Reference Vis, Cohen, Westerhoff, Ten Veen, Hijma, Van der Spek, Vos, Shennan, Long and Horton2015). One of the basic assumptions underpinning relative basal-peat sea-level studies is that in the humid climate of NW Europe in the Holocene, freshwater-peat growth in the coastal plain takes place at or above – but never lower than – Mean Sea Level (MSL) at that location (Meijles et al., Reference Meijles, Kiden, Streurman, van der Plicht, Vos, Gehrels and Kopp2018). It is generally accepted that basal peat starts forming at local MSL or, when there is tidal influence, at Mean High Water (MHW) level (Hijma & Cohen, Reference Hijma and Cohen2019).
The term ‘sea-level index point’ (SLIP) was first used for peat samples formed under the influence of the Holocene RSLR. Since Jelgersma’s basal-peat RSLR curve was published, constant improvements and new data points have resulted in many new curves by e.g. Jelgersma herself (Reference Jelgersma1966), Van de Plassche (Reference van de Plassche1982), Kiden et al. (Reference Kiden, Denys and Johnston2002, Reference Kiden, Makaske and van de Plassche2008), Vink et al. (Reference Vink, Steffen, Reinhardt and Kaufmann2007), Hijma & Cohen (Reference Hijma and Cohen2010, Reference Hijma and Cohen2019) and Meijles et al. (Reference Meijles, Kiden, Streurman, van der Plicht, Vos, Gehrels and Kopp2018).
Sea-level curves based on sedimentological data
Another SLI was introduced by Roep (Reference Roep and van de Plassche1986), Roep & Beets (Reference Roep and Beets1988), Van de Plassche & Roep (Reference van de Plassche, Roep, Scott, Pirazolli and Honig1989) and De Groot et al. (Reference De Groot, Westerhoff and Bosch1996), for coastal barrier deposits. They used sedimentological and biological criteria such as wave ripple and aeolian lamination, position of the highest clay drapes and the presence of shells, to reconstruct the elevation of MHW in these deposits. For the period after 2500 BC, these SLIP data points from coastal barriers are a valuable addition to the basal peat SLIPs. The sedimentological sea-level curves partly overlap the basal peat curves mentioned above and thus validate the MSL/MHW SLIPs of these basal peat curves.
New sedimentological sea-level data from Westergo
In the 1990s, terp archaeology and interest in the salt-marsh landscape were rekindled. A new method of sea-level research was introduced in the palaeolandscape study that was conducted in the context of the archaeological excavation at the terp of Wijnaldum-Tjitsma (province of Friesland, the Netherlands) between 1991 and 1993. The salt marshes are the final phase in the development of the coastal zones of the Wadden Sea, from tidal flats into lower, middle and eventually high salt marshes. These salt marshes not only increased in elevation, but also expanded to the north through time. This extensive progradation of the salt marshes over the intertidal-flat deposits took place over the whole area of Westergo from 1500 BC up to AD 100 (see palaeogeographical reconstructions, Fig. 1). After AD 100 the progradation of the salt marshes in the area stopped and from that time the salt-marsh coastline remained more or less in the same position.
Location of the sampling sites on the palaeogeographical maps of 1500 BC, 500 BC, 250 BC and AD 100. 1: Firdgum; 2: Tzummarum; 3: Dongjum; 4: Wijnaldum; 5: Peins-Oost; 6: Dronrijp-Zuid; 7: Achlum; 8: Dronrijp-Oost; 9: Beetgumermolen; 10: Saksenoord; 11: Winsum; 12: Wommels-Stapert; 13: Englum; 14: Ezinge (base map after Vos et al., Reference Vos, van der Meulen, Weerts and Bazelmans2020).
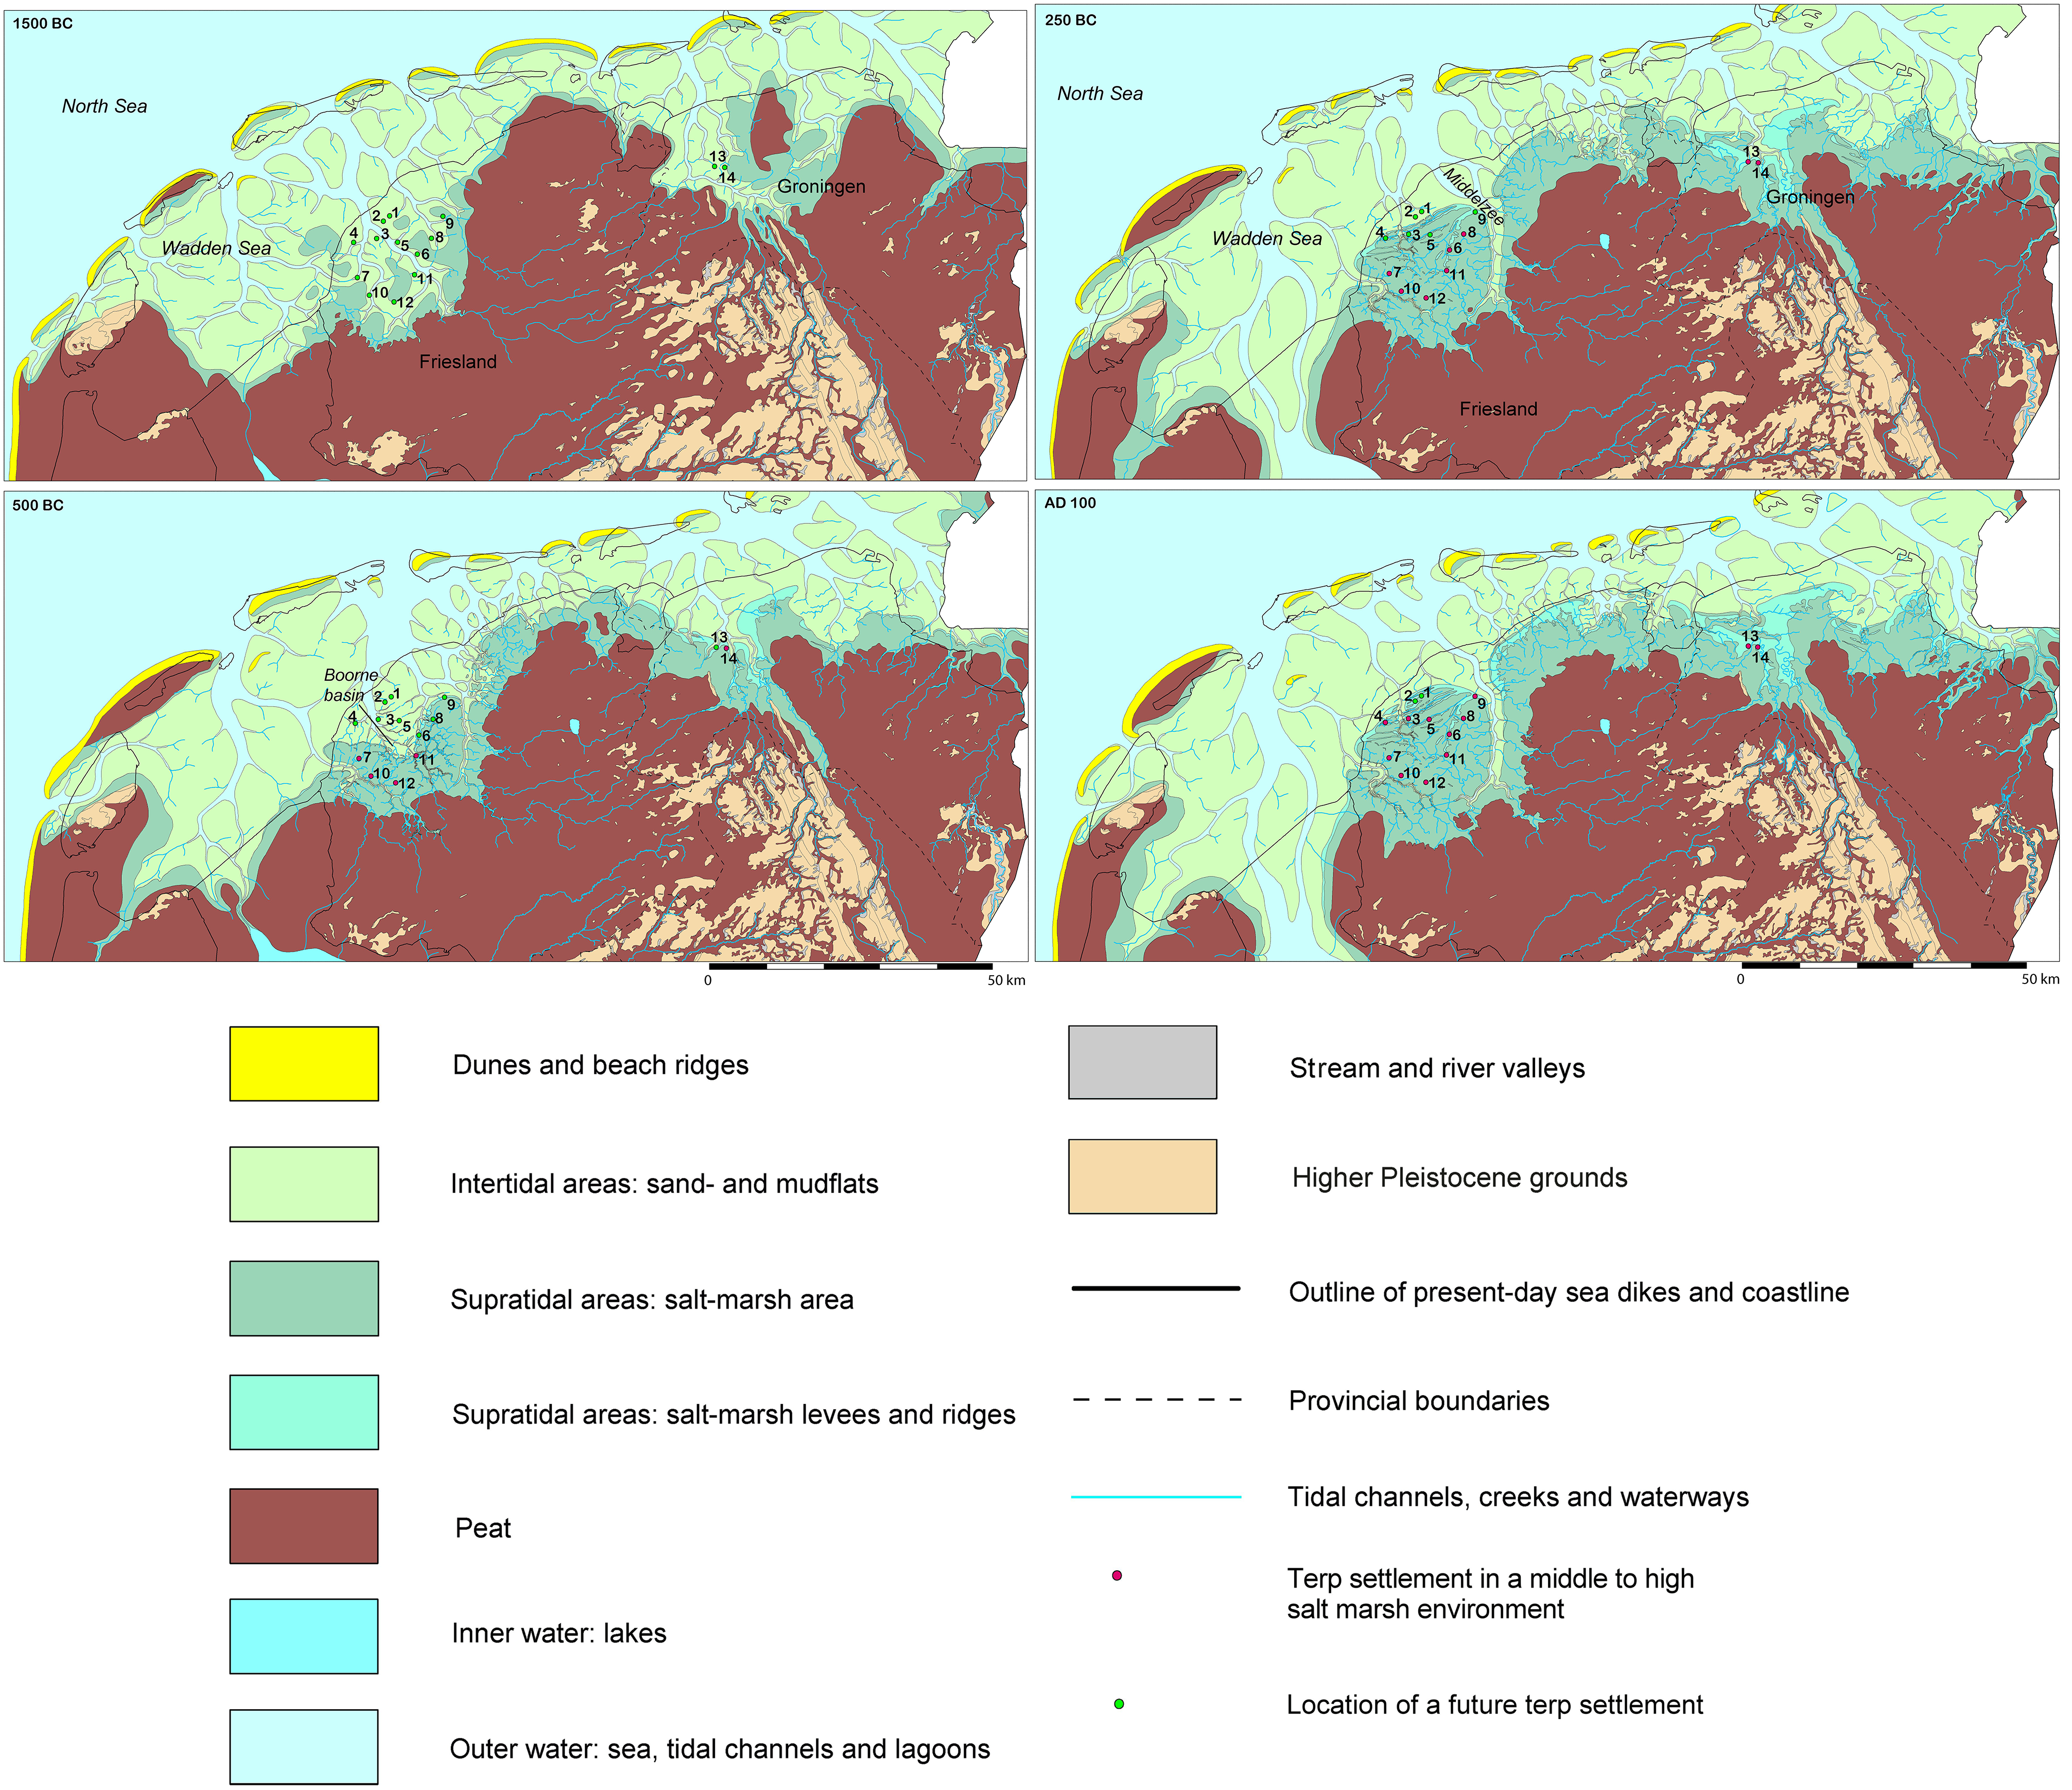
The reconstruction of salt-marsh progradation is based on extensive geoarchaeological research, combining dates of shells in life position in the top of the tidal flat beneath terps, the thickness of salt-marsh deposits, and the archaeological starting dates of the terp settlements in the area (Vos & Gerrets, Reference Vos and Gerrets2005). The transition of tidal-flat to salt-marsh deposits that can be observed in the natural deposits under terps reflects the level of palaeo-MHW at the time of deposition and can therefore, when dated, be used as SLIP (Figs 2 and 3). Due to the relative sea-level rise, the oldest MHW SLIPs in the south of Westergo are lower than the youngest SLIPs in the north (Tables 1 and 2). At Wijnaldum, for the first time in the northern Netherlands, age–depth data of the tidal-flat and salt-marsh boundary were collected in deep excavation trenches (Fig. 2). In order to date this boundary, the highest bivalved shells (in ‘life position’) in the top of the sandy tidal-flat deposits – directly under the silty laminated salt-marsh deposits – were sampled, and radiocarbon-dated. With the data that were obtained, the palaeo-MHW elevation for the Wijnaldum region was reconstructed for the period of the Late Iron Age (Vos, Reference Vos1999).
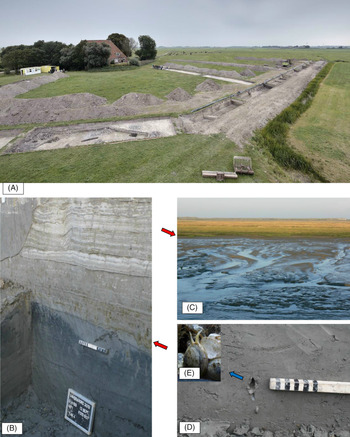
Former and recent intertidal sandflat – supratidal salt-marsh deposits in the field and in section. (A) Palaeo-MHW sample location during the archaeological excavation of the terp location Saksenoord in 2013. (B) Transition of tidal flat to salt marsh in the profile section of the excavation trench of Saksenoord. (C) Transition of tidal flat to salt marsh at the landward side of the island of Terschelling. (D) Bivalved Scrobicularia plana in ‘life position’ in the top of the tidal-flat deposits. (E) Life example of a Scrobicularia plana. Photos T. Varwijk (A) and P.C. Vos (B–E).

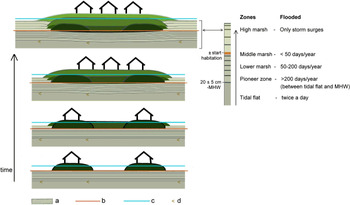
Schematic model of a cross-section through a developing terp and the natural layers beneath. At the base the tidal-flat deposits, covered by salt-marsh deposits, and on top the different layers of the terp. Different shades of green: anthropogenic terp layers; a: laminated salt-marsh deposits; b: salt-marsh surface at the start of habitation; c: level of Extreme High Water (usually less than the height of the terp); d: bivalved shells in life position. Not to scale. Drawing A. Nieuwhof.

Age–depth data of the 12 shell samples from archaeological sites in Westergo. For the locations see Figure 1.

a RD-coordinate system of the Netherlands.
b Corrected for the reservoir effect (400 years).
Age–depth calculation of the 12 SLIP data locations in Westergo.

a 5–10 cm sample depth below the boundary of the salt-marsh and tidal-flat deposits.
b 20–45 cm above the sample.
c Corrected for the reservoir effect (400 years).
Since Wijnaldum-Tjitsma, RSL reconstruction has been an integral part of geo-archaeological palaeolandscape research in the terp region of the northern Netherlands, especially in Westergo (NW Friesland), the former Boorne system (Fig. 1).Footnote 2 A preliminary palaeo-MHW curve for the Westergo region for the period 3000–1000 BP was published in 2005 (Vos & Gerrets, Reference Vos and Gerrets2005).
Palaeo-MHW and -MSL
Reference water-level data are of prime importance when defining the elevation of proxy sea-level data (e.g. for MSL or MHW); they allow the analysis of sea-level variations over long periods (Woodroffe & Barlow, Reference Woodroffe, Barlow, Shennan, Long and Horton2015). If the SLIPs are formed exactly at palaeo-MSL, there is no need to measure them in relation to MSL. In meso- and macro-tidal environments, however, there are no SLIP data that can be related directly to the palaeo-MSL (Terwindt, Reference Terwindt and De Boer1988). That raises the question of the relation of MHW and MSL in this specific tidal basin.
Most index points in tidal environments are found in the uppermost part of the intertidal range, such as the highest in situ Scrobicularia plana in tidal-flat deposits. In this regard the term ‘indicative meaning’ (introduced by Van de Plassche, Reference van de Plassche and Van de Plassche1986; Shennan, Reference Shennan, Shennan, Long and Horton2015) is relevant. Indicative meaning comprises two parameters: the reference water level (in our case MHW) and the indicative range. The indicative range is the elevational range over the indicator and the RWL is the midpoint of this range, expressed to the same datum (Vis et al., Reference Vis, Cohen, Westerhoff, Ten Veen, Hijma, Van der Spek, Vos, Shennan, Long and Horton2015; Woodroffe & Barlow, Reference Woodroffe, Barlow, Shennan, Long and Horton2015). In tidal basins, the tidal range – and thus also the elevation of the MHW – varies spatiotemporally. These changes are caused by the deformations of the incoming tidal wave, which are related to the geomorphology of the tidal system (e.g. Martinius & Van den Berg, Reference Martinius and van den Berg2011). In the Netherlands, all tidal datums are referred to the Dutch ordnance level: NAP (Normaal Amsterdam Peil). This level is comparable with the German ordnance level Normalhöhenull.
To obtain MSL data from tidal facies (palaeo-MHW SLIPs), the palaeotidal range (palaeo-TR) must be known. The palaeo-MSL elevation can be derived in tidal basins from the palaeo-MHW elevation by taking this value minus half the TR (or tidal amplitude: TA). In sea-level studies based on MHW SLIPs of the higher intertidal deposits, the variations of the tidal amplitude have to be taken into account to unravel the effect of tidal range fluctuations in the system and the regional RSL.
Overview
In this paper, we cover this topic for the region of Westergo, the NW part of the province of Friesland. Due to the salt-marsh progradation over the palaeotidal flats after 1500 BC, data for sea-level reconstruction could be collected in this area as part of geoarchaeological research during 12 terp excavations. On the basis of the resulting more extensive data set (in comparison with the data in Vos & Gerrets, Reference Vos and Gerrets2005), a new palaeo-MHW curve for the Westergo region can be reconstructed for the period 1200 BC–AD 100.
Before presenting the new data, we will briefly go into the history of sea-level research in the terp region, as it touches upon several methodological aspects of this research that are still relevant for modern sea-level research. In the discussion, firstly tidal ranges in recent and sub-recent tidal systems in the Netherlands are analysed to obtain insights into and quantify how variations in tidal ranges can affect the MHW sea-level curve in the tidal basin of Westergo, and how the Westergo MHW curve can be converted to a palaeo-MSL curve. Secondly, the estimated values and the meaning for the MHW sea-level curve of Westergo are described.
Methods of sea-level research in the terp region
Relative sea-level rise or ‘secular subsidence’ in the Wadden Sea area was an object of study already in the early 20th century (Schütte Reference Schütte1908, Reference Schütte1910; Martin Reference Martin1909, Reference Martin1910; Van Giffen Reference van Giffen1910); it concerned several researchers in Germany and the Netherlands, and also aroused interest outside the small circle of academic research. There were conflicting estimates of zero to 0.88 m RSLR per century, based on variously interpreted observations along the North Sea coasts (Van Giffen, Reference van Giffen1910: 266). At the time, RSLR was thought to be caused only by tectonic subsidence; the role of subsidence by glacial isostatic adjustment in the North Sea area (Kiden et al., Reference Kiden, Denys and Johnston2002) was yet unknown.
The rate of RSLR, or ‘subsidence coefficient’, was calculated by comparing the elevation of the old surface under a terp with the elevation of the area surrounding a terp; the present area is usually higher due to continuing sedimentation and accretion during habitation before dike building began. The difference in elevation divided by the number of centuries that separate the dates of these surfaces provides RSLR in metres per century (Van Giffen, Reference van Giffen1910: 262).
In the Netherlands, Albert Van Giffen, one of the founding fathers of terp research, was especially concerned with RSLR (Fig. 4). Between 1908 and 1910 he visited many terps in the three Wadden Sea countries, and studied elevations and terp habitation in general (Knol, Reference Knol, Valentin Eriksen, Abegg-Wigg, Bleile and Ickerodt2017: 855). Van Giffen was modern in his approach. He opposed subsidence caused by tectonic movements to subsidence by aeration and compaction of the upper soil, and secondly to apparent subsidence that is caused by a higher tidal range and a higher level of MHW because of geomorphological changes (Van Giffen, Reference van Giffen1910: 262). The latter results in higher levels of the younger surfaces and therefore RSLR calculations that are too high. These factors have to be taken into account if a reliable RSLR is to be calculated from observations in salt-marsh deposits under terps.
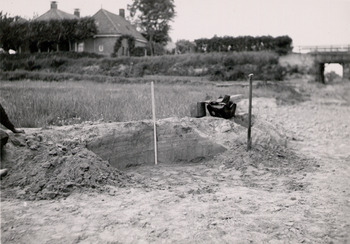
Quarried part of the terp of Hogebeintum (province of Friesland) in 1909, where Van Giffen and his German colleague Schütte took measurements of the top of the original salt-marsh surface. Photo A.E. van Giffen ©University of Groningen, Groningen Institute of Archaeology.

Moreover, Van Giffen described the conditions that the selected terps must meet for reliable observations, which are still relevant today. Firstly, they need to be situated in the marine salt-marsh area adjacent to the Wadden Sea, since it is sedimentation and accretion by the sea that is investigated (Van Giffen, Reference van Giffen1910: 264). Secondly, coring is not a reliable method to measure elevations, since the deepest layers of terps are far from even. Large sections are needed to reliably measure the elevations of the original surfaces under terps (Van Giffen, Reference van Giffen1910: 265). Thirdly, the character of the subsoil (peat layers, more or less sandy clay or Pleistocene sand) needs to be taken into account to assess subsidence by compaction and dehydration. Terps without peat high in the subsoil are preferable. Finally, dating of the deepest terp layers is of paramount importance since these date the old surfaces underneath. At the time, Van Giffen thought that most terps were from the first part of the 1st millennium AD. Had he known, as we do now, that many terps are several centuries older, he would have arrived at even lower figures of RSLR for some of the terps he visited.
His conclusion was that RSLR was highly overrated by many researchers: RSLR in the northern Netherlands during the last 2000 years did not exceed 0.05–0.10 m per century. Towards the northern part of the Wadden Sea region, subsidence was even less or could not be established at all (Van Giffen, Reference van Giffen1910, 292).
Van Giffen remained interested in subsidence and RSLR, especially when he got the opportunity to excavate the large terp of Ezinge in the province of Groningen in the 1920s and 1930s. He observed that the earliest habitation features were found on the salt marsh at a level of 0.20 m −NAP. Ongoing sedimentation had caused accretion, up to 0.30 m +NAP. He concluded that RSLR could not have been more than 0.03–0.04 m per century over this 1500 year period, assuming that habitation had started c.300 BC (Van Giffen, Reference van Giffen1933; see also Nieuwhof & Vos, Reference Nieuwhof and Vos2018). What he did not realise was that there is no one-to-one relationship between sea level and the rate of sedimentation of the salt marsh. In the tidal basins of the northern Netherlands, and in the tidal basin of the river Hunze where Ezinge was situated, the salt marsh grew seaward at a considerable rate. Based on the palaeolandscape reconstructions (see Fig. 1), the mean progradation in the Iron Age and Roman Age was c.8 m per year, and a similar rate can be established in the Boorne tidal basin in Westergo (Vos & Gerrets, Reference Vos and Gerrets2005: 73; Nieuwhof & Vos, Reference Nieuwhof and Vos2018: 33–34). Settlements that were on the salt-marsh coast when habitation started soon became separated from the shore by younger salt marshes. At the same time, the salt marsh developed from a low to a high marsh over time, with habitation usually starting at the level of a middle marsh (Nieuwhof et al., Reference Nieuwhof, Bakker, Knol, de Langen, Nicolay, Postma, Schepers, Varwijk and Vos2019). The increase in both distance and elevation caused a lower frequency of inundations over time, and the rate of sedimentation therefore does not directly reflect RSLR.
The palaeosurface underlying terps is no longer taken as a point of departure for sea-level research. Nowadays, it is the elevation of the transition from tidal-flat to salt-marsh deposits that can be observed in the natural deposits underneath the terps (Figs 2 and 3) that is taken as SLI, and to which archaeological excavations give access during archaeological landscape reconstruction studies (Vos, Reference Vos1999; Vos & Gerrets, Reference Vos and Gerrets2005; Vis et al., Reference Vis, Cohen, Westerhoff, Ten Veen, Hijma, Van der Spek, Vos, Shennan, Long and Horton2015).
Results
Mean High Water sea-level data of Westergo
Since the early 1990s, palaeo-MHW SLIP samples have been taken from 12 locations in Westergo (Fig. 1; Tables 1 and 2). The sample sites were all derived from archaeological terp excavations (Figs 1 and 2). The ‘age–depth window’ for palaeo-MHW registration in this region is c.1250 years, between 1200 BC and the beginning of the 1st millennium AD (Tables 1 and 2).
In the excavation trenches, large terp sections were deepened into the tidal-flat deposits. The sediment sequence shown in the sections was described and sampled for palaeo-ecological and sea-level research. Such sections consist of sandy tidal-flat deposits at the base, covered by silt or fine sand-laminated salt-marsh clay deposits, and on top of this layer several generations of terp deposits (Fig. 3).
The tidal-flat deposits consist of very fine sandy deposits with a clay content of c.4%. The sandy deposits are completely or almost completely homogenised by burrowing activity of marine organisms (bioturbation). Clay layers are generally absent. Since the central part of Westergo is the former tidal basin of the river Boorne, the soil below the tidal-flat deposits consists of sandy tidal channel deposits, which are founded in the compaction-free Pleistocene subsurface. The upper boundary to the salt-marsh deposits is mostly sharp. This is established at the lowest clay layer of the salt-marsh deposits. The laminated salt-marsh deposits consist of crinkly clay and silt layers (Fig. 2). The individual laminations are 1 mm to several cm thick; the total packet of salt-marsh deposits under the terp-elevation layers has in most cases a thickness of 0.8 to 1.2 m.
The anthropogenic terp layers consist of sods from the salt marshes, dung and settlement waste, and can be several metres high. The terps were built on the higher parts of the marshes (middle and higher salt marsh; Vos & Gerrets, Reference Vos and Gerrets2005). The oldest terps in the south of Westergo (e.g. Wommels-Stapert: Varwijk & De Langen, Reference Varwijk and de Langen2018) date from the Early Iron Age (600 BC), while the youngest terps in the north (e.g. Firdgum: Nicolay et al. Reference Nicolay, Schepers, Postma, Kaspers, Nieuwhof, Nicolay and Wiersma2018) were built in the Early Middle Ages (AD c.700).
The marine shells that can be used to date the start of salt-marsh formation (Tables 1 and 2) were collected from the top of the tidal flat, at the depth at which they naturally occur when alive (Roep & Van Regteren Altena, Reference Roep and van Regteren Altena1988). Most of the samples are bivalved shells of Scrobicularia plana, a species that is known to live in tidal flats at a depth of up to 10 cm or even more (De Boer & De Bruyne, Reference De Boer and De Bruyne1991: 194). Bivalved specimens of Cerastoderma edule were also collected; this species lives in the tidal flat at a depth of c.5 cm (De Boer & De Bruyne, Reference De Boer and De Bruyne1991: 170). The depth of the shell samples was measured in the excavation trenches in m relative to NAP and relative to the tidal-flat/salt-marsh boundary.Footnote 3 Despite the possible differences in depth between these species, the collected shells of both species were found between 5 and 10 cm under the base of the salt-marsh deposits.
The marine shell samples of Westergo were radiocarbon-dated, and calibrated to calendar years using the OxCal 4.1 program.Footnote 4 The shell dates were corrected for the marine reservoir effect. The applied correction was 400 years, which since the 1960s is standard for marine radiocarbon shell dates in the Netherlands. The 400 years correction is included in the radiocarbon dates in Tables 1 and 2.
Palaeo-MHW sea-level diagram of Westergo
To use the marine shell data for sea-level research, the position of the shells relative to palaeo-MHW and the post-sedimentary subsidence must be taken into account.
When pioneer plants, especially Salicornia europaea, settle on the tidal-flat and salt-marsh formation, the surface is still 20 ± 5 cm under the level of MHW. Roep & Van Regteren Altena (Reference Roep and van Regteren Altena1988: 226) therefore estimate that the palaeo-MHW level was 20 ± 5 cm above the deepest level of the crinkly laminated salt-marsh deposits. In this paper we follow this assumption, which is supported by the occurrence in the lower part of the salt-marsh deposits at Wijnaldum of unbroken diatoms of Scoliopleura tumida, a species that belongs to the zone just below or around palaeo-MHW level (Vos, Reference Vos1999: 49). Since the sampled shells were found at a depth of 5–10 cm under the tidal-flat/salt-marsh boundary, the palaeo-MHW was 20 to 35 cm above the depth of the shells. However, compaction and subsidence need to be taken into account.
Post-sedimentary subsidence is a potentially important factor when dealing with SLIPs, especially in NW Westergo. Recent salt and gas extraction have caused considerable subsidence over the last decennia. Subsidence near Wijnaldum amounted to as much as −0.13 m between 1997 and 2013, after salt extraction started in 1996 (Nieuwhof & Vos, Reference Nieuwhof and Vos2018), and c.−0.2 m between 1988, when gas extraction started in the Harlingen gas field, and 2008, at the location of the excavation (Muntendam-Bos et al., Reference Muntendam-Bos, Hanssen, Van Thienen-Visser and Samiei-Esfahany2009: fig. l). The excavation in Wijnaldum, however, took place between 1991 and 1993, before salt extraction started, and before gas extraction could cause subsidence (see Nieuwhof & Vos, Reference Nieuwhof and Vos2018: suppl. 1). Nearby locations Dongjum and Peins were excavated at the end of the 1990s, but these locations are situated outside the area with strong subsidence (Muntendam-Bos et al., Reference Muntendam-Bos, Hanssen, Van Thienen-Visser and Samiei-Esfahany2009: fig. f). Continuing and new gas and salt extraction have caused additional strong subsidence in the NW part of Westergo in recent years, between Wijnaldum and Tzummarum (see the subsidence map of the Netherlands since 2015: NCG, 2020). Sample locations in this area are Dongjum, Peins, Tzummarum and Firdgum, but these were excavated before this strong subsidence set in. The other sample locations are not situated in areas with gas and salt extraction causing strong subsidence.
The subsidence of the tidal-flat deposits due to loading of salt-marsh clay and terp elevation layers above has been calculated by Baardman (see appendix in Vos, Reference Vos1999). The starting point in the calculation was that the deeper subsurface deposits consisted of sandy channel deposits founded on the Pleistocene subsoil, which are assumed not to settle. By using minimum and maximum values for volumetric weight and settlement constants, Baardman calculated that post-depositional subsidence had reduced the palaeo-MHW level and the level of the sampled shells by 2 to 8 cm. Wijnaldum, with an estimated original height of 3–3.5 m (Kaspers, Reference Kaspers and Nieuwhof2020: fig. 8.12), was a normal-sized terp in Westergo. Allowing for different terp sizes, we take into account a subsidence of the shell samples of 0 to 10 cm.
For the uncertainty calculation (error boxes in the diagram), we add up the uncertainties. In the vertical error range calculation, the following sum is made: palaeo-MHW = depth of the shell (5–10 cm) + post-depositional compaction (0–10 cm) + level MHW above the tidal-flat/salt-marsh boundary (15–25 cm) = 20–45 cm above the depth of the shell (Fig. 5). The RWL is thus MHW −0.33 m with an indicative range of ±0.13 m.
Sea-level diagram of Westergo with the 12 palaeo-MHW data points. Black dot: palaeo-MHW SLIP. Black cross: horizontal and vertical error range. Red dot: sample depth of the dated shell.

For the horizontal error range of the SLIP-error boxes the 2σ-age range provided by the OxCal 4.1 program was taken. The median of the 2σ-age range was observed as the most probable age of the dated shell (‘best estimate’).
At the margins of the 12 SLIP-error boxes in the diagram, an error envelope has been drawn (Fig. 6). A rather straight MHW sea-level curve can be constructed in this error envelope, but the error envelope does allow fluctuations in sea-level rise.
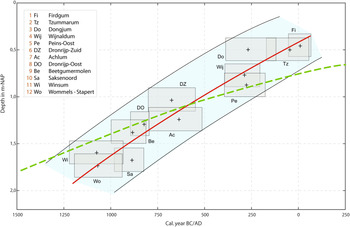
Sea-level diagram of Westergo with the MHW error boxes of the 12 sample sites and a straight curve of the palaeo-MHW placed inside the error boxes (red line) and the MHW error band (light blue). Slightly adjusted to the sea-level diagram (with years BP) in Nieuwhof & Vos (Reference Nieuwhof and Vos2018). The dashed green line is the corresponding part of the relative MSL curve of Meijles et al. (Reference Meijles, Kiden, Streurman, van der Plicht, Vos, Gehrels and Kopp2018) (centre line upper limit relative MSL) for the period 1500 BC–AD 250.

Discussion
Tidal range (TR) variations
To correlate the palaeo-MHW data with the contemporaneous MSL in meso- and macro-tidal basins, the tidal range needs to be established for these palaeosystems. The palaeo-TR may vary, however, from place to place and also through time as described above.
These changes can be differentiated in:
-
TR differences along the Dutch coastline.
-
Sub-recent TR differences caused by human interference in the coastal system.
-
Variation of the natural TR within one tidal basin.
Along the Dutch Wadden Sea the increase of the TR from Texel to the mouth of the Ems is c.1 m (Figs 7 and 8). This was also the situation in the past, at least for the last 6000 years (Van der Molen & De Swart, Reference van der Molen and de Swart2001). The elaboration of the SLIP data from the archaeological sites Ezinge, Englum and Wijnaldum-Tjitsma by Nieuwhof & Vos (Reference Nieuwhof and Vos2018) shows that during the Iron Age the palaeo-MHW level in NW Groningen was c.0.5 m higher than in NW Friesland. Nieuwhof & Vos (Reference Nieuwhof and Vos2018) hold the dissimilarity in TR along the Wadden Sea coast responsible for this difference in elevation.
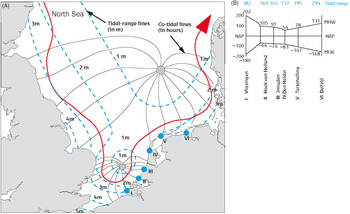
Differences in tidal ranges and the levels of high and low tide are related to the distance from the amphidromic point in the North Sea and to the morphology of the coastlines. (A) Circulation of the incoming tidal wave from the Atlantic Ocean around the two ‘amphidromic points’ in the North Sea. (B) Differences in the tidal range along the Dutch coast between the Westerschelde and the river Ems. From Vos (Reference Vos2015b: fig. 1.26).

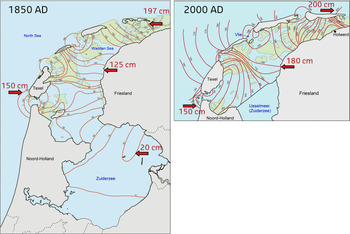
Tidal range lines before (after Rijkswaterstaat, 2013) and after the closure of the Zuiderzee by the Afsluitdijk in 1932 (after Klok & Schalkers, Reference Klok and Schalkers1980).

The tidal range along the Dutch coast varies by location (Fig. 7) and also over time. At the beginning of the Holocene, c.9000 years BP, the tidal range along the former coast was on average less than 1 m because of the shallowness of the North Sea at the time, which sharply decelerated the incoming tidal wave due to seabed resistance (Beets & Van der Spek, Reference Beets and van der Spek2000; Van der Molen & De Swart, Reference van der Molen and de Swart2001). During the Holocene the water depth of the North Sea increased, and from c.6000 BP the tidal range along the Dutch coast accordingly increased to the present values. The magnitude of the increase is not equal along the coast. It depends on the positions of the coastal locations relative to the two amphidromic points in the North Sea around which the tidal waves coming in from the Atlantic Ocean circulate (anticlockwise; Fig. 7). The present tidal range at the Belgian and German borders is more than 1.5 m larger than the tidal range in the central part of the Netherlands. Near Vlissingen the tidal range is c.3.5 m, near Den Helder c.1.4 m; further to the north, it increases again to c.2.3 m at the German border.
In the tidal basins of the Wadden Sea and the estuaries of the Ems (Vink et al., Reference Vink, Steffen, Reinhardt and Kaufmann2007) and Westerschelde (Vos & Van Heeringen, Reference Vos and van Heeringen1997) the tidal ranges vary due to the interplay between the incoming tidal wave and the morphology of the tidal system. Important factors which deform the tidal wave in the tidal systems are the resistance effect, the reflection effect and the flood-basin effect. Due to the resistance (or friction) effect, the incoming tidal wave is damped because of bottom friction of the seabed and damming-up of the tidal water along the edges of the system. The reflection effect (or convergence effect) is the amplification of the tidal wave due to resonance of the tidal wave in a funnel-shaped system (Martinius & Van den Berg, Reference Martinius and van den Berg2011). In a wide basin, the resistance or friction effect is relatively more important and induces an inland decrease of the tidal range from the mouth to the back of the system (hyposynchronous system; Fig. 9). In a funnel-shaped estuarine system – like the Westerschelde (Claessens, Reference Claessens1988; Coen, Reference Coen1988; Vos & van Heeringen, Reference Vos and van Heeringen1997) – the reflection (positive convergence) effect is more important, which leads to an increase of the tidal range land inward from the mouth of the system (hypersynchronous system).
Modification of the tidal range in a tidal basin and/or estuarine system with varying ratios of convergence (reflection) and friction (resistance) effects. Convergence promotes amplification, whereas friction results in damping of the incoming tidal wave (after Martinius & Van den Berg, Reference Martinius and van den Berg2011).

In the present Wadden Sea area, the convergence (reflection) effect is also relatively more important than the friction effect and causes an increase of the tidal range from the tidal inlets towards the watersheds. For example, at the Vlie tidal inlet between Vlieland and Terschelling, the TR is 1.8 m. This increases to 2.3 m at the watershed NW of Holwerd, a difference of 0.55 m (Rijkswaterstaat, 2013; Fig. 8).
An opposite process took place in the former Zuiderzee lagoon: the tidal wave was not amplified but reduced. This was the result of a negative resonant effect. The incoming tidal wave in the lagoonal basin was not in phase with the reflected outcoming tidal wave, which led to energy dissipation and a reduction of the tidal range. Due to the phase difference, water in the lagoonal basin still rose while the water at the sea entrance in the Wadden Sea already started to fall. The inertia of the water motion caused damping of the tide, the so-called ‘flood-basin effect’ (Van Veen, Reference van Veen1950; Van de Plassche, Reference van de Plassche1980; Vis et al., Reference Vis, Cohen, Westerhoff, Ten Veen, Hijma, Van der Spek, Vos, Shennan, Long and Horton2015). As a result of this process, the tidal range in the central part of the former Zuiderzee lagoon was damped up to 0.2 m (Fig. 8). A comparable reduction of the tidal range due to the flood-basin effect process took place in the Dollard basin after it came into being in 1509 (Vos & Bungenstock, Reference Vos and Bungenstock2013).
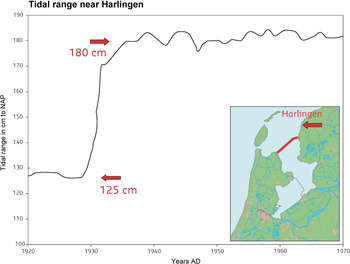
After the closure of the Zuiderzee by the Afsluitdijk in 1932, the energy dissipation of the tidal wave – due to the flood-basin effect – was stopped. Because of the blockade of the dike, the tidal range in the western Wadden Sea increased as a result of the reflection effect. Before dike construction, the tidal range near Harlingen was 1.25 m (Klok & Schalkers, Reference Klok and Schalkers1980), but after the completion of the dike the tidal range rose to 1.8 m, an increase of 0.55 m (Figs 8 and 10).
Increase of the tidal range near Harlingen of c.0.55 m, after the closure of the Zuiderzee by the Afsluitdijk in 1932 (after Klok & Schalkers, Reference Klok and Schalkers1980).

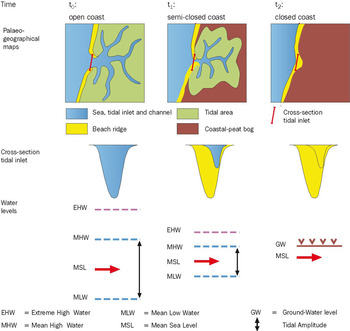
The most extreme situation of tidal reduction occurs when a tidal basin has silted up completely in the past and is closed off from the open sea by a barrier system. An example is the Westfrisian tidal-inlet system in the province of Noord-Holland during the Bronze Age (Vos, Reference Vos2015b). As a result of silting up, the tidal wave was increasingly damped by the friction effect, and due to that, the tidal range and elevations of the MHW and EHW (Extreme High Water, or maximum storm-flood level) decreased (Fig. 11). After the complete closure c.1400 BC, the tidal range in the system dropped to zero and groundwater level rose, leading to peat growth in the former basin.
Accretion model of a former tidal basin as the sea level rises. Accretion reduces the tidal volume and the maximum tidal heights (EHW and MHW) decline, making the dried-up salt marsh suitable for permanent habitation, whereas the RSL is still rising (from Vos, Reference Vos, de Koning and van Eerden2015).

The extent to which the incoming tidal wave and tidal range in tidal basins and estuaries is deformed by the resistance effect and the reflection effect depends on the morphologies of the systems. Within single tidal basins, the tidal range can also fluctuate over time, due to changes in the morphology of the system. To convert a palaeo-MHW curve to a palaeo-MLS curve in a meso- to macrotidal system, palaeochanges in tidal range need to be taken into account (e.g. Vink et al., Reference Vink, Steffen, Reinhardt and Kaufmann2007).
Between 1000 BC and AD 100, the morphology of the funnel-shaped tidal basin of the former Boorne and connecting part of the Wadden Sea also changed. The Boorne basin silted up whereupon its function in draining the salt marsh and peat hinterland was taken over by the Middelzee inlet (Fig. 1). Large morphological changes also occurred in the surrounding area. Around 400 BC (Vos et al., Reference Vos, de Koning and van Eerden2015), the Flevo lakes in the present IJsselmeer region became connected to the Wadden Sea, which led to the emergence of the Zuiderzee. In the 1st millennium AD, the main tidal inlet was the Vlie but in the 2nd millennium the Marsdiep, between the island of Texel and the mainland, became the main entrance to the Zuiderzee.
These changes will have affected the former TR in place and time in the Boorne basin, probably in the order of decimetres. Recent observations in the western Wadden Sea indicate that the difference in TR between the Vlie tidal inlet and Holwerd is 0.5 m (from 1.8 to 2.3 m; Fig. 8) due to the convergence effect (Fig. 10). This implies that the tidal amplitude from the Vlie in the direction of Holwerd increases by 0.25 m (TA = 1/2TR). Westward of the former Boorne basin, the lagoonal basin of the Zuiderzee grew over the last 2500 years. In this area, the tidal range was dampened due to the flood-basin effect (Fig. 8).
Palaeo-MHW conversion to palaeo-MSL
The observed recent differences in MHW in the Wadden Sea cannot automatically be transferred to the palaeosituation of the Boorne tidal system, as is clear from the above. The present TR at the tidal inlet of De Vlie is 1.8 m (TA of 0.9 m) (Fig. 8). Also during the Iron Age, this TR value can be expected because the TR did not change much at the location of the inlet (compare Fig. 1, 1500 BC and 500 BC with Fig. 8, AD 2000). However, within the former tidal Boorne basin the deformation of the tidal wave is uncertain. A variation in TR of several decimetres negative (due to the flood-basin effect of the nearby Zuiderzee west of Westergo) or positive (convergence effect of the funnel-shaped basin) has to be taken into account. A variation in TR of several decimetres is quite significant for the RSLR of the last 3000 years, which was between 0.05 and 0.20 m per century (Meijles et al., Reference Meijles, Kiden, Streurman, van der Plicht, Vos, Gehrels and Kopp2018). Based on our data in the Westergo area (Fig. 6), the palaeo-MHW rose between 1200 BC and 100 AD from c.1.8 m to 0.3 m −NAP, a mean palaeo-MHW sea-level rise of c.0.12 m per century.
To convert the MHW curve of Westergo to a MSL curve, a drop of the MHW curve by 0.90 ± 0.20 m might be reasonable. These values are estimated and based on the current tidal range for the western Wadden Sea, as argued above. If we compare our palaeo-MHW curve of Westergo with the MSL curve of the northern Netherlands for the period 1200 BC–AD 100 as presented by Meijles et al. (Reference Meijles, Kiden, Streurman, van der Plicht, Vos, Gehrels and Kopp2018; Fig. 6), it is striking that the older part of the MSL curve of Meijles et al. (Reference Meijles, Kiden, Streurman, van der Plicht, Vos, Gehrels and Kopp2018) is positioned on or above the MHW curve of Westergo, while it should be c.0.9 m below the Westergo curve. The MSL SLIPs of Meijles et al. (Reference Meijles, Kiden, Streurman, van der Plicht, Vos, Gehrels and Kopp2018) for the period 1200 BC–AD 100 are derived from peat samples of the barrier islands in the western Wadden Sea. The indicative altitude might therefore be overestimated due to the raised groundwater effect – as those authors indicate – and therefore be closer to or even above palaeo-MHW.
The error envelope of the Westergo palaeo-MHW diagram allows a fluctuating curve with differences in elevation on the scale of decimetres. Fluctuations might be caused by alternations of the TR within the former tidal basin, or by other factors that affect the RSLR such as glacio- and hydro-isostasy and the ocean geoid (Kiden et al., Reference Kiden, Denys and Johnston2002; Bungenstock & Weerts, Reference Bungenstock and Weerts2010). However, possible fluctuations cannot be substantiated with current data.
How the negative effect (flood basin effect of the Zuiderzee) at the west side of Westergo and the positive effect (convergence effect in the funnel-shaped basin) influenced the tidal range in the former Boorne basin in the past is not clear from this qualitative approach. A model-based approach is better suited to get a grip on the spatial and temporal changes in the tidal configuration. A palaeotidal modelling effort can help refine the indicative range and hence can reduce the uncertainty around the relationship between a SLI and palaeo-sea level (Vermeersen et al., Reference Vermeersen, Slangen, Gerkema, Baart, Cohen, Dangendorf, Duran-Matute, Frederikse, Grinsted, Hijma, Jevrejeva, Kiden, Kleinherenbrink, Meijles, Palmer, Rietbroek, Riva, Schulz, Slobbe, Simpson, Sterlini, Stocchi, van de Wal and van der Wegen2018). A quantitative option to reconstruct the palaeo-TR changes in the Boorne tidal basin is to work with 3D simulation models (Van de Lageweg et al., Reference van de Lageweg, Braat, Parsons and Kleinhans2018). Such simulation models could be created for the region of Westergo on the basis of the existing geological and archaeological and palaeogeographical data (Fig. 1), and different simulation scenarios for different time steps of the changing tidal basin could thus be tested.
Conclusions
In this study we reconstructed the palaeo-MHW for the period between 1200 BC and AD 100 of the coastal region of Westergo (NW Friesland). Sea-level data for this area were available thanks to the palaeolandscape research which was carried out within a geoarchaeological context.
Collected marine shells in the top of the tidal-flat deposits show that they can be used as a proxy to reconstruct the palaeo-MHW in tidal basins. These data make it possible to construct a MWH curve for Westergo, the former Boorne system, between 1200 BC and AD 100. In this period the palaeo-MHW rose from c.1.8 m to 0.3 m −NAP, a MSL rise of c.0.12 m per century.
The conversion of these palaeo-MHW data to MSL needs to take differences in TR into account. The elevation of the MHW on the same tidal datum is different for the different tidal basins of the Wadden Sea area and may also fluctuate within a single tidal basin. Along the coastline of the Wadden Sea, the tidal range increases from the Marsdiep to the mouth of the Ems by c.1 m. This run-up of the tidal range from west to east (larger tidal range in NW Groningen and thus a higher top of the tidal-flat deposits in that area) is held responsible for the measured elevation difference between the palaeo-MHW in NW Groningen and NW Friesland of c.0.5 m during the Iron Age.
Taking as a point of departure the present TR at the tidal inlet of De Vlie of 1.8 m, we assume that the MSL is 0.90 ± 0.20 m lower than the MHW curve of Westergo. The older part of the MSL curve of the northern Netherlands for the period 1200 BC–AD 100, however, is located on or above the MHW curve of Westergo (Fig. 6), while it should be c.0.9 m below the Westergo curve. The indicative altitude of the MSL SLIPs (base of the peat layer on coastal barrier sand of the western Wadden Sea) must have been overestimated. The raised groundwater effect of peat growth on coastal barrier sand is the most plausible explanation of this phenomenon.
From comparison with recent tidal basins in the Wadden Sea, we know that changes in tidal range at the same tidal datum in a single palaeotidal basin can amount to at least a couple of decimetres. This is a significant factor for the RSLR of the last 3000 years, which was between 0.05 and 0.20 m per century. Therefore, alternating TR values – due to variations of the convergence, friction and flood-basin effects in the past – did probably affect the palaeo-MHW curve of Westergo. To learn more about the possible fluctuations in the curve, more palaeo-MHW SLIP data are needed for this region.
Besides more RSL data, palaeosimulation models – based on palaeogeographic studies – are recommended for future research. They are helpful tools to obtain more insights not only into possible changes in the tidal range of palaeotidal systems, but also into other forcing factors that created morphological changes in the past. These insights are needed to translate the measured palaeo-MHW data into a reliable palaeo-MSL curve.
Acknowledgements
We thank the Province of Friesland, in particular Gilles de Langen, for supporting and funding this research, and all the archaeologists who contributed to it, especially the excavation leaders (Danny Gerrets, Johan Nicolay, Theun Varwijk, Marco Bakker, Elma Schrijer, Wouter Waldus).
We are very grateful to our colleagues Sieb de Vries, for assistance with the palaeogeographical maps, and Roel Savert and Nik Trabucho for their support in creating the figures. We thank Kay Koster for reading and improving an earlier version of the manuscript, and two anonymous reviewers for their valuable comments on the paper.


 Open access