


In recent years, internet-based interventions (IBI) for mental health disorders have become an integral part of research and practice, with the ongoing pandemic reinforcing this development (Lange, Reference Lange2021; Mahoney et al., Reference Mahoney, Elders, Li, David, Haskelberg, Guiney and Millard2021). For patients suffering from mild to moderate depression, IBIs are generally effective and achieve similar effect sizes as their face-to-face counterparts (Andrews et al., Reference Andrews, Basu, Cuijpers, Craske, McEvoy, English and Newby2018; Carlbring, Andersson, Cuijpers, Riper, & Hedman-Lagerlöf, Reference Carlbring, Andersson, Cuijpers, Riper and Hedman-Lagerlöf2018). However, a recent meta-analysis revealed that only 37% of participants showed a reliable response (Cuijpers et al., Reference Cuijpers, Karyotaki, Ciharova, Miguel, Noma and Furukawa2021). Thus, 73% of participants show no meaningful improvements. The large rates of non-response are highly problematic both from a patient's and an economic perspective.
One approach to improve response rates is to optimize treatment selection through data-informed personalization of mental health care, also called precision therapy (Chekroud et al., Reference Chekroud, Bondar, Delgadillo, Doherty, Wasil, Fokkema and Choi2021; Salazar de Pablo et al., Reference Salazar de Pablo, Studerus, Vaquerizo-Serrano, Irving, Catalan, Oliver and Fusar-Poli2021). The idea behind it is to overcome the current ‘trial and error’-approach to treatment selection by identifying the ideal treatment for an individual based on what helped other individuals with similar characteristics in the past. To ensure an accurate fit (i.e. identify the treatment with the highest probability of effectiveness), these characteristics should ideally cover an exhaustive range of information – one reason why precision therapy goes hand-in-hand with machine learning methods.
Machine learning (ML) generally refers to the application of algorithms to large datasets to automatically learn patterns and identify relevant features for predicting the outcome of interest (here: non-response). These algorithms vary in their complexity and thus their interpretability – from simple linear models to highly complex multi-level approaches like convolutional neural networks. They can be used to predict an unobserved target variable (supervised learning), e.g. predicting antidepressant treatment response (Zhdanov et al., Reference Zhdanov, Atluri, Wong, Vaghei, Daskalakis, Blumberger and Farzan2020), or find clusters in unlabeled data (unsupervised learning), e.g. identify different types of treatment engagement (Chien et al., Reference Chien, Enrique, Palacios, Regan, Keegan, Carter and Belgrave2020). Compared to conventional statistical methods, most ML models can depict complex interactions and nonlinearities in heterogeneous or noisy datasets.
First studies in face-to-face treatment contexts already demonstrated that ML models trained on patient characteristics can outperform human experts in selecting suitable treatments or predicting responses (Koutsouleris et al., Reference Koutsouleris, Kambeitz-Ilankovic, Ruhrmann, Rosen, Ruef and Dwyer2018; van Bronswijk, Lemmens, Huibers, & Peeters, Reference van Bronswijk, Lemmens, Huibers and Peeters2021), pointing out its potential usefulness. Internet-based interventions might be particularly well-suited for applying ML approaches. First, their high scalability makes it easier to gather large amounts of data necessary to train those predictive algorithms. Second, common and specific factors (e.g. applied techniques, communication between patient and therapist) are often highly standardized, allowing a more precise matching of patient features to treatment components. Moreover, it is easily possible to gather variables depicting the therapeutic process (e.g. time of assessment completion, number of logins) that might represent a fruitful extension to the set of self-report features.
To date, only a few studies have attempted to develop prognostic models in IBI targeting depressive symptoms. They achieved mixed results, and comparisons are hampered by differing definitions of treatment outcomes, sample sizes, and reported metrics of predictive capability. Wallert et al. (Reference Wallert, Boberg, Kaldo, Mataix-Cols, Flygare, Crowley and Rück2022) tested three ML algorithms to predict remission following a 12-week internet-based CBT program for depression. Their best classifier correctly identified 66% of individuals as remitters or non-remitters, exploiting self-report, process, and genetic variables collected pre-treatment. The area under the curve (AUC) was 0.69, which can be considered close to fair, according to Bone et al. (Reference Bone, Simmonds-Buckley, Thwaites, Sandford, Merzhvynska, Rubel and Delgadillo2021). Nemesure, Heinz, McFadden, and Jacobson (Reference Nemesure, Heinz, McFadden and Jacobson2021) report an AUC of 0.75 predicting response to a 9-week internet-based physical activity intervention for major depressive disorder with demographic, symptom-related, and healthcare utilization data. However, the results should be interpreted cautiously, given the small training sample of n = 24 participants. Finally, Pearson, Pisner, Meyer, Shumake, and Beevers (Reference Pearson, Pisner, Meyer, Shumake and Beevers2019) investigated whether an ensemble of ML algorithms trained on baseline self-report measures, usage data, and environmental context variables (e.g. access to mental healthcare providers) explain more variance in depressive symptoms after 8-weeks of internet-based CBT than a linear regression model using only pre-treatment symptom scores. The explained variance increased only marginally from 0.17 to 0.25.
To summarize, it remains unclear whether the prediction of non-response beyond moderate accuracy levels can be achieved with patient intake characteristics alone in IBIs for depression. However, integrating features from the early stages of treatment might provide incremental information. For example, early symptom changes were predictive of non-response in IBI targeting depression, anxiety, and panic disorder (Beard & Delgadillo, Reference Beard and Delgadillo2019; Forsell et al., Reference Forsell, Isacsson, Blom, Jernelöv, Ben Abdesslem, Lindefors and Kaldo2020; Schibbye et al., Reference Schibbye, Ghaderi, Ljótsson, Hedman, Lindefors, Rück and Kaldo2014). Bone et al. (Reference Bone, Simmonds-Buckley, Thwaites, Sandford, Merzhvynska, Rubel and Delgadillo2021) found that gradually (i.e. on a weekly base) incorporating patient information improved therapy outcome prediction of different ML models, especially in the early phases of treatment.
Identifying non-responders before treatment initiation would be ideal for preventing treatment failures and increasing cost-effectiveness. Still, it was shown that the treatment adaptation for patients identified as at risk of non-response after 3 weeks of internet-based CBT for insomnia could still significantly improve therapy effects (Forsell et al., Reference Forsell, Jernelöv, Blom, Kraepelien, Svanborg, Andersson and Kaldo2019). If baseline features are insufficient to develop clinically trustworthy models, incorporating features gathered during the first weeks of therapy to increase predictive performance and potentially adjust treatment could still benefit patients and providers.
The current study uses data from a 6-week CBT-based IBI for adults with mild to moderate depression. All participants filled out a range of questionnaires at intake, covering empirically corroborated predictors like treatment expectancy, self-efficacy, and symptom severity. They further provided weekly self-reports of depressive symptoms, cognitive distortions, and therapeutic alliance, resulting in a rich set of candidate predictors. We aimed to examine if the prediction of non-response can be achieved using easily accessible process and self-report data gathered (a) at baseline or (b) in an early stage of treatment. We hypothesized that integrating self-report data from early treatment stages would significantly improve predictive performance compared to the models trained on baseline features only.
Methods
Dataset
The data we used for model training was obtained as part of a Germany-wide study analyzing the effects of different treatment sequences in a guided, CBT-based IBI for mild to moderate depression (Brose et al., Reference Brose, Heinrich, Bohn, Kampisiou, Zagorscak and Knaevelsrud2023a). The intervention was developed in cooperation with a German public healthcare provider. It contains seven standardized modules, covering established cognitive-behavioral methods like psychoeducation and expressive writing, and established CBT methods such as behavioral activation (e.g. daily planner, diary of positive events) and cognitive restructuring (e.g. negativity bias training, positive imagery). Study eligibility was verified using the participant's medical records, online assessments, and the structured clinical interview for DSM-IV (SCID-I, sections A through F; Wittchen, Zaudig, and Fydrich, Reference Wittchen, Zaudig and Fydrich1997) conducted via telephone by trained interviewers. Inclusion criteria comprised a 14–28 on Beck's Depression Inventory-II (BDI-II; Hautzinger, Keller, and Kühner, Reference Hautzinger, Keller and Kühner2006), indicating mild to moderate depression and computer-based internet access. Exclusion criteria were (1) a current mania or hypomania, (2) psychotic symptoms (lifetime), and (3) risk of suicide (score of 1 on BDI-II item 9). Participants assessed eligible were randomly assigned to one of two study conditions, that differed in the order of presented modules (they either started with positive behavioral activation or cognitive restructuring) and allocated to a trained counselor. For more details on study onboarding and experimental conditions, see Brose et al. (Reference Brose, Heinrich, Bohn, Kampisiou, Zagorscak and Knaevelsrud2023a). Participants completed approximately one module per week over the course of 6–8 weeks, with each module consisting of (1) a feedback letter from their respective counselor, (2) psychoeducation, (3) introduction to an exercise or homework, and (4) the introduced online exercise. To measure depressive symptomatology on a weekly basis, the Patient Health Questionnaire-9 (PHQ-9; Kroenke, Spitzer, & Williams, Reference Kroenke, Spitzer and Williams2001) was assessed before every intervention module. The PHQ-9 is a validated instrument to measure depression severity, consisting of nine items that can be scored from zero to three. Only participants who completed the intervention and filled out the post-assessment were included in this analysis. All subjects provided their written informed consent for data collection and analysis. the study protocol was approved by the Ethics Committee of Freie Universität Berlin prior to recruitment start (processing sign: 125/ 2016).
Features and outcome
The full set of features is listed in Online Supplementary Table 1.
Before treatment started, participants completed a comprehensive set of questionnaires. These covered demographics, disorder-related clinical symptom scales (e.g. cognitive distortions, self-efficacy beliefs), (psycho-) social and functional circumstances (e.g. social support, healthcare usage), life aims and values, as well as treatment expectations. Questionnaire features were included on a single-item level and as aggregated scores. Beyond that, the presence of a current or remitted depressive or dysthymic episode and changes in medication within the last 6 weeks before starting to work with the intervention, as assessed by the SCID-I interview, were included as predictors.
At the beginning of week 2 (i.e. M3), participants filled out the PHQ-9, the Cognitive Style Assessment measuring cognitive distortions (COSTA; Bohn et al., Reference Bohn, Heinrich, Brose, Knaevelsrud and Zagorscak2022) and the Scale for the Multiperspective Assessment of General Change Mechanisms in Psychotherapy assessing the therapeutic relationship (SEWIP; Mander et al., Reference Mander, Wittorf, Schlarb, Hautzinger, Zipfel and Sammet2013). These were added to the set of baseline features as single items and sum scores. In addition, we implemented early change scores for PHQ-9 and COSTA by subtracting baseline sum scores from week 2 sum scores.
Process features encompassed the registration year, study variant, and if treatment overlapped with the first wave of infections within the global SARS-CoV-2 pandemic (yes/no).
As our outcome variable, we implemented the binary criterion of reliable and clinically significant change on PHQ-9 (yes/no), in accordance with Jacobson and Truax criteria (Jacobson & Truax, Reference Jacobson and Truax1992). Accordingly, we defined individuals with an improvement of ≥5 points and a sub-clinical post-PHQ-9 score of <10 as responders (group = 0) and everyone else as non-responders (group = 1).
Data preparation and partitioning
Data preparation was done in Jupyter Notebook and Visual Studio Code, using Python v. 3.7.4 and the Python packages pandas v. 0.25.1 and scikit-learn v 0.0.24.1. All advanced analyses were performed using the packages scikit-learn v 0.0.24.1 and numpy v. 1.19.5.
The original sample consisted of 2304 participants. We first removed all participants with missing values on one of the PHQ-post (28.7% from total) or PHQ-M3 (11.8% from total) items, leaving a sample of 1591 records for model training and validation. Missing values on the remaining features amounted to max. 2.8% and were imputed by either mean or mode depending on the respective data type. Categorical features with no clear ordering (e.g. assigned counselor, recruitment strategy) were one-hot encoded, creating binary variables that indicate the presence or absence of a certain category. Aggregating categories reduced high feature cardinality. Features representing clinical symptom scale items were reverse-scored and/or aggregated if indicated in the respective manual. Finally, continuous features like age and minutes of daily internet usage were centered and scaled. The final datasets contained 213 (baseline) and 260 (early change) features, respectively.
For cross-validation and to avoid overfitting and bias, a train-test split of 80/20 was employed. Due to a small class imbalance favoring responders, we performed down sampling of the majority class, leaving 1270 records for training and 318 records for model validation. Since generalization performance is strongly dependent on the respective train-test partitioning (Orrù, Monaro, Conversano, Gemignani, & Sartori, Reference Orrù, Monaro, Conversano, Gemignani and Sartori2020), we performed 100 iterations of our ML pipeline with independent train-test splits per iteration as done by Hilbert et al. (Reference Hilbert, Jacobi, Kunas, Elsner, Reuter, Lueken and Kathmann2021). Model performance is therefore reported as mean across all 100 iterations, including range and standard deviations. Since we were mainly interested in correctly identifying non-responders, our main performance measure, also used for feature selection and hyperparameter tuning, is recall (also known as sensitivity, i.e. the proportion of correctly identified non-responders). To allow comparison with other studies, we further report balanced accuracy (i.e. the arithmetic mean of recall/sensitivity and specificity), AUC (i.e. the probability that the model will correctly distinguish between true negatives and true positives), and f1 scores (i.e. the harmonic mean of recall/sensitivity and precision).
Model versions and machine learning pipeline
We chose a random forests (RF) classifier to develop our predictive models, as it can automatically deal with nonlinearities and higher-order interaction effects, has been demonstrated to be robust against bias, and is a commonly used model in studies predicting therapy outcomes (Breiman, Reference Breiman2001). Four versions of random forest classifiers were compared against two simpler benchmark models, a linear main-effects logistic regression (C = 1.0) predicting non-response using (1) baseline PHQ-9 sum scores or (2) the PHQ-9 early change score.
To determine the impact of including early treatment information, we contrasted models including baseline characteristics only or baseline plus early treatment characteristics. Further, we compared different model pipelines by applying either no feature selection or hyperparameter tuning or applying both feature selection using Elastic Net (L1-penalty = 0.5, max_iter = 1000) and random search hyperparameter tuning (Bergstra & Bengio, Reference Bergstra and Bengio2012) using nested cross-validation with five folds and 100 iterations. This resulted in the following models:
1. RF with baseline features; no feature selection or hyperparameter tuning.
2. RF with baseline features; feature selection and hyperparameter tuning.
3. RF with baseline and early treatment features; no feature selection or hyperparameter tuning.
4. RF with baseline and early treatment features; feature selection and hyperparameter tuning.
To compare those models with our benchmark, we implemented corrected resampled t-tests (Nadeau & Bengio, Reference Nadeau and Bengio2003).
We report the mean number of features chosen by automatic feature selection, as well as the 10 most important features ranked by their Gini impurity index (or mean decrease impurity: measures the weighted average of uncertainty reduction achieved by the respective feature across trees) and number of occurrences across 100 iterations in case of feature selection.
Results
Sample characteristics
Sociodemographic, clinical, and process features per outcome group (reliable and clinically significant change from pre-to post-treatment yes/no) are depicted in Table 1. Among participants with complete PHQ-9 scores, 50.09% (797/1591) fulfilled the criteria for reliable and clinically significant improvement from pre- to post-treatment. Participants categorized as non-responders reported higher unemployment rates but fewer days of sick leave, as well as doctor visits within the last 4 weeks before treatment. Concerning clinical features, participants fulfilling criteria for reliable and clinically significant change scored significantly higher on baseline sum scores of PHQ-9, BDI-II, GAD, and PATHEV – hope. Furthermore, they were less likely to fulfill the criteria for dysthymia as determined in the SCID interview pre-treatment. In turn, they show significantly lower week two sum scores of PHQ-9 and COSTA and significantly higher therapeutic alliances as indicated by higher SEWIP sum scores at week 2. Apart from that, there were no significant differences between outcome groups.
Patient summary characteristics stratified by treatment outcome

Notes. aTwo-sample t test, bChi-squared test, cKruskal–Wallis test, dTI = expert rating from telephone interview, eStudy version: PAF = positive activities module first; CRF: cognitive restructuring module first.
p-values meeting the criterion of p < 0.05 are highlighted in bold.
Model performance
All ML models predicted non-response with above-chance accuracies (see Fig. 1). Models incorporating early symptom developments (RF early) performed significantly better than models trained solely on baseline features and then both benchmark models. They achieved recall scores of 0.76 (s.d. = 0.04) and 0.75 (s.d. = 0.04) correctly identified non-responders, using the full or an automatically reduced set of features respectively (for an overview of evaluation metrics see Table 2).
Comparison of model performance in identifying non-response.
Notes: The dashed line indicates chance level. RF, random forest; base, pre-treatment features only; early, features from the beginning of week 2 were incorporated; LogReg base, logistic regression using the baseline PHQ sum; LogReg EC, logistic regression using PHQ difference from baseline to week 2 (early change)

Outcomes by model type averaged across 100 iterations
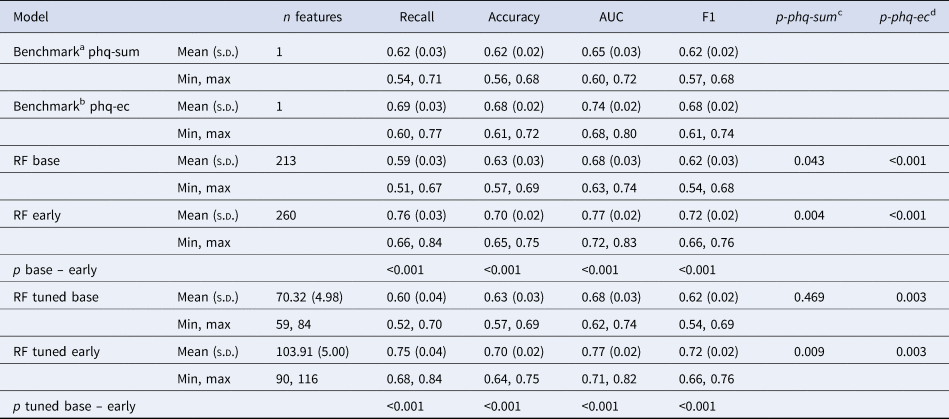
Notes: aA logistic regression predicting non-response using baseline PHQ-9 sum scores; bA logistic regression predicting non-response using PHQ-9 early change; cStatisical comparison of recall scores with the baseline PHQ sum benchmark using corrected resampled t tests; dStatisical comparison of recall scores with the PHQ early change benchmark using corrected resampled t tests; SD, standard deviation; RF, random forest.
With recall scores of 0.59 and 0.60, respectively our baseline models performed descriptively worse than our benchmark trained on baseline PHQ-9 sum scores (recall = 0.62, s.d. = 0.03) and significantly worse than the benchmark using early change scores (recall = 0.69, s.d. = 0.03, p < 0.001).
We observed similar predictive performances between models using the same set of features, indicating no disadvantages for the models involving automatic feature selection and thus, only around a third of the available variables. Figure 2 compares ROC curves from the RF early model including feature selection and hyperparameter tuning to the mean ROC of the benchmark using early change.
ROC curves for the random forest model involving early treatment features, hyperparameter tuning and automatic feature selection.
Notes: The dashed line indicates chance level. The bold line indicates the averaged ROC across 100 iterations for the random forest model. The bold dotted line indicated the averages ROC across 100 iterations for the benchmark model trained on PHQ early-change. RF, random forest; AUC, area under the curve; SD, standard deviation.

The 10 most important features, ranked by their Gini impurity index, are depicted in Fig. 3 topped by information on their occurrence across the 100 iterations. Among the most important features were early treatment information, like therapeutic alliance (SEWIP items 1 and 4) and early change on PHQ-9. Beyond that, baseline information on cognitive distortions (COSTA items 1, 5, and 6), anxiety (GAD items 4 and 5), and symptom severity (PHQ-9 sum) ranked comparatively important.
The 10 most important features for the random forest involving early treatment features, hyperparameter tuning and feature selection.
Notes: Importance is computed by the Gini impurity index averaged across iterations. The numbers above the bars indicate the amount of rounds the feature has been selected by automatic feature selection. There were 100 iterations in total.

Discussion
The present paper tested an ML-based approach to predict non-response in participants of a CBT-based IBI for depression. We found that fair prediction (e.g. accuracies >0.70) could only be reached when information on early treatment stages was included.
Models relying exclusively on information assessed before the intervention reached only moderate performance that even a benchmark model using only baseline PHQ-9 sum scores exceeded. This moderate predictive performance lags behind other studies predicting IBI outcomes using pre-treatment features only, like those of Nemesure et al. (Reference Nemesure, Heinz, McFadden and Jacobson2021) and Wallert et al. (Reference Wallert, Boberg, Kaldo, Mataix-Cols, Flygare, Crowley and Rück2022), which may in part be explained by our more basic Random Forest algorithm – both studies implemented advanced ensembling approaches like XGBoost (Chen & Guestrin, Reference Chen and Guestrin2016). On the other hand, studies often find similar performances for algorithms of varying complexity, especially in low-dimensional data like self-report variables (e.g. Hilbert et al., Reference Hilbert, Jacobi, Kunas, Elsner, Reuter, Lueken and Kathmann2021). Further, larger sample sizes tend to produce more robust and generalizable ML models (e.g. Luedtke, Sadikova, & Kessler, Reference Luedtke, Sadikova and Kessler2019). Finally, studies from face-to-face therapy settings with comparable study protocols (i.e. baseline features, comprehensive samples of patients, ML models of varying complexity) also fail to exceed moderate thresholds of outcome prediction (Hilbert et al., Reference Hilbert, Jacobi, Kunas, Elsner, Reuter, Lueken and Kathmann2021).
In line with our hypothesis, both models incorporating information from the early stages of therapy (e.g. depressive symptoms, therapeutic relationship, and cognitive distortions following 2 weeks of treatment) achieved the best accuracy in identifying non-responders. The tuned model, involving hyperparameter tuning and automatic feature selection, performed only slightly worse using around a third of the original feature stack, making it the preferred choice for implementation. Our findings align well with the study by Bone et al. (Reference Bone, Simmonds-Buckley, Thwaites, Sandford, Merzhvynska, Rubel and Delgadillo2021): they repeatedly trained machine learning algorithms on weekly symptom measures to predict response to psychotherapy for depression and anxiety. Predictive performance was moderate at baseline and improved with each passing week, with a particularly prominent rise in the early phase (i.e. the first 2–3 weeks of therapy). Beyond that, Brose et al. (Reference Brose, Koval, Heinrich, Zagorscak, Bohn and Knaevelsrud2023b), using the same data set, found that early symptom change and symptom variability are related to changes in BDI-II scores from pre- to post-test.
When it comes to integrating predictive algorithms into routine care, information from early phases of treatment may be necessary to reach beneficial and trustworthy accuracies for both patients and therapists. Thus, treatment adaptation – instead of a priori selection – may constitute a promising avenue forward. This could take the form of a stepped care approach: patients start with a low-threshold approach like the (un-)guided internet-based interventions. Then, after a certain part of the treatment has been completed, an outcome prognosis is made based on pre-treatment assessments and information concerning the treatment progress. Consequently, treatment is either adapted to increase the chance of a beneficial outcome or continued consistently when a beneficial outcome is likely.
The improving access to psychological therapy programs in England followed a similar approach by implementing progressive care (i.e. all patients start with a low-intensity treatment, and intensity is increased if necessary; Boyd, Baker, & Reilly, Reference Boyd, Baker and Reilly2019). They evaluated that this approach led to higher recovery rates than a stratified model of care (i.e. the therapist selects treatment form based on pre-treatment symptom severity). To increase the usefulness of such an adaptive approach, future studies should also focus on modifiable predictors, providing therapists instructions on how to proceed in case of imminent non-response. Beyond that, one could include ecological momentary assessments and passive sensing as features to enhance informative density while keeping costs and expenses low (Zarate, Stavropoulos, Ball, de Sena Collier, & Jacobson, Reference Zarate, Stavropoulos, Ball, de Sena Collier and Jacobson2022).
Our study has several limitations. First, we had to remove around 30% of our original sample due to missing data in the outcome variable. Since we do not know the mechanism of missingness (i.e. the proportion of data points not missing at random) this significant minority might influence the generalizability of our algorithm. As we were conducting secondary data analysis, we used all available features instead of selecting predictors based on domain knowledge. Carefully selecting relevant predictors based on domain knowledge may help to improve prediction accuracy (Salazar de Pablo et al., Reference Salazar de Pablo, Studerus, Vaquerizo-Serrano, Irving, Catalan, Oliver and Fusar-Poli2021). Further, we could not externally validate our algorithms in another IBI for depression. Thus, it is unclear whether our results only hold for this specific program or generalize to other IBI and therapy formats. Finally, clinical usefulness must be more thoroughly answered before applying these prediction models in real-world practice. Here, trials comparing ‘precision therapy’ (i.e. therapists following algorithm-supported decision tools) against treatment as usual regarding patient-related risks and benefits and health-economic aspects are urgently needed.
Supplementary material
The supplementary material for this article can be found at https://doi.org/10.1017/S0033291723003537.
Competing interests
The authors declare none.


 Open access