


1. Introduction
There is a growing body of literature recognizing that the commonly used transition from thick-skinned dominated regions in the orogenic hinterlands to purely thin-skinned dominated regions in adjacent forelands does not reflect the heterogeneous degree of crustal coupling observed in fold-and-thrust belts (FTB) worldwide (e.g. Cooper, Reference Cooper, Ries, Butler and Graham2007; Goofey et al. Reference Goofey, Craig, Needham, Scott, Goofey, Craig, Needham and Scott2010). Compelling evidence for mixed modes of deformation taking place at different places and times for one single FTB have been undoubtedly recognized (e.g. Salas et al. Reference Salas, Guimerà, Mas, Martín-Closas, Meléndez, Alonso, Ziegler, Cavazza, Robertson and Crasquin-Soleau2001; Lacombe & Mouthereau, Reference Lacombe and Mouthereau2002; Mouthereau et al. Reference Mouthereau, Deffontaines, Lacombe, Angelier, Byrne and Liu2002; Lacombe, Mouthereau & Angelier, Reference Lacombe, Mouthereau and Angelier2003; Butler & Mazzoli, Reference Butler, Mazzoli, Mazzoli and Butler2006; Butler, Tavarnelli & Grasso, Reference Butler, Tavarnelli and Grasso2006). The fundamental factors controlling the degree of crustal coupling within FTB are: (1) the presence and distribution of efficient decollement levels (e.g. Davis & Engelder, Reference Davis and Engelder1985; Macedo & Marshak, Reference Macedo and Marshak1999; Carola et al. Reference Carola, Tavani, Ferrer, Granado, Quintà, Butillé, Muñoz, Nemčok, Mora and Cosgrove2013; Farzipour-Saein, Nilfouroushan & Koyi, Reference Farzipour-Saein, Nilfouroushan and Koyi2013; Muñoz et al. Reference Muñoz, Beamund, Fernández, Arbués, Dinarès-Turell and Poblet2013); (2) the inheritance of rift-related structures and amount of convergence (e.g. Desegaulx, Kooi & Cloetingh, Reference Desegaulx, Kooi and Cloetingh1991; Macedo & Marshak, Reference Macedo and Marshak1999; Marshak, Reference Marshak and McClay2004; Butler, Tavarnelli & Grasso, Reference Butler, Tavarnelli and Grasso2006; Brown et al. Reference Brown, Álvarez-Marrón, Schimmel, Wu and Camanni2012); (3) the orientation and magnitude of the stress field as well as the strain rate (e.g. Rebaï, Philip & Taboada, Reference Rebaï, Philip and Taboada1992; Ziegler, Cloetingh & van Wees, Reference Ziegler, Cloetingh and van Wees1995; Vernant et al. Reference Vernant, Nilforoushan, Hatzfeld, Abbasi, Vigny, Masson, Nankali, Martinod, Ashtiani, Bayer, Tavakoli and Chéry2004; Zoback, Reference Zoback2010); and (4) the integrated lithospheric strength profile as well as its evolution through time (e.g. Burov & Diament, Reference Burov and Diament1995; Ziegler, Cloetingh & van Wees, Reference Ziegler, Cloetingh and van Wees1995; Cloetingh & Burov, Reference Cloetingh and Burov1996; Ziegler, van Wees & Cloetingh, Reference Ziegler, van Wees and Cloetingh1998; Ziegler et al. Reference Ziegler, Cloetingh, Guiraud, Stampfli, Ziegler, Cavazza, Robertson and Crasquin-Soleau2001; Watts & Burov, Reference Watts and Burov2003; Holdsworth, Reference Holdsworth2004; Butler, Tavarnelli & Grasso, Reference Butler, Tavarnelli and Grasso2006; Mouthereau, Watts & Burov, Reference Mouthereau, Watts and Burov2013).
In addition to this, widespread extension is a recognized process taking place during orogenic shortening as a result of several mechanisms such as unroofing of the orogenic wedge and lateral escape of crustal blocks (e.g. Molnar & Tapponnier, Reference Molnar and Tapponnier1975; Platt, Reference Platt1986; Dewey, Reference Dewey1988; Ratschbacher et al. Reference Ratschbacher, Frisch, Linzer and Merle1991; Fossen, Reference Fossen2000). Extension and creation of accommodation space in the lower plate of orogenic wedges (i.e. in the foreland basin) has also been recognized in relation to the flexural isostatic subsidence in response to the growing weight of the orogenic wedge and the slab pull and slab retreat forces derived from the sinking lower plate (e.g. Bradley & Kidd, Reference Bradley and Kidd1991; DeCelles & Gilles, Reference DeCelles and Gilles1996; Andeweg & Cloetingh, Reference Andeweg, Cloetingh, Mascle, Puigdefàbregas, Luterbacher and Fernàndez1998; García-Castellanos & Cloetingh, Reference García-Castellanos, Cloetingh, Busby and Azor2012; Schlunegger & Kissling, Reference Schlunegger and Kissling2015). Such complex evolution of orogenic systems and associated FTB has also been demonstrated by numerical (e.g. García-Castellanos, Fernàndez & Torné, Reference García-Castellanos, Fernàndez and Torné1997; Andeweg & Cloetingh, Reference Andeweg, Cloetingh, Mascle, Puigdefàbregas, Luterbacher and Fernàndez1998; Beaumont et al. Reference Beaumont, Muñoz, Hamilton and Fullsack2000; Jammes & Huismans, Reference Jammes and Huismans2012; Ruh, Kaus & Burg, Reference Ruh, Kaus and Burg2012; Nilfouroushan et al. Reference Nilfouroushan, Pysklywec, Cruden and Koyi2013; Erdős et al. Reference Erdős, Huismans, van der Beek and Thieulot2014) and analogue modelling studies (e.g. Mugnier et al. Reference Mugnier, Baby, Colletta, Vinour, Bale and Leturmy1997; Nilfouroushan & Koyi, Reference Nilfouroushan and Koyi2007; Malavieille, Reference Malavieille2010; Graveleau, Malavieille & Dominguez, Reference Graveleau, Malavieille and Dominguez2012; Perrin et al. Reference Perrin, Clemenzi, Malavieille, Molli, Taboada and Dominguez2013).
In this work, we provide evidence for the involvement of crystalline basement by basement fault reactivation (in extension and shortening modes) beneath and ahead of the external parts of Alpine–Carpathian thin-skinned FTB. Evidence arises from the interpretation of seismic datasets, cross-section construction and calculated fault-displacement profiles. These were integrated with existing gravity data (Geofyzika, unpub. report, 1999; Lenhardt et al. Reference Lenhardt, Švankara, Melaichar, Pazdírková, Havíř and Sýkorová2007), recent and historic earthquake distributions (Reinecker & Lenhardt, Reference Reinecker and Lenhardt1999; Lenhardt et al. Reference Lenhardt, Švankara, Melaichar, Pazdírková, Havíř and Sýkorová2007), lithospheric rheology (Andeweg & Cloetingh, Reference Andeweg, Cloetingh, Mascle, Puigdefàbregas, Luterbacher and Fernàndez1998; Lankreijer et al. Reference Lankreijer, Bielik, Cloetingh and Majcin1999) and thermochronological studies (Mazzoli et al. Reference Mazzoli, Jankowski, Szaniawski and Zattin2010; Andreucci et al. Reference Andreucci, Castelluccio, Jankowski, Mazzoli, Szaniawski and Zattin2013, Reference Andreucci, Castelluccio, Corrado, Jankowski, Mazzoli, Szaniawski and Zattin2015; Castelluccio et al. Reference Castelluccio, Andreucci, Zattin, Ketchman, Jankowski, Mazzoli and Szaniawski2015).
2. Geological setting
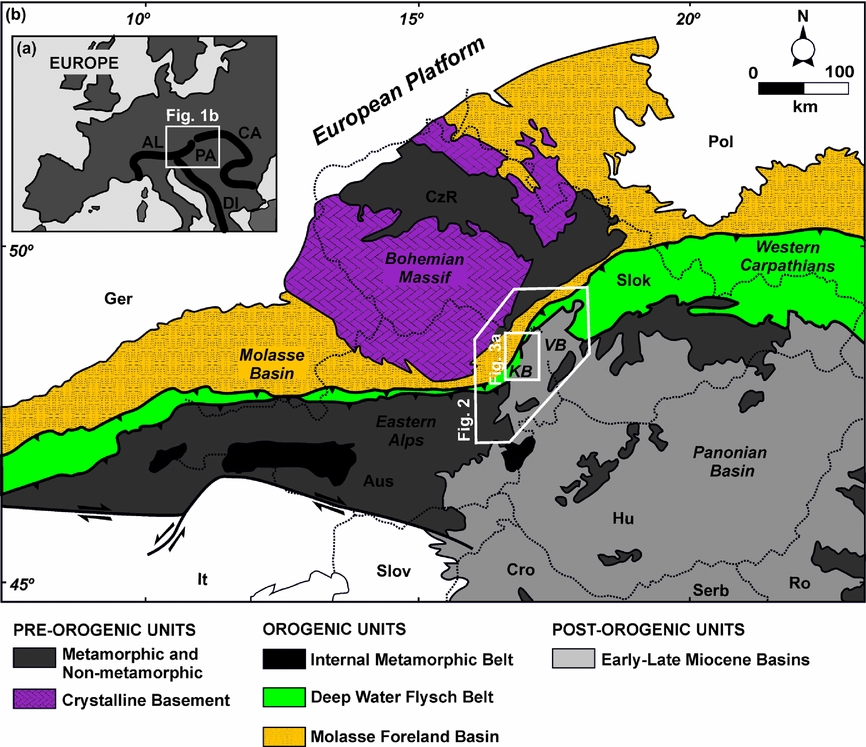
The Alpine–Carpathian FTB is located in the transition between the Eastern Alps and the Western Carpathians, between the Vienna Basin to the SE and the Bohemian massif to the NW (Fig. 1). A simplified geological evolution of the studied area is summarized in a tectono-chronostratigraphic chart (Fig. 2), whereas the main structural elements and regional structure are illustrated in Figure 3. The reader should refer to Figure 2 for the correlation of the Mediterranean and Central Paratethys Miocene stages. The basement of the Alpine–Carpathian FTB presents a general tilting towards the south (Wessely, Reference Wessely1987, Reference Wessely, Royden and Horvarth1988) which relates to the subduction of the European lower plate and the associated orogenic flexure of the foreland region (Turcotte & Schubert, Reference Turcotte and Schubert1982). The basement is elongated towards the south in the so-called Bohemian Spur extending as much as 50 km beneath the FTB, as confirmed by seismic data (Grassl et al. Reference Grassl, Neubauer, Millahn and Weber2004; this study), gravity data (Geofyzika, unpub. report, 1999; Fig. 4) and the many hydrocarbon exploration wells reaching the crystalline substrate (Wessely, Reference Wessely2006). The Bohemian spur is delineated and dissected by NE–SW- and NW–SE-striking basement faults and, to a minor extent, by N–S- and E–W-oriented fault systems (Wessely, Reference Wessely1987; Wagner, Reference Wagner, Wessely and Liebl1996, Reference Wagner, Mascle, Puigdefàbregas, Luterbacher and Fernàndez1998). Gravity data (Geofyzika, unpub. report, 1999) confirms the regional structural trends derived from these previous studies as well as the location and distribution of the major basin depocentres (Fig. 4). The oldest rocks unconformably overlying the crystalline basement are represented by Carboniferous–Permian units related to the latest Variscan cycle (Kroner et al. Reference Kroner, Mansy, Mazur, Aleksandrowski, Hann, Huckriede and Cann2008). The Lower Austria Mesozoic Basin (hereafter referred to as the LAMB) locates to the east of the Bohemian Spur. The LAMB was formed during the Jurassic–Cretaceous development of the Alpine Tethys (Wessely, Reference Wessely1987; Zimmer & Wessely, Reference Zimmer, Wessely, Wessely and Liebl1996; Wagner, Reference Wagner, Mascle, Puigdefàbregas, Luterbacher and Fernàndez1998; Ziegler et al. Reference Ziegler, Cloetingh, Guiraud, Stampfli, Ziegler, Cavazza, Robertson and Crasquin-Soleau2001; Schmid et al. Reference Schmid, Fügenshchuh, Kissling and Schuster2004; Handy et al. Reference Handy, Schmid, Bousquet, Kissling and Bernoulli2010; Handy, Ustaszewski & Kissling, Reference Handy, Ustaszewski and Kissling2015). The basin defines a large concave-to-the-SE segment belonging to the European Jurassic continental margin (Fig. 3). The LAMB sedimentary infill consists of pre-rift, syn-rift and post-rift megasequences (Fig. 2). The Middle Jurassic pre-rift to syn-rift megasequence consists of a continental to fluvio-deltaic transgressive sequence represented by the Gresten Group. This unit hosts both reservoir and source-rock intervals (Sachsenhofer et al. Reference Sachsenhofer, Bechtel, Kuffner, Rainer, Gratzer, Sauer and Sperl2006). The post-rift megasequence is represented by the onset of a carbonate platform to slope system which commences with the Middle Jurassic Höflein Formation (e.g. Sauer, Seifert & Wessely, Reference Sauer, Seifert and Wessely1992). The Höflein Formation is made up of silicified cherty and sandy dolostones and constitutes the most important reservoir in the Alpine–Carpathian sub-thrust region (e.g. Sauer, Seifert & Wessely, Reference Sauer, Seifert and Wessely1992; Zimmer & Wessely, Reference Zimmer, Wessely, Wessely and Liebl1996; Sachsenhofer et al. Reference Sachsenhofer, Bechtel, Kuffner, Rainer, Gratzer, Sauer and Sperl2006). The remaining part of the post-rift megasequence is constituted by Upper Jurassic reef build-ups and slope to deeper-water facies as represented by the Mikulov, Ernsbrunn and Kurdejov formations. The Mikulov marls represent the most important source rock of the Alpine–Carpathian Junction (Sauer, Seifert & Wessely, Reference Sauer, Seifert and Wessely1992). The remaining part of the post-rift is constituted by an unevenly distributed Late Cretaceous shelf unconformably overlying the Jurassic units (Wessely, Reference Wessely1987, Reference Wessely2006).
(a) Geological setting of the studied area. AL – Alps; CA – Carpathians; PA – Pannonian Basin; DI – Dinarides. (b) The Alpine–Carpathian Junction is located in the transition from the Eastern Alps to the Western Carpathians within the boundaries of Austria, Slovakia and the Czech Republic. Inset shows the location of Figures 2 and 3a. Aus – Austria; Cro – Croatia; CzR – Czech Republic; Ger – Germany; Hu – Hungary; Pol – Poland; Ro – Romania; Slok – Slovakia; Slov – Slovenia; Serb – Serbia; VB – Vienna Basin; KB – Korneuburg Basin. Modified from Tari (Reference Tari2005).
Simplified tectono-chronostratigraphic chart of the Alpine–Carpathian Junction. Central Paratethys stages (as defined by Piller, Harzhauser & Mandic, Reference Piller, Harzhauser and Mandic2007) and corresponding Mediterranean equivalents are included for reference.

(a) Neogene subcrop map of the Alpine–Carpathian Junction in Lower Austria with the location of the 3D seismic data. (b) Regional cross-section where the Para-autochthonous foreland and lower plate, the Alpine–Carpathian FTB and the overlying Miocene ‘successor’ basins are illustrated. Modified from Zimmer & Wessely (Reference Zimmer, Wessely, Wessely and Liebl1996), Wessely (Reference Wessely2006), Roeder (Reference Roeder, Goofey, Craig, Needham and Scott2010) and Beidinger & Decker (Reference Beidinger and Decker2014). Aus – Austria; Slok – Slovakia; CzR – Czech Republic; TF – thrust front.

Gravity maps of the Alpine–Carpathian Junction of Austria, Slovakia and Czech Republic. (a) The Bouger anomaly map shows the trend of the Bohemian crystalline massif (higher gravity readings) and the NE–SW-striking Vienna Basin (low gravity readings). (b) The residual gravity map illustrates several NE–SW gravity lows associated with the structural trends of the half-graben basins in the foreland and sub-thrust region as well as the Vienna Basin. (c) Inset of residual gravity map in (b), illustrating the gravity lows associated with the Mailberg, Altenmarkt, Haselbach and Höflein half-grabens in more detail. The E–W-striking Höflein high is shown as a prominent high related to the significant change in the basement structural trend. Data from Geofyzika (unpub. report, 1999) and provided by OMV Exploration and Production GmbH.

The Alpine–Carpathian FTB developed from the late Eocene – early Miocene N- to NW-directed shortening and overthrusting of the Alpine Tethys continental margin successions on the previously rifted European Platform (e.g. Fodor, Reference Fodor1995; Decker & Peresson, Reference Decker, Peresson, Wessely and Liebl1996; Frisch et al. Reference Frisch, Kuhlemann, Dunkl and Brügl1998; Ziegler et al. Reference Ziegler, Cloetingh, Guiraud, Stampfli, Ziegler, Cavazza, Robertson and Crasquin-Soleau2001; Schmid et al. Reference Schmid, Fügenshchuh, Kissling and Schuster2004; Ustaszewski et al. Reference Ustaszewski, Schmid, Fügenschuh, Tischler, Kissling and Spakman2008; Handy et al. Reference Handy, Schmid, Bousquet, Kissling and Bernoulli2010; Beidinger & Decker, Reference Beidinger and Decker2014; Handy, Ustaszewski & Kissling, Reference Handy, Ustaszewski and Kissling2015). This thin-skinned shortening was preceded by an earlier phase of shortening in Cretaceous times responsible for thick-skinned deformation and uplift on the Alpine Foreland (e.g. Nachtmann & Wagner, Reference Nachtmann and Wagner1987; Schröder, Reference Schröder1987). This early thick-skinned deformation is probably responsible for the partial erosion and uneven distribution of the Cretaceous cover as reported by Wessely (Reference Wessely1987). From SE to NW, the Alpine–Carpathian thin-skinned orogenic wedge is represented by the Austroalpine (including the Northern Calcareous Alps), the Rhenodanubian Flysch, the Waschberg, Roseldorf and Imbricated Molasse zones and the Para-autochthonous Molasse (Fig. 3). Thin-skinned thrusting followed a general forwards breaking sequence characterized by strong transpressional and transtensional deformation (e.g. Wessely, Reference Wessely1987; Decker, Meschede & Ring, Reference Decker, Meschede and Ring1993; Fodor, Reference Fodor1995; Linzer, Ratschbacher & Frisch, Reference Linzer, Ratschbacher and Frisch1995; Decker & Peresson, Reference Decker, Peresson, Wessely and Liebl1996; Linzer et al. Reference Linzer, Moser, Nemes, Ratschbacher and Sperner1997, Reference Linzer, Decker, Peresson, Dell'Mour and Frisch2002; Peresson & Decker, Reference Peresson and Decker1997; Hölzel et al. Reference Hölzel, Decker, Zámolyi, Strauss and Wagreich2010; Beidinger & Decker, Reference Beidinger and Decker2014). The characteristic structural styles are represented by imbricate thrust systems and related folds detached along the Alpine basal thrust which soles within the Mikulov Formation and the Para-autochthonous Molasse foreland sediments. Notoriously, the foreland basin is narrowest in front of the Bohemian Spur (c. 9 km), widening out up to 10 times to the west and to the east (Fig. 1). Large incisions and canyons in the Alpine–Carpathian foreland (e.g. Dellmour & Harzhauser, Reference Dellmour and Harzhauser2012) provide evidence for a regional long-wavelength uplift in latest early Miocene time (i.e. Karpatian), such as that reported for the Upper Austria Molasse (Andeweg & Cloetingh, Reference Andeweg, Cloetingh, Mascle, Puigdefàbregas, Luterbacher and Fernàndez1998). More recently, thermochronological studies to the ENE of the studied area in the Central Western Carpathians (e.g. Danišìk et al. Reference Danišìk, Kohút, Broska and Frisch2010; Anczkiewicz, Środoń & Zattin, Reference Anczkiewicz, Środoń and Zattin2013; Andreucci et al. Reference Andreucci, Castelluccio, Jankowski, Mazzoli, Szaniawski and Zattin2013; Castelluccio et al. Reference Castelluccio, Andreucci, Zattin, Ketchman, Jankowski, Mazzoli and Szaniawski2015) also support large Miocene exhumation events related to thrusting, erosion and post-thrusting extension (e.g. Mazzoli et al. Reference Mazzoli, Jankowski, Szaniawski and Zattin2010; Zattin et al. Reference Zattin, Andreucci, Jankowski, Mazzoli and Szaniawski2011).
On top of the Flysch Zone and the more internal parts of the Alpine–Carpathian FTB, the latest early Miocene – late Miocene ‘successor’ basins (i.e. Korneuburg, Vienna and subsidiary basins; Figs 2, 3) were developed. These basins are characterized by up to 6000 m thick Miocene depocentres associated with strike-slip pull-apart basins and related fault systems (e.g. Royden, Reference Royden, Biddle and Kristie-Blick1985; Wessely, Reference Wessely1987, Reference Wessely, Royden and Horvarth1988; Fodor, Reference Fodor1995; Strauss et al. Reference Strauss, Wagreich, Decker and Sachsenhofer2001, Reference Strauss, Harzhauser, Hinsch and Wagreich2006; Hinsch, Decker & Peresson, Reference Hinsch, Decker and Peresson2005; Arzmüller et al. Reference Arzmüller, Buchta, Ralbovský, Wessely, Golonka and Picha2006; Hölzel et al. Reference Hölzel, Decker, Zámolyi, Strauss and Wagreich2010). The origin of these basins has been traditionally ascribed to the lateral extrusion of the Alpine edifice encompassing the extensional collapse of an orogenically thickened and gravitationally unstable crust, as well as the tectonic escape driven by the retreat of the eastern Carpathian subduction zone (e.g. Ratschbacher et al. Reference Ratschbacher, Frisch, Linzer and Merle1991; Decker & Peresson, Reference Decker, Peresson, Wessely and Liebl1996; Linzer, Reference Linzer1996; Frisch et al. Reference Frisch, Kuhlemann, Dunkl and Brügl1998; Wölfler et al. Reference Wölfler, Kurz, Frizt and Stüwe2011). In this sense, the Steinberg and Mur-Mürz fault systems of the Vienna Basin most probably played a significant role on the Alpine lateral extrusion and the late dismantling of the orogenic edifice. It has also been suggested that the lateral extrusion and the end of the eastern Carpathian subduction is responsible for the late Miocene – Pliocene gentle inversion of some of these ‘successor’ basins (e.g. Ratschbacher et al. Reference Ratschbacher, Frisch, Linzer and Merle1991; Decker & Peresson, Reference Decker, Peresson, Wessely and Liebl1996; Sachsenhofer et al. Reference Sachsenhofer, Kogler, Polesny, Strauss and Wagreich2000; Strauss et al. Reference Strauss, Wagreich, Decker and Sachsenhofer2001; Genser, Cloetingh & Neubauer, Reference Genser, Cloetingh and Neubauer2007).
In addition, a significant amount of work has been dedicated to constraining the Cenozoic kinematics in the Eastern Alps (e.g. Thöny et al. Reference Thöny, Ortner and Scholger2006), the Alpine–Carpathian Junction and the Western Carpathians through palaeomagnetic studies (e.g. Márton et al. 2003, Reference Márton, Grabowski, Plašienka, Túnyi, Krobicki, Haas and Pethe2013). Their research concluded that significant Miocene anticlockwise vertical axis rotations took place, and that the present shape of the Alpine–Carpathian arc is partly due to a certain amount of oroclinal bending. However, more recent works (e.g. Szaniawski et al. Reference Szaniawski, Mazzoli, Jankowski and Zattin2013) report an inconsistency in their results compared to those from previous works. These authors indicate palaeomagnetic declinations similar to those expected for stable parts of the European Platform, implying limited amounts of vertical axis rotations in the Western Carpathians. This debate shows the geological complexity of the studied area and deserves further consideration; however, it is considered to be outwith the scope of this manuscript.
3. Dataset and methodologies
For our study we have mostly used three-dimensional (3D) and 2D seismic data. The 3D volume is a post-stack depth-migrated merge covering c. 550 km2 with a maximum recorded depth of 7 km. Spacing of the NE–SW-trending Inlines is 15 m, whereas for the NW–SE-trending cross-lines it is 30 m. The quality of the 3D seismic data is generally good but decreases in structurally complicated areas. In addition, seismic velocity inversions associated with the post-rift carbonate units also produce local reduced resolution. The studied area is also covered by a dense network of 2D time-migrated seismic profiles which cover the foreland deformation front without 3D coverage. Several tens of wells containing a downhole suite of gamma ray, sonic, resistivity, spontaneous potential surveys, checkshot logs and biostratigraphically constrained formation tops were tied to the seismic data. Gravity anomaly maps were used to illuminate the shape of the Bohemian crystalline basement, the border of the LAMB as well as the extent and strike of the Jurassic half-graben basins, and the overlying ‘successor’ Miocene basins. All data were integrated to identify and constrain the regional structure with an emphasis on the LAMB and its basement fault array. Key megasequence boundaries were defined based on well intersections, the regional unconformities observed, their internal architecture and seismic reflectors’ geometries, their seismic facies and the relationships of all these features to the major structures of the basin.
4. Seismic interpretation and structural analysis
Regional well-tied surfaces for the top of the crystalline basement and the base of the post-rift megasequence were generated from the 3D data volume (Fig. 5). The basement fault array of the LAMB is relatively well imaged in the seismic data from the foreland in the NW to the hinterland in the SE. In the studied area, the LAMB is constituted by a series of basement-involved faults that from NW to SE are referred to here as: Mailberg, Altenmarkt, Haselbach, Höflein, Kronberg and Kasernberg faults (Fig. 5). The Mailberg fault is imaged by a series of NW–SE-striking 2D time-migrated profiles in the foreland region, whereas the remaining basement faults are imaged by the 3D depth-migrated seismic cube. Fault surfaces were generated for these faults and their average orientations extracted from the 3D model (Fig. 5c, d).
Depth structure maps. (a) Top of crystalline basement. (b) Base of the post-rift megasequence (i.e. Höflein Formation). (c) Stereographic projection showing the orientation of the interpreted fault systems, with great circles representing faults. Note the predominant NE–SW-striking steeply dipping sets (in black) corresponding to the large Jurassic rift faults. The NW–SE-striking set (in red) corresponds to the less-abundant release and transfer faults. (d) Stereographic projection showing the predominant NE–SW strike of the inversion-related fault system. All stereographic plots are equal-area, lower-hemisphere projections. (e) Syn-rift isopach map (i.e. true stratigraphic thickness). The largest syn-rift depocentre is related to the Haselbach fault, whereas the thickest syn-rift in the Höflein half-graben is related to its E–W-striking segment. Alt – Altenmarkt fault; Ha – Haselbach fault; Hö – Höflein fault; Kro – Kronberg fault; Ka – Kasernberg fault; Sto – Stockerau anticline. Red dots in (a) indicate the position of the Höflein and Kronberg basement highs. Stereoplots generated with OpenPlot software (Tavani et al. Reference Tavani, Arbués, Snidero, Carrera and Muñoz2011).

4.a. The LAMB basement fault array
The LAMB basement fault array is constituted by steeply to moderately SE-dipping extensional faults, whereas minor antithetic faults are steeply to moderately NW-dipping (Fig. 5). These basement-involved faults are arranged in segments with slightly different orientations, striking from NNE–SSW to E–W and NW–SE, but overall configuring a general NE–SW trend (Fig. 5c). Major faults display lengths in excess of 10 km along-strike. In the studied area, the general trend of the basement fault array is roughly parallel to the strike of the overlying thin-skinned thrust front (Fig. 3). One NW–SE-striking basement fault (i.e. trending approximately perpendicular to the general basement fault array) was interpreted from the 3D seismic data (Fig. 5). According to the Bouguer anomaly map, this fault set could correspond to transfer systems segmenting the regional basement fault trend (Fig. 4a). Other NW–SE-striking faults in the order of tens to hundreds of metres long (i.e. up to two orders of magnitude smaller than the major faults) are localized within the basement and pre-rift to early syn-rift infill. Characteristically, these small faults display lower throw values than the master faults and are here interpreted as release faults (sensu Destro, Reference Destro1995). This type of fault accommodates the along-strike stretching of the hanging-wall layers during regional extension and accounts for the NW–SE-striking fault sets shown in the fault strike diagram (Fig. 5c).
As no fault plane reflections are shown by the seismic data, the shape of the basement faults has been resolved from the location of the reflector's cut-offs and by the geometry of the corresponding hanging-wall layers (e.g. White, Jackson & McKenzie, Reference White, Jackson and McKenzie1986; Xiao & Suppe, Reference Xiao and Suppe1992; Withjack & Schlische, Reference Withjack, Schlische, Buiter and Schreurs2006). The hanging-wall layers of the major basement-involved faults display either a straight panel dipping into the fault or slightly kinked panels indicating that the underlying extensional faults display a planar to slightly kinked geometry. The average spacing of the basement-involved faults is c. 10 km measured normal to the strike of the structures. According to this, the general structure of the LAMB corresponds to a series of tilted fault blocks and associated half-graben basins that belong to the former Alpine Tethys Jurassic continental margin. The basal detachment of these faults should be located at around 12 km depth, close to the base of the seismogenic crust (Sibson, Reference Sibson1983; Twiss & Moores, Reference Twiss and Moores1992).
4.b. Assessment of basement fault reactivation
The evolution of the LAMB basement fault array was studied by documenting the observed structural styles and the relative timing of cross-cutting relationships. In addition, a quantitative approach was taken by computing fault-displacement profiles (i.e. fault length v. throw values). Fault displacement profiles were calculated for the top basement and the base of the post-rift megasequence given their fundamental role in constraining the magnitude of fault reactivation (e.g. Williams, Powell & Cooper, Reference Williams, Powell, Cooper, Cooper and Williams1989; Turner & Williams, Reference Turner and Williams2004). This is based on the assumption that during the post-rift, subsidence is mostly controlled by the thermal re-equilibration of the lithosphere as opposed to the syn-rift subsidence which is fundamentally fault controlled (e.g. McKenzie, Reference McKenzie1978; Allen & Allen, Reference Allen, Allen, Allen and Allen2005). Large offsets affecting the post-rift megasequence are therefore indicative of post-rift fault reactivation. Fault-displacement profiles illustrate the along-strike variation of throw but can also indicate which faults (or fault segments) underwent extensional reactivation and inversion (e.g. Thomas & Coward, Reference Thomas, Coward, Buchanan and Buchanan1995; Willemse, Pollard & Aydin, Reference Willemse, Pollard and Aydin1996). The obtained throw values for each fault should be taken as representative values of the minimum vertical offset, as additional faults and folds of sub-seismic entity might have contributed to the total offset.
The observed displacement along the basement-involved faults of the LAMB decreases upwards by developing fault-propagation folds or forced folds (e.g. Stearns, Reference Stearns and Matthews III1978; Withjack, Olson & Peterson, Reference Withjack, Olson and Peterson1990; Cornfield & Sharp, Reference Cornfield and Sharp2000; Cosgrove & Ameen, Reference Cosgrove, Ameen, Cosgrove and Ameen2000; Maurin and Niviere, Reference Maurin, Niviere, Cosgrove and Ameen2000; Khalil & McClay, Reference Khalil and McClay2002; Jackson, Gawthorpe & Sharp, Reference Jackson, Gawthorpe and Sharp2006; Tavani & Granado, Reference Tavani and Granado2015). These folds also affect the post-rift megasequence, the foreland sediments of the Molasse Basin and, locally, the overlying thin-skinned thrust system. For the major faults, the top of the crystalline basement displays fault-parallel hanging-wall synclines (Fig. 5a) which trend parallel to slightly oblique to the orientation of the immediate fault segment. The Altenmarkt fault displays two of these synclines separated by a fault perpendicular ridge (Fig. 5a). Calculated fault displacement profiles (Fig. 6) indicate displacement maxima slightly shifted sideways from the central position of the faults. These observations suggest that the extensional faults grew to a certain point by the lateral linkage of isolated fault segments (Peacock & Sanderson, Reference Peacock and Sanderson1991; Cartwright, Mansfield & Trudgill, Reference Cartwright, Mansfield, Trudgill, Buchanan and Nieuwland1996; Willemse, Pollard & Aydin, Reference Willemse, Pollard and Aydin1996).
Fault displacement profiles for the studied basement faults. D is the length of the extensional fault measured along-strike and T (throw) is vertical offset. Note all throw values are in metres, except for the Mailberg fault which is reported as two-way time. Note the extensional offset in excess of 1000 m for the base of the post-rift, providing evidence for the early Miocene extensional reactivation event. The observed erosion of the basal post-rift section (see (b) and (d) plots) is also spatially coincident with the location of maximum throw values. The Höflein fault displays either no extensional offset for the post-rift section or minor reverse offset, indicating the partial positive inversion of the fault.

Syn-rift sediment distribution was calculated and represented as a True Stratigraphic Thickness map (Fig. 5e). The calculated map indicates several syn-rift depocentres juxtaposed to the major basement faults as well as stratigraphic thickness lows associated with the uplifted footwalls of the basement faults. The largest syn-rift depocentre is associated with the Haselbach fault, where the syn-rift reaches up to 2770 m in thickness. Broadly speaking, the LAMB is characterized by a well-preserved extensional architecture, mostly inherited from the Jurassic rifting episode. In the following, evidence for the reactivation of the basement fault array following the sedimentation of the syn-rift megasequence from cross-sections, generated surfaces and fault displacement profiles, is provided. In the cross-sections, geometrical characteristics typical of extensional faulting but also typical of positive inversion of the extensional fault array are shown.
4.b.1. The Mailberg fault
The Mailberg fault is located in the foreland region ahead of the thin-skinned thrust front. This fault runs along-strike for as much as 30 km. It is only covered by 2D time-migrated profiles, but its associated hanging-wall depocentre is well shown as a NE–SW-striking gravity low (Fig. b, c). In the central segment of the Mailberg fault, the top of the crystalline basement is folded into an open hanging-wall syncline. The top of the basement has been downthrown in excess of 2 s two-way time, although thickness difference of the Jurassic syn-rift sequence between the footwall and the hanging wall is less than 1 s (Figs 6a, 7). Well and seismic data show that the post-rift megasequence in the hanging wall displays net extensional displacements along most of the length of the fault. In addition, well data indicate that to the SW the post-rift is not present in the footwall; it has therefore been eroded or non-deposited. On the other hand, the Eggerian–Karpatian (i.e. late Oligocene – late early Miocene) foreland sediments are significantly thicker in the hanging wall than in the footwall. These foreland sediments downlap onto the hanging-wall post-rift megasequence to the SE and onlap and overlap the faulted post-rift units above the basement fault. Extensional displacement along this fault generated a breached forced fold affecting the post-rift and overlying foreland units. Moreover, the uppermost units immediately above the Mailberg fault are Karpatian–Badenian in age (i.e. latest early – earliest middle Miocene; Fig. 2). These units are folded into an open but slightly asymmetric anticline (referred to as the Mailberg Anticline) which lies above the regional elevation and displays a larger gently dipping back-limb and a shorter more steeply dipping forelimb (Fig. 7). In addition to this, a Badenian-age (i.e. early middle Miocene) coralline-algal reef was developed onto this anticline, surrounded by and interfingering with deeper-water siliciclastic-dominated facies (Mandic, Reference Mandic2004).
(a) NW–SE-striking time-migrated profile. (b) Geoseismic interpretation showing the Mailberg half-graben in the foreland region ahead of the thin-skinned thrust front. Note the extensional offset shown by the top of the basement and the post-rift megasequence. Note the thicker sections of syn-rift and Molasse basin strata in the hanging wall than in the footwall, and the erosion of the upper section of the post-rift megasequence in the elevated footwall. The Mailberg Anticline developed above the extensional fault shows a larger back-limb and a shorter forelimb. These features are indicative of thick-skinned positive inversion following an early Miocene extensional reactivation of the Jurassic Mailberg fault. See Figure 3 for location of the profile.

The calculated fault displacement profile for the top basement in the Mailberg fault displays two displacement minima at both ends of the fault, whereas the central portions of the fault display a rather uniform throw (Fig. 6a). Such a displacement profile is not in agreement with the commonly observed displacement profiles of extensional faults, where the displacement maximum is commonly located near the centre of the faults (e.g. Peacock & Sanderson, Reference Peacock and Sanderson1991; Cartwright, Mansfield & Trudgill, Reference Cartwright, Mansfield, Trudgill, Buchanan and Nieuwland1996; Willemse, Pollard & Aydin, Reference Willemse, Pollard and Aydin1996). In this case, the central portion of the Mailberg fault is spatially coincident with the above-mentioned Mailberg Anticline. Based on the evidence provided, we interpreted that the Mailberg fault underwent two episodes of reactivation. The first was in extension during Eggerian–Karpatian time (i.e. late Oligocene – late Early Miocene), as shown by the extensional displacement of the post-rift units and thickness differences observed across the fault for the lower Miocene sequences. This first extensional reactivation is therefore synchronous with the thin-skinned thrusting. It was followed by a later episode of shortening in Badenian times (i.e. earliest middle Miocene), responsible for the development of the Mailberg Anticline and the partial removal of the extensional displacement.
4.b.2. The Altenmarkt fault
The Altenmarkt fault is located just ahead of the thin-skinned thrust front of the Alpine–Carpathian Junction (Fig. 8). This fault runs along-strike for at least 15 km, dying out towards the NE where it is relayed by a system of two smaller SE-dipping rift faults; towards the SW, it continues out of the 3D cube (Fig. 5). This is also supported by the calculated fault displacement profiles for the top of the basement and the base of the post-rift megasequence (Fig. 6b). This plot indicates that the fault is in net extensional displacement and that the displacement maximum is strongly shifted towards the SW. The Altenmarkt fault comprises several segments of differing orientation ranging from NNE- to NE–SW- to E–W-striking. In addition, the fault is connected to a roughly NW–SE-striking fault that could be a transfer zone.
(a) NW–SE-striking depth-migrated seismic profile. (b) Geoseismic interpretation. The Altenmarkt fault locates ahead of the thin-skinned thrust front where the Roseldorf hydrocarbon field is located. Note extensional offset shown by the post-rift megasequence and the Para-autochthonous Molasse growth strata wedges indicative of Eggerian–Ottnangian (i.e. late Oligocene – early Miocene) extensional reactivation of the Altenmarkt and Haselbach faults. Positive inversion of the basement fault array is shown by open folding of the Altenmarkt hanging-wall strata, and the formation of a basement involved a shortcut fault and a backthrust emerging from the Haselbach fault. Gentle folding of the cover strata and thrust sheets above these inversion-related faults indicate that extensional reactivation of the basement fault array was followed by its positive inversion. See Figure 5 for location of the profile. WZ – Waschberg Zone.

Seismic interpretation and well data indicate that the post-rift megasequence is missing to the west and SW on the footwall of the Altenmarkt fault, where Eggerian (i.e. late Oligocene – early Miocene) strata are unconformably overlying the top of the crystalline basement. The base of the post-rift megasequence is also considerably downthrown in the hanging wall of the fault. Seismic and fault displacement profiles show that the missing post-rift megasequence is spatially coincident with the fault segment that displays the largest throw values. In addition, the Eggerian – Karpatian (i.e. late Oligocene – late early Miocene) sequence is significantly thicker in the hanging wall than in the footwall, indicating that the extensional reactivation of the Altenmarkt fault during that time. Seismic evidence also suggests partial erosion of the post-rift section in the immediate hanging wall below these sediments. Extensional displacement along this fault decreases upwards by developing an extensional fault-propagation fold (Fig. 8).
The top of the crystalline basement in the hanging wall of the Altenmarkt fault is divided into two panels which are slightly separated by a low-angle offset (Fig. 8). The NW panel dips toward the fault more steeply than the SE panel. The units above this basement kink (i.e. syn-rift and post-rift megasequences and overlying Molasse basin sediments) are folded into a broad open anticline, above which the Roseldorf hydrocarbon field is located. This anticline and the low-angle offset affecting the top of the basement are interpreted to be related to a NW-directed basement-involved thrust fault (Figs 5e, 8). This thrust is interpreted as a footwall shortcut thrust (Badley, Price & Backshall, Reference Badley, Price, Backshall, Cooper and Williams1989; Hayward & Graham, Reference Hayward, Graham, Cooper and Williams1989) emanating from and kinematically linked to the steeply dipping Haselbach fault.
4.b.3. The Haselbach fault
The Haselbach fault is located in the middle of the 3D cube and runs in excess of 20 km along-strike below the thin-skinned thrust front. The Haselbach fault displays the largest observed throw values of the basement fault array, exceeding 4000 m for the top of the crystalline basement (Fig. 6c). In the section corresponding to the displacement maximum of the fault, the top of the crystalline basement dips towards the NW (i.e. towards the Haselbach fault), where extension is related to one large basement fault (Fig. 8). Towards the NE, seismic and well data indicate that the top of the basement is folded into a hanging-wall syncline; to the SW, the top of the basement displays a down-to-the-SE terraced geometry. Such terraced geometry is in agreement with the existence of several planar extensional faults (Fig. 9). The observed lateral variation in the geometry of the basement top of the hanging wall suggests a slightly kinked geometry for the Haselbach fault at depth, with the hanging-wall syncline developed for those layers with less extensional displacement and still above the fault kink (Xiao & Suppe, Reference Xiao and Suppe1992). The kink in the fault is not observed in the seismic data and should be located at greater depth. In addition, the base of the post-rift megasequence in the hanging wall is downthrown in excess of 1000 m (Figs 6c, 8, 9). Such extensional offset is also accompanied by a thick Eggerian–Ottnangian (i.e. late Oligocene – early Miocene) sedimentary wedge. Well and seismic data also indicate that the sedimentation of this sedimentary wedge is responsible for the partial erosion of the underlying post-rift section.
(a) NW–SE-striking depth-migrated seismic profile through the Stockerau and Höflein fields. (b) Geoseismic interpretation. Note the energetic reflections given by the pre-rift units near the top of the crystalline basement and those above corresponding to the post-rift carbonates. The Eggerian–Ottnangian (i.e. late Oligocene – early Miocene) wedges above the Haselbach and Höflein faults indicate the timing of extensional reactivation of the basement fault array. Positive inversion followed as indicated by the development of the Stockerau Anticline, the elevated Höflein footwall and the associated folding of the overlying thrust sheets. See Figure 5 for location of the profile. WZ – Waschberg Zone; PM – Para-autochthonous Molasse.

In cross-section, the base of the post-rift megasequence on the hanging wall of the Haselbach fault displays a subhorizontal attitude (Figs 8, 9). On map view (Fig. 5b), the base of the post-rift megasequence dips towards the NE (i.e. towards the Haselbach half-graben depocentre), indicating that its regional attitude relates to the inherited extensional architecture of the LAMB. To the SW, the post-rift section above the Haselbach fault is folded into an open anticline (Fig. 9). This anticline (referred to as the Stockerau Anticline) affects the autochthonous foreland units and the overlying imbricated foreland strata. To the east, the hanging-wall section is folded into an anticline with a large shallowly NW-dipping limb and a shorter SE-dipping limb (Figs 5e, 8). This anticline gently folds the overlying strata and structural units above the hanging wall. This structure is interpreted as related to a SE-directed backthrust nucleated from the Haselbach fault along the basal pre-rift to syn-rift section. According to the geometries described, the steeply dipping Haselbach fault seems to have acted as a buttress upon shortening (e.g. Butler, Reference Butler, Cooper and Williams1989), promoting the development of the basement-involved shortcut and hanging-wall backthrust.
4.b.4. The Kronberg high and related extensional fault
The Kronberg high locates to the eastern part of the 3D model (Fig. 5). This basement high strikes NE–SW and corresponds to the elevated footwall of the NE–SW-striking Kronberg extensional fault (Figs 10, 11). The Kronberg fault runs along-strike for about 10 km and is relayed to the SW by another extensional fault (Fig. 5). The calculated fault displacement profile shows a displacement maxima located within the central part of the fault. At this position, extensional offsets for the top of the crystalline basement are in excess of 2 km. The Kronberg high locates in the immediate footwall of the displacement maxima of this fault (Figs 5, 6d).
(a) NW–SE-striking depth-migrated seismic profile along the Kronberg high. (b) Geoseismic interpretation. Kronberg T01 well drilled Eggerian–Ottnangian (i.e. late Oligocene – early Miocene) sediments unconformably overlying the basal syn-rift section. Note the missing post-rift onto the Kronberg fault footwall. The Waschberg Zone and basal Alpine thrust consist of imbricated Cretaceous and Malmian units scrapped off from the underlying autochthonous units. WZ – Waschberg Zone.

(a) Composite depth-migrated section from the Höflein field to the SW and the Kronberg high to the NE. (b) Geoseismic interpretation. Energetic reflectors on the Höflein high correspond to the post-rift carbonates and underlying syn- and pre-rift siliciclastics. On the Kronberg high the high-energy reflections correspond to the Autochthonous Molasse unconformably overlying the syn-rift units; post-rift carbonates are missing. Seismic and well data show the substantially higher elevation of the basement in the Höflein high than in the Kronberg high, as well as the folding of the overlying imbricates of the Flysch Zone. The basal thrust zone is constituted by imbricated Malmian, Cretaceous and Eggerian (i.e. late Oligocene) sediments. Dipping reflections within the Rhenodanubian Flysch indicate a transport direction oblique to the seismic profile. See Figure 5 for location of the profile. PM – Para-autochthonous Molasse.

The high was drilled by the Kronberg T1 well, targeting the sub-thrust post-rift and syn-rift reservoir sections (Zimmer & Wessely, Reference Zimmer, Wessely, Wessely and Liebl1996). The well drilled down to 4714 m through the imbricated units of the Flysch and Waschberg zones, and found Eggerian (i.e. late Oligocene – early Miocene) Molasse sediments on top of the syn-rift megasequence; the post-rift carbonate section (i.e. the reservoirs) were missed (Fig. 10). Fault displacement profiles calculated for the preserved base of the post-rift megasequence away from the footwall high indicate extensional offsets in excess of 1000 m (Fig. 6d). The fault displacement profile for the base of the post-rift displays a similar displacement distribution to that shown by the top of the crystalline basement. In addition to this, the Kronberg fault hanging wall displays a Molasse sedimentary wedge above the syn-rift and post-rift megasequences thicker than that drilled by the Kronberg T1 well. These observations suggest that the basal section of the post-rift megasequence on the Kronberg high was eroded by the footwall uplift related to the Eggerian–Ottnangian (i.e. late Oligocene – early Miocene) extensional reactivation of the Kronberg fault.
4.b.5. The Höflein high and related fault system
The Höflein high is located at the southern corner of the 3D model, about 10 km NNW of the city of Vienna (Figs 3, 5) and beneath the Flysch Zone imbricates (Figs 9, 11, 12). Available well and seismic data indicate that the master basement fault extends for as much as 12 km along-strike and displays two important changes in strike: from NNE- to E–W to NE–SW-striking (Fig. 5). These fault segments are steeply dipping and display a slightly concave-upwards geometry. The Höflein high corresponds to the elevated footwall of the E–W-striking fault segment (Fig. 5); in addition, the hanging wall of this fault segment displays the thickest syn-rift depocentre of the Höflein half-graben (Fig. 5e).
(a) NW–SE-striking depth-migrated seismic profile SW of the elevated Höflein footwall. (b) The geoseismic interpretation shows a reactivated extensional fault with two associated basement-involved shortcut faults interpreted as harpoon or arrowhead structure. This structure is responsible for the imbrication of the basement and the syn-rift section and the folding of the overlying cover and thrust sheets. Small displacement thrusts and backthrusts repeat the carbonate reservoir section.

At this position, the footwall of the Höflein fault hosts the most important gas and condensate field in the sub-thrust region of Lower Austria (Janoscheck, Malzer & Zimmer, Reference Zimmer, Wessely, Wessely and Liebl1996; Zimmer & Wessely, Reference Zimmer, Wessely, Wessely and Liebl1996; Sachsenhofer et al. Reference Sachsenhofer, Bechtel, Kuffner, Rainer, Gratzer, Sauer and Sperl2006). This hydrocarbon field produces from the (Para)-autochthonous post-rift carbonates and the syn-rift siliciclastic section in a footwall four-way-dip closure (Figs 5, 13). The E–W orientation of the footwall basement high significantly departs from the regional NE–SW-striking basement fault array trend. The Höflein high is slightly offset by a NW–SE-striking extensional fault, with its downthrown block located to the SW. The Höflein extensional fault could be correlated to the NE with the Kasernberg fault, but the lack of 3D seismic data avoided this correlation (Fig. 5). At the footwall high, the crystalline basement is located at c. 2500 m below mean sea level. This is about 2000 m above the top of the crystalline basement drilled by the Kronberg T1 well (Fig. 11). As previously stated, the whole post-rift section is preserved at Höflein high, but not at Kronberg high (Fig. 11). Regarding the hanging wall, the basement top is folded into a plunging NE–SW-striking syncline and anticline pair (i.e. slightly oblique to the trend of the Höflein fault).
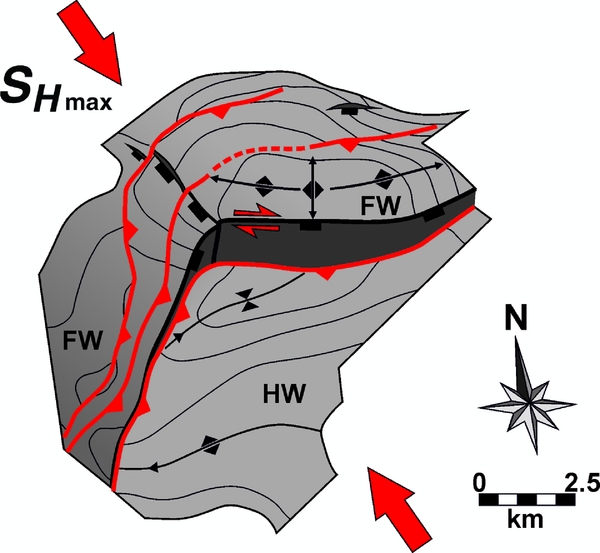
Conceptual 3D model of the Höflein high based on the interpretation of 3D seismic. The surface represents the top of the crystalline basement. Extensional faults are depicted in black, whereas inversion-related thrust faults and reactivated faults are shown in red. The favoured interpretation is a complex harpoon structure related to the mild right-lateral transpressive inversion of a non-rectilinear steeply dipping extensional fault (i.e. Höflein fault) and the associated formation of basement-involved footwall shortcuts. HW – hanging wall; FW – footwall.
In order to illustrate the geometry of the Höflein high and related fault systems, two NW–SE-striking cross-sections (Figs 9, 12) and a composite NE–SW-striking cross-section (Fig. 11) were made (see Fig. 5a for location). The first of these cross-sections goes from the Stockerau field to the NW to the Höflein field to the SE, and shows the elevated footwall of the Höflein extensional fault (Fig. 9). At this position, the Höflein high is characterized by the prominent footwall reflections of the post-rift carbonates. To the SE, these reflections disappear and locate on the Höflein's downthrown hanging wall. On the footwall, the post-rift carbonates are offset and imbricated several times by a series of NE–SW-striking small-displacement backthrusts (Figs 5, 9). The top of the crystalline basement is folded into two panels which relate to two roughly NE–SW-striking basement-involved reverse faults emerging from the Höflein extensional fault (Figs 5, 9b). Displacement and folding associated with these reverse faults are, at least partially, responsible for the high elevation of the Höflein high.
Further to the SW, a section across the Höflein fault away from the elevated footwall displays a thick package of subhorizontal reflections at 3.5 km depth which are unconformably overlain by SE-dipping reflections (Fig. 12). Similarly, these relationships are shown in a roughly perpendicular section (Fig. 11). Well data from the recently drilled well Höflein5b (OMV, unpub. report, 2013) indicate that these thick subhorizontal reflections belong to the syn-rift Gresten Group, whereas the dipping reflections immediately above belong to the post-rift reservoir section. Significantly thicker Eggenburgian–Ottnangian (i.e. early Miocene) strata in the hanging wall than in the footwall were found. At this position, the post-rift carbonates lie slightly above the regional elevation (Fig. 6e). Well data also indicate a tectonic repetition of the Höflein Formation in the footwall of the Höflein extensional fault (Fig. 12b). In addition to this, regional elevation also indicates the local repetitions of the syn-rift footwall section to the NW (Fig. 12). Above the folded post-rift carbonates, the reflections belonging to the Flysch Zone imbricates and the Basal Alpine Thrust are folded into an open anticline (Fig. 12). These cross-cutting relationships provide strong time constraints on the structural evolution of the Höflein field in particular, but also for the studied area.
Fault displacement profiles were calculated for the top of the crystalline basement and the base of the post-rift megasequence (Fig. 6e). The Höflein extensional fault shows a dramatic change in the along-strike throw distribution, as also reflected in the syn-rift isopach map (Fig. 5e). This sharp change in throw and syn-rift sediment thickness is coincident with the change in the strike of the extensional fault from the E–W-striking segment to the NNE–SSW-striking segment. Based on the constructed sections and the 3D structural model, the Höflein field is interpreted as a complex harpoon structure (Badley, Price & Backshall, Reference Badley, Price, Backshall, Cooper and Williams1989; Hayward & Graham, Reference Hayward, Graham, Cooper and Williams1989; Buchanan & McClay, Reference Buchanan and McClay1991) consisting of a mildly inverted extensional fault with two basement-involved footwall shortcut faults, and a series of small-displacement thrust and backthrusts which are responsible for the locally observed repetitions of the reservoir carbonate section. According to the geometries described it is suggested that the Höflein extensional fault acted as a buttress upon shortening, promoting the development of the basement-involved shortcut faults and the secondary backthrusts.
5. Discussion and concluding remarks
5.a. Summary of observations: stress-fields and timing constraints
In our work we document several reactivation episodes of the Lower Austria basement fault array in both extensional and shortening modes. The LAMB basement fault array is represented by thick Doggerian wedges related to the rifting and opening of the Alpine Tethys, but some of these basement-involved faults can be as old as of late Palaeozoic age as suggested by borehole data (Wessely, Reference Wessely2006). The LAMB basement-involved faults underwent a first episode of extensional reactivation as shown by the large extensional offsets of the post-rift megasequence and thick (i.e. in excess of 1000 m thick) Eggerian–Karpatian (i.e. late Oligocene – late early Miocene) extensional growth wedges. Biostratigraphically constrained well tops and seismic evidence indicate that the extensional reactivation of the basement faults was synchronous with the development of the thin-skinned FTB and its flexural foreland basin. Broadly speaking, the growth wedges young towards the NW, from Eggerian–Karpatian (i.e. late Oligocene – late early Miocene) age. This provides evidence for the forwards migration of the basement fault array extensional reactivation as the thin-skinned orogenic wedge overrode the subducting European lower plate.
Afterwards, selective mild positive tectonic inversion of the basement fault array took place. This positive inversion event is represented by the mild reactivation upon shortening of several basement-involved faults or fault segments, and the associated folding of the cover. The positive inversion is also shown by a suite of new structures including basement-involved footwall shortcut thrusts (i.e. Haselbach shortcut and Höflein shortcuts) and second-order thrusts (Haselbach backthrust and Höflein backthrusts). The NE–SW orientation of the inversion-related faults is parallel to that of the basement fault array (Fig. 5c, d, e) and suggests roughly coaxial (at least locally) stress fields for the Jurassic rifting and the late Alpine shortening (i.e. NW-directed). In this sense, and in the absence of large fluid overpressures (e.g. Sibson, Reference Sibson1983, Reference Sibson1985, Reference Sibson1990), the generation of new moderately dipping reverse faults is mechanically favoured rather than reactivating the steeply dipping pre-existing basement faults. Moreover, the formation of the footwall shortcuts would have been facilitated by the kinked nature of the basement faults (i.e. Haselbach fault).
The Höflein high is the most important hydrocarbon field in the sub-thrust region of Lower Austria and previous works interpreted its origin as related to purely extensional tectonics (Zimmer & Wessely, Reference Zimmer, Wessely, Wessely and Liebl1996). In this work, we propose an alternative interpretation based on a re-interpretation of data where the Höflein high is a complex harpoon structure associated with the inversion of a non-rectilinear extensional fault system (Figs 5, 13). As shown by 3D seismic, well and gravity data, the Höflein high is located nearby the margin of the LAMB, in close proximity to the rigid Bohemian crystalline massif (Figs 3, 4c) and the Vienna Basin boundary. This fact also suggests that the Bohemian crystalline massif behaved as a rigid buttress promoting the mild inversion of the extensional fault system and the formation of footwall shortcut structures and backthrusts. Whether the positive inversion of the basement fault array was associated with the late stages of the Miocene NW-directed Alpine–Carpathian shortening or the east-directed lateral extrusion is arguable. Present-day seismicity shows the absence of thrust-faulting earthquakes and points to oblique transpressional kinematics (Reinecker & Lenhardt, Reference Reinecker and Lenhardt1999).
These authors also discuss stress orientation data from borehole breakouts in the Höflein field, indicating large dispersion in the orientation of the principal horizontal compressive stress (i.e. SH max or σ 1), from NNE–SSW- to NW–SW- to NE–SW striking. This is most probably related to two fundamental factors: (1) these borehole break-outs relate to the present-day stress field, which does not need to be the same as the prevailing Miocene stress field; and (2) stress deviations between the local orientation of the SH max and the average regional stress orientation (Rebaï, Philip & Taboada, Reference Rebaï, Philip and Taboada1992; Zoback, Reference Zoback2010). The non-rectilinear Höflein half-graben was probably preferentially reactivated than the other basement-involved faults, as the E–W-striking fault plane was not perpendicular to the prevailing subhorizontal NW-directed Alpine principal compressive stress (SH max or σ 1) and not containing the intermediate principal stress (SH int or σ 2), as fault reactivation is partly dependent on the magnitude of σ 2 (Jaeger & Cook, Reference Jaeger and Cook1979; Zoback, Reference Zoback2010). A NW-directed shortening would have reactivated the E–W-striking segment of the Höflein extensional fault in right-lateral transpressive kinematics. On the other hand, if the inversion of the extensional fault system was related to the lateral E-directed extrusion, the Höflein high would correspond to a restraining bend resulting from left-lateral transpression. In this sense, the orientation, shape and transport direction of the footwall shortcuts and the backthrusts (Fig. 5d, e) fit better with the right-lateral transpressive inversion model in relation to the regional NW-directed shortening.
In the absence of syn-inversion growth strata in the sub-thrust region, relative time constraints can be inferred from the observed cross-cutting relationships. The final activity of the thin-skinned thrust system in the studied area is constrained by the latest early Miocene (i.e. Karpatian) thrust front and piggy-back basins growth strata (Decker & Peresson, Reference Decker, Peresson, Wessely and Liebl1996; Hölzel et al. Reference Hölzel, Decker, Zámolyi, Strauss and Wagreich2010; Beidinger & Decker, Reference Beidinger and Decker2014) which is also coincident with the initial infill of the Korneuburg, Fohnsdorf-Seckau and related pull-apart basins developed on top of the FTB (i.e. Ratschbacher et al. Reference Ratschbacher, Frisch, Linzer and Merle1991; Strauss et al. Reference Strauss, Wagreich, Decker and Sachsenhofer2001; Harzhauser et al. Reference Harzhauser, Boehme, Mandic and Hofmann2002; Fig. 3b). The thick-skinned inversion of the sub-thrust basement fault array (i.e. Höflein) should therefore be as old as of Karpatian (latest early Miocene) age, whereas in the foreland (i.e. Mailberg) the Badenian facies distribution (Mandic, Reference Mandic2004) suggests a slightly younger age of inversion (i.e. earliest middle Miocene). This is in agreement with the progressive, although very fast, forwards migration of thick-skinned basement fault reactivation.
5.b. The role of the basement in the Alpine–Carpathian FTB development
The basement of the Alpine–Carpathian FTB presents a general tilting towards the south underneath the Alpine–Carpathian edifice (Wessely, Reference Wessely1987). Deep exploration wells have indicated a differing nature for the crystalline basement of the LAMB and that of the Bohemian Spur. The LAMB sits on crystalline and metasedimentary basement of Moravo–Silesian affinity, whereas the Bohemian Spur is constituted by rigid crystalline basement of Moldanubikum affinity (Kröll & Wessely, Reference Kröll and Wessely2001; Wessely, Reference Wessely2006). These different basement domains were assembled during the Late Palaeozoic Variscan Orogeny and their boundary corresponds to a major orogenic suture (Neubauer & Handler, Reference Neubauer and Handler1999).
Lankreijer et al. (Reference Lankreijer, Bielik, Cloetingh and Majcin1999) defined several thermo-lithospheric domains of contrasting equivalent elastic thickness (EET) and rheology for the Bohemian and Alpine–Carpathian domains. According to these authors, the Bohemian domain is represented by extreme values of lithospheric strength and large EET, whereas the inherited Jurassic European continental margin is characterized by significantly lower values. As suggested by Reinecker & Lenhardt (Reference Reinecker and Lenhardt1999), such differing basement nature and associated rheological contrasts controlled the development and architecture of the Upper and Lower Austria Mesozoic Basins, the subsequent development of the Alpine–Carpathian FTB and probably that of the ‘successor’ middle–late Miocene basins.
More recently, Beidinger & Decker (Reference Beidinger and Decker2014) have shown that the thin-skinned thrust front in the Alpine–Carpathian Junction parallels the –1000 m isoline (i.e. metres below mean sea level), and that the Bohemian Spur probably generated a buttressing effect that limited the forwards thrust propagation and led to generalized out-of-sequence thrusting. The present-day stress field and the recent earthquake distribution also indicate a strong basement control of the Bohemian massif, where the highest observed seismicity is located in its southernmost tip and displays a radial stress configuration (Reinecker & Lenhardt, Reference Reinecker and Lenhardt1999). The Alpine Molasse basin drastically changes in width from west to east (Andeweg & Cloethigh, Reference Andeweg, Cloetingh, Mascle, Puigdefàbregas, Luterbacher and Fernàndez1998), forming two well-developed thrust salients with wide foreland basins in the Upper Austria and the Polish Carpathians regions. On the contrary, the Alpine–Carpathian Junction represents a recess, where the foreland basin is c. 9 km wide (Fig. 1). The observed lateral variation in the width of the Molasse Basin correlates with the degree of tilting of the foreland region and therefore with a lateral change in the EET (Andeweg & Cloetingh, Reference Andeweg, Cloetingh, Mascle, Puigdefàbregas, Luterbacher and Fernàndez1998).
5.c. Possible controls on crustal coupling and geodynamic implications
Early orogenic shortening in the Alpine–Carpathian Junction was accommodated by shallow flat-dominated thin-skinned tectonics coeval with extension in the foreland plate. Late orogenic shortening was however accommodated by the reactivation of a deeper ramp-dominated thick-skinned system prograding beneath and ahead of the thin-skinned thrust front. Similar structural styles and timing relationships have recently been reported to the ENE of the studied area in the Western Carpathians (e.g. Castellucio et al. Reference Castelluccio, Andreucci, Zattin, Ketchman, Jankowski, Mazzoli and Szaniawski2015) and in other collisional settings such as Taiwan, Western Alps, French Pyrenees (e.g. Lacombe & Mothereau, Reference Lacombe and Mouthereau2002) or the Andes (e.g. Carrera & Muñoz, Reference Carrera, Muñoz, Nemčok, Mora and Cosgrove2013), among others (e.g. Cooper, Reference Cooper, Ries, Butler and Graham2007).
The reasons for a change from initial extension in the foreland to generalized crustal coupling, shortening and late widespread erosion and extension in the Alpine–Carpathian Junction must be the result of large, lithospheric-scale processes. Based on seismic and tomographic studies, Kissling (Reference Kissling1993) and later Lippitsch, Kissling & Ansorge (Reference Lippitsch, Kissling and Ansorge2003) concluded that a lithospheric slab beneath the Western and Central Alps is present, and probably connected to some point to the European continental lithosphere. However, in the Eastern Alps a high-velocity body corresponding to a subvertical to steeply NE-dipping subducted lithosphere has been interpreted (Lippitsch, Kissling & Ansorge, Reference Lippitsch, Kissling and Ansorge2003). More recent works have indicated that a detached European slab might still be connected to the lithosphere that is still in place in the Central Alps and might also be connected to a slab graveyard further to the east, at the depth of the upper mantle transition zone (e.g. Bianchi, Miller & Bokelmann, Reference Bianchi, Miller and Bokelmann2014; Qorbani, Bianchi & Bokelmann, Reference Qorbani, Bianchi and Bokelmann2014).
In either case, subduction and related bending of the lower plate seems to be – at least partially – responsible for the syn-thrusting Eggerian–Karpatian (i.e. late Oligocene – late early Miocene) extension accommodated by the reactivation of the foreland and sub-thrust basement fault array (Fig. 14a). The curvature radii and the thickness of the bending plate would have controlled the amount of extension along the outer arc of the plate (e.g. Ramsay, Reference Ramsay1967; Turcotte & Schubert, Reference Turcotte and Schubert1982; Twiss & Moores, Reference Twiss and Moores1992; Fig. 14b). An important component of the observed extension could also relate to the retreat of the subducting lithospheric slab as a result of slab-pull forces, a process formerly proposed for the Carpathian arc (e.g. Decker & Peresson, Reference Decker, Peresson, Wessely and Liebl1996; Linzer, Reference Linzer1996) and more recently for the central region of the European Alps (e.g. Schlunegger & Kissling, Reference Schlunegger and Kissling2015). The reported high lateral gradient of EET from the rigid Bohemian massif to the significantly softer Jurassic continental margin seems to be the fundamental cause of the large degree of bending needed to explain the observed extension.
Lithospheric cross-section of the early Miocene collision represented by a subducting lower plate (left) being overridden by an upper plate (right). (a) The sharp transition from an extremely strong and rigid Bohemian massif to the softer Jurassic continental margin favours the acute bending of the lower plate, enhanced by the downward pull of the subducting slab. (b) Bending of a plate leads to the extension of the outer arc and contraction in the inner arc following the given equation. (c) Present-day lithospheric sketch. Slab break-off (or delamination of the orogenically thickened European lithosphere) triggered regional uplift (starting around Karpatian times in the studied area) and the associated excessive topographic load is compensated by basin inversion in the foreland and sub-thrust and the collapse of the hinterland summits. The retrowedge depicted in (a) has been dismantled by the middle–late Miocene regional extension and buried beneath the successor basins.

This high EET gradient is also supported by the narrow foreland basin of the Alpine–Carpathian Junction (Fig. 1). A SE-dipping deep detachment is therefore needed to explain the extension accommodated by the reactivation of the basement fault array (e.g. Bradley & Kidd, Reference Bradley and Kidd1991). A similar detachment beneath the Western–Central Alps foreland basin has also been proposed from the TRANSALP seismic profiling (TRANSALP Working Group, 2002) and field studies (e.g. Butler, Reference Butler, Cooper and Williams1989; Gillcrist, Coward & Mugnier, Reference Gillcrist, Coward and Mugnier1987). Synchronously, widespread out-of-sequence thrusting (e.g. Beidinger & Decker, Reference Beidinger and Decker2014) in the extremely flexed region was probably a response of the prowedge to compensate the sinking of the foreland by regaining relief whereas in the platform, out-of-sequence thrusting was favoured by the buttressing effect of the rigid foreland and the foreland pinch-out of the efficient Mikulov Formation detachment. In addition, thrust loading and formation of a retrowedge seem likely given the strong shortening recorded by tight folds in the basement of the Vienna Basin as well as S-verging folds in the Northern Calcareous Alps (e.g. Grünbach syncline) west of the Vienna Basin (Wessely, Reference Wessely2006).
We propose that deep-seated processes affecting the European slab (Fig. 14c) during the final stages of collision are the trigger mechanisms to explain the general uplift of the area as evidenced by landscape evolution, changes in the drainage and subsidence patterns, and the observed shortening styles (e.g. Fodor, Reference Fodor1995; VonBlanckenburg & Davies, Reference VonBlanckenburg and Davies1995; Neubauer, Genser & Handler, Reference Neubauer, Genser and Handler1999; Wessely, Reference Wessely2006; Genser, Cloetingh & Neubauer, Reference Genser, Cloetingh and Neubauer2007; Qorbani, Bianchi & Bokelmann, Reference Qorbani, Bianchi and Bokelmann2014; Legrain et al. Reference Legrain, Dixon, Stüwe, von Blanckenburg and Kubik2015). A large-wavelength rebound is well documented by Andeweg & Cloetingh (Reference Andeweg, Cloetingh, Mascle, Puigdefàbregas, Luterbacher and Fernàndez1998) in the Molasse Basin of western Austria, whereas in the studied area such uplift is demonstrated by the presence of Karpatian-age kilometre-scale canyon incisions (e.g. Dellmour & Harzhauser, Reference Dellmour and Harzhauser2012). This broad uplift is also supported by thermochronological and field studies in the Western Carpathians (e.g. Danišík et al. Reference Danišìk, Kohút, Broska and Frisch2010; Mazzoli et al. Reference Mazzoli, Jankowski, Szaniawski and Zattin2010; Zattin et al. Reference Zattin, Andreucci, Jankowski, Mazzoli and Szaniawski2011; Anczkiewicz, Środoń & Zattin, Reference Anczkiewicz, Środoń and Zattin2013; Andreucci et al. Reference Andreucci, Castelluccio, Jankowski, Mazzoli, Szaniawski and Zattin2013, Reference Andreucci, Castelluccio, Corrado, Jankowski, Mazzoli, Szaniawski and Zattin2015; Castelluccio et al. Reference Castelluccio, Andreucci, Zattin, Ketchman, Jankowski, Mazzoli and Szaniawski2015). The most probable candidates for such deep-seated processes are either oceanic slab roll-back and subsequent break-off, or delamination of the tectonically thickened European lithosphere (see Magni et al. Reference Magni, Faccena, van Hunen and Funicello2013). These processes probably started around Karpatian time (e.g. Dellmour & Harzhauser, Reference Dellmour and Harzhauser2012), but their effects protracted as shown by foreland subsidence analysis (e.g. Genser, Cloetingh & Neubauer, Reference Genser, Cloetingh and Neubauer2007) and the ages of calc-alkaline (20–11 Ma) and late alkaline magmatic series (9–1 Ma), indicating a transition from crustal contaminated magmas to asthenosphere-derived magmas generated by lithosphere extension, respectively (e.g. Embey-Isztin et al. Reference Embey-Isztin, Downes, James, Upton, Dobosi, Ingram, Harmon and Scharbert1993; Nemcok et al. Reference Nemcok, Pospisil, Lexa and Donelick1998; Seghedi et al. Reference Seghedi, Downes, Vaselli, Szakács, Balogh and Pécskay2004).
The fast rebound following the slab break-off (or delamination) most probably created an excessive topographic load along with drastic changes in the stress regime and high levels of shortening (e.g. Cloetingh et al. Reference Cloetingh, Burov, Matenco, Toussaint, Bertotti, Andriessen, Wortel and Spakman2004; Genser, Cloetingh & Neubauer, Reference Genser, Cloetingh and Neubauer2007). We propose that the Alpine–Carpathian tectonic wedge reacted by two mechanisms. (1) The reactivation of a deep detachment and the basement-involved extensional faults in the prowedge (i.e. basin inversion in the sub-thrust and in the foreland), with the subsequent broadening of the orogen. Basement shortening was most probably accommodated by a combination of distributed deformation in the crystalline basement and discrete heterogeneous simple shear along the deep detachment. (2) This was followed by the collapse of the hinterland orogenic edifice as represented by the opening of the Korneuburg, Vienna, Danube and Pannonian basins. Independently of the dominant strike-slip or oblique-slip activity of the Vienna Basin bounding faults (i.e. Steimberg and Mur-Mürz faults), these faults were key structural elements for the dismantling of the orogenic edifice. The transtensional dismantling around the Vienna Basin might have been enhanced by the shape of the Bohemian Massif foreland buttress.
A similar evolution has recently been proposed for the Western Carpathians and the associated Sub-Trata fault and its hanging-wall Liptov Basin (e.g. Castellucio et al. Reference Castelluccio, Andreucci, Zattin, Ketchman, Jankowski, Mazzoli and Szaniawski2015). In this sense, the ‘missing’ retrowedge (Fig. 14c) has been extended and buried beneath the thick sedimentary cover of the middle–late Miocene basin systems. Once the topographic load was reduced, the thrust system shut off. The collapse of the orogenic wedge was ultimately driven by subduction processes (i.e. roll back, retreat and final break-off or lithosphere delamination).
Acknowledgements
This is a contribution of the Institut de Recerca Geomodels and the Geodinàmica i Analisi de Conques research group (2014SGR467SGR) from the Agència de Gestió d'Ajuts Universitaris i de Recerca (AGAUR) and the Secretaria d'Universitats i Recerca del Departament d'Economia i Coneixement de la Generalitat de Catalunya. PG acknowledges financial support from OMV Exploration and Production GmbH (Project FBG307451). OMV Exploration and Production GmbH is also thanked for data supply and permission to publish. Andreas Beidinger, Ralph Hinsch and Herwig Peresson from OMV Exploration and Production GmbH are thanked for their comments and suggestions on the very first version of the manuscript. The final version of this paper greatly benefited from the thoughtful revisions by two anonymous reviewers. We would like to extend our appreciation to the editors for allowing us to publish in this special volume. Petrel modelling software by Schlumberger and Skua modelling software by Paradigm were used to build the 3D geological models. Move restoration software was used for cross-section construction.



