


1. Introduction
In response to criticism over poor public health service during Covid-19, the UK government (Prime Minister’s Office, 2025) announced reforms abolishing NHS England, increasing funding, and requiring English NHS trusts to create 5-year financial forecasts. Furthermore, in October 2025, NHS England (2025a) published a new “performance assessment framework” which, for the first time, provided a publicly available framework for evaluating the performance of all English NHS Trust service provider organisations (hereafter referred to as “NHS Trusts”). According to NHS England (2025a), all NHS Trusts are ranked within their league table using a two-stage process, which is summarised in Appendix A.
This new performance framework rates all NHS Trusts on a range of financial measures and service quality metrics. However, these are focused only on short-term delivery aspects and therefore are potentially subject to managerial manipulation (Bagenal, Reference Bagenal2025). For example, the NHS Counter Fraud Authority, which is responsible for protecting the NHS from fraud, bribery and corruption, revealed that it “prevented, detected and recovered” over £332m over the last two years (NHS Counter Fraud Authority, 2025a). It also reported that the number of referrals received in connection with data manipulation fraud by NHS provider organisations related to annual reporting increased three-fold from 2024 to 2025 (NHS Counter Fraud Authority, 2025b).
Moreover, the performance metrics fail to acknowledge the long-term financial sustainability pressures on NHS Trusts related to demographic trends. Furthermore, NHS England (2025b) has acknowledged the importance of actuarial knowledge and skills when devising its long-term plan. Consequently, questions remain over the longer-term financial viability of NHS Trusts, which is universal and funded by pay-as-you-go financing that is indirectly funded via National Insurance contributions. Furthermore, the UK actuarial profession has recently initiated research and working parties related to the UK public sector (e.g. Beddows, Reference Beddows2025).
This paper contributes to these actuarial insights by developing a financial valuation model, which provides insight into the long-term ability of two NHS Trusts to deal with societal level demographic shifts associated with ageing populations and declining birth rates. Financial sustainability is defined as the ability of an organisation to have sufficient revenues to cover financial obligations in the long term (Gleissner et al., Reference Gleissner, Günther and Walkshäusl2022). The model is primarily based on an intertemporal cash flow oriented, generational accounting model developed by Auerbach et al. (Reference Auerbach, Gokhale and Kotlikoff1991, Reference Auerbach, Gokhale and Kotlikoff1994) which has since been implemented in several countries at the whole-of-government accounting and fiscal policy level (Kotlikoff, Reference Kotlikoff2003). Some countries, like Australia and New Zealand, use generational accounting models to track overall government spending, including health care, both in the short and long term (e.g., Commonwealth of Australia, 2021). These models tie spending to long-term societal demographic trends and include assumptions about rising unit costs, such as those driven by technological advancements (OECD, 2024). In 2019, the New Zealand government delivered its first “Well-being Budget” that incorporates a Living Standards Framework that helps to analyse and measure the policy impact on intergenerational well-being of New Zealanders, including health outcomes (New Zealand Treasury, 2019).
Motivated by the concept of a governmental generational policy as outlined by Kotlikoff (Reference Kotlikoff2003) and subsequently implemented in these countries, an overlapping generations financial model is used to generate a return on investment related to societal-wide needs, called the “Social Return on Investment” (hereafter “SROI”) (Michaelson et al., Reference Michaelson, Abdallah, Steuer, Thompson and Marks2009). This concept was subsequently implemented by The Kirklees Council in conjunction with the consultancy firm Nef Consulting and the Yorkshire and Humber Partnership in 2012. SROI is argued to be a measurement framework, that “helps organisations to understand and manage the social, environmental, and economic value that they are creating” and “considers and values the full range of social benefits to all stakeholders, rather than simply focusing on revenue or cost savings for one stakeholder” (Yorkshire et al., 2012).
The paper is organised as follows: Section 2 provides a literature review and institutional background; Section 3 overviews the financial model and its underlying methodological basis; Section 4 applies the model to produce generational accounts and calculate the SROI for two NHS Trusts; Section 5 concludes and discusses the implications and provides policy recommendations.
2. Literature Review and Institutional Background
This study, consistent with relevant legal theory about the importance of retaining “social institutions” in a secular and democratic society (Mitchell, Reference Mitchell1967), assumes that the NHS system will continue in some form. Therefore, if the NHS in its current form will continue to remain part of the UK social welfare system, this section outlines alternative ways to measure how social health care is distributed among generational groups. It then reviews the relevant prior literature to which this proposal aims to contribute.
Generational policy typically refers to how governments manage the needs of both current and future populations, focusing on resource allocation across age groups and assigning responsibility for government fiscal spending related to publicly funded pensions, Medicare, and other social insurance arrangements (Kotlikoff, Reference Kotlikoff2003). To assess the economic effects of generational policy, various methods exist, primarily emphasising government fiscal policy and critiquing accounting-based approaches. This section outlines some of the most widely referenced methods and examines their shortcomings.
Generational accounting, as introduced by Auerbach et al. (Reference Auerbach, Gokhale and Kotlikoff1991) and Blanchard (Reference Blanchard1990), evaluates financial sustainability using intertemporal budget constraints. This method considers: (1) initial net assets, (2) total future net payments made by current generations, and (3) total net payments required from future generations. Net payments are the taxes generational groups pay minus the government transfers they receive. Subtracting the remaining lifetime transfer payments enables comparison between the impacts of policies on present and future generations. When future generations are expected to pay more, the fiscal policy is considered unsustainable, highlighting a fiscal gap that must be addressed to ensure intergenerational fairness.
As applied to the provision of public “pay-as-you-go” financed health care services, generational accounting can therefore be expressed by a simple equation in terms of public sector funding: the present value of remaining net payments of existing generations of contributors plus the present value of remaining net payments of future generations of contributors equals the present value of all future operating spending/consumption of the NHS Trust plus the current year t net surplus of the authority. All present values are year t (valuation year) values. Net assets of the fund refer to capital employed as at the end of the current year t. Alternatively, when illustrated in algebraic form (Kotlikoff, Reference Kotlikoff2003, p. 53), the equation is: $\rm \sum {N_{t,t + s}}{P_{t,t + s}}{\left( {1 + r} \right)^{ - s}} + \sum {N_{t,t - s}}{P_{t,t - s}} = \sum NO{E_{t + s}}{\left( {1 + r} \right)^{ - s}} + C{E_t}{\left( {1 + r} \right)^{ - 1}}$
Where N t,k is the per capita generational account in year t of the generation born in year k. For generations currently alive, N t,k denotes the per capita remaining lifetime net payments discounted to the current year t. For generations not yet born, N t,k refers to the per capita lifetime net payments, discounted to the year of birth. Σ stands for the maximum age of life, while the term P t,k stands for the population in year t of the cohort that was born in year k.
The first summation on the left-hand side of equation (1) adds together the accounts of future generations, discounted at rate r to the current year t. The second summation adds the accounts of existing generations. The first term on the right-hand side of equation (1) expresses the present value of a NHS Trust’s total future net operating expenditure cash flows in year s, t, given by NOEst, which are also discounted to year t. The remaining term on the right-hand side, CEt, denotes an NHS Trust’s explicit current net capital employed as at the end of the current financial year, as published in the latest audited accounts, given by the difference between the sum of current plus non-current assets less current liabilities.
The generational accounting approach assumes a “hypothetical generational policy” designed to correct any imbalances. In contrast, Gokhale and Smetters (Reference Gokhale and Smetters2003) proposed another method – generational accounting based on actual current policy. Their approach defines the “fiscal imbalance” (FI) as the present value excess of total government expenses over available resources and assets at the end of time t. The portion of FI attributable to past and current generations is called “generational imbalance” (GI). Since GI encompasses all transactions with these groups during their lifetimes, the difference (FI minus GI) forecasts the portion of FI that will fall on future generations. Unlike traditional generational accounting, which involves an imagined policy change to bring FI to zero by increasing taxes on the unborn, Gokhale and Smetters’ method reflects real-world budget conditions. For instance, expanding public health insurance benefits increases the imbalance linked to past and present generations (GI), while reducing the burden on future generations (FI–GI) by the same amount, keeping overall FI unchanged. Standard fiscal imbalance calculations may miss this redistribution, as they aggregate net transfers under existing policies; but the shift becomes evident when examining GI (Gokhale & Smetters, Reference Gokhale and Smetters2003).
There are several limitations of the “generational accounting” approaches as outlined above, which are summarised by Tremmel (Reference Tremmel2009). These include the need to forecast several key methodological assumptions that are sensitive to change, such as those related to demographic developments, life expectancy, interest rates, growth rate of the economy, birth rates, and labour force participation rates. Furthermore, it is assumed that persons alive in the base year will enjoy the advantages of the current financial policy for all their lives, despite the sustainability gap, while succeeding generations will start closing that gap due to the assumed intemporal government budget restriction. Finally, the analysis is constrained only to the development of government fiscal policy and therefore ignores other forms of capital accounts (e.g. social, natural, human, and cultural capital) (Tremmel, Reference Tremmel2009, p. 76).
While the generational accounting model has been widely utilised in analysing various fiscal government policy settings (see Kotlikoff, Reference Kotlikoff2003 for an overview), comparatively little research has examined the application of generational accounting to assess the financial sustainability of public health care systems. Klumpes (Reference Klumpes2001) used generational accounting to assess Australia’s public health care finances. The study found that younger and future generations have positive accounts, while older generations’ accounts are negative, indicating that younger generations are subsidising older generations’ public health services. Klumpes and Tang (Reference Klumpes and Tang2008) analyse the UK NHS’s cost distribution using Gokhale and Smetters’ fiscal and generational imbalance concepts. Drawing on historical and projected demographic data, they find notable cost disparities by gender, region, and expenditure type. Their results suggest that fiscal and generational imbalances contribute to NHS underfunding and significant intergenerational inequity.
These previous studies use national-level statistical and financial data from Australia and the UK. In contrast, Klumpes (Reference Klumpes2025) focuses on FI and GI imbalances at the Norwich and Norfolk NHS Foundation Trust, analysing two decades of revenue and expenditure data plus UK-wide population projections. Results indicate that the Trust’s FI will rise significantly, while positive GI values suggest cash outflows will exceed inflows from current taxpayers.
First, in contrast to Klumpes (Reference Klumpes2025), which used the Gokhale and Smetters (Reference Gokhale and Smetters2003) FI and GI imbalances approach, this study uses generational accounting methodology as outlined above. There are two reasons for this choice. First, it focuses on how current UK government funding policy affecting the long-term financial sustainability of NHS Trusts is evolving to provide a more solid foundation, as announced by the Chancellor of the Exchequer in the Autumn 2025 Budget Announcement: “But for our National Health Service, I will reinvest all of these savings back into… investing in the future of our NHS” (UK Chancellor of the Exchequer, 2025). By contrast, Klumpes (Reference Klumpes2025) relied on then current government policy. Second, generational accounting is consistent with the approach adopted by the Commonwealth of Australia (2021) in publishing its 5-year generational accounts.
This study also employs a range of methodological assumptions that differ from those presented in Klumpes (Reference Klumpes2025), including variations in sample selection, population projections, gender distribution, generational cohorts, and financial activity, as detailed in Table 1 and further discussed in the Section 3. Additionally, whereas Klumpes (Reference Klumpes2025) applied only the UK gilt rate (4% in 2024) for discounting, this study adopts a combination of discount rate assumptions within its financial model. The rationale for these distinctions is multifaceted. Firstly, intergenerational justice theory suggests that a social discount rate should be utilised for investment projects with long-term impacts, such as global warming, aligning their conceptual treatment with that of projects affecting the immediate future (Dasgupta et al., Reference Dasgupta, Maler, Barrett, Portney and Weyant1999). Secondly, the social discount rate is integral to broader social investment theory, as outlined by Freeman et al. (Reference Freeman, Groom and Spackman2018), who advocate for consistency with the UK HM Treasury State Time Preference (STP) rate of 3.5%, currently referenced in the latest HM Treasury “Green Book” guidance (HM Treasury, 2022). By contrast, this study uses a capital asset pricing model risk-premium approach as proposed by Gollier (Reference Gollier2012) and subsequently adopted by several governments according to Freeman et al. (Reference Freeman, Groom and Spackman2018), to discount future operating cash inflows (which are primarily sourced from national insurance contributions); and a weighted average cost of capital approach, to discount future operating cash outflows (which are subject to the financial capital obligations and unfunded pension commitments).
Size and distribution features of two NHS Trusts

Table 1 Long description
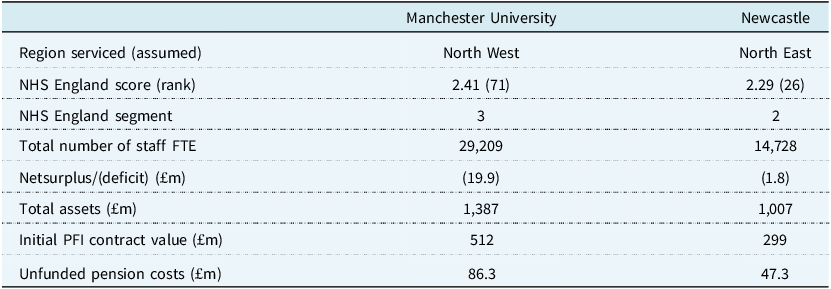
The table compares the size and distribution features of two NHS Trusts, Manchester University and Newcastle, across several metrics. It includes data on the region serviced, NHS England score and rank, NHS England segment, total number of staff FTE, netsurplus/deficit, total assets, initial PFI contract value, and unfunded pension costs. Manchester University serves the North West region with an NHS England score of 2.41 and rank 71, while Newcastle serves the North East region with a score of 2.29 and rank 26. Manchester University has 29,209 staff FTE compared to Newcastle’s 14,728. Manchester University has a netsurplus/deficit of negative 19.9 million pounds, whereas Newcastle has negative 1.8 million pounds. Manchester University has total assets of 1,387 million pounds, and Newcastle has 1,007 million pounds. The initial PFI contract value for Manchester University is 512 million pounds, and for Newcastle, it is 299 million pounds. Unfunded pension costs are 86.3 million pounds for Manchester University and 47.3 million pounds for Newcastle.
3. Methodology
3.1. Generational Cohorts and Model Time Horizon Assumptions
For analysis, generational accounts are separated into two groups: five cohorts aged 15 to 75+ with current or imminent voting rights, namely Generation Z (15–30), Generation Y (31–45), Generation X (46–60), retired (60–75), and elderly (75+); and those under voting age and future generations. Unlike Klumpes (Reference Klumpes2025), which uses only 4 generational cohorts of 20-year duration each, this model uses 15-year cohorts aligned with established research on generational behaviour.
The generational accounting analysis uses a 50-year time horizon due to limited population projection data and alignment with standard forecasting practices (e.g., Australia’s 40-year model). However, this approach does not allow for assessment of long-term financial policy impacts where future generations bear indefinite responsibility for underfunding.
3.2. Sample Selection Procedure
To demonstrate the financial sustainability management methodology, the model is applied to two similarly sized NHS Trusts with comparable objectives. The selected trusts meet four criteria: (1) established as foundation NHS Trusts with delegated management and stakeholder engagement; (2) providing English regional-wide acute hospital services that are linked to population trends; (3) affiliated with university departments and receive UK government R&D funding; and (4) exposed to long-term borrowing via substantial, multi-period PFI contractual commitments.
Two NHS Trusts were chosen through specific sample selection procedures: (1) Manchester University Hospital NHS Foundation Trust; and (2) Newcastle University Hospital NHS Foundation Trust. Table 1 provides a summary of descriptive statistics for these NHS Trusts.
Table 1 reports various regional and hospital statistics related to the two NHS Trusts. The NHS England (2025c) score and ranking is also shown. The NHS Trust is assumed to primarily service patients that are based in the geographical region in which its primary acute hospital facilities are located. The life expectancy and population statistics are sourced from Office of National Statistics (2025). The total number of staff (full time average estimate), total assets, net financial surplus and PFI (initial) contract value is sourced from the 2024 to 2025 Annual Reports of each of the two sample hospital NHS Trusts. Unfunded pension costs are calculated as the difference between:
-
• the actual annual contribution made by each of the two sample NHS Trusts to the NHS Pension Scheme and
-
• the amount that is required to be made to equate the 50% annual shortfall between annual total NHS Pension scheme contributions receivable from these Trusts and the sum of service and financing costs (NHS Business Services Authority, 2025).
Table 1 shows that both sample NHS Trusts were ranked in the top quartile of the NHS England performance scores of all English NHS Trust provider organisations, although only the Newcastle NHS Trust is ranked within the second segment. Both Newcastle and Manchester NHS Trusts reported net deficits of £1.8 million and £19.9 million, respectively.
The statistical information reported in Table 1 shows that all three NHS trusts are similar in terms of number of staff and in total assets. Furthermore, the PFI contractual obligations of the Newcastle NHS Trust are significantly higher than those of Manchester NHS Trust. Finally, while both NHS Trusts reported significant contributions towards the NHS Pension Scheme, these are significantly below the amount required to equate the annual total contributions receivable to the sum of service costs and finance costs.Footnote 1
3.3. Data and Data Sources
The financial data utilised in this study is sourced from the latest 2024/25 annual reports and accounts provided by each of the two sample NHS Trusts. Relevant data was extracted from the total operating cost and revenue figures reported in the profit and loss statement, the total capital employed is taken as presented in the statement of financial position, and comprehensive details pertaining to annual pension expenses and PFI-related interest costs as disclosed within the accompanying footnotes. It should be noted that the total operating contribution revenue of both sample NHS Trusts was less than their total operating expenditures, which has important implications for the interpretation of the generational accounts produced below.
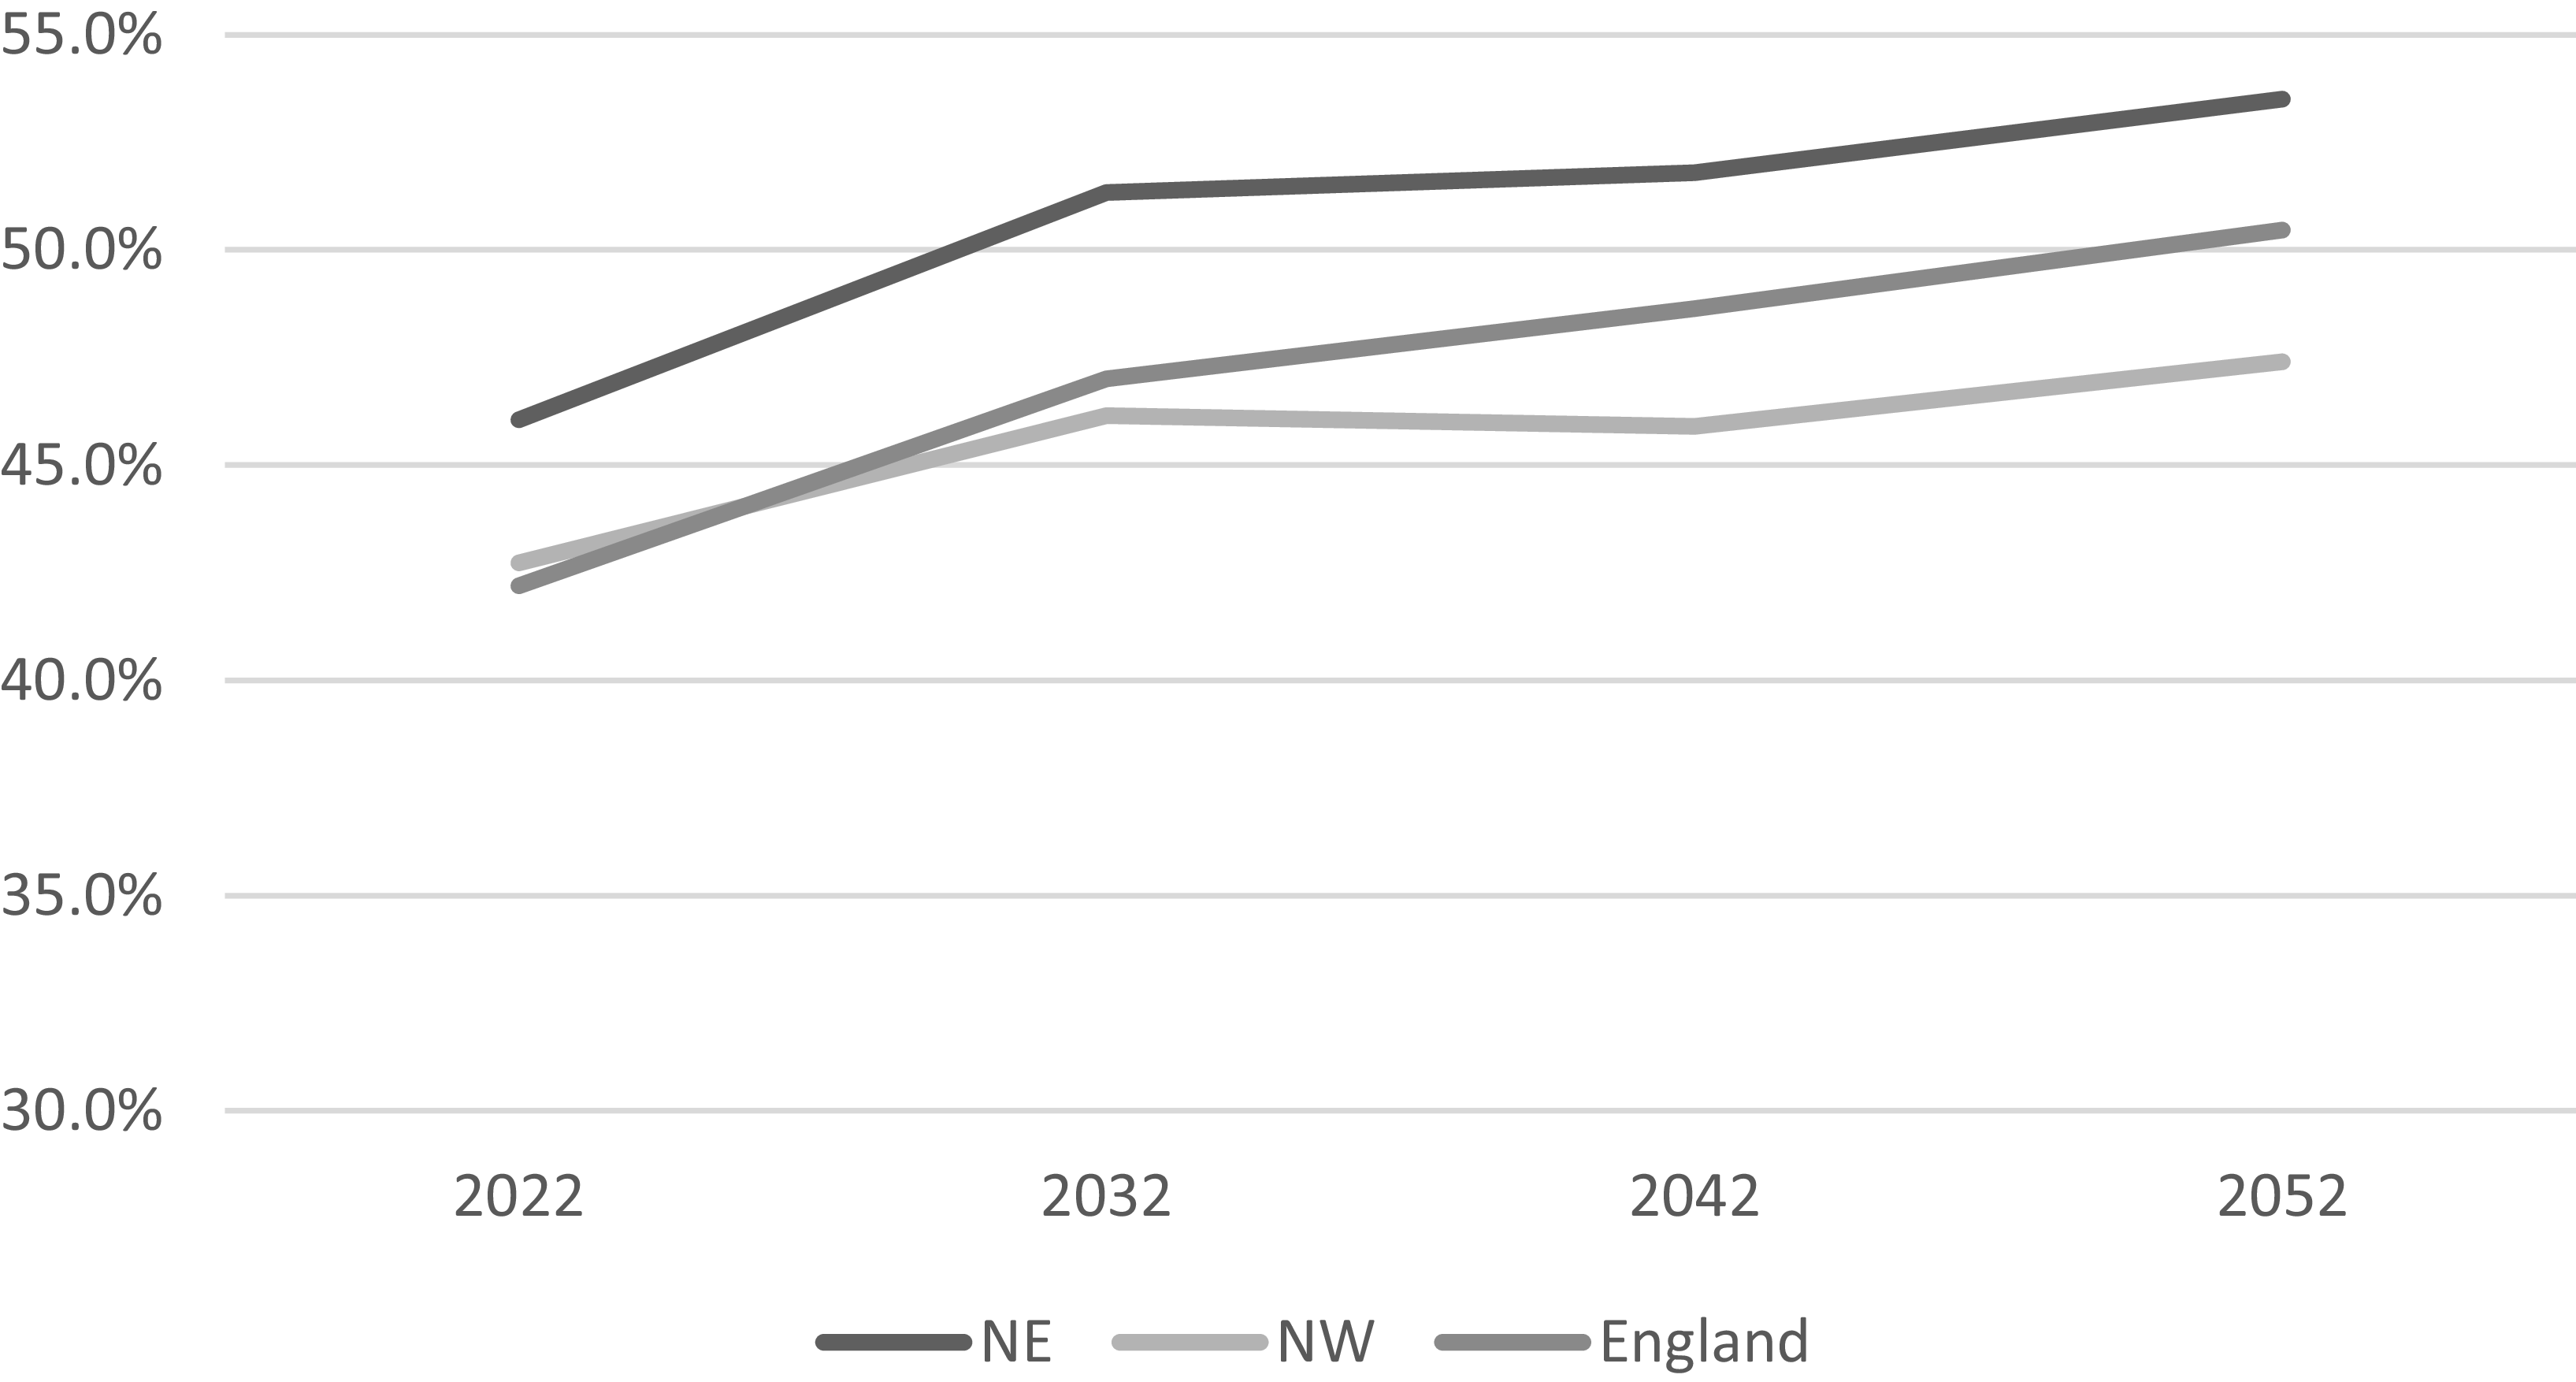
The statistical data comes from the Office of National Statistics (2025) regional population projections for England. These projections present five-year demographic updates on both population size and characteristics for each major English region, covering the years 2022–2048. Figure 1 highlights the main trends in projected old age dependency ratios for two English regions – Northwest (Manchester University NHS Trust) and Northeast (Newcastle University NHS Trust), when compared to the UK-wide average trends.
Projected old age dependency ratios for various regions of England 2022–2048.

Figure 1 Long description
The line graph illustrates the projected old age dependency ratios for the Northeast, Northwest, and England as a whole from 2022 to 2052. The y-axis represents the percentage of the population aged 65 and over, ranging from 30 percentage to 55 percentage. The x-axis represents the years 2022, 2032, 2042, and 2052. The Northeast region shows the highest projected dependency ratio, starting at around 45 percentage in 2022 and increasing steadily to approximately 54 percentage by 2052. The Northwest region follows a similar trend, starting at around 43 percentage in 2022 and reaching about 50 percentage by 2052. England as a whole starts at around 42 percentage in 2022 and is projected to reach approximately 48 percentage by 2052. The graph indicates a consistent upward trend in the old age dependency ratio across all regions over the 30-year period.
The following definitions are obtained from the Office of National Statistics (2025b, p. 10). The Old-age dependency ratio (OADR) is defined as the number of people of State Pension age (SPA) per 1,000 people of working age. The population of State Pension age is defined as anyone who is over the State Pension age, regardless of whether they have retired or not. Projections of the State Pension age population reflect future changes under existing legislation. The working age population is defined as anyone aged between 16 years and the State Pension age, regardless of whether someone is employed. For simplicity and consistency with demographic modelling assumptions used elsewhere in this paper, it is assumed that the SPA retirement age is 70 years.
Figure 1 illustrates notable variations in the proportion of elderly individuals across the English regions served by both NHS Trusts. Whereas the Northeast region does not significantly deviate from national patterns, the Northwest region is expected to maintain lower and less rapidly increasing old age dependency ratios relative to overall population projections for England.
3.4. Discount Rate Modelling Assumptions
The discount rate used for modelling the future expected operating cash inflows is based on the Gollier (Reference Gollier2012) CAPM-based rate (i.e. 7.8%), which comprises the sum of the Bank of England current gilt rate of 3.75%, plus an equity risk premium of 4%, multiplied by beta, which is estimated to be 1.09 as per the current rate for a large listed UK insurance company which has significant private health insurance policy exposure (both rates are sourced from a public financial database website). A Weighted Average Cost of Capital (WACC) estimate approach for financing and equity proportions linked to NHS Trust operating expenditure is used. This includes long-term financing commitments from PFI contracts and pension underfunding. The model uses Jin et al. (Reference Jin, Merton and Bodie2006) WACC plus pension risk pricing model, with Klumpes’ (Reference Klumpes2024) extension. The cost of equity is set at a 4% margin rate per Prudential Regulatory Authority guidance (PRA, 2024), and the cost of debt is the average 12% IRR for PFI contracts estimated by HM Treasury (2023).Footnote 2
Due to the onerous nature of ongoing explicit contractual liabilities associated with servicing long-term PFI contracts, and implicit obligations associated with underfunding of pension costs, the WACC model yields a higher discount rate for combined equity and debt capital used in the projected future operating expenditures of the two NHS Trusts than the equivalent CAPM rate applicable to their projected future operating revenue streams. This creates a positive interest “margin spread” (varying from 0.8% for Newcastle NHS Trust to 2.3% for Manchester NHS Trust), that depends on the extent of leverage associated with the proportion of their debt capital (comprising PFI contractual commitments and estimated underfunded pension obligations) to their equity capital.
Both the CAPM and WACC models therefore factor in systematic risk when evaluating long-term financial decisions related to English NHS Foundation Trusts. This is because their governing structures and financial duty of care are broader in scope and thus have a risk culture-tolerance level that accepts higher risks to meet their strategic goals than other types of NHS Trust. The WACC model is more likely to be applicable to large NHS foundation trusts (such as those in the study sample) that have both significant staff numbers and exposure to contractually onerous long-term PFI obligation commitments.
3.5. Financial Cash Flow Model Specification
The financial cash flow model is based on a standard corporate valuation XLS template, which projects forward 50-year estimates of operating revenue and operating expenditures relative to the two NHS trusts based on their latest published annual accounts, when discounted using the alternative interest rate scenarios outlined above. These estimated operating revenues and costs are then allocated to each of the six cohorts of existing generations and future generations based on the Office of National Statistics (2025) demographic population projections associated with each of the English regions. The generational accounts are then estimated for each generational cohort, separately for male and female sub-populations. These are then totalled by cohort and by gender to derive the total generational accounts. The difference between the sample NHS Trusts’ total future estimated cash operating receipts and expenditures over the forecast horizon, and those explicitly associated with the six existing generational cohorts, is then deduced as being related to future generations. Appendix B provides an outline of the financial cash flow model, which is based on the following key parameters and assumptions:
-
• The annual forecasted operating revenue and expenditures for the two sample NHS Trusts are drawn from their 2024 to 2025 Accounts. For the WACC model, figures from PFI contractual commitments and NHS pension contributions footnotes are also included.
-
• The model’s forecast horizon period spans 50 years, commencing with financial reporting periods beginning in 2025 and concluding in 2074. Throughout this period, projected future cash flows are discounted annually according to each of the four costs of capital scenarios described in the preceding section.
-
• To create generational accounts, NHS Trust operating revenue and expenditure are divided by projected total regional male and female populations for per person estimates. Operating revenue is assumed to be financed through National Insurance contributions of working-age cohorts, whereas operating expenditure is assumed to be associated with the entitlement to use the NHS Foundation trust service provision by all generational cohorts.Footnote 3 These figures are then adjusted by each gender’s share of the regional population. For most cohorts, future cash flows are calculated over a decade based on median age and updated with each new projection; cohort 1 (over 75s) uses estimated average remaining lifespan.Footnote 4
-
• By contrast, the estimated underfunded pension costs and PFI interest payments are assumed to be fixed and do not vary depending on either the regional population or number of individuals utilising the hospital services.
-
• The final generational accounts are then summarised by both gender and generational cohort to provide the final generational statements of intergenerational equity. These show how the total future projected cash flows of operating receipts and operating expenditures of each of the two sample NHS Trusts are sourced from contributions and receipts from current and future generations, respectively.
4. Discussion of Statements of Financial Sustainability
4.1. Generational Accounts
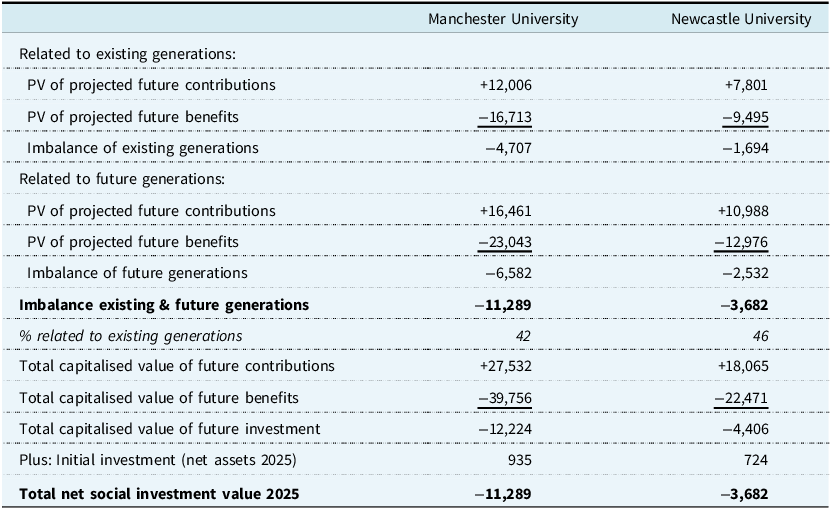
Table 2 reports the baseline scenario summary level generational accounts related to both existing and future generations, for both sample NHS Trusts, in accordance with the layout set out in equation (1).
Generational accounts – two english NHS Foundation Trusts

Table 2 Long description
The table compares generational accounts for Manchester University and Newcastle University, focusing on projected future contributions, benefits, and imbalances. It includes data related to existing and future generations, such as the present value of projected future contributions and benefits, imbalances, and total capitalized values. The table has 15 rows and 2 columns, with headers for Manchester University and Newcastle University. Key trends include higher imbalances for Manchester University in both existing and future generations, with notable differences in the present value of projected future contributions and benefits between the two universities.
Table 2 reports the generational accounts of the two sample NHS Trusts. The generational accounts are based on the discounted net (contributions less benefits) cash flows, attributable to existing generations and future generations, over a 50-year forecast horizon. The forecasted contribution cash inflows are discounted using the capital asset pricing model (CAPM) and the forecasted benefit outflows are discounted using the weighted average cost of debt and equity capital (WACC), respectively. The baseline year is the 2025 benefit and contribution cash flows, and the initial investment outlay is assumed to be equal to the net capital employed of the NHS Trust, based on figures reported in the 2024–2025 annual reports. The imbalance related to future generations is deduced from the total net capitalised value of contributions less benefits, minus the net imbalance related to existing generations.
The first three rows of Table 2 summarise the combined generational accounts for existing generations in relation to their total contributions, benefits and net balances, respectively. The total combined generational imbalance related to both existing and future generations is then reported. These show that both existing and future generations have negative net generational balances, although the magnitude of these differ significantly across all three trusts, with Manchester NHS Trust showing a significantly higher negative net imbalance than Newcastle NHS Trust.
Table 2 also shows that the percentage of total generational account imbalance that is related to existing generations for Newcastle NHS Trust is slightly higher (46%) than for Manchester NHS Trust (42%). This is likely due mainly to the relatively lower life expectancy rates in the North East English region, and because the magnitude of its net operating loss is relatively lower than of the North West English region.
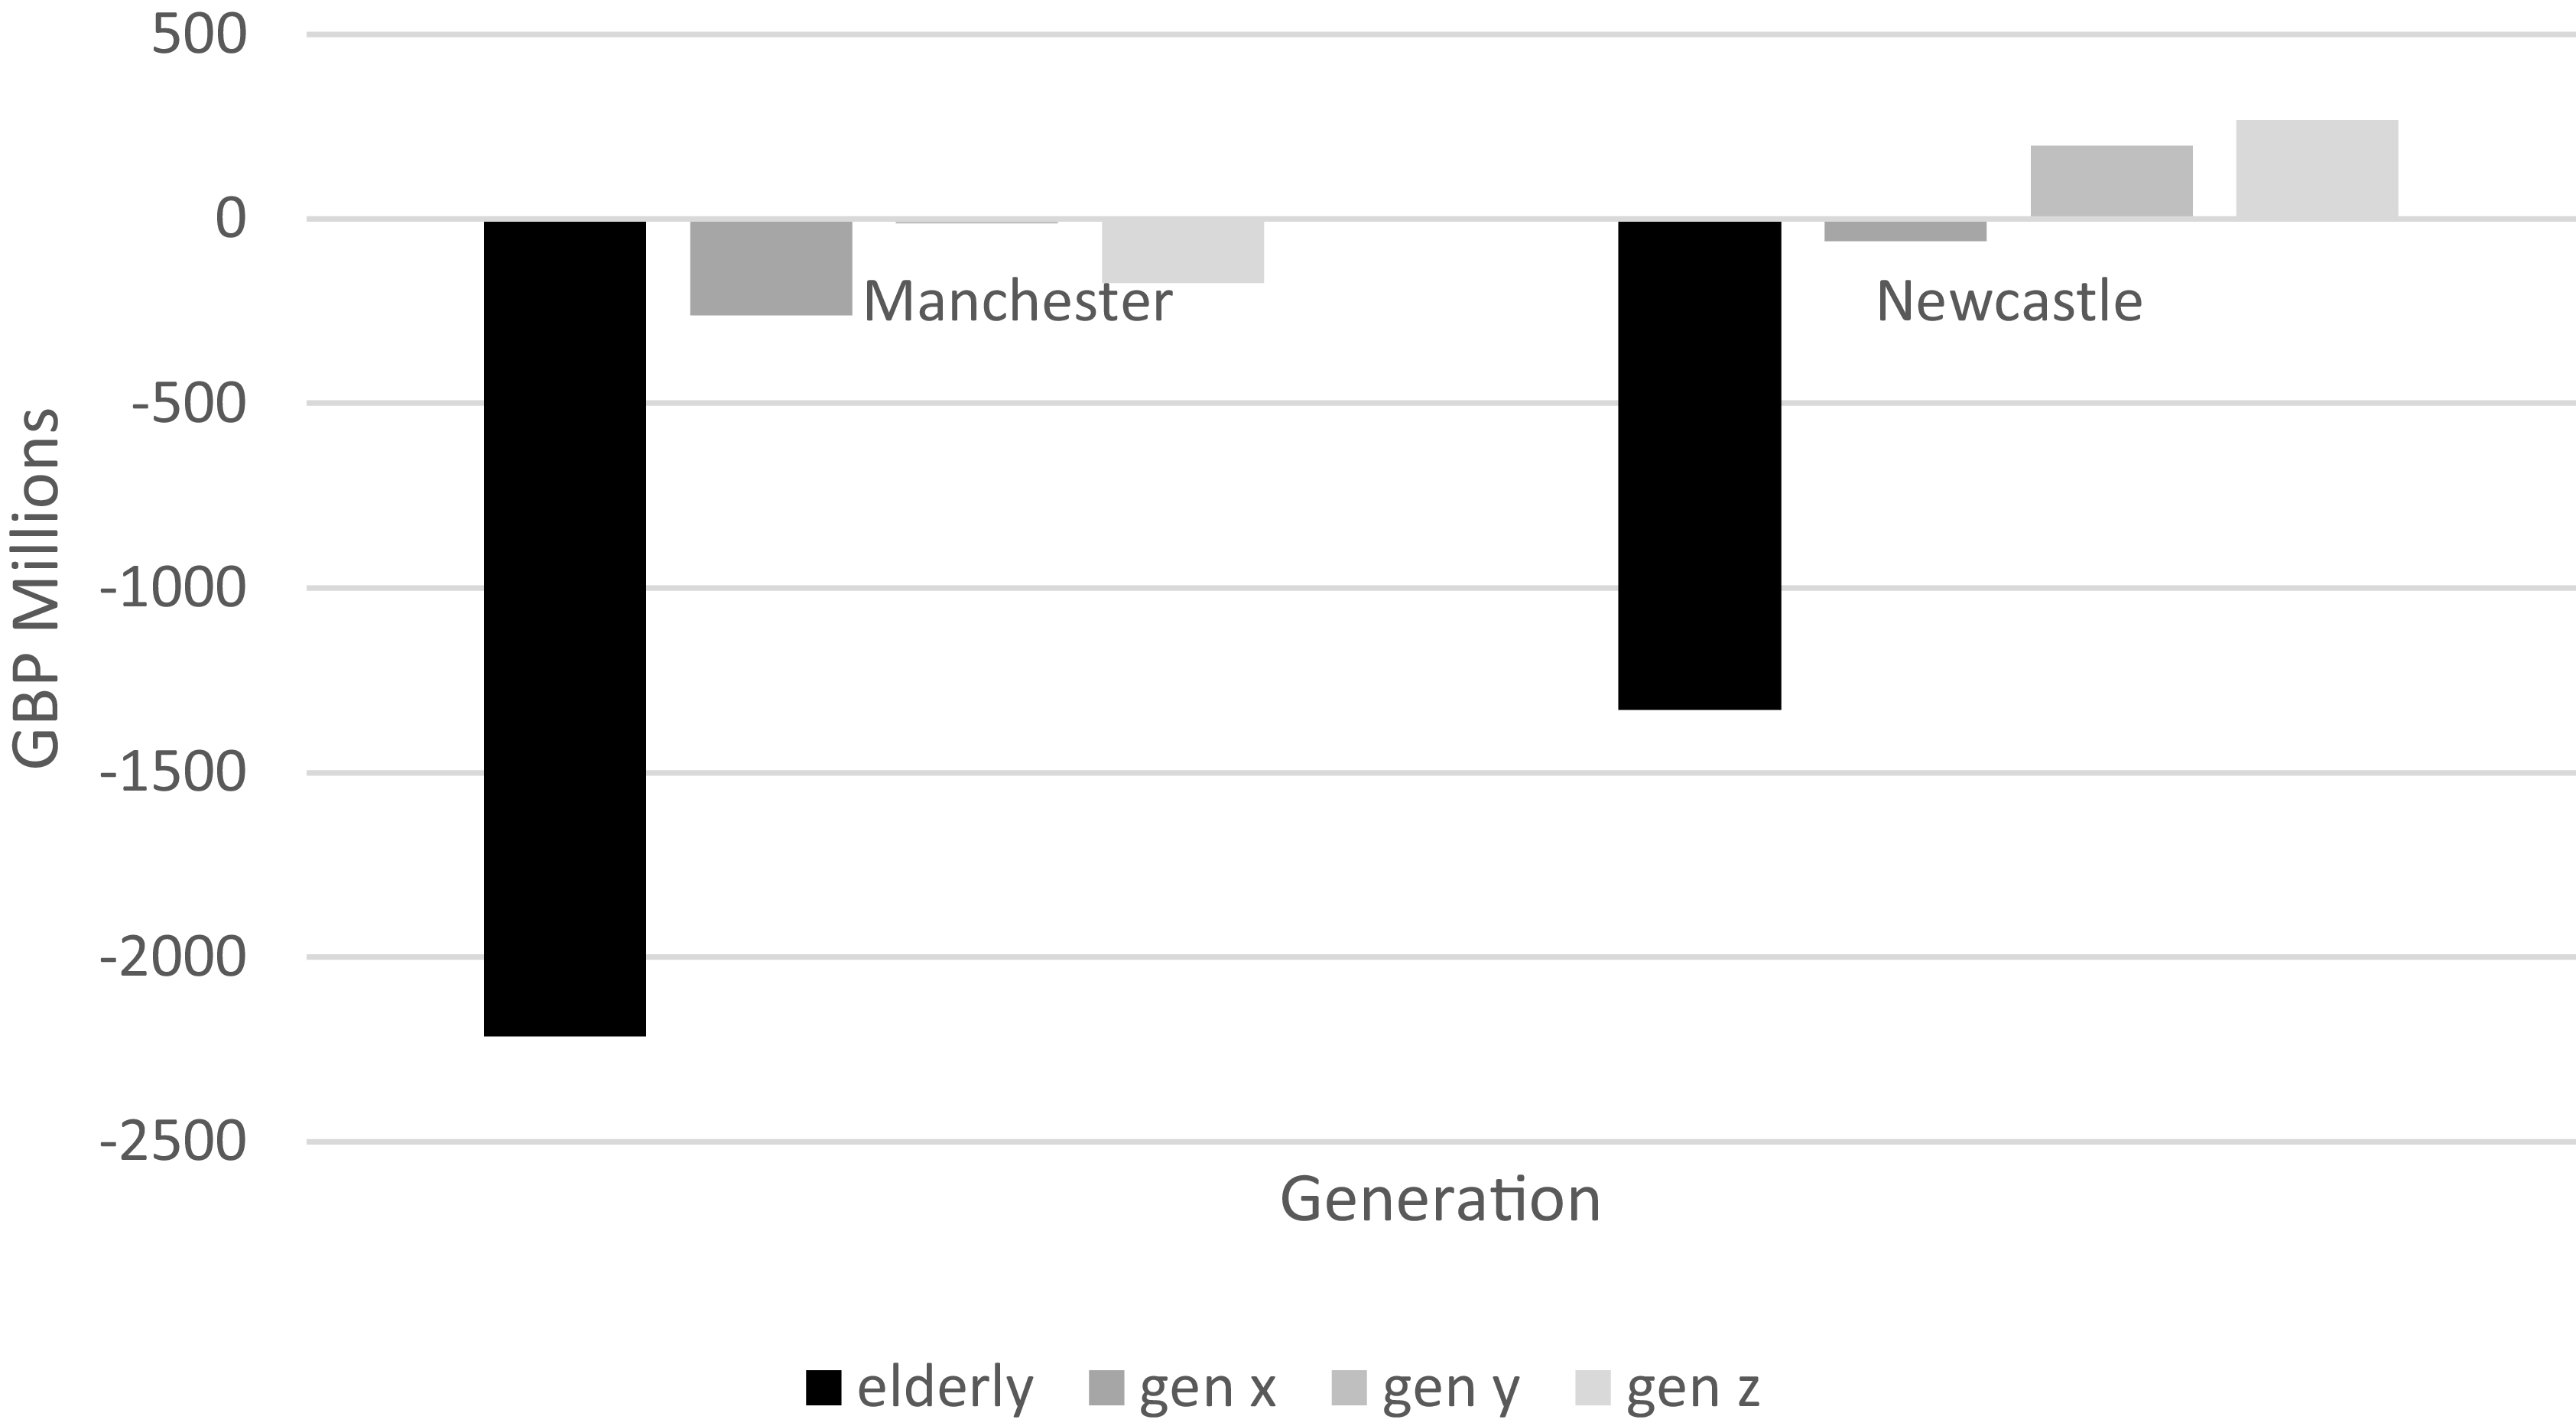
Figure 2 provides more detailed insight into the magnitude and incidence of net imbalances between the four existing generational cohorts that have the greatest exposure to financial sustainability issues related to the two sample trusts i.e., retired generations (baby boomers and elderly) and generations X, Y and Z.
Detailed generational accounts by existing cohort.

Figure 2 Long description
The bar graph compares financial measures and service quality metrics across different generational cohorts within the NHS. The x-axis categorizes the cohorts into elderly, generation x, generation y, and generation z. The y-axis measures the performance values, ranging from negative 2500 to positive 500. The graph features two data series represented by different colors: dark gray for MANCS and light gray for NCL. The elderly cohort shows significant negative values for both MANCS and NCL, with MANCS reaching approximately negative 2500 and NCL around negative 1500. Generation x displays slightly negative values for both MANCS and NCL, close to zero. Generation y has near-zero values for both data series. Generation z shows positive values for both MANCS and NCL, with NCL slightly higher than MANCS. The graph indicates potential managerial manipulation in short-term delivery aspects, as highlighted by the NHS Counter Fraud Authority’s findings on data manipulation fraud. All values are approximated.
Figure 2 shows that, for both trusts, whereas the baby boom generational cohort has significantly negative net balances, in contrast both generation Y and generation X have relatively insignificant positive (Newcastle NHS Trust) and negative (Manchester NHS Trust) net balances, respectively. This suggests that overall, young and working age generations are effectively subsidising the provision of NHS acute hospital services provided to by more elderly generational cohorts. Although these overall variations are the same for both sample NHS Trusts, the degree of variation is much higher for Manchester than Newcastle. This is likely due to the fact that there is a relatively higher proportion of young people residing in the North West region.
4.3. Social Return on Investment (SROI)
The SROI is a framework guided by principles that assess and assign value to the wider social, environmental, and economic effects of an investment or activity. It translates these “extra-financial” outcomes into monetary terms, demonstrating the overall value generated for stakeholders – often shown as a ratio (e.g., £3 of social value for every £1 invested). Social Value UK (previously known as the SROI Network) has created a comprehensive structure for measuring and managing SROI across public, third sector, and business settings. According to The SROI Network (2012), there are two main types of SROI:
-
• Evaluative SROI, which looks back at and measures actual outcomes that have already occurred.
-
• Forecast SROI, which estimates the amount of social value likely to be generated if activities achieve their intended results.
This research uses the generational imbalances reported in Table 2 to estimate SROI related to NHS Foundation Trust services. Manchester NHS Trust shows a lower social value due to significant imbalances, while Newcastle NHS Trust show a higher SROI with minimal intergenerational disparities.
In applying the SROI concept to evaluating the degree of intergenerational imbalances in practice, the SROI framework as developed by Social Value UK (SROI Network, 2012) has been applied in a number of different business, public sector and third sector contexts. Its nature and scope may vary considerably, depending on the governance structure and main strategic objectives of the NHS Trust. It is designed to be aligned with the authority’s 5-year plan.
5. Conclusions, Implications and Recommendations
This research introduces a SROI metric tailored to address long-term demographic risks that may impact the financial sustainability of NHS Trusts. Its application is illustrated by using two NHS Trusts. The SROI shows generational imbalances between both existing and generational cohorts that associated with demographic trends affecting the financial sustainability of the sample NHS Trusts.
There are several limitations of this approach. First, the “generational accounting”-based SROI measure as outlined is only one methodological approach towards the modelling of the impact of societal-wide demographic risks on provision of public health care services. In addition to the alternative “Fiscal and Generational Imbalance” approach proposed by Gokhale and Smetters (Reference Gokhale and Smetters2003), more specific simulation modelling tools may be applied that are within the skill sets of professional actuaries. Second, the financial model is highly sensitive to changes in longevity, discount rates, population growth, and technological advances. These may significantly impact the reliability of the SROI measure for capital allocation decisions.
The SROI metric can enhance current short-term operational measures in NHS England’s framework by offering insights into the financial sustainability challenges posed by ageing populations. Its applications extend to other types of UK NHS Trusts and to equivalent public health care provider organisations based in other OECD countries that are likely to face similar demographic shifts. Additionally, evaluating SROI by generational cohort highlights significant policy issues, such as how younger generations effectively subsidise NHS services provided to older generations, influencing debates on public health funding and generational fiscal policies.
There are also several implications of this research proposal for actuaries, both individually and collectively, concerning the application of “social value” issues, which are increasingly becoming issues of public concern regarding the quality of the provision of publicly funded social services such as health care.
The main recommendations of this research proposal are:
-
• English NHS Trusts should be statutorily required to publish supplementary “generational accounts” alongside their main audited financial statements in their annual reports (e.g., updated triennially), together with a statement that it was reviewed and approved by a qualified UK actuary.
-
• NHS England should incorporate a SROI metric into its performance evaluation system for English NHS trusts (NHS England, 2025a, b) to evaluate how English NHS trusts address long-term demographic risks, as well as their unfunded PFI and pension obligations.
-
• The IFOA should facilitate a public discussion on the costs and benefits of the UK government adopting a “generational public policy” in relation to its key publicly funded health care and other related social insurance obligations.
-
• The UK actuarial profession should be more proactive in supporting both national (e.g. Social Value UK) and international (e.g. Taskforce for Social and Inequality Disclosures) initiatives concerning social value and their implications for businesses, third sector and public sector organisations.
In terms of next steps, it is hoped that this research will facilitate a broader discussion agenda within the UK actuarial profession concerning the relevance and salience of “societal value” for actuaries, both in practice and more generally. The author has been invited to participate in deliberations by a working group that has been tasked with identifying societal value-added opportunities for actuaries. Additionally, the IFOA is encouraged to provide publicity about the value of actuarial skill sets in addressing critical social issues such as underfunding of NHS public health expenditure, and publishing a regularly updated “Generational Equity Index” for the UK along the lines of that already produced for Australia by the Actuaries Institute (2020).
Appendix A: NHS England (2025a) Performance Evaluation of English NHS Trusts
This Appendix briefly outlines the major aspects of the two-stage performance benchmarking methodology that was employed by NHS England (2025a) to evaluate the performance of all English NHS Trusts, which was initially implemented in October 2025.
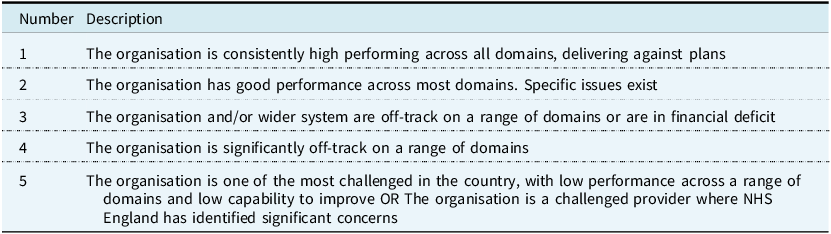
First, each trust is assessed to be within a segment. Trusts are grouped by their segment number (1–4). Segment 1 trusts are ranked highest, followed by segment 2, then 3, and finally 4. As part of the scoring methodology an override relating to organisational, not system-wide, financial performance will be applied. The override means all organisations in deficit or in receipt of deficit support will be limited to an organisational delivery score of no more than 3 (NHS England, 2025b).
In the second stage, “trusts are then ranked by their average metric score. A lower score means a better ranking. The top ranked trust will be the segment 1 trust with the lowest average metric score, the lowest ranked trust will be the segment 4 trust with the highest average metric score” (NHS England, 2025b). The performance assessment process measures each provider’s delivery on key metrics across 5 domains.
Scoring Domains:
-
1. Access to services (elective, cancer, urgent and emergency, mental health).
-
2. Effectiveness and experience of care.
-
3. Patient safety.
-
4. People and workforce.
-
5. Finance and Productivity.
Additionally, a non-scoring domain (improving health and reducing inequality) was measured. A four step segmentation process was used, comprising the following steps:
-
1. Organisational delivery score.
-
2. Financial override (i.e. whether or not the NHS provider organisation had a deficit or surplus).
-
3. Identification of most challenged providers (based on audits by a Quality Assurance Agency).
-
4. Final segment outcome.
The segment outcomes are categorised in Table A1 (NHS England, 2025b, Table 2).
Segment outcomes for NHS trust assessment

Appendix B: Overview of Financial Valuation Model – Generational Accounts of Two NHS Trusts
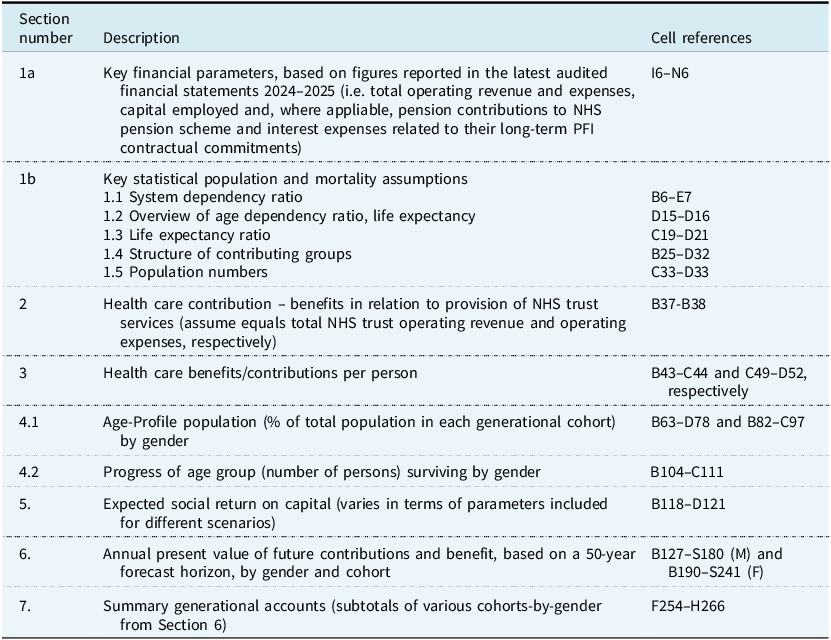
This Appendix briefly describes the main features of the XLS financial valuation model that was developed to illustrate how generational accounts can be constructed, based on each of the two sample English NHS trusts. The template comprises two worksheets that provide a valuation and generational accounts for each of the for each of the two sample NHS foundation acute hospital trusts (Manchester and Newcastle). Additionally, there is a summary worksheet of the generational accounts which is linked to the valuation outcomes of each of the relevant spreadsheets. The sections of the XLS template model and their location are set out in the Table B1.
Description of XLS financial valuation model

Table B1 Long description
The table outlines the structure and content of an XLS financial valuation model used to construct generational accounts for two sample English NHS trusts, specifically Manchester and Newcastle. It details the sections of the model, their descriptions, and cell references. The table includes sections on key financial parameters, statistical population and mortality assumptions, healthcare contributions, healthcare benefits per person, age-profile population, progress of age groups, expected social return on capital, annual present value of future contributions and benefits, and summary generational accounts. Each section is linked to specific cell references in the model.

 Open access

