


Introduction
Holes drilled to the glacier bed can be roughly classified as connected or unconnected (Fig. 1). Connected holes establish hydraulic communication with the subglacial drainage system and, under favourable circumstances, act as manometers. Unconnected holes fail to establish such communication and these holes remain water-filled. Although connected holes arc less prevalent, they have received greater scientific attention (e.g. Reference HodgeHodge, 1979; Reference Iken and BindschadlerIken and Binclschadler, 1986; Reference Kamb and EngelhardtKamb and Engelhardt. 1987; Reference Stone and ClarkeStone and Clarke, 1993) because they arc simple to study and their pressure signals often correlate with water input to the subglacial system. Nonetheless, unconnected holes merit investigation because they represent the situation obtaining over large areas of the subglacial bed and because they are likely to represent subglacial conditions during winter when glacier surges are commonly triggered (Reference KambKamb and others, 1985; Reference Echelmeyer, Butterlicld and CutllardEchelmeyer and others, 1987; Reference RaymondRaymond, 1987; Reference Echelmeyer and HarrisonEchelmeyer and Harrison, 1989).
As part of a long-term study of the cause and mechanics of glacier surging, we have, since 1989, recorded pressure fluctuations in both connected and unconnected holes at Trapridge Glacier, Yukon Territory, Canada. Previous investigations of this glacier have been reported by Reference CollinsCollins (1972), Reference Jarvis and ClarkeJarvis and Clarke (1975), Reference CollinsClarke and others (1984), Reference Clarke, Collins and ThompsonClarke and Blake (1991), Reference Blake, Clarke and GérinBlake and others (1992) and Reference Stone and ClarkeStone and Clarke (1993). The interpretation of natural and induced pressure fluctuations in connected boreholes was the focus of a recent thesis by Reference StoneStone (1993) and the present work is concerned with interpretation of pressure fluctuations in unconnected holes. Whereas measurements in connected holes reveal information on the connectivity and transmissivity of the subglacial hydraulic system, measurements in unconnected holes yield information on the piezomctric pressure and hydraulic properties of the glacier substrate.
Types of Trapridge Glacier boreholes and freeze-in pressure records. Boreholes are classified as: (a) connected if the water level drops when the drill reaches the bed, indicating that the hole intersects a highly transmissive basal drainage system, (b) unconnected if the hole reaches the bed but the water level does not immediately drop, indicating that the hole bottoms in less permeable material, and (c) blind if the hole does not reach the bed: The cavity in the bed at the bottom of the borehole is thought to be formed by the hot-water drill. Note the differing time and pressure scales.

The challenge of studying pressure fluctuations in unconnected holes is that they do not behave as manometers. Because water influx or outflux is negligible, changes in water level occur imperceptibly slowly. Such holes must lie sealed at the top, either naturally by freezing or artificially by means of an inflatable packer, so that pressure signals can be faithfully recorded. An added complication is that sealed water-filled holes are subject to pressure influences by ice creep and freezing forcing of the holes (Fig. 2). These influences are best described by a transient ice-flow law rather than by the conventional Glen law.
Response to freezing forcing. These cartoons illustrate the two wars than excess water displaced by freezing can be accommodated: (a) by ice deformation, and (b) by water flow into the bed. In blind holes only ice deformation operates, In connected holes water flow into the bed dominates. It is not immediately clear which mechanism dominates in unconnected holes.

We have developed a computational model to describe the response of unconnected boreholes subjected to freezing forcing, and use this model to interpret signals recorded in unconnected holes in Trapridge Glacier (Reference WaddingtonWaddington, 1993). The model describes ground-water flow in the bed, deformation of the ice surrounding the hole and an approximate freezing forcing.
By using the model to analyze the pressure response of “blind” holes (i.e. those that are intentionally terminated at some distance above the bed, as illustrated in Figure 1c), we isolate the effects of ice deformation and evaluate relevant flow-law parameters. Next, we use these parameters to model the response of an unconnected hole to freezing forcing and obtain estimates of the hydraulic properties of the glacier substrate. Lastly, we use the model to interpret natural unforced fluctuations of water pressure in unconnected boreholes, as illustrated in Figure 3.
Unconnected hole-pressure record (sensor 90P07). Note the numerous sudden pressure changes and subsequent decays at various time-scales. The pressure fluctuations shown in this figure were recorded more than 20 d after the hide was drilled and after 1990 drilling activity had ended. Hence, the sudden pressure changes could not be the direct result of borehole freezing or a response to nearby drilling. Thus, they are caused either by glacier-ice movement or naturally occurring fluctuations in subglacial water pressure.


Model Development
To predict the pressure response of an unconnected borehole as it freezes shut after hot-water drilling, the mechanical response of the ice bed-borehole system must be modelled together with the freezing forcing itself. The model must describe the deformation of ice in response to elevated pressure, as well as the flow of water from the bottom of the borehole into the bed.
Ice model
The problem is clearly transient, so an appropriate transient ice-flow law must be used. This flow law must describe the response to time-varying pressure at the borehole wall, including pressure which first rises then falls. Therefore, the strain-recovery behaviour of ice (Reference DuvalDuval, 1978) must be properly described. A number of formulations seek to model transient response, including strain recovery, but no existing rheologies can model the full range of primary, secondary and tertiary creep. We adopt the physically based phenomenological model of Reference Sunder and WuSunder and Wu (1989a, Reference Sunder and Wub, Reference Sunder and Wu1990).
The freezing-borehole problem is in general three-dimensional but we must simplify it to make it tractable. We assume the background ice stress to be purely hydrostatic and consider the borehole to be a long cylindrical hole, so that end effects can be ignored and ice deformation can be assumed radial. Variations in ice properties (e.g. those caused by temperature change) and stress state with depth are ignored, so that the deformation can be considered constant with depth. This allows the ice-deformation problem to be reduced to a single layer of radially symmetric flow, a one-dimensional problem. The governing equations fall into three basic categories: rheological equations, strain definitions and momentum balance.
Flow law
Deformation behaviour of ice can be described by a transient, non-linear, visco-elastic flow law with internal state variables (Reference Sunder and WuSunder and Wu, 1989b). This description was developed with the following assumptions: orthotropic polycrystalline ice, small strains and rotations, and only primary and secondary creep are described (damage mechanics, no recrystallization). Hence, we may use the definition of infinitesimal strain

The exclusion of recrystallization effects, and hence the inability to describe creep at strains greater than the minimum ! steady-state) creep, make this flow law unsuitable for modelling large-strain deformations. Because we are primarily interested in small strains, this limitation is acceptable.
Reference Sunder and WuSunder and Wu (1989b) presented their flow law, in rate form, for a viscously incompressible orthotropic visco-elastic ice. It will be assumed that the ice surrounding the borehole is initially composed of randomly oriented crystals and hence is macroscopically isotropic. The Sunder and Wu flow law for isotropic ice is summarized by the following equations:
strain decomposition
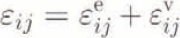
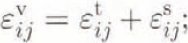
equations of state


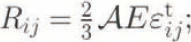
evolution equations


and definitions


Note that Equation (7) with definition (11) corresponds to the commonly used Glen How law for steady-state viscous deformation of ice.
Without loss of generality (dε/dt)0 may be set equal to unity (Reference Sunder and WuSunder and Wu, 1989b). A flow-law exponent value of N = 3 is generally accepted (e.g. Reference Sunder and WuSunder and Wu, 1989b) and is used in this paper. The viscous stress factor V varies with temperature according to the Arrhenius relation

which is thought to be valid for temperatures below −10 °C (e.g. Reference Sunder and WuSunder and Wu, 1989a). At higher temperature, the V changes more rapidly than Equation (13) predicts, due to the presence of water at grain boundaries. Hence, a different expression for V must be used above −10 °C. We follow the approach of Paterson 1981) and use the Arrhenius relation with a higher activation energy Q h. Therefore, for T > −10 °C,

where

and T 263 = 263.12 K.
Application of limiting assumptions
With the exception of the elastic response to pressure change, the ice deformation is independent of hydrostatic pressure. For linear elasticity, hydrostatic pressure does not affect the solution, except to cause a small change in ice density, which is second order and hence insignificant. We can therefore neglect all vertical gradients. The How is slow and gravity is the only body force acting on the tee. Thus, the momentum-balance equation reduces to

Neglecting vertical gradients, applying cylindrical symmetry and noting that gravity is the only body force acting on the ice, the force-balance Equation (16) becomes

Strain definition (I) can be reformulated in cylindrical coordinates e.g. Reference Jaeger and CookJaeger and Cook, 1969, p. 52) and the above assumptions applied to give

Hence, there exists a state of plane strain in the r-θ plane. It is also apparent that  ,
,  and
and  are principal axes of strain (those axes for which all off-diagonal terms of the strain tensor vanish). For isotropic ice. these are also the principal axes of stress. Therefore, in this coordinate system, the oil-diagonal terms of all tensor quantities (
 ) vanish. Thus, the notation for the diagonal terms of the tensors can be simplified, so that σrr
becomes σ
r, and so on. In the simplified notation, the flow law becomes (with material time derivatives replaced by spatial time derivatives because the infinitesimal strain assumption allows all advective terms to beset to zero):
) vanish. Thus, the notation for the diagonal terms of the tensors can be simplified, so that σrr
becomes σ
r, and so on. In the simplified notation, the flow law becomes (with material time derivatives replaced by spatial time derivatives because the infinitesimal strain assumption allows all advective terms to beset to zero):


where


One more constraint is required, that of compatibility of strains. From the definition of tangential strain (Equations (18)), it follows that

Substituting this into the definition of radial strain (Equation(18)), and differentiating, gives

or

The previously developed equations together form the field equations of an initial-value problem with algebraic-constraints. The differential equations are (20), (23) and (26). The constraint equations are compatibility of strains (Equation (35)) and plane strain (Equation (18)). All the other equations are used to calculate the intermediate variables needed for the differential and constraint equations.
Initial and boundary conditions
Here we state the initial conditions and boundary conditions which, together with the field equations just developed, fully specify the initial-value problem in the ice.
The initial state of the ice is that of hydrostatic equilibrium with no viscous strain. Hence


where p 0 is the background hydrostatic pressure and B 0 is the initial value of the scalar drag stress, which depends on the grain-size of the ice (Reference Sunder and WuSunder and Wu, 1989a).
At the borehole wall, the radial compressive stress must be equal to the water pressure in the borehole and the displacement at the borehole wall must equal the change in borehole radius. Thus


A boundary condition in terms of strain is obtained from this by substituting Equation (41) into the definition of tangential strain (Equation (18)), yielding

At the outside boundary there are numerous possibilities. Although the outside boundary in the problem as formulated thus far is at infinite radius, in the numerical problem this boundary must be placed at some large but finite radius.
Some possibilities, all of which are true at infinite radius, arc as follows: zero strain, specified hydrostatic stress (all stress components specified) or specified radial compressive stress only (equal to hydrostatic pressure). The specified-radial-stress option was chosen because analytic solutions are available for thick-walled cylinders subject to internal and external pressure (Reference Jaeger and CookJaeger and Cook, 1969; Reference Kjartanson, Shields, Domaschuk and ManKjartanson and others, 1988), allowing the resulting model to be checked. Thus, the outside boundary condition is

Bed equations, forcings and model synthesis
We approximate the bed as a homogeneous half-space, with hydraulic properties equal to those of the low-permeability till layer. This is a reasonable approximation as long as drainage channels are not too close to the hole. We further assume that the flow is described by the standard diffusion equation for transient groundwater flow in a saturated porous medium (e.g. Reference Freeze and CherryFreeze and Cherry, 1979). The ice and bed are coupled by conservation of mass of compressible water in the borehole.
In the region investigated, Trapridge Glacier is coldest near the surface (≈ 5 °C at the surface if the winter cold wave is neglected) and below freezing throughout except at the bed where it is at the pressure-melting point (Reference Clarke, Collins and ThompsonClarke and Blake, 1991). Since 1980, more than 30 holes have been drilled to the bed in the warm-bedded part of Trapridge Glacier and instrumented with thermistor cables. There is no evidence of the presence of a basal temperate layer as encountered in classical polythermal glaciers (Reference CollinsClarke and others, 1984; Reference Clarke, Collins and ThompsonClarke and Blake, 1991). Trapridge Glacier ice is therefore assumed to be impermeable.
As a result of the Trapridge Glacier thermal regime, we expect boreholes to freeze shut first at the highest point with water in it, then downward from there as freezing occurs on the borehole walls (e.g. Reference Jarvis and ClarkeJarvis and Clarke, 1974; Reference Humphrey and KHumphrey and Echelmeyer, 1990). For computational simplicity, we assume that all freezing is confined to the top of the borehole, so that the hole gets shorter but its diameter remains constant. The borehole length as a function of time is described as a series of decaying exponentials, having coefficients that can be determined from temperature measurements made as a borehole freezes. We also allow for arbitrary sudden pressurization of the borehole to permit the modelling of natural sudden pressurization and decay events.
In this section, we develop the bed model, borehole model and description of freezing and other forcings, then synthesize these with the ice-deformation model to form the complete coupled model, and formulate the problem for numerical solution using the method of lines.
Basal ground-water flow
Consider a homogeneous, isotropic, permeable half-space bounded above by impermeable ice and by water in a hemispherical cavity at the bottom of a borehole. Let the coordinate system be spherical, with the origin at the centre of radius of the hemispherical cavity (Fig. (4)). In spherical coordinates, the equation for radial groundwater flow in a compressible porous medium is

The initial conditions and boundary conditions for the basal ground-water flow problem follow directly from the assumptions that the bed is initially in a no-flow (uniform hydraulic head) state and that the background head in the bed changes much more slowly than the head in the borehole. The head at the cavity wall must also be equal to the borehole head. Hence



Bed geometry and coordinate system.

Borehole equations
The borehole is filled with compressible water, which acts to couple the ice and bed. The coupling is provided by the water mass-balance equation for the borehole. The mass of water in the borehole plus the mass of water lost by flow into the bed and freezing must be equal to the initial mass of water in the borehole. Thus

The mass of water in the borehole at any instant is derived as follows. The compressibility of water must be taken into account; hence the density of water may in general vary in space as well as time. It can be shown that the mass of water in the borehole (taking into account the density change with depth caused by the change in water pressure with depth) and in the basal cavity is

if water density is given by

Note that the height of the water-filled borehole L is time-dependent. This introduces the approximate freezing forcing. Borehole radius r b(t) can be found from the tangential strain in the ice at the borehole wall. The ice-strain boundary condition at the borehole wall Equation (42)) leads to

Now consider (he flow of water from the borehole into the bed. The radial specific discharge is qr = −K∂h/∂r, the water-volume flux across a hemispherical surface. The total volume-flow rate through such a surface is the flux multiplied by the surface area of a hemisphere. Substituting Equation (50) for ρ w gives the mass-flow rate into the bed

Forcings
We model freezing forcing approximately by top-down freezing, at an arbitrary rate, with no freezing to the borehole walls. Under this simplifying assumption, freezing forcing enters the model by specifying L(t). the height of the water-filled borehole as a function of time. We let L(t) be given by some arbitrary function having coefficients that can be assigned to approximate the desired freezing rate. The mass of water m f which has frozen to ice is then the volume of ice produced multiplied by the density of ice. Because r b changes much more slowly than L, r b(t) may be replaced by r b, 0, a constant: thus

Sudden pressurization forcing was simulated by starting with normal equilibrium initial conditions and imposing a very rapid, but smooth, change in the borehole pressure. We have chosen a shifted half cosine for the ramp-up function, due to its smoothness,

where P f is the imposed pressure change (thus the pressure during the ramp-up period is P 0+P f) and t f is ramp-up time.
Method-of-lines solution
Equation (17) – (32), (35), (44), (48) (50). (52) and either (53) or (54) form a system of non-linear partial differential equations and algebraic equations that was solved using the method of lines (e.g. Reference SchiesserSchiesser, 1991), with integration by the ddriv3 integrator of Kahaner and Sutherland (public domain software, available from Los Alamos National Laboratory). This integrator uses the backward-differentiation formula method of Reference GearGear (1971).
The method of lines requires than the ice and bed regions be discretized, so that finite-difference spatial derivatives can be taken. A spatial coordinate transformation (with nodes evenly spaced in the transformed variable) was therefore applied to concentrate nodes at small radius, where changes in the Held variables are expected to be most rapid.
The choice of transformation was guided by available analytic solutions:
-
(1) For steady-state radial ground-water flow in a whole space or half space, h is proportional to 1/r (see e.g. Reference Carslaw and JaegerCarslaw and Jaeger, 1959, p. 247) for the solution to the equivalent heat-conduction problem).
-
(2) For steady-state or transient How of linear (elastic, viscous or visco-elastic) ice surrounding a cylindrical hole, stress and strain are proportional to 1/r 2 (Reference NyeNye, 1953).
-
(3) 3. For steady-state viscous flow of Glen law ice surrounding a cylindrical hole, stress is proportional to
 and strain is proportional to 1/r
2 (Reference NyeNye, 1953).
and strain is proportional to 1/r
2 (Reference NyeNye, 1953).
 and strain is proportional to 1/r
2 (
and strain is proportional to 1/r
2 (Hence the transformation R = 1/r was used in the bed. The best choice for the ice is less obvious. Therefore, a range of transformations was allowed: R = rx where x is a finite nonzero real number, and R = lnr. The logarithmic transformation was included because the steady-state solution to the diffusion equation with cylindrical symmetry is logarithmic (e.g. Reference Carslaw and JaegerCarslaw and Jaeger. 1959, p. 189) and one might have expected some diffusive behaviour in this problem. Visual comparison of model results to the analytic solutions revealed that R = 1/r 0.75 yielded the most accurate results (Reference WaddingtonWaddington, 1993); hence this transformation was adopted for the balance of the work.
Second-order (three-point) finite-dilference operators were used for both first and second derivatives (centred difference for interior nodes, forward difference for inside boundary nodes and backward difference for outside boundary nodes). Although accuracy could be improved by taking higher-order approximations, the stability of the resulting method-of-lines solution would be reduced (Schiesser, 1991).
The model was tested to check its accuracy by comparing model results to the analytical solutions. Steady-state Glen law and linear elastic borehole wall-strain solutions were matched to within 1%, with appropriate choice of control parameters (Reference WaddingtonWaddington, 1993). Basal head response to a step change in borehole pressure was matched to within 5%.
Model Results
The model was used to infer Trapridge Glacier ice and bed properties. The freezing forcing L(t) was obtained from thermistor records. Ice properties (within prior constraints) were found by forward modelling of blind-hole pressure records, then bed properties were found by forward modelling of unconnected hole-pressure records. The question of the extent to which the pressure records from unconnected holes reflect true basal conditions, and the extent to which they are altered by the response of the borehole itself, was also addressed. This was done by examining the response of the model to sudden pressurization.
Estimation of freezing forcing
Boreholes through Trapridge Glacier were drilled using a hot-water drill. In all years except 1992, the holes were drilled to their final diameter in one pass with the drill in roughly 1 h of drilling. In 1992, however, the thermal efficiency of the drill was impaired, so that the hole after one pass was too small and a second pass was required. The first pass took about 1 h, and the second about 10 min.
The time the borehole first freezes over can be found from the borehole water-pressure record. (It is the time when the pressure begins to rise, usually about 12 h after drilling.) Hole length then decreases with time, asymptotically approaching zero, as the freezing time at the bed where ice is at its melting point is essentially infinite (neglecting melting due to geothermal or frictional heating).
In 1992, two thermistor strings were assembled and installed: 92T01 in unconnected hole 92H24 and 92T02 in blind hole 92H26. The thermistor resistances were read during the freeze-in period (≈ 9d), calibrations applied and temperatures calculated [Reference WaddingtonWaddington. 1993). The temperature versus time after cessation of drilling was plotted for the thermistors of the two strings (e.g. Fig. (5)). For each thermistor, a smooth curve was extrapolated back until it intersected the initial temperature (measured soon after installation when all thermistors were in water); this was taken to be the time when the thermistor froze in. Thermistor position versus freeze-in time gives the model freezing forcing L(t).
Hole 921124 freeze-in temperature record (92T01). Dashed lines are smooth extrapolations used to find time of freeze-in. Thermistors at 58, 1 and 68.1 m displayed no temperature drop within the first 9 d and hence are omitted to improve clarity. The hole first froze shut approximately 0.56 d after cessation of drilling. The cause of the anomalous points at 2 d and 7 d is not understood.

Records from the two holes were stacked together to reduce noise. We assumed that, because the holes were nearby, ice surrounding both holes had the same temperature stratification and furthermore that, because the drilling method was approximately the same, the two boreholes froze at the same rate. A point was added at time zero, corresponding to the initial water level in 92H24. This was done under the assumption that freezing would happen first at the water surface. Also, a point was added at long time (L = 0.5 m at t =2 year). Pressure sensors located 0.5 in above the bed appear to remain in water after I year but become isolated by freezing after 2 years.
These points were fitted with the exponential series  by minimizing the least-squares misfit using the downhill simplex method (e.g. Press and others, 1987). The bi
s were constrained to be negative, to prevent the length from increasing with time. The result gave L(t) of the bottoming hole 92H24. and the inverted function t(L) yielded the freezing time as a function of height above the bed in that borehole (Fig. 6). For nearby boreholes, the length as a function of time can be obtained from the L(t) for 921124. To adapt the estimate to the blind hole 92H26, two changes were made: L was made smaller by the distance between the bottom of the hole and the bed (by adding a negative a
0), and L was reduced so that Lt = 0 was consistent with the initial water level in the borehole. Because freezing time versus depth was assumed to be the same as for the bottoming hole, the zero time had to be shifted. This procedure was repeated for each hole that was modelled.
by minimizing the least-squares misfit using the downhill simplex method (e.g. Press and others, 1987). The bi
s were constrained to be negative, to prevent the length from increasing with time. The result gave L(t) of the bottoming hole 92H24. and the inverted function t(L) yielded the freezing time as a function of height above the bed in that borehole (Fig. 6). For nearby boreholes, the length as a function of time can be obtained from the L(t) for 921124. To adapt the estimate to the blind hole 92H26, two changes were made: L was made smaller by the distance between the bottom of the hole and the bed (by adding a negative a
0), and L was reduced so that Lt = 0 was consistent with the initial water level in the borehole. Because freezing time versus depth was assumed to be the same as for the bottoming hole, the zero time had to be shifted. This procedure was repeated for each hole that was modelled.
Hole 92H24 length versus time: observed (solid circles are inferred from thermistor results, solid square is initial water level) and Jilted (line). Solid triangles are inferred from thermistor results in nearby hole 92H26.

Estimation of ice properties
Prior constraints
Before the observed pressure records were fitted by adjusting input parameters, reasonable limits were placed on these parameters so that, for example, an ice temperature of ±5 °C could not be used to obtain a good lit. Some parameter ranges were obtained from the literature (e.g. ice and bed properties) whereas others were obtained from Trapridge Glacier conditions (e.g. temperature and geometry). Parameter ranges and their sources are summarized in Table .1.
Summary of input parameter ranges

-
1. Estimates of Trapridge Glacier borehole dimensions (Reference WaddingtonWaddington, 1993).
-
2. Reference WaddingtonWaddington (1993). Computed from seismic velocities of Reference PatersonPaterson 1981; and Young’s modulus of Gold 1977).
-
4. Reference WaddingtonWaddington:1993:. Minimum value obtained from Reference Sunder and WuSunder and Wu 1990:, maximum from Reference MorganMorgan 1991).
-
5. Reference WaddingtonWaddington (1993). Computed from experimental results of Reference SinhaSinha (1978) and Reference JackaJacka (1984), quoted in Reference Sunder and WuSunder and Wu (1990), corrected for grain-size using the relation of Reference SinhaSinha (1979).
-
6. Minimum and maximum reasonable average Trapridge Glacier ice temperatures (Fig. (5)). The minimum possible average is taken to be warmer than the minimum observed value of −6.5 °C to reflect the greater influence of the warmer, softer, deeper ice.
-
7. Reference WaddingtonWaddington (1993). Minima from Reference Freeze and CherryFreeze and Cherry (1979). Maxima from consolidation tests on Trapridge Glacier proglacial sediments (unpublished data of T. Murray, 1992).
Fitting procedure
Because blind holes do not reach the bed, the pressure signal observed in them must be solely a function of ice properties, geometry and freezing rate. Hence, it should be possible to discover the ice properties by forward modelling and fitting the observed pressure signals, assuming that the geometry and freezing forcings are correctly chosen. The first record modelled was that of hole 92H26 which contained the thermistor string 92T02. To determine ice properties, only the initial part of the record — from first pressure rise to first fracture (arrow B in Figure 7) — were modelled.
Best fit to 92H26 freeze-in pressure record. Solid line is observed pressure record; dashed line is model simulation. The slower pressure rise before the inflection point (arrow a) is thought to be due to water leakage into instrument cables. The sudden pressure drop (arrow b) is likely caused by fracturing of the ice. Only the curve between (a) and (b) was modelled.

Closer examination of the early part of the 92H26 record reveals that the initial pressurization is not a single smooth curve but displays a slope discontinuity (arrow A in Figure 7) roughly 0.7 h after freezing commences. With the sole exception of 89H50, all freeze-in pressure records that we examined displayed this feature. Wc are unsure what causes this inflection in the curve. One possible explanation involves water entry into instrument cables. Pressurized water has been observed to flow upward through cables (between the outer jacket and the insulated conductors) and into data-logger enclosure boxes. Thus, initially, while water within the cable jacket remained unfrozen, water could flow into the cable and relieve pressure in a freezing borehole. Eventually, the water in the cable above the freezing front would freeze, preventing further water entry. (Modelling suggests that the volume of water displaced by the assumed freezing prior to the inflection point is 0.12 m3, somewhat less than the ≈ 0.4 m3 volume of air in the two cables in the hole.) This could cause the inflection point on the pressure records. After this leakage process ceased, the system would behave as a water-filled borehole, as modelled. (It is not possible that the compressibility of cable materials, PVC and copper, plays a part since these materials are less compressible than water (e.g. Reference Krevelen and HofiyzerKrevelen and Hoflyzcr, 1972).)
Hence, we modelled only that part of the freeze-in pressure record that lies to the right of the inflection point. To do so, we ignored the inflection and extrapolated the curve back until it matched the initial pressure (Fig. (7)), then time-shifted the borehole L(t) so that the simulation began at that point. The computer model could not be started at the end of the drilling, as would be ideal, since it cannot simulate a constant pressure followed by freezing-induced compression.
The model ice parameters were varied until the best visual fit with the pressure record was obtained. It was found that the pressure rise was scaled up by decreasing T or increasing V
0, μ or λ. The rate of pressure rise was increased by increasing the transient parameters  and B
0 Changing r
b had no significant effect. The best fit (Fig. (7)) was obtained with T = 2 °C (coldest allowable);
and B
0 Changing r
b had no significant effect. The best fit (Fig. (7)) was obtained with T = 2 °C (coldest allowable);  , μ = 4.1 × 10⁹ Pa−1 and λ = 8.0 × 10⁹ Pa −1 (highest allowable); and A = 0.02.
 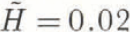 and B
0 = 0.05 (rather close to the lowest allowable). The modelling of a second blind hole (92H45) gave similar results (Reference WaddingtonWaddington, 1993).
and B
0 = 0.05 (rather close to the lowest allowable). The modelling of a second blind hole (92H45) gave similar results (Reference WaddingtonWaddington, 1993).
Estimation of bed properties
Bed properties were estimated using a method similar to that used to determine ice properties; prior constraints arc summarized in Table .1.
Fitting procedure
The present investigation concentrated primarily on hole 92H24, one of the two 1992 boreholes from which the length function L(t) was derived. It was also the only unconnected hole in 1992 for which a pressure record of the freeze-in was obtained. This hole was unconnected at the time of drilling, as indicated by high and constant pressure in the hole between drilling and the freezing-induced pressure rise.
The method used to obtain bed-parameter estimates was the same as that used to obtain ice-parameter estimates from blind holes. The freezing forcing was time-shifted to account for the different initial water levels in the two holes. Ice parameters determined from blind-hole modelling were used. Since the basal-cavity radius rc . is poorly known, fits were done by adjusting K and α + nβ for several values of rc spanning its range. It was found that the height of the pressure peak was decreased by increasing K, α + nβ or rc . The shape of the pressure peak was affected differently by changing the different parameters. Increasing K caused a sharper peak with a more rapid subsequent pressure decline, whereas increasing α + nβ or rc had the opposite effect of causing a rounder peak with a slower decline. Hence, for a given rc, the records were fitted by trading off K and α + nβ to obtain the correct height and shape of curve.
First, the record from 92H24 was fitted using the ice properties determined from the fit of 92H26. Fits were obtained for rc of 0.025, 0.10 and 0.13 m (Fig. (8) and Table .2). A good fit could not be obtained for rc > 0.13 m without decreasing α + nβ below the minimum allowable l.0 10−8 Pa−1.
Best-fit bed parameters from fit to 921124 freeze-in pressure record, using standard L(t)

Best fits to 92H24 freeze-in pressure record with various assumed values of rc: (a) 0.025 m, (b) 0.10 m and (c) 0.l3 m.

An important question is how much influence the ice properties have on these results. To investigate this, the unconnected-hole modelling was repeated using the softest allowable ice. the Stiffest allowable ice and rigid ice. The softest ice is that with all ice properties minimum, except temperature which was the maximum. The stiffest ice is that with all ice properties maximum, except temperature, which was −5 °C. Rigid ice was simulated by using very large values of elastic and viscous parameters Reference WaddingtonWaddington, 1993). The best-fit bed properties for r c = 0.025 m from Table .2 were used. Flow-law parameters did indeed influence the simulation results (Fig. (9)), although not as strongly as K did. The pressure rise changed by many orders of magnitude when K was varied over its range.
Freeze-in pressure record of 92H24, modelled using carious ice properties: (a) rigid, (h) stiffest, (c) best fit and (d) softest.

The 92H24 freeze-in record was then fitted, taking r c = 0.025 m, with softest ice and rigid ice (Table .3). The best fit obtained with the softest ice was not very good. A good fit could not be achieved without reducing α + nβ below 1.0 × 10 −8 Pa−1, its minimum reasonable value. A proper lit could be obtained with a slightly higher K and a slightly lower α + nβ Despite these shortcomings, the softest ice values in Table .3 are probably within 20% of the best-fit values.
Best-fit bed parameters from fit to 92H24 freeze-in pressure record, with carious ice properties and assuming standard L(t) with rc = 0.025 m

To check the results inferred from the freezing of the single 1992 unconnected borehole, the freeze-in pressure records of three other boreholes from prev ious years were also examined: 89H50. 90H54 and 91H46. These holes did not connect when drilled. 90H24 and 91H46 both have freeze-in pressure curves with characteristics similar to those of the unconnected 92H24, while that of 89H50 looks suspiciously like a blind hole. Nevertheless, all three were modelled as bottoming unconnected holes, with the (suitably time-shifted) freezing forcing determined from the 1992 thermistor observations and ice properties determined from the fitting of 92H26. It is certain that this freezing forcing is at least somewhat in error, owing to the differing drill characteristics and method of these years compared to 1992.
The fits were not especially good. Hydraulic conductivities determined from fits to 90H54 and 9IH46 records agreed quite well with those determined from 92H24. while that from 89H50 was quite a bit lower Table 4). The compressibility estimates spanned the entire allowable range. These and other modelling results have been presented in Reference WaddingtonWaddington (1993).
Best-fit bed parameters from fits to various borehole freeze-in pressure records, assuming standard L(t), with rc = 0.025m

Uncertainly due to approximate forcing
The effect of uncertainly arising from the use of an approximate freezing forcing was investigated by repeating the preceding parameter estimations (ice and bed and applying a weaker freezing forcing. A borehole radius of 0.025 m was used. When the freezing rate was halved, the resulting ice properties were little changed but the basal properties changed significantly. Hydraulic conductivity increased from 7.0 × 10 −9m s−1 to 4.5 × 10⁻⁹m s−1 and compressibility decreased from 1.6 × 10⁻⁶ Pa−1 to 3.5 × 10⁻⁷ Pa−1.
Coupled-system relaxation response
Simulations were run using the ice properties found from consideration of 92H24 freeze-in. To place an upper bound on the length of the decay, the longest reasonable borehole 921121 after only 1 d, L = 45.3 m) and die smallest pressure forcing of interest (p f = 104 Pa or about 1 m H2O) were chosen. When bed properties found from 92H24 were used (r c = 0.025 m, K = 7.0 × 10⁻⁹ m s−1 and α + nβ = 1.6 × 10×6Pa−1), the decay curve had approximately the same shape as in Figure 3 but the decay was far too rapid (Fig. (10)). Pressure dropped to 1/e of its initial value injust 56s.
Sudden pressurization at t = 1 d of hole 92H24 (simulation)

Discussion
Ice parameters determined from the modelling of blind holes were at the extremes of their reasonable ranges. Very large (stiff) elastic and steady-state viscous parameters were required, together with very small (soft) transient hardening parameters. The imperfect fit (Fig. (7)) suggests that the model is too simple. One possible cause was the use of a one-layer model to simulate deformation in ice with depth-varying temperature and hence depth-varying theological properties. Another explanation is that, as a borehole freezes, new unstrained ice is continuously added to the borehole wall. When modelled without ice accretion to the wall, as in the present work, unrealistically low values of transient parameters would be indicated.
Inferred basal hydraulic properties were found to be strongly affected by the assumed freezing forcing and basal cavity radius (Table 2). The fact that a good fit could not be obtained with a cavity radius rc > 0.13 m suggests that the cavity must be smaller than this. This is consistent with the reasoning that sediment disturbed by drilling of an unconnected hole settles back into place, as it has nowhere else to go. The hydraulic-conductivity estimate was found to be much less sensitive to the assumed ice properties than was the compressibility estimate (Table 3). The fact that assumed ice properties also had less effect on the hydraulic-conductivity estimate than did the assumed basal-cavity radius can be explained by the fact that, for bed properties in this range, the volume of water expelled into the bed is much greater than the increase in volume of the borehole due to ice deformation. The modest influence of ice deformation suggests that the simplified model we used is adequate. Further improvements would require significant additional complexity for a minimal improvement in accuracy.
The effect of approximating the bed as infinitely thick bears some discussion. Dimensional analysis of Equation (44) shows that a characteristic time for diffusion is  where l is an appropriate length scale, for example the thickness of the subglacial sediment layer. Taking l = 1 m (thought to be a reasonable estimate for Trapridge Glacier) and 1 × 10 −8 ≤ α + nβ ≤ 1 × 10⁻⁵Pa−1 gives 1 ≤ Δt ≤ 100 d (approximately). Thus, it is not clear whether the half-space assumption is appropriate. Our justification for the half-space assumption is that it greatly simplifies the numerical model and that laboratory testing of Trapridge Glacier sediment (unpublished data of T. Murray, 1992) indicates α + nβ ≈ 1 × 10⁻⁵ Pa−1 giv ng Δt ≈ 100 d. which is longer than the freezing forcing time-scale of «10d. Thinner or more diffusive sediment layers could be modelled by assuming cylindrical symmetry and using a two-dimensional finite-difference grid in the bed.
Forward modelling has produced reasonably consistent estimates of hydraulic conductivity and wildly varying estimates of bed compressibility. The hydraulic conductivity falls in the range 1.35 × 10⁻⁹ m s−1 (for r c = 0.13 m) to 7.0 × 10⁻⁹ m s−1 (for r c = 0.025m), inferred from the 1992 unconnected borehole 92H24. (Results from the 1990 and 1991 boreholes are not included due to the différent drilling method of those years.) This range can be compared to values obtained by other investigators. Smart and Clarke (personal communication from C. C. Smart and G. K. Clarke) obtained an upper bound of 3.6 × 10⁻⁷ m s−1 from consideration of the minimum perceptible drainage rate of unconnected holes. Reference ClarkeClarke 1987) estimated K = 1.27 × 10⁻⁸ m s−1 based on the granulometry of Trapridge Glacier pro-glacial sediments and an assumed porosity. T. Murray unpublished data, 1992) obtained a value of 2.2 × 10⁻⁸ m s−1 from consolidation tests on samples of Trapridge Glacier proglacial sediment. Estimates obtained for bed compressibility are so wildly varying that we attach no significance to them.
The response to sudden pressurization was found to be so rapid that such an event would likely go unnoticed on a pressure record sampled every 2 min, as for summer field-season data from Trapridge Glacier. It almost certainly would be missed by the 20 min sampling that we employ when, throughout the fall, winter and spring our sites are unattended. Hence, it appears that the borehole response is essentially instantaneous and cannot be responsible for decay events observed in Trapridge Glacier pressure records. Thus, exponentially decaying pressure fluctuations such as those presented in Figure 3 are faithful representations of subglacial water-pressure signals rather than indicators of rheological relaxation of borehole pressure.
Conclusions
Hydraulic conductivity was found to be in the range 1.35 × 10⁻⁹ ≤ K ≤ 7.0 × 10⁻⁹ m s−1. Hydraulic conductiv-it) was most strongly influenced by the assumed freezing forcing and size of the cavity in the bed at the bottom of the borehole but rather weakly dependent on the assumed ice properties. Bed-compressibilitv α values varied so much that no useful estimate of it was obtained.
The response of unconnected boreholes to sudden pressurization v as shown to be much more rapid than any decay observed in Trapridge Glacier pressure records. Indeed, the decay was so rapid as to be unresolvable using sampling rates typical of Trapridge Glacier pressure sensors. It can therefore be concluded that the response of the borehole system is essentially instantaneous compared to the signals being measured: hence, the observed signals reflect true basal conditions rather than the influence of the borehole (except during the initial freeze-in period when the freezing forcing dominates). It is possible that, if the hydraulic conductivity were sufficiently low. this would no longer be so. Hence, the result may not hold for other glaciers.
Some recommendations for future work follow from our study. The approach used to obtain estimates of the hydraulic conductivity of the basal sediment is sound. A simple one-layer ice model is adequate for shallow ice. The added complexity of a multi-layer ice model is not justified, since the ice deformation was found to be much less important than water flow into the bed from unconnected holes. The approximate left-down freezing forcing is a weak point of the present model. This could be replaced by a proper thermal freeze-in model, such as that of Reference Jarvis and ClarkeJarvis and Clarke:1974-1 or Reference Humphrey and KHumphrey and Echelmeyer (1990). to model accurately the important freezing forcing. If this complication were added, then useful estimates of ice properties as well as improved estimates of hydraulic conductivity might result. The hydraulic-conductivity estimate could also be improved if the size of the basal cavity at the bottom of the borehole could be constrained better, possibly by direct measurement. The effect of finite substrate thickness and layering could be accounted for by including a two-dimensional ground-water Mow model.
The ice-deformation part of the model could be used for other purposes, such as interpreting pressuremeter results, which have previously been interpreted only in terms of the Andrade relation Reference Murat, Huneault, Ladanyi, Lunardini, Wang, Ayorindr and SodbiMurat and others, 1986; Reference Kjartanson, Shields, Domaschuk and ManKjartanson and others, 1988; Reference Shields, Domaschuk, Azizi and KjartansonShields and others, (1989) This would allow the Sunder and Wu rheological parameters to be obtained from in-situ pressuremeter tests. The ice model could also be used to predict the transient behaviour of Röthlisberger channels.
Our most important conclusion is that the pressure signals observed at Trapridge Glacier indeed reflect true basal conditions and the influence of the borehole on the signal need not be considered, except during the initial freeze-in period.
Acknowledgements
We thank all those involved in the Trapridge Glacier field program, especially E.W. Blake, LT.H. Fischer. S.J. Marshall, T. Murray and D. B. Stone, for their part in collecting subglacial pressure data, and for their insightful suggestions. We thank Parks Canada for permission to do research in Kluane National Park. This work has been supported by grants from the Natural Sciences and Engineering Research Council and the Northern Science Training Program of the Department of Indian Affairs and Northern Development. We also thank K. Echelmeyer, W. Harrison, D. MacAyeal and an anonymous reviewer for helpful comments on the manuscript.



