


Introduction
Coastal seasonally ice-free areas and adjacent waters in Antarctica are important places where wildlife is concentrated, human activity is focused and hotspots of terrestrial and marine biodiversity occur. Coastal ice-free terrestrial areas are also rare, with only ~5% of the 39 600 km coastline consisting of exposed rock, with the remainder composed of grounded glacial ice (38%), ice shelves (44%) or glacier tongues (13%) (Porter-Smith et al. Reference Porter-Smith, McKinlay, Fraser and Massom2021). Ice-free rock and sediment within 5 km of the coast comprises only 13.6% of the total ice-free area of Antarctica, which of itself comprises only 0.44% of the continent (Brooks et al. Reference Brooks, Jabour, van den Hoff and Bergstrom2019). Human activities are concentrated in these coastal ice-free areas due to their suitability for the construction and operation of stations. As of 2017, there were 62 research stations occupying ice-free areas on the Antarctic coast (COMNAP 2017). Shallow-water marine environments associated with coastal ice free areas are also relatively rare, as much of the coast has deep bathymetry due to ice sheets depressing the underlying coastal bedrock or where the coast is fronted by ice shelves.
Our understanding of Antarctic coastal environments is relatively limited, and while they have some processes and features that shape coastlines and their ecosystems in common with coastal zones around the world, they also differ in several crucial ways. Antarctica as a continent is unlike any other, being largely covered in ice and surrounded by sea ice for most of the year, whereas the Arctic is a seasonally frozen ocean surrounded by continental landmasses and is strongly influenced by seasonal atmospheric transport, with rivers flowing into it (Anisimov et al. Reference Anisimov, Vaughan, Callaghan, Furgal, Marchant and Prowse2007). Antarctic coasts lack the strong seasonality characteristic of Arctic shores and also lack features such as rivers, coastal vegetation and organic-rich soils. Sea ice abuts much of the Antarctic coastline even in summer, allowing for only short periods of open water (Reid & Massom Reference Reid and Massom2022). Many processes shaping Antarctic coasts and linking terrestrial and marine environments have not been adequately described or quantified, including fluvial and aeolian sediment transport and the influence of sea ice and scour on coastal processes. Where there are quantitative observations, they are limited in spatial scope and largely confined to specific areas such as the Antarctic Peninsula. The relative influence of these processes is likely to differ around Antarctica due to varying geomorphology, oceanography, bathymetry or climate features. Understanding these processes provides important information for managing human activities and assessing the risks they pose (e.g. Leeming et al. Reference Leeming, Stark and Smith2015), understanding biodiversity patterns and wildlife distribution, developing area protection and providing insights into how Antarctic coastal geomorphology has evolved and may be transformed under climate change.
In East Antarctica, 36 distinct areas of coastal ice-free rock and islands have been identified and classified into a spatial reference system comprising over 4800 coastal island and rock features (Southwell et al. Reference Southwell, Smith, Bender and Emmerson2021). Very little detailed information is available for most of these areas. This study focuses on the Vestfold Hills, East Antarctica, on the eastern flank of Prydz Bay, the third largest oceanic embayment in Antarctica. Vestfold Hills is an important coastal ice-free area due the rarity of such habitat and its high levels of biodiversity in terrestrial (Seppelt & Broady Reference Seppelt and Broady1988, Clarke et al. Reference Clarke, Raes, Travers, Virtue and Bergstrom2024) and marine (Gillies et al. Reference Gillies, Stark, Johnstone and Smith2013, Borup et al. Reference Borup, Brokensha, Cataldo-Mendez, Corney, Gibson and King2024, Stark et al. Reference Stark, Johnstone and Stark2025) ecosystems, as well as its high concentrations of wildlife, including penguins and seals. The Vestfold Hills, at 413 km2, is one of the largest coastal ice-free areas in Antarctica. There is a scarcity of observations of coastal processes such as oceanography and sediment transport in dynamic, high-latitude coastal locations, including the Vestfold Hills. In this paper, we synthesize information on the physical marine and coastal environments of the Vestfold Hills and provide new data and descriptions of the processes that influence this area.
Methods
Oceanography and climate
Two surveys of ocean currents were conducted in the nearshore coastal area around the Vestfold Hills. The first survey was done in open water in the summer of 2009–2010 (Stark et al. Reference Stark, Bridgen, Dunshea, Galton-Fenzi, Hunter and Johnstone2016a), and it used a bottom-mounted Aanderaa single-point current meter at four locations (Fig. 1 & Table S1A). The second survey, conducted under sea ice between September and December 2021, surveyed the same sites and three additional sites (Fig. 1) using an upward-looking Nortek Aquadopp 1 MHz profiler. Deployment durations were shorter for the under-ice survey, ranging from 3 days (3 × 24 h tide cycle) to 2 weeks (Table S1B). A second deployment was undertaken at two sites to increase the sampling interval at each. The instrument was deployed through a 40 cm hole drilled through the sea ice and suspended horizontally in the water column (midway between the seafloor and the under-surface of the ice) by a rope secured at the surface. A 15 cm fin was attached to the base of the instrument for all deployments. In shallow locations, the instrument was positioned so that it could not hit the seafloor throughout the lowest tidal cycle during the deployment. The profile interval was set to record every 900 s (15 min) for a period of 120 s (2 min). Modelling of 2010 data was performed to understand the dispersal of wastewater from the Davis Station ocean outfall (Stark et al. Reference Stark, Bridgen, Dunshea, Galton-Fenzi, Hunter and Johnstone2016a) using a coastal spreading-disc model (Hunter Reference Hunter1985). Tidal information is based on a pressure sensor in water 7 m deep off Davis Station (Brolsma et al. Reference Brolsma, Symons and French2019) between 1993 and 2017, with tidal predictions also available (BoM 2023b). Climate data are from the Australian Bureau of Meteorology (BoM 2023a).
Sampling locations in the Vestfold Hills marine and terrestrial environments. Numbers and letters refer to sampling locations as listed in Table S2. Topographic data from Australian Antarctic Data Centre (AADC): https://data.aad.gov.au/metadata/Davis_Station.

Sea ice and landforms
Information on sea-ice coverage and conditions was derived from high-resolution (0.15–15 m) aerial photography (Google Earth Pro) and satellite imagery (NASA MODIS and VIIRS). Ground-based photography was used to document landforms and coastal processes.
Sediment sampling
Sampling of subtidal marine sediments was conducted over several years. In the 2009–2010 summer, sediments were collected by scuba divers at 27 locations (Fig. 1 ) from Zolotov Island near Sørsdal Glacier in the southern Vestfold Hills to the mouth of Long Fjord in the northern Vestfold Hills (Stark et al. Reference Stark, Bridgen, Dunshea, Galton-Fenzi, Hunter and Johnstone2016a,Reference Stark, Corbett, Dunshea, Johnstone, King and Mondonb). At each location, two plots of ~2 m diameter, separated by at least 10 m, were randomly selected. Within each plot, two sediment cores were extracted using corers (15 cm long × 5 cm diameter) inserted up to 10 cm into the sediment. Between 2016 and 2021, sediments were collected from a range of locations (Fig. 1) using an Ekman grab sampler through holes in the sea ice or from intertidal locations using hand-held corers. The position of each sampling location, the number of replicates and the water depth are shown in Table S2.
Terrestrial sediments were sampled during the 2016–2017 and 2019–2020 summers. Sediments were collected from beaches, valley mouths and adjacent gullies (Fig. 1) to understand interactions between coastal morphology and terrestrial water flows. Samples were taken at different heights on beaches including 1) high up the beach in areas actively influenced by fast ice/water/wave impacts, 2) the mid-beach in the vicinity of the upper part of the tidal range, 3) the low beach in the vicinity of low daytime tides and 4) in subtidal areas during extreme low tides. Sediments were also taken from gullies where water transports sandy sediment to beaches.
Sediment traps were deployed from boats at 13 sites in the Vestfold Hills marine waters between January and March 2010, with three replicate traps at each site. Each trap consisted of a Perspex cylinder (internal diameter 5.4 cm × height 13.7 cm) kept upright in the water column with a semi-spherical float around the centre of the cylinder. Traps were deployed ~50 cm above the seabed and held in place with a galvanized steel chain attached to a mooring anchor. Each trap had a retrieval rope with a subsurface buoy that was intended to be ~2 m below the water surface at low tide. No preservatives were used to retain settling particles. Due to the occasional presence of sea ice and icebergs at the sites, some traps were damaged, lost or compromised, and so the number of locations with useable data was reduced to seven (Fig. 1), with one or two replicates. On collection, sediment trap contents were transferred to acid-cleaned 200 ml high-density polyethylene (HDPE) bottles and stored at 4°C until being processed at Davis Station (within 48 h of collection). Sediment was filtered through pre-weighed 0.8 μm glass fibre filters and 0.45 μm Sartorius MiniSart cellulose acetate filters. Filters were then placed on individual Petri dishes, oven dried at 60°C and cooled in a desiccator, and then their dry weights recorded.
Total organic matter (TOM; %) in marine sediments collected in 2010–2011 and 2019–2020 was calculated by mass loss on ignition on 2 g homogenized sub-samples of 107 samples, comprising four replicates from each of 27 sites, except for site 4 (n = 3). Grain-size analyses on cores collected in 2010 were performed on the top 5 cm of the core, which was dried at 45°C and sieved at 2 mm, and then the < 2 mm and > 2 mm fractions were weighed separately. A 5 g sample of the < 2 mm fraction was analysed using a Malvern Mastersizer 2000 optical bench with a Hydro 2000g accessory at Macquarie University. A particle refractive index of 1.544 (quartz) and a water refractive index of 1.333 were used. Particle-size distributions were created from samples taken in 2019 following Australian Standard AS1289.3.6.1-2009 and by visual analysis of photographs taken at sample locations.
Published data on the rate and magnitude of aeolian sediment transport were supplemented with dust monitoring gauges. Monitoring gauges were installed at three sites (AQ1, AQ2, AQ3) in the Vestfold Hills between February 2019 and December 2021. Site selection was based on an operational envelope of an infrastructure project as well as site accessibility. Two types of gauges were installed: Australian Standard Dust Gauges (ASDG) using Australian Standard AS/NZS3580.10.1:2016 and International Standard Dust Gauges (ISDG) using Australian Standard AS/NZS3580.10.1. Samples were collected monthly. Data and analytic methods are available at https://data.aad.gov.au/metadata/records/AAS_5097_DAP_Dust. The frequency and magnitude of aeolian dust deposition onto sea ice was estimated by examining satellite imagery from Google Earth between October and December 2012.
Results
Climate
The highest mean monthly maximum air temperatures occur in December (2.5°C) and January (3.2°C), with the lowest mean minimum temperatures occurring in July (−20.6°C) and August (−20.5°C; Fig. S1). Annual mean maximum and minimum surface air temperatures at Davis Station during 1957–2023 are −7.3°C and −13.0°C, respectively (Table S3). Precipitation at the Vestfold Hills is usually in the form of snow, although rain has been observed (Robinson et al. Reference Robinson, Klekociuk, King, Pizarro Rojas, Zúñiga and Bergstrom2020). Precipitation is typical of an arid climate, with the highest monthly mean precipitation in April of 10.1 mm and the lowest monthly mean precipitation in January and December of 1.9 mm. The period March–June has the highest mean number of days with precipitation ≥ 1 mm (~2–3 days per month).
Seabed topography to the west of the Vestfold Hills. The cross-section shows the three main submarine levels and steps in the sea floor across the area offshore from just north of Davis Station (right in figure) to the northern side of Gardner Island (left in figure). Transect (east-west) shown in Fig. 3. Figure modified from O’Brien et al. (Reference O'Brien, Smith, Stark, Johnstone, Riddle and Franklin2015).

Wind conditions in the Davis Station area are somewhat more benign than in other regions of the Antarctic coast due to the presence of the low-lying Vestfold Hills separating it from the Antarctic Plateau, with a mean annual wind speed of 5.4 m s−1 (Heil Reference Heil2006). There is a semi-annual wind speed cycle, with monthly average peaks in February (9.5 m s−1) and November (10.2 m s−1) and with lower average winds between March and September (8.0–8.6 m s−1; Heil Reference Heil2006). Strong winds in excess of 20 m s−1 are a regular occurrence; for example, in 2012 they occurred 16 times (Fig. S2A). The maximum hourly average wind speed recorded between 2002 and 2019 was 39 m s−1 (BoM 2023a). Winds during October–March at Davis Station are predominantly from the north-east, and almost all winds exceeding 10 m s−1 are from this direction (Fig. S2B). In contrast, winds during April–September are predominantly from the east to south-east (Heil Reference Heil2006), but strong winds of > 20 m s−1 are typically from the north-east (Fig. S2B). South-westerly winds are rare, with typical speeds of < 5 m s−1 (Fig. S2B). Calm wind conditions (< 0.5 m s−1) are also rare, on average occurring only 0.3% of the time.
Regional oceanography
Oceanographic circulation in the region is dominated by a large cyclonic gyre, which extends from within Prydz Bay to the Antarctic Divergence at ~63°S (Heil et al. Reference Heil, Allison and Lytle1996, Nunes Vaz & Lennon Reference Nunes Vaz and Lennon1996). Water is advected into Prydz Bay along the continental shelf from a westward flow that is part of the wind-driven Antarctic Slope Current. A second, deeper inflow exists across the shelf break/slope (Nunes Vaz & Lennon Reference Nunes Vaz and Lennon1996). Water flows out of Prydz Bay via a coastal current to the west. Regional oceanographic patterns indicate that currents near the Vestfold Hills coast flow from north to south, with average velocities in the order of 0.015 m s−1 (Nunes Vaz & Lennon Reference Nunes Vaz and Lennon1996).
Geomorphic units of the seabed surrounding the Vestfold Hills (from O’Brien et al. Reference O'Brien, Smith, Stark, Johnstone, Riddle and Franklin2015).

Bathymetry of Davis Bay; data from Australian Antarctic Data Centre (AADC): http://doi.org/doi:10.26179/pft8-vc59. Red circles show locations of acoustic doppler current profiler (ADCP) current meters. Iceberg scours and pits are evident in sediment basins. Dashed line shows transect (east-west) displayed in Fig. 2. Topographic data from AADC: https://data.aad.gov.au/metadata/Davis_Station.

Seabed geomorphology
The coastal seabed at Vestfold Hills has a generally shallow (< 100 m) bathymetry (Fig. S3; Smith et al. Reference Smith, O’Brien, Stark, Johnstone and Riddle2015), with three general topographic levels (O’Brien et al. Reference O'Brien, Smith, Stark, Johnstone, Riddle and Franklin2015) separated by abrupt steps (Fig. 2). The first level comprises the easternmost step boundary between land and the shallowest marine level (< 10 m deep), and it includes embayments (e.g. Abatus Bay and Heidemann Bay) and shallow areas between islands. Boulder fields are common on this level and can also be seen on the raised coastal terraces. The second level is farther to the west, where depths of 18–30 m are typical in sedimentary basins, except where the steep sides of islands and rocky outcrops approach the surface. The third level represents a drop to greater than 40 m water depth to the basin and valley floors. In the vicinity of Davis Station, this corresponds approximately to the western side of Gardner Island, which is found 4 km offshore to the west of Davis Station (O’Brien et al. Reference O'Brien, Smith, Stark, Johnstone, Riddle and Franklin2015). O’Brien et al. (Reference O'Brien, Smith, Stark, Johnstone, Riddle and Franklin2015) identified six submarine geomorphic units (Fig. 2 & Table I). Seafloor geomorphic features observed from hydrographic surveys (Fig. 3) provide further information on contemporary hydrodynamic processes. Shelf scour depressions (valley geomorphic unit) between islands and bedrock outcrops are likely to result from flow associated with tidal scour, cross-shore currents, storm-generated downwelling and alongshore currents, which are further steered and concentrated by bedrock outcrops across the area or as a result of constricted ocean currents due to other topographic features, such as islands (O’Brien et al. Reference O'Brien, Smith, Stark, Johnstone, Riddle and Franklin2015).
Fjord geomorphology
The fjords of the Vestfold Hills, including Tryne, Long, Ellis and Crooked fjords, comprise a substantial area of the coastal marine system. Geomorphic units found within the fjords include steep scarps, outcrops (and islands), embayments, valleys and basins. The Vestfold Hills fjords are generally steep-sided valleys with multiple basins separated by shallow sills and islands. For example, Ellis Fjord has four shallow sills (1–30 m) and several deeper sills, creating a series of basins along its length (Gallagher & Burton Reference Gallagher and Burton1988), and Long Fjord also has known shallow sills. Their enclosed and steep-sided terrestrial valleys create a very different suite of environmental conditions from the open coast. Steep-sided hills provide protection from strong winds, allowing sea ice to form earlier in winter than open coast and retain it for longer in summer, with some areas retaining sea ice for multiple years. Water exchange with offshore areas is also limited (Gallagher & Burton Reference Gallagher and Burton1988) due to their small or narrow mouths and the presence of sills throughout their length, including near fjord entrances. Surveys of the fjords are very limited, and their bathymetry and geomorphology are poorly known. Deep basins and valley floors have been measured at up to 222 m deep in Long Fjord and over 100 m deep in Ellis Fjord. The eastern part of Ellis Fjord has two very shallow sills that restrict water flow and result in meromictic basins with strong chemoclines; for example, a chemocline exists from 5 to 9 m in the top basin and at 40 m in the adjacent basin, below which conditions are anoxic, hypersaline and with high concentrations of sulphur compounds (Franzmann et al. Reference Franzmann, Skyring, Burton and Deprez1988). Where acoustic surveys have been undertaken, the fjords tend to have smooth sea floors, suggesting that most sedimentation results from settling through the water column; however, their steep sides show features such as gullies and sediment lobes, which indicate that gravity-driven sedimentation processes are active in these areas (O’Brien et al. Reference O'Brien, Smith, Stark, Johnstone, Riddle and Franklin2015). Sediment gullies in the fjords may have formed from seasonal incursions of sediment-laden meltwater from adjacent snowbanks, generating turbidity currents capable of eroding the sea floor. In summer, there can also be significant inputs of meltwater into the fjords from the adjacent ice sheet and ice-dammed lakes (Adamson & Pickard Reference Adamson, Pickard and Pickard1986, Gore & Pickard Reference Gore and Pickard1998).
Nearshore oceanography
Tides offshore from Davis Station are a mixture of diurnal and semi-diurnal (Heil Reference Heil2006), varying from two high/low tide cycles to a single high/low tide cycle per 24 h at different times over a spring-neap tidal cycle (Table S4). The Vestfold Hills offshore region is micro-tidal, with a tidal range (from tide gauge records) of 2.2 m and a typical spring tide range of 1.5 m, affecting a relatively narrow vertical and horizontal shore range through which wave action and ice impact occur. Modelled tidal levels for the Davis Station region over a 1 year period (1 December 2017–1 December 2018) are shown in Fig. S4. Semi-diurnal tides are dominant, with diurnal tides occurring more in summer (41%) and winter (46%) than in autumn (15%) and spring (18%). Short-term sea-level variations are superimposed on the astronomically driven tidal cycles by the passage of intense weather systems moving across the Southern Ocean. Raw sea-level observations closely match predicted tide levels, with small departures related to the passage of such weather systems, contributing variation of +0.3 m to −0.2 m above/below the mean sea level (Fig. S4).
Seawater measurements from year-round observations at a site 1 km north-west of Davis Station in 2010–2011, in water 20 m deep, showed seawater temperatures ranging from a minimum of −1.9°C in July to −0.2°C in late January. Salinity varies from a maximum value of 34.78 practical salinity units (PSU) in winter (caused by brine rejection from sea-ice formation) to a February minimum of 33.62 PSU due to freshwater input from snow and ice melt during summer (Roden et al. Reference Roden, Shadwick, Tilbrook and Trull2013). pH and aragonite saturation varied seasonally from 7.99 to 8.20 and from 1.19 to 1.92, respectively (Roden et al. Reference Roden, Shadwick, Tilbrook and Trull2013). Limited observations indicate strong seasonal changes in water properties in nearshore areas that are driven by biological production, sea-ice formation and melt and air-sea CO2 flux (Roden et al. Reference Roden, Shadwick, Tilbrook and Trull2013). There was a significant change in the carbonate chemistry of coastal waters over an 18 year period between 1993–1994 (Gibson & Trull Reference Gibson and Trull1999) and 2010–2011 (Roden et al. Reference Roden, Shadwick, Tilbrook and Trull2013), which was much greater than would be expected due just to rising atmospheric CO2. The mean winter dissolved inorganic carbon concentration in 2010 was 2224 ± 3 μmol kg−1 (1 SD; n = 7), which was 34 μmol kg−1 higher than the 1994 winter value of 2190 ± 5 μmol kg−1 (1 SD; n = 6). Approximately 35% of this change was due to ocean acidification, with 50% being due to variation in biological production and 15% being due to unknown causes (Roden et al. Reference Roden, Shadwick, Tilbrook and Trull2013).
During the 2010 open water hydrodynamic survey, weak (under 0.10 m s−1) tidal currents were observed at the two deeper sites (CM3 and CM5). Four distinct tidal peaks were expected per day under semi-diurnal forcing, but this was rarely observed, which was probably attributable to low signal strength relative to the detection limit of the instrument. The instrument noise level (detection limit) may have obscured the tidal signal at the shallow sites (CM1 and CM2, less than 10 m depth). The short record lengths relative to the 14 day spring-neap cycle and low signal-to-noise ratio confounded quantitative tidal analysis. It was clear, however, that the weak tidal currents barely penetrate the shallow waters, and thus tidal flushing within the bay is expected to be weak. Modelling of current meter data collected in 2010–2011 showed a southwards longshore flow in shallow, nearshore waters in the range 0.02–0.10 ms−1 (Stark et al. Reference Stark, Bridgen, Dunshea, Galton-Fenzi, Hunter and Johnstone2016a). The direction of primary rising tidal currents in summer is to the south-west along the coast towards Marchants Landing and Torckler Rocks, while falling tidal current flows are towards the north-east (Stark et al. Reference Stark, Bridgen, Dunshea, Galton-Fenzi, Hunter and Johnstone2016a).
During the under-ice deployments in 2021, there was also low signal strength relative to the detection limit of the instrument, indicating that the tidal currents had low velocities. There is also uncertainty in these measurements due to the signal-to-noise ratio and the short deployment durations. Current speeds at the deeper sites for peak spring tides were similar for the open water and under-ice deployments (Table S1B). Tidal currents were always below the limit of detection for the very shallow inshore sites, despite a tidal ice sheet heave of over 1 m visible in the profiler echo data. The water column backscatter measurements showed no evidence of tidal resuspension of benthic material at the shallow sites, providing further evidence that current speeds were low during the deployments.
Several wind events were observed during the summer open water deployment periods, and a response in ocean currents was observed (Stark et al. Reference Stark, Bridgen, Dunshea, Galton-Fenzi, Hunter and Johnstone2016a). Currents in open waters 5–15 m deep were strongly correlated with wind speed and direction (Fig. S5), with the strongest winds being from the north-east, and with the mean wind speed ranging from 4.7 to 6.9 m s−1 (mean 09.00 h Davis Station time = UTC +7 h). Observations of the anthropogenic wastewater plume discharged from the Davis Station outfall (seen via a slick on the surface of the water) confirmed the influence of wind speed and direction on nearshore currents in the absence of sea ice (Stark et al. Reference Stark, Bridgen, Dunshea, Galton-Fenzi, Hunter and Johnstone2016a). On 12 February 2010, for example, sustained south-westerly winds of ~16.7 m s−1 were associated with measured currents of ~0.1 m s−1 (Fig. S5A). The currents appeared to respond to south-westerly wind events in particular, but short record lengths inhibited further analysis of the directional correlation between wind forcing and measured currents.
For the under-sea ice deployment, there were two wind events during each of the CM1 and CM2 2021 deployments, including a 24 h west-south-westerly event during CM1 with sustained speeds of 28 m s−1 recorded on 25 October 2021, but there was no detectable flow response to wind forcing at either site and no correlation between time series (Fig. S5). There were no notable wind events (sustained wind speeds over 5 m s−1) coincident with the short deployments at deeper sites CM3 and CM5. The lack of response to this strong event, in contrast to the observation in open water, provides evidence that local ice cover can shut down momentum transfer, restricting wind-driven flushing in the shallow regions.
Waves
The Vestfold Hills coastline is largely protected from wave action by a band of fast ice for much of the year. The penetration of swell waves to the coast is restricted by offshore islands, shoals and grounded icebergs. Swell waves are constrained to narrow inter-island gaps, and swells approaching from the north-west or south-west are largely confined to sea ice-free periods over 2–3 months in summer. Most waves impacting the shoreline are wind waves (generated over limited fetch by local winds) rather than larger and longer-period swells (generated by distant storms and propagating across the Southern Ocean). Wind waves have relatively low energy and minor impact on exposed (sea ice-free) shorelines compared to swells. The generally shallow offshore bathymetry in the region (Fig. 3) effectively attenuates wave energy. Shallow water, reefs and islands attenuate wave energy by increasing bottom friction, causing wave breaking, inducing refraction and generating turbulence, all of which dissipate wave energy before reaching the shore (Mei et al. Reference Mei, Stiassnie and Yue2018). As a consequence, the coastline around the Vestfold Hills seldom experiences high-energy waves. Occasional periods of wave activity are likely to occur along parts of the shoreline, particularly during late summer/early spring, when protective pack ice and land-fast ice (immobile ice connected frozen to the shore or other fixed features) are absent; however, most sections of the coast could be classified as being very low to nil wave zones. Occasionally, waves and tides combine to transport macroalgal material and detritus (wrack) onto beaches or the rocky coast above the high-tide line (Fig. 4a,b). The distribution, frequency of occurrence, quantity and composition of this wrack are unknown. Waves are typically small, low-energy wind waves during mid- to late summer (Fig. 4c).
Tide and wave activity in the Vestfold Hills. a. Macroalgal detritus (wrack) washed up onto the shore at an intertidal sandflat in Heidemann Bay. b. Wrack on a rocky shore just south of Davis Station. c. Small low-energy wind waves on Davis Station beach.

Sea ice and fast ice
In winter through to early spring, sea ice (pack ice and fast ice) can extend > 1000 km offshore from the Vestfold Hills (Massom et al. Reference Massom, Reid, Stammerjohn, Raymond, Fraser and Ushio2013), before retreating to the edge of the continent in late summer (Fig. 5). Coastal sea-ice duration varies across the Vestfold Hills and has a major influence on Antarctic benthic ecosystems and communities (Clark et al. Reference Clark, Stark, Johnston, Runcie, Goldsworthy, Raymond and Riddle2013). Sea ice fills coastal embayments, covers beaches and protects shorelines from wave energy, and it also limits light penetration to the seafloor. Fast ice (or land-fast ice) occupies Prydz Bay to the south, west and north of the Vestfold Hills (Fraser et al. Reference Fraser, Massom, Handcock, Reid, Ohshima and Raphael2021). Fast ice is present around the Vestfold Hills shorelines for many months each year (only being absent in summer), but it can persist year-round in sections of the fjords. Fast ice at Davis Station generally persists for 300 (275–335) days each year (Fig. 5), and the duration of this fast ice is increasing, with the length of the fast-ice season being 25 days longer now than it was in the late 1950s (Heil Reference Heil2006). Fast ice in nearshore areas tends to remain longer than in more open areas of Prydz Bay, as coastal islands and local bathymetry near the shore prevent ice from breaking free (Fig. 5). Maximum ice thicknesses and extents occur between August and October or even into early November (most commonly mid- to late October). Sea ice is generally 1.5–2.0 m thick, and, during winter, the mean ice thickness 1 km from Davis Station is 1.67 m (Heil Reference Heil2006). Sea ice surviving over summer to form multi-year sea ice is typically thicker than first-year sea ice.
Sea-ice cover in Prydz Bay offshore from the Vestfold Hills. a. Total annual duration (days). b. Day of ice-edge advance. c. Day of ice-edge retreat. Based on 1979–2020 climatology available in the extended data in Massom et al. (Reference Massom, Reid, Stammerjohn, Raymond, Fraser and Ushio2013).

In nearshore coastal waters off the Vestfold Hills, surface melting usually commences around September and steady thinning occurs from early to mid-October onwards. Fast-ice thinning accelerates by November. Breakout of fast ice in Prydz Bay around the Vestfold Hills begins as early as October (Figs 5c & 6a), with ice retreating from the south in response to prevailing winds from the north-east and according to the geomorphology of the coast (O’Brien et al. Reference O'Brien, Smith, Stark, Johnstone, Riddle and Franklin2015). Satellite images reveal changes in sea-ice extent in eastern Prydz Bay, offshore from Davis Station, over an annual cycle (Fig. 7). This timing can vary, as late cold incursions refreeze the ocean surface through October and even into early November (e.g. in the 2010–2011 season; Fig. 6a). This increases the recorded extent of fast ice, although ice formed at this time will not be as thick as pre-existing fast ice. Rather than a gradual regression of the ice, large areas periodically break free and disperse seawards as the ice thins. From October onwards, the local fast-ice breakout typically radiates to Davis Harbour (Fig. 8) from the southern Vestfold Hills, near Sørsdal Glacier, where a polynya and a shore lead are found during most winters (Heil Reference Heil2006). Fast-ice breakout in the wider Davis Harbour typically occurs during peak tidal amplitude, especially when it coincides with strong winds due to a low-pressure system moving overhead (Heil Reference Heil2006). Local breakout can occur rapidly; for example, the fast ice within Davis Harbour, covering ~12 km2, usually breaks out within 1 h. The wider Vestfold Hills are usually free of fast ice (except for some remnants in pockets within Crooked or Long fjords and around the Tryne Islands) from late December or early January (Figs 7 & 8) due to large-scale breakout. Because of their geography and topography, the fjords retain their sea ice much longer than other coastal areas in the Vestfold Hills. Some areas of the fjords only rarely lose their sea ice to experience open water.
a. Fortnightly estimates of fast-ice extent in eastern Prydz Bay showing variation in the retreat of ice from October to February between 2000 and 2014. Extent was measured in a 340 km2 area centred ~2 km north of Davis Station. b. Fast-ice extent from 2000 to 2014 in the same region.

Regional sea-ice patterns offshore from the Vestfold Hills. Panels a.–l. show visible imagery for the Vestfold Hills region for January–December, respectively, in 2017. All imagery from the NASA Moderate Resolution Imaging Spectroradiometer (MODIS), except for May–August, the images for which are taken from the Visible Infrared Imaging Radiometer Suite (VIIRS) Day/Night Band. The extent of fast ice is outlined in cyan. Figures prepared using Quantarctica version 3 (Matsuoka et al. Reference Matsuoka, Skoglund, Roth, de Pomereu, Griffiths and Headland2021).

Local seasonal changes in fast-ice coverage in Davis Bay adjacent to Davis Station (yellow triangle), shown via cloud-free imagery from 2006 to 2018. Sea ice remains pinned behind islands, often until January. Images from Google Earth.

A dataset of circum-Antarctic fast-ice extent (Fraser et al. Reference Fraser, Massom, Ohshima, Willmes, Kappes, Cartwright and Porter-Smith2020) reveals the typical progression of fast-ice breakout in a 348 km2 area adjacent to Davis Station that can be seen between March 2000 and March 2014 (Fig. 6b). By late February, the extent of ice is at its annual minimum (Fig. 8), with local observations noting a few small areas of ice sometimes remaining in fjords, small protected inlets and bays close to the coast and on nearby islands such as Plough and Lake islands. Fast-ice formation starts in late February with intermittent freezing, but this can be blown away quite readily until later in autumn, when a more consolidated sea-ice cover develops, which generally remains in situ throughout winter and early spring.
Melting of fast ice offshore from the Vestfold Hills is partly due to a combination of surface ablation and basal melt, with a seasonal increase in sea-surface temperature (Heil Reference Heil2006). The melt rate of fast ice also depends on the intensity of incident radiation and the surface albedo of the ice. The surface albedo of sea ice and its snow cover can be significantly lowered by deposition of windblown sand and dust from ice-free areas of the Vestfold Hills. The presence of light-absorbing particles of dust can cause positive radiative forcing, changing the amount of shortwave radiation absorbed and transmitted by the snow or ice, enhancing melt rates (Wittmann et al. Reference Wittmann, Groot Zwaaftink, Steffensen Schmidt, Guðmundsson, Pálsson and Arnalds2017). Once surface melting begins, melt pools form, which lower albedo and accelerate melting. Late spring-summer melt rates are higher for ‘dirty’, lower-albedo ice compared to ‘clean’ (uncontaminated), higher-albedo snow/ice (Light et al. Reference Light, Eicken, Maykut and Grenfell1998, Wittmann et al. Reference Wittmann, Groot Zwaaftink, Steffensen Schmidt, Guðmundsson, Pálsson and Arnalds2017). Observations from Iceland show that deposition of dust onto an ice cap increased ice loss by up to 40% in a season (Wittmann et al. Reference Wittmann, Groot Zwaaftink, Steffensen Schmidt, Guðmundsson, Pálsson and Arnalds2017) compared with clean ice. Changes to albedo are affected not only by the amount of dust present, but also its colour, whereby darker material has an increased impact, and changes in albedo occur continuously as ice melt progresses (Meinander Reference Meinander2016). There are insufficient data to quantify the effects of windblown dust on the melt rates of ice and snow within and offshore from the Vestfold Hills, but observations of dust regularly blown onto the fast ice off the Vestfold Hills by strong offshore winds indicate that it accelerates fast-ice melt.
Icebergs
Icebergs of a range of sizes regularly come close to the Vestfold Hills coast. Large icebergs with a draft of 100 m or more only occur in the waters well offshore from the Vestfold Hills. For example, iceberg B39, with a surface area of 15 × 7 km, passed within 50 km of the Vestfold Hills in February 2020 (Lieser Reference Lieser2020). Shallow bathymetry (less than 46 m, apart from a few deep channels) prevents large icebergs from drifting very close to the Vestfold Hills, but they may be important for fast-ice retention and have significant effects on local water properties and currents. Grounded icebergs form pinning points for fast-ice formation and retention (Massom & Stammerjohn Reference Massom and Stammerjohn2010).
Smaller icebergs are commonly found in the shallow nearshore waters of the Vestfold Hills. Numerous hard, shallow banks throughout the nearshore area, particularly west of Gardner Island, rise to within metres of the surface to form a barrier to the passage of icebergs in currents from the north (Smith Reference Smith2017), where they ground on the ocean floor or are frozen into the fast ice. This area is known locally as ‘Iceberg Alley’, as icebergs can become grounded against these banks for years, until they melt, roll or unground and continue to drift. For example, some icebergs mapped in 2009–2010 were in the same location 7 years later (Smith Reference Smith2017).
Bathymetric surveys have identified seabed scour marks and pits from the movement of smaller icebergs in the Vestfold Hills nearshore waters, and scours are common in areas where soft sediment is the main substrate (Fig. 3; O’Brien et al. Reference O'Brien, Smith, Stark, Johnstone, Riddle and Franklin2015). Most icebergs in this region drift westwards with the Antarctic Coastal Current and prevailing north-easterly winds (O’Brien et al. Reference O'Brien, Smith, Stark, Johnstone, Riddle and Franklin2015). In the basin south of Anchorage Island, scours are orientated predominantly north-south to south-west (Fig. 3), driven by local ocean currents aided by prevailing north-easterly winds (Nunes Vaz & Lennon Reference Nunes Vaz and Lennon1996, O’Brien et al. Reference O'Brien, Smith, Stark, Johnstone, Riddle and Franklin2015).
Terrestrial geomorphology and shorelines
The Vestfold Hills have undergone several glaciation and deglaciation periods, the most recent being a late Holocene northern advance of the Sørsdal Glacier, preceded by the Vestfold Glaciation prior to the Holocene (Gore Reference Gore1997, O’Brien et al. Reference O'Brien, Gore and Frankel2024). This has resulted in abundant glacial deposits in the western and south-western Vestfold Hills but a paucity of glacial deposits towards the east (O’Brien et al. Reference O'Brien, Gore and Frankel2024). Terrestrial depositional landforms have been summarized by Gore et al. (Reference Gore, Snape and Leishman2003), who identified glacial sediments with morphologies of large debris ridges, small debris ridges, debris drapes and undulating valley fills. During ice-free periods, physical weathering and fluvial winnowing create sedimentological differences in sediments in different areas. The overriding ice sheet then bulldozes or erodes these materials sub-glacially and transports them before deposition only 3–5 km from their source (Gore et al. Reference Gore1993). In this way, glacial sediments to the east are more clay-rich, and sediment to the west, including most of the coastline, are sandier. Where land is exposed between glacial ice and marine inlets, marine fossils, including clams and worm tubes, are commonly incorporated into what are now terrestrially exposed glacial sediments (Gore et al. Reference Gore, Colhoun and Bell1994). The coastline of the Vestfold Hills intersects these landforms and sediments, where a range of geomorphic processes modify them. Coastal shorelines have been categorized into seven types (Fig. 9 & Table II) for a section of the coastline from the southern side of Heidemann Bay to the entrance of Long Fjord (Fig. S6a,b).
Examples of shoreline types in the Vestfold Hills: a. gentle rocky slope (photograph: B. Frankel); b. moderate rocky slope (photograph: B. Frankel); c. steep rocky slope (photograph: J.S. Stark); d. coastal terrace (photograph: B. Frankel); e. beach (foreground) with snowbank (at end of beach) and stranded ice foot (on coastline beyond at the left of the image; photograph: B. Frankel); f. valley mouth debris showing very limited beach landform development at the shoreline (photograph: B. Frankel); g. intertidal sandflat in Heidemann Bay (photograph: J.S. Stark); and h. tidal bar exposed at low tide at Davis Station beach (photograph: Australian Antarctic Division).

The Vestfold Hills coastline has a dominance of rocky shorelines (Fig. 9a–d). Limited beaches have formed on the western side of relatively open coastlines, including Broad Peninsula, due to abundant windblown sediment supply and due to the coast being more exposed to waves (Fig. 9e). Rocky shorelines in the more sheltered areas in fjords and in the lee of coastal islands are interspersed with lower-energy sites with valley debris (Fig. 9f) or by glacio-isostatically uplifted coastal terraces (Fig. 9d). Coastal terraces are less common at the south-western end of Broad Peninsula. Intertidal sandflats are rare and occur in sheltered shallow bays, exemplified by Heidemann Bay (Fig. 9g), and may contain features such as tidal bars (Fig. 9h).
Sea ice-shoreline morphology
A range of processes produce five ice-shoreline morphologies, generally formed in the fast ice (Fig. 10 & Table III). These were mapped along a section of coastline from the southern side of Heidemann Bay to the entrance of Long Fjord (Table III). Tidal raising and lowering of fast ice imposes vertical forces where the ice is frozen to the shoreline. This process creates tide cracks in the fast ice, which are present over most shorelines at the Vestfold Hills, usually sub-parallel to the shoreline (Fig. 10c). Most of these cracks are in the order of tens to hundreds of metres long, but in places individual cracks are continuous for over 1 km. Pressure ridges formed by convergent ice stresses are also common in the coastal ice (Fig. 10a). Pressure ridges are generally connected to the seaward fast ice, although they may be separated by moats (Fig. 10b) or tide cracks. Extensive snowbanks can form in the lee of coastal hills and ridges, which often contain large quantities of windblown sediment (Fig. 10d).
Shoreline types in the Vestfold Hills along a section of coast 25.8 km long.

Coastal shoreline sea-ice features. a. Moats and ridges near Davis Station, with fast ice in the middle distance. b. Moat between bay ice and coast, with a dirty snowbank bordering the bay. Weddell seal indicates scale. c. Pressure ridges and tidal cracks; snowbank with sediment (photographs: J.S. Stark).

Sea-ice shoreline features along a section of coast 25.8 km long. Multiple ice morphologies may be present at a given point along the shoreline, as morphology can vary with distance from shore.

Sediments
Terrestrial sediments
The western Vestfold Hills is extensively covered by glacial sediments in the form of moraine ridges, debris mantles and undulating valley fills (Gore et al. Reference Gore, Snape and Leishman2003). Terrestrial sediments show differentiation between shoreline (beach) sediments and gully/valley sediments (analysis of similarities (ANOSIM) R = 0.32, P = 0.001). Shoreline sediments are predominantly medium to coarse sands but can also include varying degrees of gravel, and they are generally poorly sorted (Table S5). Gully or valley sediments are also poorly sorted and show a larger size range, with silty materials being more common than in shoreline sediments. There were no significant differences in grain size between terrestrial sediment sampling locations.
Marine sediments
Marine sediments in the Vestfold Hills have a grain-size distribution that is generally unimodal and poorly sorted, ranging from fine-grained sandy muds/coarse silts to coarse sands. A gradient of sediment grain size can be seen in the principal component analysis (PCA) ordination vector plot, with PC1 strongly correlated with the < 63 μm fraction and explaining over 79% of the variation, while PC2 was correlated with very fine, fine, medium and coarse sands (Fig. 11). Four main groups were identified by cluster analysis, which can be distinguished by their dominant grain size: clay and silty muds (< 63 μm), very fine sand, fine sand and medium/coarse sand (Fig. 11).
Principal component analysis (PCA) ordination of marine sediment grain-size properties at locations around the Vestfold Hills. Numbers and letters represent locations as shown in Fig. 1. Ellipses represent groups identified by cluster analysis.

Spatial analysis of the sediment grain-size distribution shows significant differences among locations, with relatively minor variation found within locations (Fig. 12). There is a very large degree of variation in grain-size characteristics and organic carbon contents across locations, which was far greater than the variation within locations (Table IV). The transition from onshore coarse sediments to finer offshore sediments is demonstrated in the intertidal sediments from Heidemann Bay, where at high-tide levels there are very low amounts of fines, which increase down-shore to the shallow subtidal zone (Fig. 12). TOM across the region ranged from < 1% to 15% (Fig. 12). Higher TOM levels were measured at sites with fine-grained muddy sediments in comparison to those with medium to coarser sediments (Fig. 12).
Box-and-whisker plots showing the proportion of marine sediment grain-size classes and total organic matter (TOM) at each location. See Fig. 1 for location positions and Table S2 for full names. LOI = loss on ignition.

Spatial differences in sediment grain size. Results of permutational multivariate analysis of variance (PERMANOVA) of differences in grain size among and within locations based on six grain-size categories: < 63 μm fraction, very fine sand, fine sand, medium sand, coarse sand and > 2 mm fraction.

df = degrees of freedom.
Coastal sediment transport
Sediment transport in the Vestfold Hills results from aeolian (Pickard Reference Pickard1982, Adamson & Pickard Reference Adamson, Pickard and Pickard1986), fluvial and mass movement processes related to snow and ice-sheet margin melt (Gore Reference Gore1992, Fitzsimons Reference Fitzsimons1996, Gore & Pickard Reference Gore and Pickard1998). Marine processes include sea-ice and wave reworking of shoreline sediments (Peterson et al. Reference Peterson, Finlayson and Qingsong1988), tidal and wind-driven ocean currents, underwater turbidity current gullies and debris flow deposits and ice-keel scouring enhancing sediment mobility (O’Brien et al. Reference O'Brien, Smith, Stark, Johnstone, Riddle and Franklin2015). Coastal sediment transport processes can erode, transport or deposit sediment, both onshore and offshore, but the net rate and magnitude of sediment transport are unknown. Less important processes include periglacial solifluction and gelifluction, which move sediment slowly downhill towards the coast, or the terrestrial mass movement of rock and sediments through slumps, slides, flows and rockfalls (Fitzsimons Reference Fitzsimons1996). These mass movement processes are common in parts of the Vestfold Hills, but they are not significant contributors to terrestrial sediment movement in the western Vestfold Hills.
Aeolian transport
Aeolian processes play a significant role in sediment transport in the Vestfold Hills and deliver sediments onto sea ice or into the nearshore zone. The finer matrix of glacial and glaciomarine sediments in the Vestfold Hills is readily transported by strong winds and is typically deposited in snowdrifts, in the lee of boulders or directly into the sea or onto sea ice (Franklin Reference Franklin1997). Sediment deposition onto the sea ice is visible in plumes aligned with prevailing wind directions. Salt and frost weathering, both of which being active in the western Vestfold Hills (Adamson & Pickard Reference Adamson, Pickard and Pickard1986, Gore et al. Reference Gore, Creagh, Burgess, Colhoun, Spate and Baird1996), liberate sand-sized grains from the bedrock and larger sediments, and this abundantly produced sand is then available for movement by wind and water.
Snowbanks in the western Vestfold Hills appear banded and dark (Fig. 10d) due to the inclusion of sediment and debris from windblown material, and they are likely to be an important source of sediment in fjords and shallow coastal waters when they melt. Monitoring of sediment movement from mid-1993 to early 1995 using sediment traps placed at Heidemann Bay (Fig. 1) found the heaviest loads of windblown sediment in traps at ~50 cm above ground level (Franklin Reference Franklin1997). Grain sizes were dominated by medium to coarse sands, with almost no silts or clays, which probably passed through the 63 μm mesh that was used. Windspeed threshold values required to transport dry, sandy sediment in the western Vestfold Hills are ~10–12 m s−1 (Franklin Reference Franklin1997). Up to 6500 t year−1 of sediments are estimated to be transported across the Vestfold Hills by wind (Franklin, Reference Franklin1997), although this estimate did not include fine (< 63 μm) sediment and is based on measurements from limited areas and temporal scope. A more recent dust monitoring programme measured rates of up to 62 g m−2 per month over short periods, which included significant deposition of < 63 μm sediment and highly variable deposition rates, both spatially and temporally (Fig. 13).
Aeolian sediment transport rates at three sites in the Vestfold Hills coastal area. Different-coloured lines represent different sediment traps. Data from Australian Antarctic Data Centre (AADC): https://data.aad.gov.au/metadata/AAS_5097_DAP_Dust.

Aerial and satellite images of the Vestfold Hills from 2003 to 2019 were assessed to determine the extent of aeolian sediment deposition onto the sea ice and its potential effects on sea-ice albedo. In December 2000, February 2011 and October 2012, large amounts of sediment were deposited on the ice, apparent as three sediment plumes offshore from Davis Station visible from aerial photography or satellite imagery. These events demonstrate that aeolian transport of sediment is an important mechanism offshore from the Vestfold Hills. There are likely to have been more such events between 2003 and 2019, but these are not always captured by intermittent aerial photography or satellite imagery, with subsequent snowfall or windblown accumulation also obscuring sediment deposition. The 2019 event was captured by dust-monitoring stations, which recorded as much as 95.5 g m−2 month−1 when examined on 7 November 2019. In the 2009 and 2011 instances, wind speeds preceding these aeolian deposition events averaged 19.5 and 22.5 m s−1, respectively.
The aeolian sediment deposition event onto the sea ice off the Vestfold Hills in 2012 demonstrates the possible impacts on sea-ice breakout due to changes in albedo and resulting increased melt. A satellite image dated 13 October 2012 (Fig. 14a) shows sediment plumes extending > 10 km across the surface of the sea ice. Imagery from 14 September 2012 shows clean ice, indicating the deposition event in the intervening period. Wind speed (Fig. S7) and direction records during this period indicate strong winds on 3 October 2012 (average 19 m s−1) for 13 h that may have caused this deposition, peaking at an average of 24 m s−1 for 1 h, with stronger gusts. Wind direction was from 36°N to 62°N, with an average wind direction of 47°N. This correlates well with the orientation of the majority of the dust plumes in the image, measured at 45°N to 47°N. Some plumes have slightly different orientations from 50°N to 65°N (typically 55°N), such as on the western corner of Plough Island (Fig. 14c,d) and between Flutter and Lake islands (Fig. 14f). Allowing for local topographic channelling, these plumes are likely to be part of the same event. This depositional event, with wind speeds over 19 m s−1, is not uncommon for Davis Station, with 16 other events of that magnitude occurring in 2012 (Fig. S2A). Most of these were from the north-east, similar to the October 2012 event. Not all events resulted in dust deposition on the ice, although our understanding of this is limited by a lack of satellite imagery.
Aeolian deposition of sediment onto sea ice. a. Satellite image dated 13 October 2012 illustrates sediment plumes extending > 10 km across the sea ice. b. By late December 2012, the fast-ice extent was significantly reduced in east Prydz Bay. c. Sediment plume west of Plough Island, 13 October 2012 (Google Earth Image). The field of view is ~1 km wide. d. The same sediment plume west of Plough Island but 10 weeks later than in c., on 26 December 2012 (Google Earth Image). Open water (green to dark green areas) and melt pools appear more prevalent in areas where sediment had accumulated. e. Sediment accumulation north-north-east of Davis Station, between Lake Island and Flutter Island, 13 October 2012 (Google Earth Image). The field of view is ~800 m wide. Three very thick deposits in the centre of the image and one in the upper centre are of particular note when comparing with f. the same sediment plume north-east of Davis Station but 10 weeks later, on 26 December 2012 (Google Earth Image). Note open water (dark patches) in areas where thick sediment deposits had previously accumulated.

By late December 2012, fast-ice extent was significantly reduced in east Prydz Bay. Imagery from 26 December 2012 illustrates melt pools and holes in the ice (Fig. 14d,f). Comparison of the 13 October and 1 December imagery indicates preferential melt in areas of heavy (dark) sediment accumulation, demonstrating accelerated melt rates as a consequence of sediment deposition. Analysis of fast-ice measurements in east Prydz Bay indicates that its melt rate in 2012 was above average, with open water present in the bay 4 weeks earlier than average between 2000–2001 and 2013–2014. While these images indicate an increased melt rate caused by the presence of dust on the ice, the overall rate of melt cannot be solely attributed to this. Temperatures in late October and November 2012 were slightly warmer than average and are also likely to have affected the melt rate. The October 2012 mean temperature was −6.4°C compared with −9.0°C for all years of data available; the November 2012 mean temperature was 0.0°C vs −2.2°C for all years of data available (BoM 2023a).
Fluvial transport
The Vestfold Hills have very low precipitation, and surface water flow is limited to a brief summer snow and ice melt period. Streams near the ice-sheet margin can be ice-dammed and release flows large enough to erode channels in the glacial sediment (Gore & Pickard Reference Gore and Pickard1998, Gore Reference Gore1992), but these are rare closer to the coast. Water catchments and drainage basins are shown in Fig. S8. In coastal areas, gentle meltwater flows mobilize wind-deposited material in snowbanks in the lee of hills (Franklin Reference Franklin1997), delivering sediment to marine environments (Fig. 15). Steep shorelines in the lee of prevailing winds are also where snow drifts can accumulate, forming snowbanks that can hold sediments. When these melt in summer, they release their sediment load into adjacent shoreline and marine habitats and can contribute to sedimentation. The period of fluvial flow is relatively short (December–February), with ephemeral streams created during the seasonal melt period only being active for a few weeks at the height of summer (Franklin Reference Franklin1997). The volume of these flows is unknown. Some marine bays have multiple drainage basins delivering sediment into them; for example, WB has five drainage pathways (Fig. S4), and it also has a high proportion of mud and very fine sediments (Fig. 12).
Fluvial sediment transport in the western Vestfold Hills. Three views are provided of fluvial flows into the sea at site WB: a. melt stream near the shoreline with suspended sediment (photograph: G.J. Johnstone); b. sediment-laden snowbank with melt stream near shoreline (photograph: G.J. Johnstone); and c. meltwater flow in Camp Lake valley flowing into location WB, looking south-east towards Camp Lake, 6 December 2018 (photograph: Australian Antarctic Division).

The Vestfold Hills are dotted with hundreds of water bodies (Fig. 1), ranging in size from small depressions to large lakes, with salinities ranging from fresh to hypersaline. Many of these are within closed-water catchments where surface water drains inland to a low point and does not discharge to the sea. There are two large externally draining lake and stream networks in the Vestfold Hills that funnel ice-sheet meltwater into the sea: the Zvezda, which flows to Long Fjord; and the Druzhby, which flows to Ellis Fjord (Tierney Reference Tierney1975, Gore & Pickard Reference Gore and Pickard1998). These are thought to have important implications for the oceanography and biology of the fjords (Gallagher & Burton Reference Gallagher and Burton1988, McMinn et al. Reference McMinn, Gibson and Hodgson1995).
Sea ice-sediment transport
Sea-ice movement affects sediment transport through four main mechanisms, all of which can be observed along the coast of the Vestfold Hills. Sea-ice push occurs where shear loading on the fast ice (typically by wind) forces ice into the shore and also creates pressure ridges in the sea ice (Fig. 10a), pushing sediments, particularly larger sediments and boulders (Figs 9e & 10c), up the beach, but also macroalgal wrack (Fig. 4a,b). This often creates shore-parallel sediment ridges, present along much of the coast near Davis Station (e.g. Figs 9h & 10c). Erosion, entrapment and rafting of sediments from the seabed can occur when anchor ice forms, or where sea ice forms in shallow water. These sediments (and ice-encased benthos) rise to the surface and are exposed as sea ice ablates or melts, and they are regularly observed in the Davis Station area. Melting sea ice then re-deposits this sediment to the seabed, usually at a different location. The formation of an ice foot on the shore can erode sediments, including larger clasts, from the shoreline. The ice foot that forms along the entire Vestfold Hills coast can be large, extending from the mean high water level to several metres below the low-tide level as a solid mass of ice, encasing rock and sediment. When the ice foot thaws, these sediments are re-deposited in a shore-parallel belt. Rafting of aeolian sediment occurs when sediment deposited on the ice surface (e.g. Fig. 14) is transported out to sea when the ice breaks out. Sediment can be transported much further than if it had landed in open water, and this mechanism plays an important role in coastal sediment transport, carrying sandy sediments considerable distances offshore; however, transport distances and rates have not been quantified in the Vestfold Hills.
Hydrodynamic sediment transport
Hydrodynamic sediment transport in the relatively low-energy environments of Antarctic coastal waters is not well understood. Marine sediment transport in coastal marine waters can occur by currents and ice-keel scouring, which enhances sediment mobility (O’Brien et al. Reference O'Brien, Smith, Stark, Johnstone, Riddle and Franklin2015). Evidence of mass transport processes can be found in turbidity current gullies and associated sediments (O’Brien et al. Reference O'Brien, Smith, Stark, Johnstone, Riddle and Franklin2015). In the shallow and intertidal zone, tides, swells and wind waves impact the foreshores and coastal morphology during the 2–3 months of sea ice-free conditions each year, creating cross-shore (perpendicular to the shore) and longshore (parallel to shore) sediment transport (Peterson et al. Reference Peterson, Finlayson and Qingsong1988).
Cross-shore sediment transport results in sediment exchange between the onshore and offshore environments. Typically, beaches with gentle slopes potentially have a broader zone of cross-shore transport. When appreciable cross-shore transport occurs, bar-type landforms can develop, which are worked back and forth across the beach face. Some cross-shore sediment transport probably occurs in the wave zone adjacent to Davis Station as the beaches are often 15–50 m wide, such as Davis Beach (Fig. 9h), where a mid-lower tidal bar forms. Waves that encroach on the coast at any non-perpendicular angle move sediment parallel to the shoreline. Longshore transport is not predicted to be a major sediment transport process in the Vestfold Hills because of the isolated nature of individual beaches between rocky shorelines, but no research has examined longshore drift moving sand within or between beaches.
Sedimentation rates
Sedimentation rates in the coastal waters of the Vestfold Hills have only been measured during a relatively short period in the 2010 summer, and they show considerable spatial variability, differing by up to a factor of 15 between sites (Table V). They were greatest in the mouth of Ellis Fjord (Site 12), where rates of up to 62 g m−2 day−1 were recorded, possibly due to sediment being transported out of the fjord by meltwater. They were lowest in the mouth of Laternula Inlet (Site 13) and offshore from Davis Station (Site 2; Table V), which are relatively sheltered, with minimal freshwater input during the deployment period. Small-scale variation over a few hundred metres of a factor of 4 is apparent when comparing Sites 1, 2, 3 and 5, which were relatively close together. Sedimentation is likely to vary strongly over an annual cycle, driven by spring and summer phytoplankton blooms, summer meltwater inputs and the seasonal formation of sea ice limiting wind-induced turbulence in the water column, allowing material to settle out under low-current conditions, followed by ice break-up in the summer.
Sedimentation rates in the nearshore marine waters of the Vestfold Hills.

n = number of replicate traps retrieved; SE = standard error.
Discussion
The processes structuring ice-free coastal and shallow marine areas in Antarctica remain poorly understood at local scales, with limited detailed studies having been conducted on the complex interactions among the physical variables that shape them. While elements of the terrestrial and marine landscapes of the Vestfold Hills have been described previously, a holistic assessment of this coastal area was lacking. The Vestfold Hills coastal marine system is a dynamic and varied region with a range of coastal habitats structured by physical processes acting on the deglaciated sediments and landforms. It has a complex topography that gives rise to a range of coastal environments. The rocky open coasts, islands and open embayments of the Vestfold Hills are typical of the predominant landforms on Antarctic ice-free coasts, but the highly sheltered marine inlets and intertidal sedimentary habitats in the Vestfold Hills marine inlets are less common in Antarctica.
The degree of protection from, or exposure to, energy from waves, currents, wind, meltwater flow and ice movement is critical for coastal zone processes that structure landforms and drive variation in sediments. The degree of exposure is a function of the topography of the surrounding land and seabed, affecting vectors of winds, fetch and waves. Low-relief coastal areas that are semi-enclosed by rocky shoreline limit the ingress of waves and icebergs and allow for the development of intertidal beaches. These can be extensive where they occur at the mouth of a valley, such as Heidemann Bay at the mouth of Heidemann Valley. In contrast, on semi-sheltered coast such as the area in front of Davis Station or Abatus Bay, these intertidal beaches are much narrower. On exposed coast, such as the western sides of the islands offshore from the Vestfold Hills, intertidal sedimentary habitats do not occur at all and only rocky shores are present. Semi-enclosed shorelines, whether steep and rocky or low relief, also allow sea ice to persist for longer periods than open coast due to protection from strong winds and waves. Sea ice can endure well into late summer in some areas, most notably in the Vestfold Hills marine inlets and fjords.
The generally very shallow bathymetry offshore from the Vestfold Hills, with depths of less than 40 m up to 5 km offshore, is unlike other areas in East Antarctica, such as the Windmill Islands or the area around the Mawson research station. Very little nearshore bathymetric information exists outside these coastal areas in East Antarctica. The marine waters of the Vestfold Hills have relatively uniform depths that increase gradually, with the exception of the fjords. The Windmill Islands, in contrast, have deeper marine areas (100–200 m), with steeper slopes close to shore, including higher terrestrial areas, and water depth varies significantly over small scales (tens to hundreds of metres). Mawson has very deep marine areas (> 300 m) very close to shore and has limited shallow areas, confined to between offshore islands and a small area near Mawson Station. This shallow Vestfold Hills bathymetry, combined with many offshore islands and shallow reef outcrops, results in very limited tidal flushing, with low current velocities (< 0.1 m s−1), even during periods of open water. Sea ice further limits hydrodynamic process such as currents and mixing of the water column, creating very stable environments. In some highly sheltered areas (e.g. in Ellis Fjord), there is strong evidence for limitation of water exchange with the open ocean, and primary production can be higher than in offshore waters and is retained in the fjord (Gallagher & Burton Reference Gallagher and Burton1988). There are also differences between winter and summer ocean hydrodynamic conditions in the nearshore waters of the Vestfold Hills, most likely due to sea ice limiting ocean-atmosphere exchanges, including wind- and wave-induced shallow water turbulence, currents and mixing. The influence of sea ice on the variation in nearshore current hydrodynamics over an annual cycle is likely to be important, but further research is needed to capture longer time intervals and more wind events in open water and under sea ice. Turbidity is very low in late winter and early spring, providing further evidence for reduced currents and turbulence under sea ice over winter, resulting in the settlement of suspended particles out of the water column. Higher turbidity occurs in summer and is partly due to the annual plankton bloom, but it could also be due in part to wind-induced mixing of shallow waters and the influx of terrestrial sediments to coastal areas from fluvial and aeolian processes.
Sea ice is generally very important as a driver or buffer of key coastal processes in Antarctic coastal areas. Sea ice drives geomorphological differentiation of coastal terrestrial landforms through pressure- and tidally driven ice forcing. In the Vestfold Hills, there is evidence of this in the area south of Davis Station to Marchants Landing, where extensive bands of tide cracks and pressure ridges appear in the sea ice each year. This area of coast has shore parallel terraces composed of rocks and boulders that have been pushed onshore. Sea ice also strongly influences coastal marine ecosystems through the limitation of photosynthetically active radiation reaching the seabed, influencing the distribution and growth of macroalgae (Clark et al. Reference Clark, Stark, Johnston, Runcie, Goldsworthy, Raymond and Riddle2013). Benthic communities in areas with short periods of open water (or no open water in some years), such as in Ellis Fjord (Kirkwood & Burton Reference Kirkwood and Burton1988), are dominated by marine invertebrate communities, as there is insufficient light to support most macroalgal species. Sea ice also influences the communities present in the intertidal areas of the Vestfold Hills due to the annual formation and persistence of the ice foot into late summer, where a solid mass of ice several metres thick forms that encases the intertidal area, which extends at least the width of the tidal range up to several metres below or above it depending on the slope of the shore. Once this has melted or broken away, the only communities present in this zone consist of ephemeral filamentous algae or diatoms.
Atmospheric conditions in the Vestfold Hills, including prevailing offshore winds, are a key driver of coastal processes that modify the landscape and influence other processes. The Vestfold Hills coastal region experiences warmer summer temperatures than comparable coastal ice-free areas in East Antarctica, as well as very low precipitation. Weather patterns in the Vestfold Hills are dominated by passing synoptic systems rather than katabatic flow from the Antarctic plateau, resulting in less frequent high-wind events in comparison to other areas of the Antarctic coast (Heil Reference Heil2006). Aeolian transport of sediment into coastal margins, onto sea ice and into adjacent waters is an important contributor of sediment into the Vestfold Hills coastal waters. Further research is needed in this area, particularly given the strong evidence for increasing wind speeds in the Vestfold Hills area, probably due to the strengthening of circumpolar eastward winds (Thompson & Solomon Reference Thompson and Solomon2002, Heil Reference Heil2006). Data on the rate and magnitude of aeolian sediment transport and the effect of dust deposition on Antarctic sea ice (e.g. melt rates) are extremely limited. Research from McMurdo Sound demonstrated aeolian deposition onto ice of between 7.8 and 24.0 tonnes of sediment per km2 (Atkins & Dunbar Reference Atkins and Dunbar2009), with deposition up to 5 km from shore for sand and 100 km for silt (Chewings et al. Reference Chewings, Atkins, Dunbar and Golledge2014). Sediment is visible in satellite images at distances of at least 10 km offshore from the Vestfold Hills and is likely to be distributed much farther. Aeolian sediment inputs are also likely to be important sources of iron into coastal Antarctic waters (de Jong et al. Reference de Jong, Schoemann, Maricq, Mattielli, Langhorne, Haskell and Tison2013). The aeolian transport of dust from the Vestfold Hills onto sea ice contributes significantly to the total pool of iron in coastal waters and supports primary production in this area (Duprat et al. Reference Duprat, Kanna, Janssens, Roukaerts, Deman and Townsend2019). Iron concentrations in sea ice (dissolved and particulate), from sediment entrapped during ice formation as well as aeolian deposition onto ice, have been found to be up to two orders of magnitude higher than in seawater under the ice (Duprat et al. Reference Duprat, Kanna, Janssens, Roukaerts, Deman and Townsend2019). This iron is likely to support primary productivity in the Vestfold Hills sea ice and waters.
Fluvial transport of sediment, such as from snowbanks or in melt streams, is also thought to be important in the Vestfold Hills. Evidence of significant fluvial input of sediment is inferred from observations of thick sediments in some nearshore marine areas in the Vestfold Hills. These are likely to be depositional basins due to the high degree of protection from wind and waves promoting sedimentation, as well as the proximity to catchments as fluvial sediment sources. The enclosed bay at site WB, for example, has among the highest proportions of fine (< 63 μm) sediment in the Vestfold Hills area and has five drainage basins in adjacent terrestrial habitats, and multiple seasonal turbid melt streams, laden with sediment, have been observed feeding into it. Meltwater drainage from the ice sheet may also be an important source of fluvial sediment in some areas, as occurs into Ellis Fjord (Gallagher & Burton Reference Gallagher and Burton1988), and this may explain the high sedimentation rates observed in the mouth of the fjord. Climate change is also expected to change precipitation and melt rates in coastal Antarctica, and there is strong evidence for increased precipitation rates in the Vestfold Hills between 1977 and 2002 (Heil Reference Heil2006), which would increase fluvial transport processes. Fluvial sediment transport requires further quantitative research in this region. Such research is generally lacking for Antarctic coastal waters, with the only study to measure fluvial transport focusing on the north-east Antarctic Peninsula, where large sediment loads (up to 1.73 ± 1.02 t km−2 day−1) were observed in small rivers (Stringer et al. Reference Stringer, Boyle, Hrbáček, Láska, Nedělčev and Kavan2024). It was hypothesized that fluvial transport is controlled by, and is sensitive to, a combination of air temperature, precipitation and the depth of the active thaw layer (Stringer et al. Reference Stringer, Boyle, Hrbáček, Láska, Nedělčev and Kavan2024).
Net transport of fluvial and aeolian sediment into coastal waters may be much higher in the Vestfold Hills than in other coastal areas in East Antarctica such as the Windmill Islands. Marine sedimentation rates offshore of the Vestfold Hills ranged from 3 to 56 g m−2 day−1, which is much higher than that observed at the Windmill Islands over similar deployment periods and times of year, which ranged from < 1 to 5 g m−2 day−1 (Clark et al. Reference Clark, Stark, Palmer, Riddle and Johnston2017). This difference may simply be because the Vestfold Hills is a large ice-free area of exposed sediment and rock, whereas other coastal ice-free areas have more extensive ice and snow cover. Coastal areas such as the Vestfold Hills are biologically important in land-ocean fluxes of labile carbon and macro- and micro-nutrients (Hodson Reference Hodson2006, Nowak et al. Reference Nowak, Hodson and Turchyn2018). Melt derived from multiannual snowbanks and inland snowpacks contains nutrients, dissolved organic carbon and chlorophyll and contributes to the biogeochemical enrichment of Antarctic coastal ecosystems (Lyons et al. Reference Lyons, Dailey, Welch, Deuerling, Welch and McKnight2015, Monien et al. Reference Monien, Monien, Brünjes, Widmer, Kappenberg and Busso2017). Coastal snowbanks and associated melt are also sources of the microbial activity that plays an important role in nutrient cycling (Hodson Reference Hodson2006). Penguin and other bird colonies are other sources of nutrients into the Vestfold Hills coastal waters via meltwater runoff (Leishman & Wild Reference Leishman and Wild2001), as can be observed in the high phosphate levels in marine sediments adjacent to a penguin colony in the southern Vestfold Hills (Stark et al. Reference Stark, Bridgen, Dunshea, Galton-Fenzi, Hunter and Johnstone2016a). It has been estimated that there are 340 000 breeding pairs of Adélie penguins in the Vestfold Hills (Southwell et al. Reference Southwell, Emmerson, McKinlay, Newbery, Takahashi and Kato2015), which would form a significant source of guano-associated nutrients into coastal waters. These combined processes play an important role in driving biological process and supporting biodiversity in the Vestfold Hills marine ecosystem.
There are distinct differences between terrestrial and marine sediments in the Vestfold Hills, both nearshore and farther offshore (O’Brien et al. Reference O'Brien, Smith, Stark, Johnstone, Riddle and Franklin2015). Marine sediments contain a larger proportion of finer-grained materials than terrestrial or glacial sediments (O’Brien et al. Reference O'Brien, Smith, Stark, Johnstone, Riddle and Franklin2015). Despite the different conditions across the terrestrial sampling locations (exposure to wave energy, fluvial catchments, isolation of beaches and valley mouths), coastal terrestrial materials are relatively uniform and do not display the strong location differences seen in marine sediments. Spatial variation in marine sediments results from differing sedimentation regimes (aeolian, fluvial and biological processes; e.g. primary production) combined with differing degrees of sorting. Such variation has important consequences for environmental sediment sampling, as small-scale spatial variation can confound comparisons across space and time; thus, it is important that sampling designs include adequate replication and estimation of variation at multiple scales (Morrisey et al. Reference Morrisey, Stark, Howitt and Underwood1994). Comparison of terrestrial shoreline with subtidal nearshore marine sediments indicates some cross-shore movement, such that nearshore marine sediments may form a significant contribution to shoreline terrestrial sediment supply.
Icebergs also influence a range of coastal processes, including sediment transport and coastal morphology, and they represent a key disturbance mechanism in coastal waters driving heterogeneity in benthic habitats and communities (Smale et al. Reference Smale, Brown, Barnes, Fraser and Clarke2008). However, this process is only likely to act in certain areas of the Vestfold Hills, such as Davis Bay, where extensive scour marks and seabed depressions from icebergs have been observed (O’Brien et al. Reference O'Brien, Smith, Stark, Johnstone, Riddle and Franklin2015). More enclosed areas such as fjords and marine inlets are less likely to experience ice-scour impacts, as their bathymetry excludes large icebergs or their topography limits their intrusions, particularly as the predominant winds are offshore, blowing ice away from the coast.
The fjords and marine inlets of the Vestfold Hills are unusual in their extents and physiographic complexity. The limited bathymetry shows obvious sills that separate the various basins, rendering some of them meromictic (Gallagher & Burton Reference Gallagher and Burton1988). This is dissimilar to fjords in other regions of Antarctica, including the Antarctic Peninsula (García et al. Reference García, Dowdeswell, Noormets, Hogan, Evans, Ó Cofaigh and Larter2016, Munoz & Wellner Reference Munoz and Wellner2018), which are generally deepest near their mouths and have more uniform depths throughout. The Vestfold Hills fjords were formed by plucking as the ice flowed obliquely across them (Adamson & Pickard Reference Adamson, Pickard and Pickard1986), and they may be better described as deep drowned lake systems, or simply as marine inlets. The topography of these fjords, with steep sides and narrow entrances, provides a level of protection from iceberg scour not seen in most other parts of the coast of East Antarctica, except where fast ice may be present for most of the year.
Potential effects of climate change on the coastal environment and processes
Climate change is likely to have a profound long-term impact on the Vestfold Hills coastal environment through a combination of changes to cryospheric, atmospheric and hydrodynamic processes. Specific effects on the Vestfold Hills coastal environment are uncertain due to the complexities of oceanic, cryospheric and atmospheric interactions, but a number of local and Antarctica-wide trends are clear.
The dates of annual maximum fast-ice thickness and final fast-ice breakout in the Vestfold Hills are becoming later each year (by +0.43 days year−1), which appears to be influenced by winter and spring warming (Heil Reference Heil2006). This results in an increased duration of the fast ice (+0.67 days year−; Heil Reference Heil2006); however, there are no available data on changes in the corresponding date of formation (or advance) of sea ice/fast ice each year. Changes in sea-ice coverage, properties (e.g. thickness) and dynamics could lead to changes to the protection of the coast from exposure to wind and waves (Reid & Massom Reference Reid and Massom2022). Reduction in sea ice will reduce the protection from erosion afforded by fast ice, but it will also reduce the erosive effects of sea ice both on bedrock and soft sediments. Reduction of sea ice will also allow greater work from wave action to be performed on the shoreline, which will erode sedimentary coastlines. Changes to sea-ice duration will also influence benthic ecosystems through changes in light reaching the seabed (Clark et al. Reference Clark, Stark, Johnston, Runcie, Goldsworthy, Raymond and Riddle2013). Changes in sea ice could also increase or decrease scour by sea ice and icebergs in shallow waters (Massom & Stammerjohn Reference Massom and Stammerjohn2010, Barnes et al. Reference Barnes, Fleming, Sands, Quartino and Deregibus2018). The number and movement of icebergs is expected to change in future responses to climate change and its effects on iceberg production, sea-ice distribution and thickness and ocean temperatures (Massom & Stammerjohn Reference Massom and Stammerjohn2010). Warming of Antarctic surface waters through southwards shift and strengthening of the Southern Hemisphere mid-latitude westerly winds (Collins et al. Reference Collins, Knutti, Arblaster, Dufresne, Fichefet, Friedlingstein, Stocker, Qin, Plattner, Tignor, Allen and Boschung2013) along with increased heat delivery from Upper Circumpolar Deep Water onto the continental shelf (Meredith & King Reference Meredith and King2005) is also likely to further impact sea ice. There has been a recent dramatic structural change in Antarctica’s sea-ice system, with there being evidence for a regime shift in the extent of summer sea ice and a general rapid decline in annual mean Antarctic sea-ice extent (Hobbs et al. Reference Hobbs, Spence, Meyer, Schroeter, Fraser and Reid2024, Raphael et al. Reference Raphael, Maierhofer, Fogt, Hobbs and Handcock2025), with consecutive years of record minimum extents (Raphael & Hancock Reference Raphael and Handcock2022, Gilbert & Holmes Reference Gilbert and Holmes2024). How this will translate into regional and local effects on coastal areas such as the Vestfold Hills is uncertain.
There is a significant annual atmospheric warming trend at Davis Station, of between +0.012°C and +0.017°C year− (Heil Reference Heil2006). There have also been observed increases in local wind speeds in the Vestfold Hills (Heil Reference Heil2006). The intensification and southerly shift of westerly winds in Antarctica during summer over the past 50 years due to climate change (Lenton & Matear Reference Lenton and Matear2007) is predicted to increase the frequency and intensity of storms in coastal areas (Sokolov & Rintoul Reference Sokolov and Rintoul2009). This could lead to greater aeolian sediment transport and deposition of sediment onto sea ice and also increase the influence of dust on the albedo of sea ice in a future windier and warmer coastal environment. There has been a significant increase in precipitation in the Vestfold Hills, with an upward trend of +0.003 m year−, probably influenced by an increase in cyclone frequency and changes in their intensity (Heil Reference Heil2006). Greater amounts of precipitation under a warmer climate will enhance loss of terrestrial ice and increase erosion of sediments (Zhang et al. Reference Zhang, Li, East, Walling, Lane and Overeem2022), the hydrolysis of soil minerals and the dissolution of soluble salts in soils and hypersaline lake shoreline sediments (Adamson & Pickard Reference Adamson, Pickard and Pickard1986, Gore et al. Reference Gore, Creagh, Burgess, Colhoun, Spate and Baird1996). Warming will also cause permafrost and seasonal ground ice to decline in extent both spatially and temporally, in some cases reducing the strength of soft sediments and increasing their erodibility. Combined, these outcomes may lead to dramatic erosion of some sedimentary coastlines of the Vestfold Hills, as has occurred in the Arctic (Irrgang et al. Reference Irrgang, Bendixen, Farquharson, Baranskaya, Erikson and Gibbs2022).
Retreat and melting of ice sheets, caps and glaciers will increase the amount, transport and deposition of suspended particulate matter and sediments into coastal surface waters (Monien et al. Reference Monien, Monien, Brünjes, Widmer, Kappenberg and Busso2017). Increases in ice-sheet meltwater adjacent to the Vestfold Hills may heavily impact Long Fjord (Zvezda drainage system) and Ellis Fjord (Druzhby drainage system), which are the main pathways for ice-sheet meltwater into the sea (Tierney Reference Tierney1975, Adamson & Pickard Reference Adamson, Pickard and Pickard1986, Gore & Pickard Reference Gore and Pickard1998). Glacial and ice-sheet melt may also cause coastal flooding, as has been observed in McMurdo Sound, where 50 cm of sedimentation on the nearshore seabed was attributed to a single event (Dayton et al. Reference Dayton, Hammerstrom, Jarrell, Kim, Nordhausen, Osborne and Thrush2016). Increased meltwater input may also freshen and stratify coastal waters (Stark et al. Reference Stark, Raymond, Deppeler, Morrison and Sheppard2019). Ice-sheet retreat and deglaciation will also increase the area of ice-free coastal habitats and expose new areas of unconsolidated sediment available for transport (Stringer et al. Reference Stringer, Boyle, Hrbáček, Láska, Nedělčev and Kavan2024), rock and coast, creating new habitats.
Examples of modifications of the local landscape that can result in changes to fluvial and sedimentation processes. a. Roads and snow accumulation with meltwater around Davis Station buildings. b. Large piles of snow removed from roads, with sediment included, melting at the top of an embankment above the shoreline in the foreground (photographs: J.S. Stark).

Human impacts
A range of human activities have the potential to affect coastal processes in the Vestfold Hills and other ice-free coastal areas and change the local coastal environment. The presence of Antarctic stations, such as Davis Station in the Vestfold Hills, is the main driver of local impacts (e.g. Stark et al. Reference Stark, Mohammad, McMinn and Ingels2020). The establishment of stations involves earthworks, ground levelling and the construction of roads and buildings, all of which permanently alter the local landscape. It has been estimated that the footprint of just buildings in ice-free areas in Antarctica is > 390 000 m2, with an additional disturbance footprint of > 5 200 000 m2 on ice-free land (Brooks et al. Reference Brooks, Jabour, van den Hoff and Bergstrom2019). The building footprint at Davis Station is 10 735 m2, but the total disturbance footprint in the Vestfold Hills is almost 13 times this (Brooks et al. Reference Brooks, Jabour, van den Hoff and Bergstrom2019). Buildings can change patterns of snow deposition, resulting in snow accumulation in areas where it would not normally occur. An extreme example of this is the abandoned Wilkes Station in the Windmill Islands, which was originally situated on an ice-free peninsula but experienced rapid snow accumulation around its buildings, resulting in the eventual abandonment of the station, which now is buried under snow, firn and ice. The management of snow accumulation at Davis Station is achieved using large earth-moving machinery, including excavators and bulldozers. Snow is removed from around buildings and roads to maintain access and is usually deposited in piles in nearby convenient locations. In summer, these often sediment-laden snow piles melt and create runoff streams in the vicinity of the station, which could increase fluvial transport of sediments to the coast (Fig. 16) and increase the transport of contaminants (particularly hydrocarbons and metals) associated with human activities into nearshore marine environments (Stark et al. Reference Stark, Johnstone, King, Raymond, Rutter, Stark and Townsend2023). The development and use of roads around stations such as Davis Station also has the potential to alter aeolian and fluvial sediment transport in coastal areas. Dust is generated by vehicle traffic and regular road maintenance. Many stations, including Davis Station, have wharves and boat-launching ramps built directly on the coast-water interface. The construction of wharves and rock groynes or barriers can alter hydrodynamic processes and sediment transport, resulting in erosion or accretion of sediment on shorelines. Boating and shipping activities can increase the resuspension of sediments through propeller wash and anchor drag. Further research is needed to understand the impacts of Antarctic stations on the processes that govern coastal landscapes and associated ecosystems.
Conclusions
Antarctic coastal regions free of glacial ice are dynamic and varied environments that contain rare and important habitats. In the Vestfold Hills, climate plays a fundamental role in driving key processes, including sediment transport (aeolian and fluvial), sea-ice cover and snow and ice accumulation, which modify the geomorphological features of the coastal landscape. Antarctic coasts are at the intersection of the environmental changes occurring on land, the ice sheet, glaciers and the ocean. As such, they may experience rapid change in coming years, as has been documented on the Antarctic Peninsula (Siegert et al. Reference Siegert, Atkinson, Banwell, Brandon, Convey and Davies2019). The presence of human-occupied stations also has the potential to permanently alter these landscapes and ultimately impact local ecosystems. Data on sediment transport, fluvial flows and local oceanography in the Vestfold Hills remain sparse, as is the case for much of coastal Antarctica. These processes, however, are likely to be very important in coastal areas. Improved understanding of coastal processes in Antarctica will help inform the management of coastal areas, including area protection and human impacts, and allow for more accurate predictions of future impacts from climate change for coastal Antarctica. Sites such as the Vestfold Hills, with permanently occupied research stations and existing baseline data on many coastal variables, are ideal candidates for the long-term monitoring of coastal processes, human impacts and climate change impacts, and they could also act as indicators of similar effects in other Antarctic coastal areas.
Supplementary material
To view supplementary material for this article, please visit http://doi.org/10.1017/S0954102025100345.
Acknowledgements
We thank the Davis Station leaders and support staff 2010, 2016–2022, DAP project teams and Melissa Wrohan.
Author contributions
JSS, BF, ADF, PH, GJJ and RAM were responsible for the conception and design of this study, and all authors were involved in field observations, data collection and analysis, interpretation of the findings and drafting and revising the article.
Financial support
This project was funded by the Australian Antarctic Division (Projects 5097 and AAS 4633). PH acknowledges support from the Australian Government as part of the Antarctic Science Collaboration Initiative programme (project ID ASCI000002). PH also acknowledges support from the Australian Antarctic Science Program (AAS4496, AAS4506, AAS4625) and grant funding from the International Space Science Institute (Switzerland; Project 405). ADF is supported by the Australian Research Council, through grants FT230100234, LP170101090, LE220100103 and DP240100325. ADF acknowledges the generous support of the Harris Charitable Trust through the Antarctic Science Foundation. For RM, this project contributes to the Australian Government’s Australian Antarctic Program Partnership (Project Number ASCI000002) and the Australian Research Council Special Research Initiative the Australian Centre for Excellence in Antarctic Science (Project Number SR200100008). RM also acknowledges support from the Australian Antarctic Science Program (AAS4116).
Competing interests
The authors declare none.


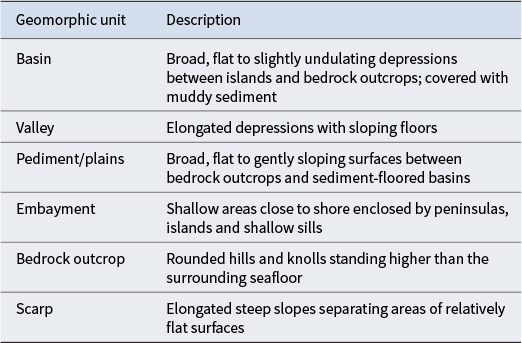


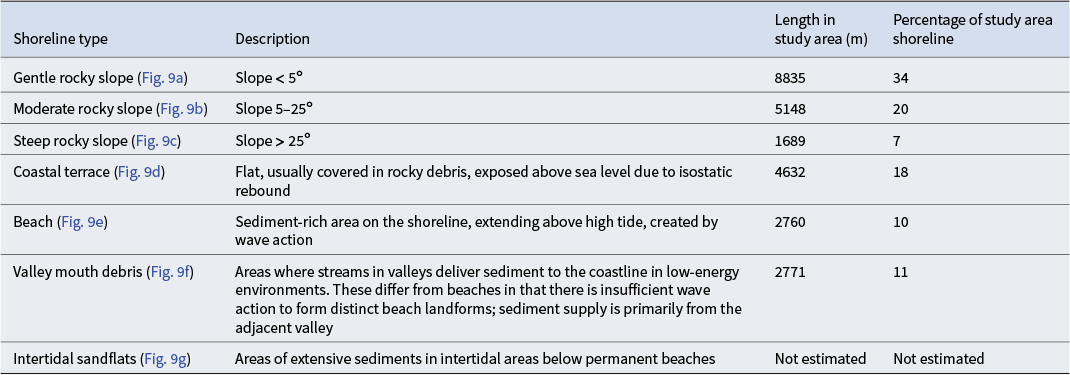

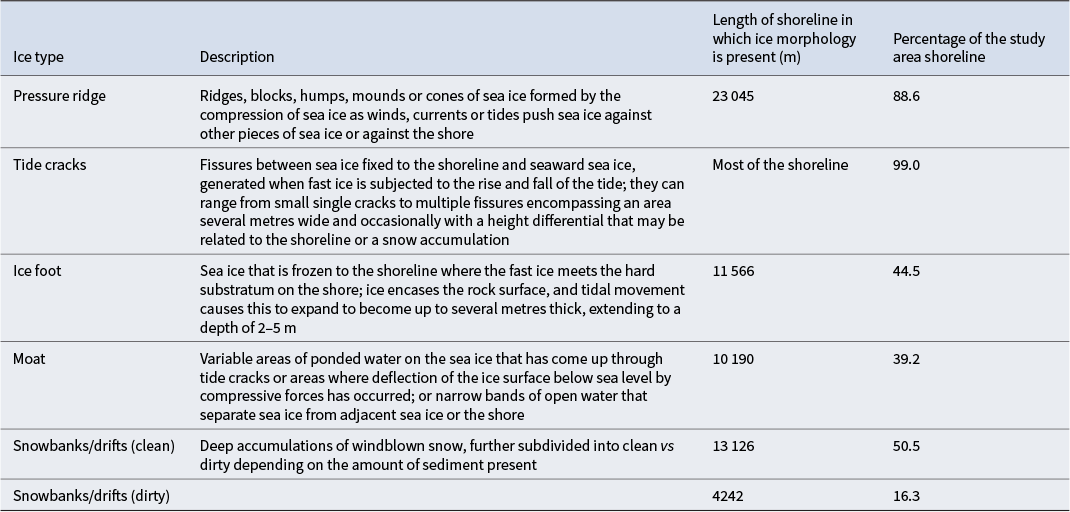
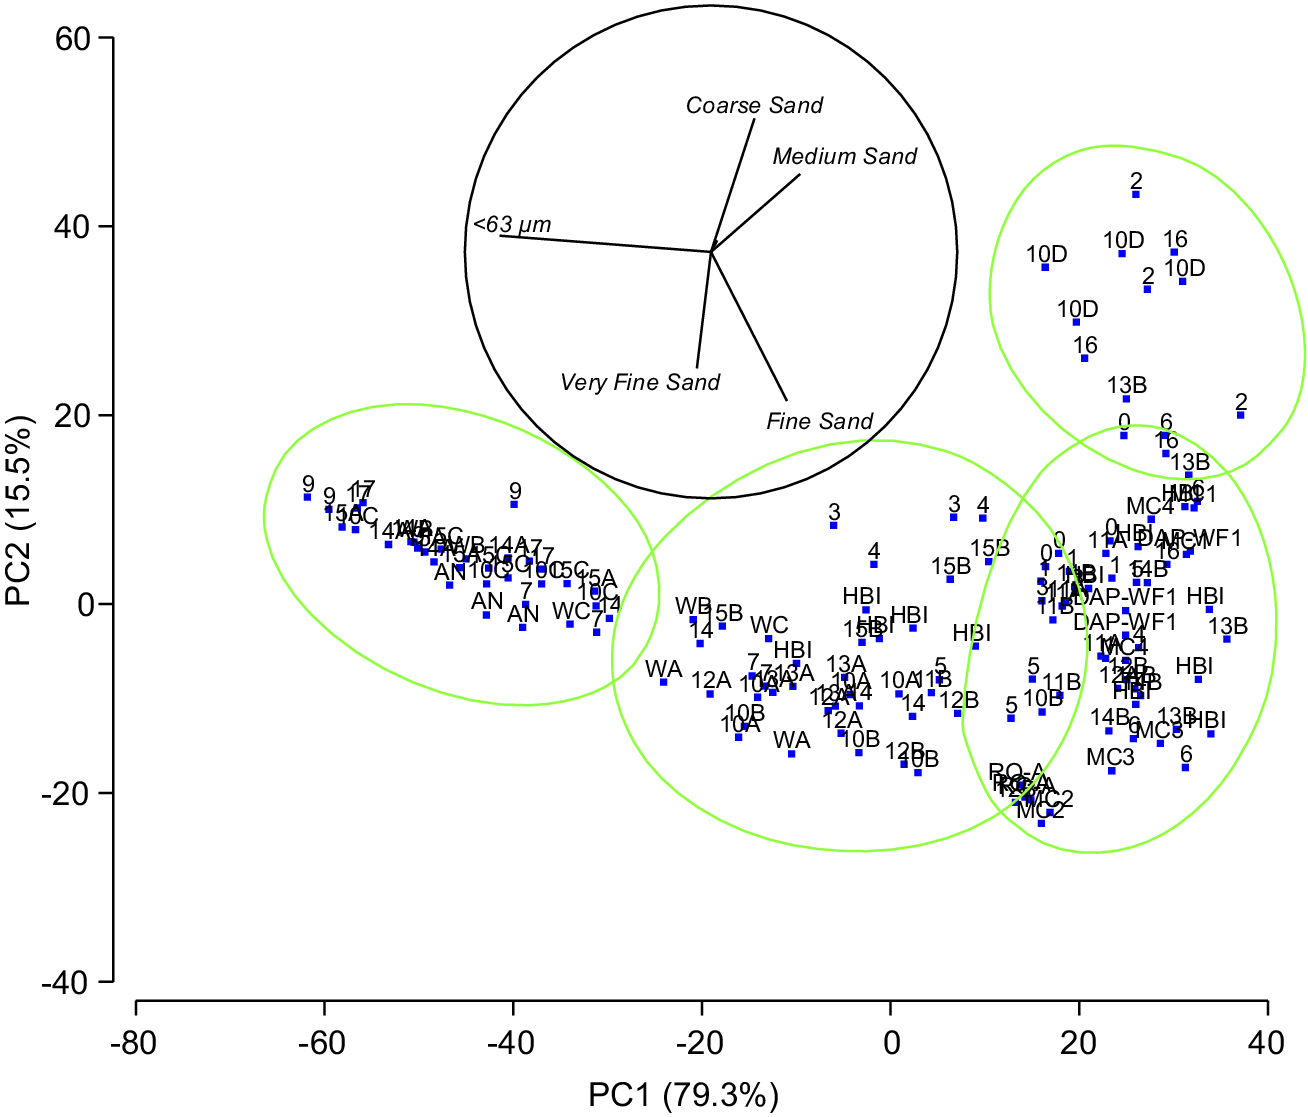

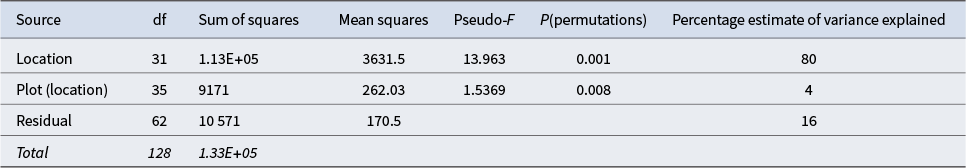
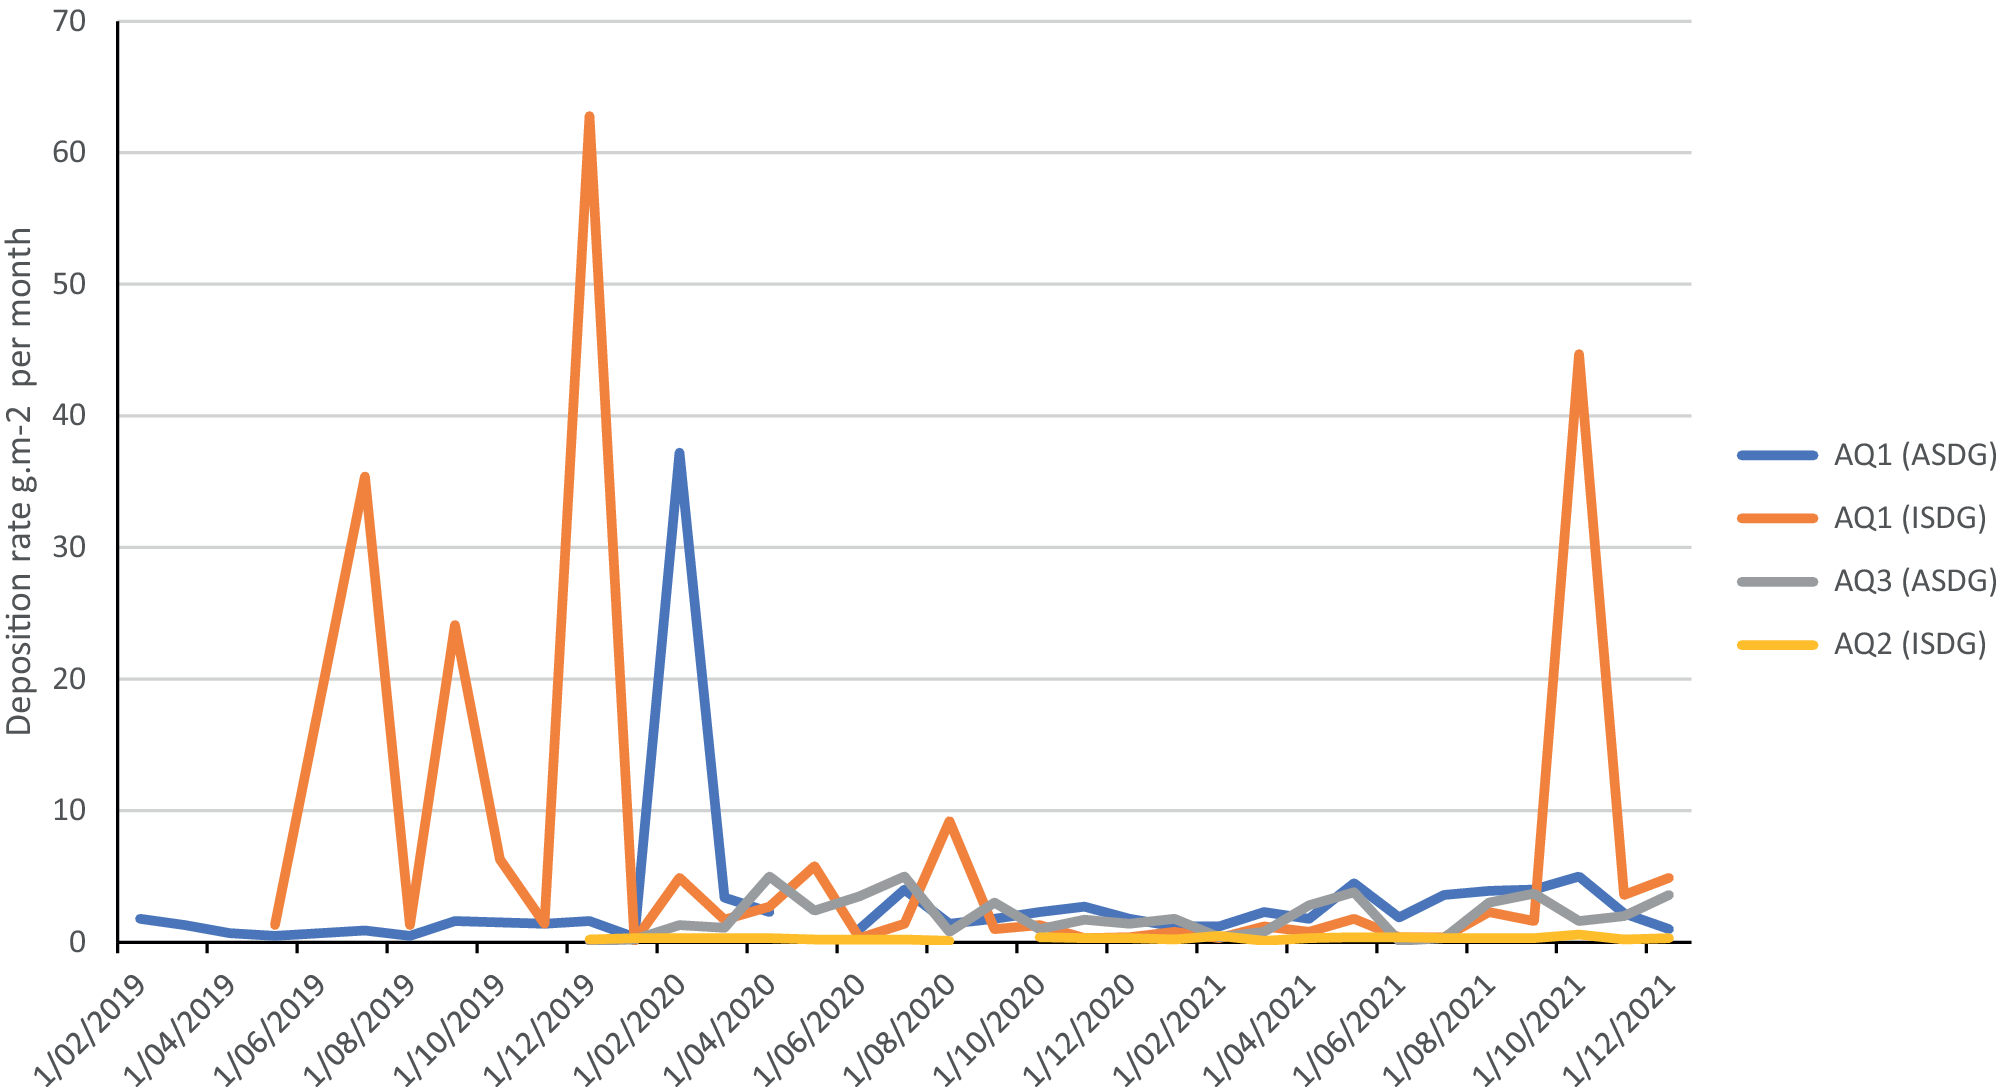


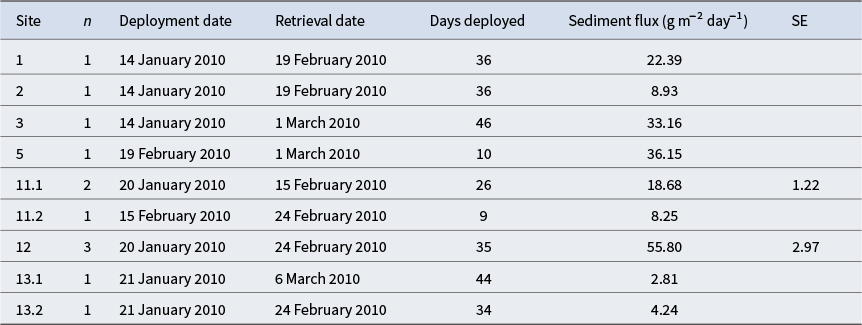


 Open access