

Introduction
The world’s mountain glaciers act as water reservoirs, influencing the climate and water regime around the Earth (Reference Babkin, Klige, Shiklomanov and RoddaBabkin and Klige, 2003). Water from glaciers contributes to sea-level changes (Reference MeierMeier, 1984; Reference Warrick, Oerlemans., Houghton, Jenkins and EphraumsWarrick and Oerlemans, 1990; Reference Church and HoughtonChurch and others, 2001; Reference Braithwaite and RaperBraithwaite and Raper, 2002), and glaciers in arid inland areas serve as important water reservoirs (Reference Fountain and TangbornFountain and Tangborn, 1985; Reference Liu, Sun, Shen and LiLiu and others, 2003).
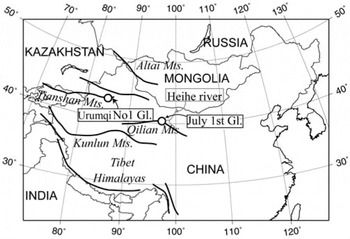
The Qilian Shan are located on the northern fringe of the Tibetan Plateau. These mountains have a total of 2815 glaciers, occupying about 1930 km2 (Reference Tsvetkov, Osipova, Zichu, Zhongtai, Ageta, Baast, Haeberli, Hoelzle and SuterTsvetkova and others, 1998). This area has relatively high precipitation (>300 mm a–1) at high elevations (Reference Ding and KangDing and Kang, 1985; Reference Zhu and WangZhu and Wang, 1996), but little precipitation (<50mma–1) downstream along the Heihe river (Reference Wang and ChengWang and Cheng, 1999) shown in Figure 1. Thus, people living in this area are confined to several oasis cities at the foot of the Qilian Shan, with the Gobi Desert extending downstream of these cities. Since ancient times, meltwater from glaciers and snow on these mountains has provided city dwellers with drinking water and irrigation. Therefore, mountain snow and glaciers are important water resources in this area (Reference Wang and ChengWang and Cheng, 1999). Similar oasis cities came into existence along the Silk Road, where European and Asian cultures met, so water from the Qilian Shan has long supported East– West cultural exchanges.
Location of July 1st glacier in the Qilian Shan, and UG1 in the Tien Shan. Gray line shows Heihe river, which flows from the Qilian Shan. Thick lines represent mountain ranges; thin lines indicate international borders.
July 1st glacier, Qilian Shan, is located in inland China, so its thermal regime is of polar type (Reference Braithwaite and RaperHuang, 1990), with low ice temperature (–6°C in August in the 1970s; Reference Xie, Wu, Wang and WangXie and others, 1985a). Some of the meltwater refreezes in the snow layer, and it is necessary to take this surface refreezing into account in order to estimate the mass balance of such glaciers (Reference Fujita, Seko, Ageta, Jianchen and TandongFujita and others, 1996; Reference Fujita and AgetaFujita and Ageta, 2000).
Glaciers fluctuate with climate change, and the relation between the two has been studied by many researchers (e.g. Reference PeltoPelto, 1987; Reference Braithwaite and ZhangBraithwaite and Zhang, 1999). The mass of some glaciers (mainly in Scandinavia) has increased in recent years because of high precipitation and cool summers (Reference Haeberli, Hoelzle and SuterHaeberli and others, 1998), while many other glaciers have shrunk (Reference Haeberli, Hoelzle and SuterHaeberli and others, 1998). Kamchatka glaciers have shrunk since precipitation has declined (Reference YamaguchiYamaguchi, 2003), and the glaciers in central Asia are shrinking due to both increasing temperature and decreasing precipitation (Reference Khromova, Dyurgerov and BarryKhromova and others, 2003).
E. Kang and others (unpublished information) forecast the runoff from the Qilian Shan area up to 2040 under the assumption of increasing temperature. Reference Liu, Sun, Shen and LiLiu and others (2003) estimated the glacier runoff from the Little Ice Age to 1990. However, their estimates were based on glacier fluctuations only until the 1990s, without the benefit of more recent data.
The aims of this study are (i) to summarize glacier fluctuations from data gathered over the past 50years, (ii) to elucidate quantitatively the relation between climate change and glacier fluctuation, and (iii) to evaluate variations in meltwater discharge from July 1st glacier.
Location and Past Records
A survey of the glacier boundary and surface elevation was carried out on July 1st (‘Qiyi’ in Chinese) glacier (39º15′ N, 97º45′ E;4295–5088ma.s.l.;Fig. 1). Figure 2 shows a photograph taken from downstream of the glacier, which is located on the northern slope of the Qilian Shan with its terminus facing north.
Photograph of July 1st glacier taken in September 2003.

A map of the glacier with contour intervals of 50m (Reference Xie, Wu and WangXie and others, 1985b) was made in 1975 from photographic survey data. It also includes the end-moraine area. Comparison of the 1975 map with the 1956 map (Reference Xie, Wu and WangXie and others, 1985b) shows that the average retreat rate of the terminus was about 2ma–1 from 1956 to 1975, and that the total glacier area has decreased by 0.024 km2 since 1956.
Reference Liu, Song and JinLiu and others (1992) conducted a re-survey of the ablation area in 1985, reporting that the terminus had retreated at a rate of about 1 m a–1, and that the glacial area had decreased by 0.0047 km2 since 1975. Over this decade, the glacier’s surface elevation decreased at altitudes below 4500 m, yet increased by an average of 8m at altitudes of 4580–4620 m.
Reference DyurgerovDyurgerov (2002) showed that the equilibrium-line altitude was at 4550–4710m in the mid-1970s and 1980s. There are also surface velocity data from 1976 to 1977 (Reference Sun and HuangSun and Huang, 1985) and from 1984 to 1985 (Reference Song, Liu and JinSong and others, 1992) for the lower portion of the glacier (up to 4850 m a.s.l.). In 1977, Su measured the glacial ice thickness up to 4850 m a.s.l. using the gravitational method (Reference SuSu, 1985).
Observations
The 2002 survey was carried out by global positioning system (GPS;AmTechs Co., Ltd) to a horizontal and vertical accuracy of better than 10 mm. Unfortunately, the control points established in 1975 and 1985 were not found in 2002. The ridge on the left side of the moraine had a distinct shape represented in the 1975 map made by Reference Xie, Wu and WangXie and others (1985b). This was therefore remeasured by GPS in 2002, and its shape matched that in the 1975 map, indicating that the ridge had not changed significantly since 1975. The difference between the relative heights of each control point in 2002 and 1975 was <10 m. Stake surveys were carried out in September 2003 and September 2004, and the surface velocity distribution was obtained over the 1 year period.
The relative height of the moraine was measured by GPS in 2004 to compare with that surveyed in 1975. The difference was <1 m, confirming that the moraine height had hardly changed since 1975.
Results
Horizontal shrinkage
The retreat of the glacier boundaries in 1956, 1975, 1985 and 2002 is summarized in Figure 3. The glacier boundary in 1956 and the glacier surface elevation in 1975 (including that of a glacier located to the east of July 1st glacier) were reported by Reference Shi, Huang and RenShi and others (1988). The glacier boundary in 1985 was reported by Reference Liu, Song and JinLiu and others (1992). It is clear from Figure 3 that the glacier retreated between 1956 and 2002. Reference Xie, Wu and WangXie and others (1985b) and Reference Liu, Song and JinLiu and others (1992) concluded that the average retreat rate of the glacier terminus was about 2 m a–1 from 1956 to 1975, and about 1 m a–1 from 1975 to 1985. Based on our observations, we determined an average retreat rate of the terminus of 1.1 m a–1 from 1985 to 2002. The retreat rate was very rapid from 1956 to 1975 and has decreased and remained almost constant since then.
Boundaries of July 1st glacier in 1956, 1975, 1985 and 2002. Note the glacier on the east side of July 1st glacier, which shows only the data as of 1975. Contours at intervals of 50m represent those surveyed in 1975. Surface lowering was surveyed by GPS along the approximate flowline L in 2002. The + mark indicates the control points for the survey conducted in 2002.

Changes in glacier area since 1956 are summarized in Figure 4. The area in 2002 had decreased by 5% since 1956 (46 years), and by 4% since 1985 (17 years). Although there is evidence for a decrease in the shrinkage rate between 1975 and 1985, the long-term shrinkage rate has accelerated over the last 17 years and is currently at its highest since 1956.
Areal changes in July 1st glacier, 1956–2002, and cumulative net mass balances since 1975 of July 1st glacier and UG1. Cumulative net mass balance at UG1 is plotted with the value in 1975 set to zero.

Surface lowering
Since our measurements show that the height of the end moraine (relative height between confluence of the river (point C) and point S in Fig. 3) has not changed since 1975, point S at the glacier terminus was chosen as a control point. Longitudinal surface profiles in 1975, 1985 and 2002, along the approximate flowline L in Figure 3, are shown in Figure 5. Glacier thinning has mainly occurred near the terminus, reaching a maximum of 40m since 1975. No surface elevation data higher than 4650 ma.s.l. were available in 1985. However, surface lowering from 1975 to 1985 can be assumed to be zero, and in the upper area (above 4700 m a.s.l.) there was virtually no change from 1975 to 2002. Measured surface lowering was greater at 4300–4400 m a.s.l. than at 4400–4450 m a.s.l.
Longitudinal cross-sections of July 1st glacier surface profiles in 1975, 1985 and 2002. No surface elevation data from higher than 4650ma.s.l. were available in 1985. Horizontal distance 0 was set at the terminus in 1975, located at site S in Figure 3.

The average surface lowering rates of the glacier area were 0.06 m a–1 for 1975–85, and 0.38 m a–1 for 1985–2002, assuming the surface lowering rate along line L was uniform at each elevation, and that no surface elevation change occurred above 4850 m a.s.l. from 1975 to 2002. Thus, the surface lowering rate has accelerated over the past 17 years, and volumes lost from the glacier (deduced from the surface lowering and area change) were 1.5 × 10⁶m3 for 1975–85, and 16.9 × 10⁶ m3 for 1985–2002.
The glacier area shrinkage rate decreased once between 1975 and 1985, as shown in Figure 4, consistent with the relatively low surface lowering rate in those years.
Ürümqi glacier No. 1 (UG1), located in the east Tien Shan, northwest China (43º05′ N, 86º49′ E), about 1000 km west of July 1st glacier (Fig. 1), is the only glacier in China that has been monitored continuously since the 1950s. Figure 4 shows the cumulative net mass balance since 1975 of July 1st glacier and UG1. The mass balance, in water equivalent, of July 1st glacier (1956–75, 1975–85 and 1985– 2002) was deduced assuming an ice density of 900 kgm–3. Mass-balance data for July 1st glacier in 1975 and 1985 from Reference DyurgerovDyurgerov (2002) have also been included, based on the surface lowering data for those two years. The mass balances started to decrease toward the end of the 1970s.
Discussion
Surface lowering
The surface elevation change (L) of a portion of the glacier is calculated using the emergence velocity (E) and mass balance (B) of the glacier,
The mass balance is evaluated using the accumulation (S) and ablation (M) on the glacier,
Units of all elements are in m a–1.
Average surface-elevation changes up to 1100 m from the terminus for the periods 1975–85 and 1986–2002 are shown in Table 1. We can evaluate the climate-change impact on the glacier mass balance by distinguishing the redistribution of the glacier ice caused by glacier dynamics from the surface elevation change.
Average surface elevation change, emergence velocity, accumulation, precipitation and surface melt rate (all in ma–1) at the lower part of the glacier, 1975–85 and 1986–2002. Differences between the periods are also shown

Emergence velocity
The ice velocity averaged over the depth (h) is taken to be 80% of the surface velocity (u s) by assuming that the ice flow is laminar, that there is no basal motion (consistent with the glacier being of the polar type) and that the empirical constant (n) in Glen’s law is 3 (Reference PatersonPaterson, 1994). The ice flux from the upper part of the glacier through a cross-section can then be calculated as

where Q is ice flux through a cross-section and w is glacier width at a cross-section.
The glacier depth distribution was measured by Su in 1977 (Reference SuSu, 1985). The cross-section of the glacier in 2002 can be estimated assuming the bottom shape of the glacier had not changed and the surface lowering was uniform at the cross-section. The average emergence velocity of the lower part of the glacier can then be calculated as
where v is average emergence velocity over the lower part of the glacier, and S i is the surface area of the lower part of the glacier.
The ice flux from the upper part of the glacier at the crosssection 1100m from the glacier terminus can then be calculated from Equations (1) and (2) using the observed surface velocity and cross-section. The lower part of Figure 6 shows the variation in the average emergence velocity. This figure indicates that the ice flux from the upper to the lower part of the glacier has decreased, and that a relatively large reduction of the emergence velocity had occurred between 1975 and 1985. Accordingly, the average emergence velocity from 1975 to 1985 was 0.43 ma–1, and that from 1986 to 2002 was 0.32 ma–1, as shown in Table 1. Thus a decrease in emergence velocity of 0.11 ma–1 would be expected to cause thinning of the ice.
Fluctuation in average emergence velocity from the terminus to 1100 m from the terminus.

Glacier mass balance
Air-temperature and precipitation data from the US National Climatic Data Center (NCDC) since 1955 were analyzed to clarify the cause of the mass-balance variations described above. The stations selected were limited to those near July 1st glacier (35–40º N, 94–104º E). Unfortunately, there were no NCDC air-temperature data available for certain years, including the period 1991–93. Therefore, air-temperature data since 1975 from the US National Centers for Environmental Prediction/US National Center for Atmospheric Research (NCEP/NCAR), produced by the US National Weather Service, were also analyzed.
On Asian glaciers, ablation and accumulation occur simultaneously during the summer monsoon period. The glacier mass balance is therefore particularly sensitive to summer meteorological conditions. Accordingly, meteorological data from June to September (summer) were analyzed. Summer air-temperature and precipitation data at each station were averaged for the periods 1955–74, 1975–84 and 1985–2002. The differences from the 1955–74 average value are shown in Figure 7. Summer temperature from 1955–1974 to 1975–1984 decreased slightly, whereas from 1975–84 to 1985–2002 it increased sharply at all sites. Summer precipitation decreased at only one station between 1955–74 and 1975–85, while all sites showed large increases over the total study period.
Increasing values of summer (June–September) temperature (a) and precipitation (b), averaged over the periods 1975–85 and 1986–2002, since 1955–74. NCEP/NCAR temperature data were used in the analysis after 1975.

Precipitation is in the form of snow (solid) or rain (liquid), depending on the air temperature during summer in this high Asian region. Thus, solid precipitation can be calculated from air-temperature and precipitation data. The relation between the solid precipitation ratio and air temperature was established by Reference Ding and KangDing and Kang (1985), who reported that 100% of solid precipitation occurs below 0ºC, and 50% at 3.5ºC, with all precipitation becoming liquid at 7ºC. Precipitation data from Wushaoling (3040m a.s.l.) were analyzed to estimate the precipitation at July 1st glacier (the annual precipitation at Wushaoling is on the same order as that observed at July 1st glacier from 2002 to 2004, and the altitude is similar to that of July 1st glacier). Monthly precipitation values at July 1st glacier were 72% of those at Wushaoling from 2002 to 2004. Thus, monthly precipitation data at July 1st glacier were estimated based on the above relation, assuming that the altitudinal distribution of precipitation was constant on the glacier.
Temperature data at July 1st glacier were estimated from the temperature data at 500 hPa altitude (NCEP/NCAR), assuming a temperature lapse rate of–0.82ºC(100 mГ1. The temperature lapse rate was deduced from the averaged temperature lapse rate between the observed air temperature at July 1st glacier at 4295 m a.s.l. and the temperature data at 500 hPa with geopotential height from 2002 to 2004.
Solid precipitation was calculated from the monthly precipitation data estimated from Wushaoling and the NCEP/NCAR re-analyzed temperature data at intervals of 100 m altitude. Moreover, precipitation has been averaged for the entire lower portion of the glacier area. Our results show that the average annual precipitation has increased by 0.01 ma–1 from 1975/85 to 1986/2002, while the solid precipitation has changed <1 mm a–1 due to the increasing temperature indicated in Figure 7.
Surface elevation change, emergence velocity and accumulation are also summarized in Table 1. The surface melt rate can then be evaluated from Equations (1) and (2) using emergence velocity, snow accumulation and surface elevation change. Results of this analysis indicate that mean snow accumulation has been almost constant since 1975, while the melt rate has increased by 0.42 ma–1 from 1975–85 to 1986–2002. Therefore, increased melt rate is considered to underlie the recent accelerated glacier surface lowering of July 1st glacier.
The 1975–85 average melt rate was 1.08 ma–1, and the positive cumulative temperature at 4400 m a.s.l. (the middle altitude of the lower part of the glacier) was 248 degree-days, obtained from the re-analyzed temperature data. Therefore, the degree-day factor was 4.4 mm °C–1 d–1 over this period. On the other hand, the positive cumulative temperature at 4400 m a.s.l. was 301 degree-days from 1986 to 2002. Therefore, the melt rate can be calculated as 1.32 m a–1 from the degree-day factor of 4.4 mm °C–1 d–1 and the positive cumulative temperature of 301 degree-days. This is similar to the measured melt rate, which was 1.50ma–1 over this period. Thus, it can be quantitatively clarified that the recent melt rate has accelerated as a result of the increasing temperature.
Reference CaoCao (1998) indicated that three glaciers in the Tien Shan, which are west of the Qilian Shan, shrank abruptly in the mid-1970s. This was attributed to a summer temperature rise, which caused an increase in melt rate and a decrease in annual snowfall. In the Qilian Shan, there was a melt-rate increase but not a snowfall decrease.
Discharge from the glacier basin (3.8 km2) including the glacier (shown in Fig. 3) can be calculated from the change in glacier area, total surface lowering and total precipitation, assuming that the altitudinal distribution of the precipitation remains constant. Figure 8 shows the net surface lowering and net precipitation in the basin from 1975 to 1985 and from 1986 to 2002, the combination of which represents discharges; the figure indicates that surface lowering has increased dramatically in recent decades. Average discharges from the basin during the periods 1975–85 and 1986–2002 were 0.45 and 0.68 ma–1, respectively. Therefore, the total discharge from the glacier has increased about 50% between the two periods, largely as a result of glacier shrinkage.
Average runoff from July 1st glacier, 1975–85 and 1986– 2002. Elements of the runoff (surface lowering and precipitation) are also shown.

Conclusion
July 1st glacier decreased in area by 5% from 1956 to 2002 and by 4% from 1985 to 2002. The surface lowering rates of the glacier surface were 0.06 ma–1 for 1975–85, and 0.38 ma–1 for 1985–2002. Thus, the glacier shrinkage rate has accelerated over the past 17 years. Such acceleration can be attributed to the temperature increase, based on our analysis of meteorological data.
Surface-elevation changes result from changes in emergence velocity, accumulation and surface melting. The contributions of these elements to surface lowering have been evaluated over the lower part of July 1st glacier, where the lowering was most pronounced. Emergence velocities were calculated from our observations of surface velocity, ice thickness and glacier width. Accumulation (solid precipitation) was calculated from precipitation data near the glacier and re-analyzed NCEP/NCAR temperature data. The surface melt rate was obtained from the residual value of the surface elevation changes, emergence velocity and accumulation. Evaluation of the relation between climate change and mass balance indicated that changes in the accumulation rate and melt rate between the periods 1975–85 and 1986–2002 were +0.01 and +0.4 m a–1, respectively. The increasing surface melt rate, therefore, was the major cause of the recent acceleration in glacier shrinkage. Furthermore, the melting rates for the two periods estimated by the degree-day method coincided with the evaluated melt rate derived from emergence velocity, accumulation and surface lowering, thus confirming that the recent acceleration in glacier shrinkage was caused by increasing temperature. Finally, meltwater discharge from the glacier basin was calculated from surface lowering and precipitation taking into account the glacier area change. Because of glacier shrinkage, calculated discharge from the glacier has increased over the past 17 years by >50% over the average value for the period 1975–85.
Acknowledgements
We thank the members of the Oasis Project (Historical evolution of adaptability to water resource changes in an oasis region) for valuable advice and logistic support in the field. This is a contribution to the Oasis Project, being promoted by the Research Institute for Humanity and Nature (RIHN), which provided financial support in addition to that from the Japanese Government’s Special Coordination Fund for the Promotion of Science and Technology, Grants-in-Aid for scientific research (No. 14209020) and the Sumitomo Foundation. We also thank the Scientific Editor, B. Hubbard, and two anonymous referees whose suggestions greatly improved the paper.


