


Introduction
Soils represent the largest terrestrial carbon (C) reservoir, storing approximately 1,500–2,400 Pg (×1015) C in the top metre worldwide, more than vegetation and the atmosphere combined (Batjes, Reference Batjes2014; Köchy et al., Reference Köchy, Hiederer and Freibauer2015; Smith et al., Reference Smith, Soussana, Angers, Schipper, Chenu, Rasse, Batjes, van Egmond, McNeill, Kuhnert, Arias-Navarro, Olesen, Chirinda, Fornara, Wollenberg, Álvaro-Fuentes, Sanz-Cobena and Klumpp2020). The amount of soil C reflects the balance between inputs – such as plant residues, manure, and organic waste – and losses, primarily through organic matter decomposition (Paustian et al., Reference Paustian, Lehmann, Ogle, Reay, Robertson and Smith2016). Plants are pivotal in this dynamic: through photosynthetic assimilation, C is sequestered into plant biomass and later transferred to soil via above- and belowground litter (de Deyn et al., Reference de Deyn, Cornelissen and Bardgett2008; Janzen et al., Reference Janzen, van Groenigen, Powlson, Schwinghamer and van Groenigen2022). Because relatively small changes in SOC stocks can substantially influence the global C cycle, accurate SOC assessment is essential for both agricultural sustainability and national greenhouse gas (GHG) inventories (Raffeld et al., Reference Raffeld, Bradford, Jackson, Rath, Sanford, Tautges and Oldfield2024).
A key control on soil organic carbon (SOC) storage and stabilization is soil texture, particularly clay and silt content (Haddix et al., Reference Haddix, Gregorich, Helgason, Janzen, Ellert and Francesca Cotrufo2020; Singh et al., Reference Singh, Sarkar, Sarkar, Churchman, Bolan, Mandal, Menon, Purakayastha and Beerling2018). These fine particles offer high surface areas and reactive sites that foster the formation of organo–mineral complexes and aggregate structures – mechanisms that slow microbial decomposition and enhance SOC persistence (Kopittke et al., Reference Kopittke, Dalal, Hoeschen, Li, Menzies and Mueller2020; Lehmann and Kleber, Reference Lehmann and Kleber2015). Consequently, fine-textured soils typically support higher SOC stocks than coarser-textured soils (Hassink, Reference Hassink1997; Huang and Hartemink, Reference Huang and Hartemink2020; Singh et al., Reference Singh, Sarkar, Sarkar, Churchman, Bolan, Mandal, Menon, Purakayastha and Beerling2018). Additionally, improved physical (e.g., lower bulk density, enhanced water retention) and chemical conditions in fine-textured soils promote plant growth and C inputs, as observed in sugarcane (Saccharum officinarum L.) fields of Brazil (Carvalho et al., Reference Carvalho, Menandro, de Castro, Cherubin, Bordonal, Barbosa, Gonzaga, Tenelli, Franco, Kolln and Castioni2019; Satiro et al., Reference Satiro, Cherubin, Safanelli, Lisboa, da Rocha Junior, Cerri and Cerri2017; Tenelli et al., Reference Tenelli, Bordonal, Cherubin, Cerri and Carvalho2021).
Brazil is the world’s leading sugarcane producer, cultivating over 8.8 million hectares and harvesting more than 660 million tons in the 2025/2026 crop year, concentrated mainly in the Center-South region (CONAB, 2025; USDA, 2025). The economic significance of sugarcane extends beyond raw production. It is a major source of export revenue, with Brazil being the world’s largest sugar exporter (Zheng et al., Reference Zheng, dos Santos Luciano, Dong and Yuan2022). The sector also plays a critical role in energy, as Brazil is the second-largest producer of ethanol globally (approximately 35 billion litres in 2023), with sugarcane as the primary feedstock (WBA, 2024), which is considered the most effective option to offset GHG emissions and replace fossil fuels (Bordonal et al., Reference Bordonal, Carvalho, Lal, de Figueiredo, de Oliveira and La Scala2018; Goldemberg, Reference Goldemberg2007; Liu et al., Reference Liu, Kwon, Wang and O’Connor2023). This dual role – food and energy – gives sugarcane a central place in global discussions on renewable energy, GHG mitigation, and C markets (Bordonal et al., Reference de Oliveira Bordonal, Lal, Alves Aguiar, de Figueiredo, Ito Perillo, Adami, Theodor Rudorff and La Scala2015; Follador et al., Reference Follador, Soares-Filho, Philippidis, Davis, de Oliveira and Rajão2021; Rossetto et al., Reference Rossetto, Ramos, de Matos Pires, Xavier, Cantarella and Guimarães de Andrade Landell2022).
Intensive mechanization remains a major challenge for the sustainability of sugarcane agroecosystems. The repeated passage of heavy machinery for tillage, fertilization, and harvesting progressively compacts the soil, especially in inter-row zones where traffic is concentrated (Souza et al., Reference Souza, Souza, Silva, Barbosa and Araújo2014). To mitigate these effects, a controlled traffic farming (CTF) system has been increasingly adopted, restricting machinery movement to designated inter-rows and thereby protecting soil structure and minimizing plant damage in the crop rows (Esteban et al., Reference Esteban, de Souza, da Silva, de Souza Lima, Lovera and de Oliveira2020; Souza et al., Reference Souza, Souza, Cooper and Tormena2015). Nevertheless, this system results in clear spatial stratification within fields: inter-row zones develop higher bulk density (BD), penetration resistance, and reduced porosity, conditions that severely restrict root growth and limit belowground C inputs (da Luz et al., Reference da Luz, Gonzaga, Castioni, de Lima, Carvalho and Cherubin2023; Esteban et al., Reference Esteban, de Souza, da Silva, de Souza Lima, Lovera and de Oliveira2020; Melo et al., Reference Melo, Cherubin, Gomes, Lisboa, Satiro, Cerri and Siqueira-Neto2020; Scarpare et al., Reference Scarpare, de Jong van Lier, de Camargo, Pires, Ruiz-Corrêa, Bezerra, Gava and Dias2019). In contrast, crop rows – typically planted in double lines – maintain more favourable conditions, promoting root activity and biomass production that enhance SOC accumulation (Oliveira et al., Reference Oliveira, Souza, Bolonhezi, Totti, Moraes, Lovera, Lima, Esteban and Oliveira2022).
This management-driven heterogeneity, combined with differences in soil texture, land-use history, and relief, has direct implications for the sampling effort required to accurately estimate SOC stocks (Even et al., Reference Even, Machmuller, Lavallee, Zelikova and Cotrufo2025; Raffeld et al., Reference Raffeld, Bradford, Jackson, Rath, Sanford, Tautges and Oldfield2024; Spertus, Reference Spertus2021). Although several methodologies exist for SOC measurement (Allen et al., Reference Allen, Pringle, Page and Dalal2010; Zhang and Hartemink, Reference Zhang and Hartemink2017), there is still limited guidance on the minimum number of samples required to capture spatial variability in tropical, mechanized sugarcane systems. This issue is not only methodological but also economic: laboratory analysis of SOC via dry combustion is laborious and expensive (Liu et al., Reference Liu, Shen, Chen, Zhao, Biswas, Jia, Shi and Fang2019). Accurate quantification of SOC is increasingly important for climate-oriented certification frameworks. National and international initiatives (e.g., ‘4 per 1000’, FAO’s RECSOIL, and VERRA’s VM0042 standards) demand transparent, traceable Monitoring, Reporting, and Verification (MRV) systems that incorporate soil C (FAO, 2019; Minasny et al., Reference Minasny, Malone, McBratney, Angers, Arrouays, Chambers, Chaplot, Chen, Cheng, Das, Field, Gimona, Hedley, Hong, Mandal, Marchant, Martin, McConkey, Mulder, ORourke, Richer-de-Forges, Odeh, Padarian, Paustian, Pan, Poggio, Savin, Stolbovoy, Stockmann, Sulaeman, Tsui, Vågen, van Wesemael and Winowiecki2017; Verra, 2025).
Precisely because of persistent uncertainties in sampling and quantification, changes in SOC stocks have rarely been accounted for within nature-based solutions frameworks linked to green finance or payments for environmental services (Bordonal et al., Reference Bordonal, Tenelli, da Silva, DMárcio, Cherubin, Mício, Weiler, Campbell, Gonzaga, Barbosa, Cerri and Carvalho2024; Rossetto et al., Reference Rossetto, Ramos, de Matos Pires, Xavier, Cantarella and Guimarães de Andrade Landell2022). Defining an optimal sampling design – one that balances cost, representativeness, and precision – is therefore essential for incorporating SOC into national and global GHG inventories and carbon markets.
Based on this background, we hypothesize that the number of soil samples required to estimate SOC stocks in sugarcane fields is jointly determined by soil texture and the natural stratification created by CTF. We expect clay-rich soils to require fewer samples due to lower variability in BD and SOC, whereas sandy soils demand greater sampling intensity. In addition, we predict that inter-row compaction increases BD variability and reduces carbon inputs relative to rows, creating uneven SOC distribution that further raises sampling requirements. Therefore, the objective of this study was to determine the minimum number of samples needed to estimate BD, C concentration, and SOC stocks (0–100 cm) within different soil texture classes (<20%, 20–55%, >55% clay + silt) while accounting for both texture and row/inter-row stratification, with a maximum error of 20% of the mean and significance level α = 0.10. For this purpose, we analysed soils from 67 sugarcane fields under CTF systems in the south-central region of Brazil and applied statistical approaches, including variance estimators based on bootstrap resampling (Cochran, Reference Cochran1977; Dane et al., Reference Dane, Reed and Hopmans1986; de Gruijter et al., Reference de Gruijter, McBratney, Minasny, Wheeler, Malone and Stockmann2016; Efron and Tibshirani, Reference Efron and Tibshirani1985), to quantify sampling needs and provide statistically robust guidelines for SOC monitoring and carbon certification in tropical sugarcane systems.
Materials and methods
Site description
The study was conducted in 67 commercial sugarcane (Saccharum officinarum L.) (Figure 1) fields managed under CTF systems in the south-central region of Brazil (Figure 1). Sites were chosen through an extensive selection process based on interviews with industry professionals (to ensure representative crop areas) and historical land-use information. The fields varied widely in sugarcane implementation time (from 2 to 39 years since land-use conversion) and in soil texture, ranging from very sandy to very clayey (Soil Survey Staff - NRCS/USDA, 2014). Detailed site information is presented in Figure 1, Supplementary Table S1, and in Mello et al. (Reference Mello, Cerri, Davies, Holbrook, Paustian, Maia, Galdos, Bernoux and Cerri2014).
Sites and states selected for soil sampling in Brazil, respectively: 1–7São Paulo – Ipaussu, Anhembi, Itirapira, Iacanga, Araçatuba, Andradina, and Igarapava; 8–9Minas Gerais – Campo Florido and Araporã; 10Goiás (GO) – Goiatuba.

Soil sampling and analysis
At each site, soil samples were collected from six pits (three sets) within a 100 × 100 m plot (representing approximately 1 ha). Two contrasting field positions were sampled: (i) the row zone, corresponding to the double-line planting strip with minimal machinery traffic, and (ii) the inter-row zone, where machinery traffic is concentrated under CTF (Figure 2). Bulk density (BD) samples were collected using stainless-steel cylinders (5 cm diameter × 5 cm height; volume = 98 cm3), while disturbed samples were collected using a spatula. Samples were taken at six depths: 0–10, 10–20, 20–30, 30–50, 50–70, and 70–100 cm, totalling 36 stratified random samples per site and 2,412 samples across the study region.
Soil sampling schematic in sugarcane fields of south-central Brazil. Each pair of pits (a) covered the sugarcane rows (b) and the inter-row zone (c).

In the laboratory, undisturbed samples were oven-dried at 105°C and weighed to determine soil dry mass. Disturbed soil samples were air-dried, sieved at 2 mm to remove plant residues, and then milled (0.149 mm) for SOC analysis. Soil C concentrations were determined by dry combustion (Nelson and Sommers, Reference Nelson, Sommers, Page and Miller1982) using a LECO® TruSpec® CN-2000 elemental analyser (CN, Michigan, USA; furnace at 1,350°C in pure oxygen).
Soil texture (sand, silt, and clay content) was analysed following EMBRAPA (2017). Forty grams of dry soil were dispersed in 250 mL of a solution of sodium hydroxide (0.1 mol L−1) and sodium hexametaphosphate (0.038 mol L−1) for 16 hours, then washed through a 0.053 mm sieve with distilled water. Sand content was determined as the retained fraction, while silt and clay were quantified using an ASTM 152H hydrometer (Cole-Parmer, Antylia Scientific, Illinois, USA).
Soil bulk density (BD) was calculated by dividing the oven-dry mass of each undisturbed sample by the internal volume of the stainless-steel cylinder (98 cm3) as described by Blake and Hartge (Reference Blake, Hartge and A.1986). Conventional (fixed-depth) SOC stocks were estimated by multiplying the soil C concentration (%), bulk density (g cm−3), and layer thickness (cm) (Bernoux et al., Reference Bernoux, Arrouays, Cerri and Bourennane1998). To ensure comparability between rows and inter-rows, stocks were then expressed on an equivalent soil mass (ESM) basis (Ellert et al., Reference Ellert, Janzen and Entz2002; Ellert and Bettany 1995), using a reference BD of 1.0 g cm−3. The ESM SOC stock was then obtained by multiplying the C concentration (%) by the reference BD (1.0 g cm−3), the equivalent thickness (reference BD/ actual BD x original thickness in cm), and the unit conversion factor (0.1). The procedure follows the principles outlined by Ellert and Bettany (Reference Ellert and Bettany1995), who recommend referencing stocks to a fixed soil mass (e.g., 1,000–4,000 Mg ha−1 depending on depth); our choice of reference BD = 1.0 g cm−3 corresponds to a cumulative soil mass of 3,000 Mg ha−1 for the 0–30 cm layer and 10,000 Mg ha−1 for the 0–100 cm profile.
After determining the SOC for each trench, the dataset was divided into two groups based on sugarcane row and inter-row positions. To understand how SOC stocks could be modified through soil depth, four layers were chosen for comparisons between sugarcane field positions: i) 0–10 cm, ii) 0–30 cm, iii) 0–50 cm, and iv) 0–100 cm. Next, to avoid interferences on SOC and bulk density not related to row positioning (such as clay + silt content), sublevels were created, and the dataset was divided into three categories: a) clay + silt content <20%, b) 20–55%, and c) >55%, separated according to USDA texture classification (Soil Survey Staff - NRCS/USDA, 2014).
Statistical analysis
Comparison between row and inter-row
To compare soil bulk density, C concentration, and SOC stocks among row and inter-row locations and soil layers, the Shapiro–Wilk test was used to assess normality across texture categories. This was followed by a comparison of the means using t (parametric) and Wilcoxon (non-parametric) tests.
Sample size for soil bulk density and C concentration
The sample size was determined assuming the population variance (σ2) is unknown (Bolfarine and Bussab, Reference Bolfarine and Bussab2005) Equation (1): $n={S^{2} \over \left({t_{\alpha /2}}\over{e}\right)^{2}}$
where S 2 is the sample variance, t 2 is the quantile of the Student’s t distribution with n 0 − 1 degree of freedom (n 0 is the sample size of the current study), with a probability α, and e is the maximum acceptable error that we have defined, often referred to as the research precision. In this work, a maximum error of 20% of the mean and a significance level of α = 0.10 were adopted.
Additionally, the Bootstrap method (Efron and Tibshirani, Reference Efron and Tibshirani1985) was used to create 10,000 iterations with replacement from the original dataset. From each resampling, the mean, standard deviation, and sample size were estimated, and 5% and 95% quantiles were calculated. All analyses were conducted in R software v.4.5.1 (R Core Team, 2025)
Results
Bulk density, C concentration, and SOC stocks in row and inter-row zones
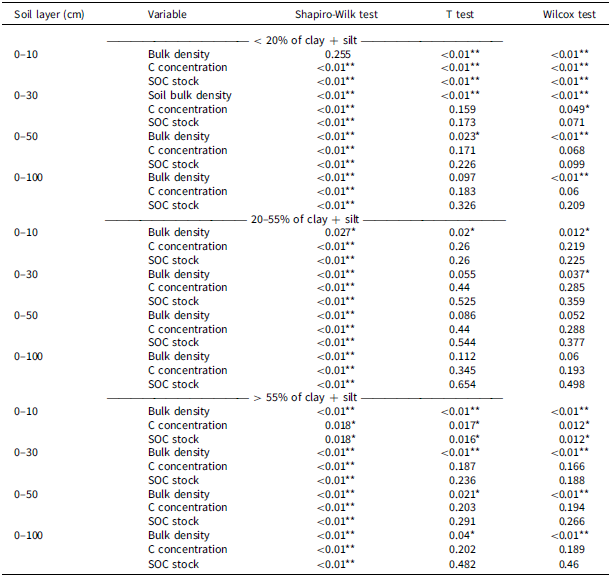
According to the Shapiro–Wilk test, most soil properties within each texture category showed non-normal distributions (Table 1). Both the t-test and the Wilcoxon test detected significant differences in BD, C concentration, and SOC stocks between row and inter-row positions in sugarcane fields from Brazil (Table 1).
The p-values obtained in the Shapiro-Wilk, t, and Wilcoxon tests for bulk density (g cm−3), C concentration (%), and SOC stocks (Mg ha−1) considering different soil layers and clay + silt contents

*Significant at p < 0.1; **Significant at p < 0.01.
The 0–10 cm layer was the most sensitive to management effects (Table 1, Supplementary Table S2). In this depth, soils with <20% and >55% clay + silt showed significant differences (p < 0.01): inter-row BD was 11–16% higher, while C concentration and SOC stocks were 8–16% lower than in rows. In soils with 20–55% clay + silt, only BD differed significantly between positions (11% higher in the inter-row, p < 0.05).
Deeper layers (0–30 and 0–50 cm) showed similar patterns across texture classes (Table 1, Supplementary Table S2). In soils with <20% clay + silt, inter-row BD was 9% higher at 0–30 cm and 7% higher at 0–50 cm compared to rows (p < 0.05). In soils with >55% clay + silt, inter-row BD increased by 10% and 8.5% at 0–30 cm and 0–50 cm, respectively (p < 0.05). Significant differences in C concentration (20–55% clay + silt) and BD (<20% clay + silt) at 0–30 cm were detected only by the Wilcoxon test (p < 0.05), with inter-rows showing 11% lower C concentration and 9.3% higher BD. No significant differences were observed at depths of 0–50 cm in soils with 20–55% clay + silt (p > 0.05).
At the profile scale (0–100 cm), BD remained more responsive to management in soils with <20% and >55% clay + silt (Table 1). In sandy soils (<20% clay + silt), inter-row BD averaged 1.40 g cm−3 compared to 1.32 g cm−3 in rows (p < 0.01, Wilcoxon test). In clayey soils (>55% clay + silt), inter-row BD was 1.22 g cm−3 versus 1.14 g cm−3 in rows (p < 0.05; Supplementary Table S2). No significant differences were detected in soils with 20–55% clay + silt at depths of 0–100 cm.
Bulk density, C concentration, and SOC stocks sampling size
Sample size obtained from Equation (1), and bootstrap resampling were closely aligned, with clay + silt content strongly influencing the required number of samples for BD, C concentration, and SOC stocks in the 0–30 cm layer (Table 2; Figure 3). Across all variables, soils with 20–55% clay + silt required the largest sample sizes, while soils with>55% clay + silt required the fewest. Variability in sample size estimates was also greatest in intermediate-textured soils and lowest in clayey soils (Figure 3).
Quantile intervals and estimated sample size for bulk density (g cm−3 – A), C concentration (% – B), and SOC stocks (Mg ha−1 – C) across clay + silt categories (<20%, 20–55%, >55%) using the bootstrap method with 10,000 resampling, a maximum error of 20% and significance level of α = 0.10.

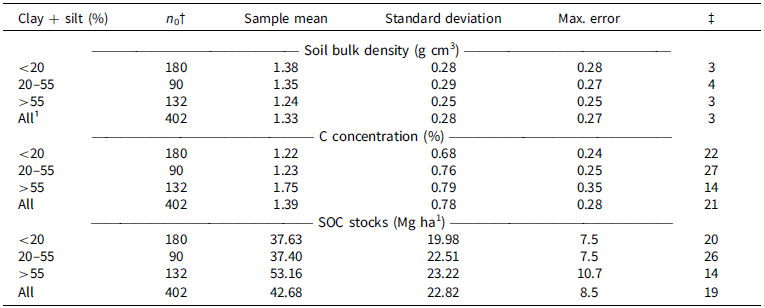
Estimated sample size for each soil parameter and clay + silt category for the 0–30 soil layer, according to Bolfarine and Bussad (Reference Bolfarine and Bussab2005)

†Number of samples for each category; ‡Estimated number of samples; 1all categories of clay and silt combined.
Mean BD across all sites was 1.33 ± 0.28 g cm−3, ranging from 1.38 ± 0.28 g cm−3 in sandy soils (<20% clay + silt) to 1.24 ± 0.25 g cm−3 in clayey soils (>55% clay + silt) (Table 2, Supplementary Table S2). The maximum mean error for BD was 0.27 across texture classes. Overall, the estimated sample size for BD was three samples in both methods, increasing to four in soils with 20–55% clay + silt (Table 2, Figure 3, Supplementary Figure S1).
Soil C concentration and SOC stocks showed similar responses to texture (Table 2, Supplementary Table S2). Mean C concentration and SOC stocks were 1.39 ± 0.78% and 42.68 ± 22.82 Mg ha−1, respectively. In soils with <20% and 20–55% clay + silt, C concentration and SOC stocks were approximately 42% lower than in soils with >55% clay + silt. Conversely, the maximum mean error was about 42% higher in soil with >55% of clay + silt. Estimated sample sizes were similar across methods: for C concentration, 14 in soil with >55%, 22 in soil with <20%, and 27 with 20–55% of clay + silt for C concentration, and 14 to 20 and 26 for SOC stocks, respectively (Table 2, Figure 3, Figures S2, S3, S4).
Discussion
Spatial variability in sugarcane fields: influences of management and soil texture
Sugarcane is a semi-perennial crop whose fields are typically reformed every five to seven years due to yield decline (Macedo et al., Reference Macedo, Seabra and Silva2008; Reference Macedo, Leal and Silva2004). Intensive mechanization, particularly through the CTF system, creates distinct spatial zones: compacted inter-rows that limit root growth and planting rows that maintain favourable physical and chemical conditions for crop development (Cherubin et al., Reference Cherubin, Karlen, Franco, Tormena, Cerri, Davies and Cerri2016; Esteban et al., Reference Esteban, de Souza, da Silva, de Souza Lima, Lovera and de Oliveira2020; Otto et al., Reference Otto, Silva, Franco, Oliveira and Trivelin2011). Otto et al. (Reference Otto, Silva, Franco, Oliveira and Trivelin2011) reported that sugarcane root density, length, and area decrease significantly with distance from the planting row and with increasing soil depth, with bulk density exceeding 1.78 g cm−3 and penetration resistance exceeding 2.0 MPa severely restricting growth. Similarly, Souza et al. (Reference Souza, Souza, Cooper and Tormena2015) observed that root dry mass in inter-rows represented only 10% of that in rows (0.08 vs. 0.88 kg m−3).
These management-induced contrasts generate heterogeneous organic matter inputs and SOC dynamics across depths and zones. For instance, planting rows exhibited approximately 20% higher C content than inter-rows at 0–30 cm, mainly due to greater root biomass and applications of other organic amendments (Souza et al., Reference Souza, Souza, Silva, Barbosa and Araújo2014). Such organic amendments and high residue deposition – recognized as best practices for SOC enhancement (Lal, Reference Lal2004; Minasny et al., Reference Minasny, Malone, McBratney, Angers, Arrouays, Chambers, Chaplot, Chen, Cheng, Das, Field, Gimona, Hedley, Hong, Mandal, Marchant, Martin, McConkey, Mulder, ORourke, Richer-de-Forges, Odeh, Padarian, Paustian, Pan, Poggio, Savin, Stolbovoy, Stockmann, Sulaeman, Tsui, Vågen, van Wesemael and Winowiecki2017; Paustian et al., Reference Paustian, Lehmann, Ogle, Reay, Robertson and Smith2016) – reinforce the uneven spatial distribution of SOC.
Our results mirror these trends, with inter-rows exhibiting 10–20% higher BD, 15–25% lower C concentrations, and 10–30% lower SOC stocks in the upper 0–30 cm across texture classes (Table S2). These contrasts diminish with depth, as compaction effects are largely surface-oriented (Scarpare et al., Reference Scarpare, de Jong van Lier, de Camargo, Pires, Ruiz-Corrêa, Bezerra, Gava and Dias2019; Figure S4). Differences were most pronounced in soils with <20% or >55% clay + silt (Table 1), where non-normality (Shapiro–Wilk p < 0.05) and significant row–inter-row differences (t and Wilcoxon tests, p < 0.05) reflect both compaction and texture effects. Coarse soils (<20% clay + silt) amplify BD increases due to low aggregate stability, increasing heterogeneity in C and SOC (Feller and Beare, Reference Feller and Beare1997; Singh et al., Reference Singh, Sarkar, Sarkar, Churchman, Bolan, Mandal, Menon, Purakayastha and Beerling2018). Conversely, fine-textured soils (>55% clay + silt) stabilize SOC through organo–mineral complexes, yielding higher stocks but still retaining row–inter-row contrasts in the surface 0–10 cm (Cerri et al., Reference Cerri, Galdos, Maia, Bernoux, Feigl, Powlson and Cerri2011; Pinheiro Junior et al., Reference Pinheiro Junior, Carvalho, Canisares, Bordonal, Cerri and Cherubin2025; Satiro et al., Reference Satiro, Cherubin, Safanelli, Lisboa, da Rocha Junior, Cerri and Cerri2017). Reviewing data on SOC accumulation in sugarcane, Cerri et al. (Reference Cerri, Galdos, Maia, Bernoux, Feigl, Powlson and Cerri2011) found SOC change rates approximately three times greater in clayey (54–73% clay + silt) than in sandy soils (10–34%), consistent with later studies (Pinheiro Junior et al., Reference Pinheiro Junior, Carvalho, Canisares, Cerri and Cherubin2024; Tenelli et al., Reference Tenelli, de Oliveira Bordonal, Barbosa and Carvalho2019; Tenelli et al., Reference Tenelli, Bordonal, Cherubin, Cerri and Carvalho2021).
Sampling effort and methodological considerations
Spatial heterogeneity across fields, depths, and management zones necessitates stratified designs capable of detecting small changes with minimal error (Allen et al., Reference Allen, Pringle, Page and Dalal2010; Davis et al., Reference Davis, Alves, Karlen, Kline, Galdos and Abulebdeh2017; Oldfield et al., Reference Oldfield, Eagle, Rubin, Rudek, Sanderman and Gordon2022). However, field sampling and laboratory analyses remain time- and cost-intensive (Liu et al., Reference Liu, Shen, Chen, Zhao, Biswas, Jia, Shi and Fang2019; Smith et al., Reference Smith, Soussana, Angers, Schipper, Chenu, Rasse, Batjes, van Egmond, McNeill, Kuhnert, Arias-Navarro, Olesen, Chirinda, Fornara, Wollenberg, Álvaro-Fuentes, Sanz-Cobena and Klumpp2020). Basic soil tests (organic matter and total C) typically cost US$10–30 per sample, while comprehensive analyses can reach US$150 when including nutrient and biological parameters (Colorado Soil Testing Lab, 2025; Cornell Soil Health Lab, 2025). For large farms (>1,000 ha), unoptimized assessments may exceed US$20,000–150,000.
Our texture-stratified sampling framework helps minimize this burden by reducing the number of samples required for reliable SOC estimates by 30–50% compared to uniform sampling – particularly within the upper 0–30 cm, where variability is greatest. Bootstrap resampling and variance-based estimations (Figure 3; Table 2; Figures S1–S4) revealed that sandy soils (<20% clay + silt) required 30–50 samples to achieve 20% precision due to high coefficients of variation (CV > 25–30%), whereas medium-textured soils (20–55%) required 20–40 samples, and clayey soils (>55%) achieved precision with as few as 10–20 samples. These findings are consistent with previous studies showing that fine-textured soils exhibit lower variability due to greater SOC stabilization (Singh et al., Reference Singh, Sarkar, Sarkar, Churchman, Bolan, Mandal, Menon, Purakayastha and Beerling2018). Non-normality in SOC data (Shapiro–Wilk p < 0.05) further justified using non-parametric tests (e.g., Wilcoxon) to detect row–inter-row differences, improving sensitivity in heterogeneous conditions (Davis et al., Reference Davis, Alves, Karlen, Kline, Galdos and Abulebdeh2017; Even et al., Reference Even, Machmuller, Lavallee, Zelikova and Cotrufo2025; Fowler et al., Reference Fowler, Basso, Millar and Brinton2023).
Applications and recommendations
This study seeks a statistical approach to optimize soil sampling for SOC assessment in sugarcane systems, offering direct implications for sustainable agriculture, the C market, and climate policy. Sugarcane remains Brazil’s leading bioenergy feedstock, reducing greenhouse gas (GHG) emissions by 60–90% relative to fossil fuels (Bordonal et al., Reference Bordonal, Carvalho, Lal, de Figueiredo, de Oliveira and La Scala2018; Goldemberg, Reference Goldemberg2007). However, most national and international certification schemes still lack standardized procedures for soil C accounting due to uncertainties in measurement and sampling design (Bordonal et al., Reference Bordonal, Tenelli, da Silva, DMárcio, Cherubin, Mício, Weiler, Campbell, Gonzaga, Barbosa, Cerri and Carvalho2024; Raffeld et al., Reference Raffeld, Bradford, Jackson, Rath, Sanford, Tautges and Oldfield2024; Zani et al., Reference Zani, Barneze and Manning2025).
Our approach contributes directly to these requirements by ensuring robust quantification, transparency, traceability, and permanence – principles consistently required across C standards such as the Brazilian System for Trading GHG Emissions (Brazil, 2024b), The Integrity Council for the Voluntary Carbon Market (ICVCM, 2024), International Carbon Reduction and Offset Alliance (ICROA, 2025), and the Carbon Offsetting and Reduction Scheme for International Aviation (CORSIA, 2018).
In this context, and to support the development of carbon projects under agricultural land management (ALM) methodologies such as VERRA’s VM0042 (v2.2) (Verra, 2025), we recommend a stratified random sampling design to reduce bias and statistical uncertainty (Lawrence et al., Reference Lawrence, Roper, Morris and Guillard2020). Briefly (with further details provided in the Supplementary Material), we propose the following steps to guide soil sampling for ALM carbon projects: (i) mapping and delineating the project activity areas using georeferenced polygons; (ii) stratifying these areas into homogeneous sampling units based on soil type, texture, relief, and land use/land cover history (each stratum should represent areas with similar soil attributes and management to maximize SOC stock homogeneity; where homogeneity is uncertain, we recommend a preliminary sampling campaign of 5–10 points in the 0–20 cm layer to assess soil texture and SOC variance); and (iii) randomly allocating the required number of sampling points within each stratum. The findings of the present study (Table 2; Figure 3; Figures S1–S3) provide statistically robust, texture-specific guidelines for the number of samples needed, while accounting for row and inter-row contrasts (which are often no longer visible after soil preparation). This approach ensures highly reliable SOC stock estimates with consistent quality assurance and quality control (QA/QC). Similar variance-based stratification strategies have been successfully applied in the geostatistical delineation of experimental plots, where variance estimation was critical for defining homogeneous plots (Cerri et al., Reference Cerri, Bernoux, Chaplot, Volkoff, Victoria, Melillo, Paustian and Cerri2004; Siqueira-Neto et al., Reference Neto, Scopel, Corbeels, Cardoso, Douzet, Feller, Piccolo, Cerri and Bernoux2010; Zani et al., Reference Zani, Barneze and Manning2025).
At each georeferenced sampling point, both bulk density and SOC measurements should be collected to enable direct stock calculation. Additionally, we recommend composite sampling at each point – one central core plus four cardinal sub-samples (approximately 25 m apart) – to average local-scale micro-variability (e.g., small residue patches or minor compaction differences) and thereby enhance within-point representativeness without increasing laboratory costs (Cerri et al., Reference Cerri, Galdos, Carvalho, Feigl and Cerri2013; FAO, 2019; World Bank, 2021). The sampling grid should not exceed one point per 20 ha. Vertical stratification is also essential for assessing C permanence and detecting management-induced changes (Button et al., Reference Button, Pett-Ridge, Murphy, Kuzyakov, Chadwick and Jones2022 Popin et al., Reference Popin, de Resende, Locatelli, Santos, Siqueira-Neto, Brando, Neill and Cerri2025). At a minimum, soils should be sampled at 0–10 cm and 10–30 cm, with deeper sampling (0–10, 10–30, 30–50, 50–70, and 70–100 cm) whenever feasible (Figure S4). This facilitates cross-project comparability through ESM correction (Ellert et al., Reference Ellert, Janzen and Entz2002; Ellert and Bettany 1995; Fowler et al., Reference Fowler, Basso, Millar and Brinton2023) and improves the detection of deep SOC accrual.
Altogether, these recommendations align field procedures with global initiatives such as ‘4 per 1000’ (Minasny et al., Reference Minasny, Malone, McBratney, Angers, Arrouays, Chambers, Chaplot, Chen, Cheng, Das, Field, Gimona, Hedley, Hong, Mandal, Marchant, Martin, McConkey, Mulder, ORourke, Richer-de-Forges, Odeh, Padarian, Paustian, Pan, Poggio, Savin, Stolbovoy, Stockmann, Sulaeman, Tsui, Vågen, van Wesemael and Winowiecki2017) and FAO’s RECSOIL (FAO, 2019), reinforcing Brazil’s commitments under the Paris Agreement (Brazil, 2024a). Integrating SOC into MRV systems will strengthen Brazil’s C accounting framework and support the development of green finance and C markets (Follador et al., Reference Follador, Soares-Filho, Philippidis, Davis, de Oliveira and Rajão2021; Rossetto et al., Reference Rossetto, Ramos, de Matos Pires, Xavier, Cantarella and Guimarães de Andrade Landell2022).
While our dataset is extensive (67 fields and 2,412 samples across six depths), some limitations should be acknowledged. First, measurements represent a single sampling campaign; the temporal dynamics of SOC under sugarcane management were not assessed. For instance, each replanting event resets soil structure and residue inputs, leading to transient SOC losses followed by gradual recovery (Silva-Olaya et al., Reference Silva-Olaya, Cerri, La Scala and Cerri2013). Second, sampling was limited to 100 cm depth. Although this includes most of the sugarcane rooting zone, deeper layers can store substantial SOC, especially in tropical soils (Nepstad et al., Reference Nepstad, de Carvalho, Davidson, Jipp, Lefebvre, Negreiros, da Silva, Stone, Trumbore and Vieira1994; Popin et al., Reference Popin, de Resende, Locatelli, Santos, Siqueira-Neto, Brando, Neill and Cerri2025; Trumbore et al., Reference Trumbore, Davidson, Barbosa de Camargo, Nepstad and Martinelli1995).
Conclusion
This study provides quantitative evidence to guide soil sampling strategies for assessing SOC stocks in sugarcane fields of south-central Brazil. Our findings demonstrate that soil texture and management-induced stratification (row vs. inter-row) jointly control SOC variability and therefore determine the sampling effort required for accurate estimates.
Our results indicate that, to achieve a mean error of less than 20%, the required number of samples for a typical sugarcane field should be at least one soil sampling point for every 20 ha under similar soil attributes, relief, current and historical land use: To bulk density (BD): 3–4 samples per texture class, independent of depth; C concentration: 14–27 samples, increasing with coarser textures; SOC stocks: 14–26 samples, following a similar texture-dependent trend. Fine-textured soils (>55% clay + silt) exhibited the lowest spatial variability and therefore required fewer samples, whereas sandy soils (<20% clay + silt) showed higher variability and demanded larger sampling efforts. These results emphasize the need to stratify sampling by texture class, particularly within the upper 0–30 cm layer, where mechanization and residue effects are most pronounced.
By providing clear, empirically based recommendations, this study supports C accounting and certification programmes and MRV systems. The proposed sampling framework reduces monitoring costs, strengthens QA/QC procedures, and facilitates reliable SOC estimation for C markets. Beyond its immediate application to sugarcane, the methodology offers a replicable model for tropical agroecosystems, contributing to sustainable bioenergy production and advancing Brazil’s commitments under the Paris Agreement.
Supplementary material
The supplementary material for this article can be found at https://doi.org/10.1017/S0014479726100295.
Author contributions
GVP: Writing – original draft, Writing – review & editing, Conceptualization, Data Curation, Visualization. WYH: Methodology, Formal analysis, Visualization, Writing - original draft. MSN: Conceptualization, Methodology, Writing – original draft, Writing – review & editing. FFCM: Conceptualization, Methodology, Investigation, Data Curation. SMSP: Supervision, Methodology, Conceptualization, Writing – original draft. IARL: Supervision, Methodology, Formal analysis, Conceptualization, Writing – original draft. CEPC: Supervision, Funding acquisition, Project administration, Resources.
Funding statement
GVP would like to thank the Coordination for the Improvement of Higher Education Personnel (CAPES) – Finance Code 88887.372564/2019-00 and the São Paulo Research Foundation (FAPESP) for the fellowships numbers 2019/25988-5 and 2022/07695-3.
Competing interests
The authors declare no conflicts of interest.


 Open access