


In educational and psychological testing, latent variable models are used to account for the dependencies between the responses to multiple test items, where no one item by itself accurately represents the attribute that the test is supposed to measure. The purpose of the model is to provide an estimate of the latent variable, based on the observed responses to the test items. Many different latent variable models are used in practice, each with their own particular set of assumptions, and applicable to different type of inferences. For example, the unidimensional (UD) Rasch (Reference Rasch1960) allows for the calibration of all respondents on a common linear scale (Kelderman, Reference Kelderman1988; Wright, Reference Wright1977), which makes it useful for applications where different subsets of items are administered to different groups of respondents. The model also need to provide an accurate goodness of fit to the observed responses, and here too there may be an abundance of choice. For the Rasch model, tests of goodness of fit have been proposed that including Andersen’s (Reference Andersen1973) likelihood ratio test (Glas & Verhelst, Reference Glas, Verhelst, Fischer and Molenaar1995), nonparametric tests (Ponocny, Reference Ponocny2001; Verhelst et al., Reference Verhelst, Hatzinger and Mair2007), tests for specific model violations (Glas, Reference Glas1988; Van den Wollenberg, Reference Van den Wollenberg1979), and tests specifically designed to deal with sparse observations (Maydeu-Olivares & Joe, Reference Maydeu-Olivares and Joe2005, see Debelak, Reference Debelak2019; Suáres-Falcón & Glas, Reference Suáres-Falcón and Glas2003 for an overview). Each of these tests assesses different dependencies in the observed response distributions and may be sensitive to different model violations. For example, Glas (Reference Glas1988) proposed a statistics, specifically designed to target the assumption of local independence (LI) by utilizing the information contained in the conditional bivariate distributions of pairs of items, given each sum score. Although found to be powerful in detecting violations of the Rasch model assumptions, for larger numbers of items the statistic is computationally demanding and the observations to which the statistic pertains become more sparse, limiting the asymptotic properties of the test statistic.
A similar problem occurs in factor analysis, where the estimation of the expected frequencies of the discrete responses involves high-dimensional (numerical) integration which becomes cumbersome for more items. Jöreskog and Moustaki (Reference Jöreskog and Moustaki2001) and Katsikatsou et al. (Reference Katsikatsou, Moustaki, Yang-Wallentin and Jöreskog2012) proposed a test statistics based only on the second-order moment to overcome these difficulties, but this procedure is also associated with loss of power for detecting model violations. These examples illustrate some of the tradeoff involved in the goodness-of-fit assessment when analyzing response data.
In this paper, the main focus is on Mokken’s (Reference Mokken1971) model of monotone homogeneity (MH) for binary test data. In addition to the assumptions UD and LI, the model assumes latent monotonicity (M). The MH model is nonparametric in the sense that it does not require the response functions to belong to a particular parametric family. Further, the MH model is useful for applications that require ordinal inferences, as it implies a stochastic ordering on the latent variable by the sum score across the items (Ghurye & Wallace, Reference Ghurye and Wallace1959; Grayson, Reference Grayson1988; Huynh, Reference Huynh1994; Ünlü, Reference Ünlü2008). The assumptions that constitute the MH model are shared by a wider range of models for response data, including the Rasch model and the three-parameter logistic model (Lord & Novick, Reference Lord and Novick1968). These assumptions imply that all covariances between the test items are nonnegative. This testable property of the MH model for pairs of items is routinely used to assess the validity of the MH model assumption by means of inspecting the scalability coefficients (Loevinger, Reference Loevinger1948; Mokken, Reference Mokken1971; Warrens, Reference Warrens2008) in Mokken scale analysis (Mokken & Lewis, Reference Mokken and Lewis1982; Molenaar & Sijtsma, Reference Molenaar and Sijtsma2000; Sijtsma & Molenaar, Reference Sijtsma and Molenaar2002; Van der Ark, Reference Van der Ark2007). In Mokken scale analysis, any scalability coefficient that is below a predetermined lower bound (usually at 0.30) is flagged as a model violation that discredits the MH model, and any model that is a special case of the MH model (Junker & Sijtsma, Reference Junker and Sijtsma2001).
A problem with Mokken scale analysis based on the scalability coefficients is the somewhat arbitrary choice for the lower bounds of the coefficients. For example, Hemker et al. (Reference Hemker, Sijtsma and Molenaar1995) found that the default value of 0.30 does not always suffice to recover a unidimensional scale. Smits et al. (Reference Smits, Timmerman and Meijer2012) also warn to be cautious about making inferences about the dimensionality of a test based on an automated evaluation of scalability coefficients. Tighter lower bounds for the scalability coefficients can be obtained from the requirement of nonnegative partial correlations (NPC; Ellis, Reference Ellis2014, Reference Ellis, Millsap, Bolt, van der Ark and Wang2015; Brusco et al., Reference Brusco, Köhn and Steinley2015). Like the scalability coefficients, the partial correlation is implied to be nonnegative under the MH model, but the property NPC takes into consideration the higher-order moments contained in the trivariate distributions of item triplets. As a consequence, a violation flagged by the property of NPC may remain undetected when only evaluating the covariances between item pairs.
Beside the scalability coefficients and NPC, other observable properties have been proposed that allow the assumptions of the MH model to be tested. For example, the property of manifest monotonicity (MM; Junker, Reference Junker1993; Junker & Sijtsma, Reference Junker and Sijtsma2000) proposes that the regression of each of the item variables is a non-decreasing function of the sum of the remaining variables or rest score. Holland and Rosenbaum (Reference Holland and Rosenbaum1986) provide an overview of properties of multivariate positive dependence that are implied by the MH model, with conditional association (CA; Holland and Rosenbaum, Reference Holland and Rosenbaum1986; Rosenbaum, Reference Rosenbaum1984) being the most restrictive of these properties for binary response data. Below, we show that the observable property CA also implies MM and NPC (Ellis, Reference Ellis, Millsap, Bolt, van der Ark and Wang2015). Because the MH model cannot be directly evaluated, we rely on these observable properties to make inferences about the validity of the MH model assumptions (Sijtsma & Van der Ark, Reference Sijtsma and Van der Ark2017). A testable latent class version of the MH model was proposed by Croon (Reference Croon1990, Reference Croon1991); see also Hoijtink and Molenaar (Reference Hoijtink and Molenaar1997) and Vermunt (Reference Vermunt2001), which requires a prior specification of the number of discrete latent classes. Global tests for some observable properties implied by the MH model have also been proposed. These global tests include both likelihood ratio tests for CA and MM (Bartolucci & Forcina, Reference Bartolucci and Forcina2005; Tijmstra et al., Reference Tijmstra, Hessen, Van der Heijden and Sijtsma2013) and Bayes factors for MM (Tijmstra et al., Reference Tijmstra, Hoijtink and Sijtsma2015).
The next section starts with the introduction of the various observable properties that are implied by the MH model, and it will be shown how these properties are hierarchically related, with the property of CA imposing the tightest constants on the distribution of item responses. Because all the observable properties are implied by CA, each of these properties can be considered to be an incomplete test of CA (Maraun et al., Reference Maraun, Jackson, Luccock, Belfer and Chrisjohn1998). Due to the number of restrictions imposed by CA and sparse observations associated with many of these restrictions, it is argued that the practical assessment of the MH model assumptions relies on incomplete tests for CA. In Sect. 2, we investigate the loss of information associated when, instead of CA, an incomplete test of CA is used, for which the complexity of the observable properties is defined as the agreement of the properties with a wider range of patterns of data. In Sect. 3, we look at the sensitivity of the various properties to violations of the MH model assumptions. The results of these studies are summarized and discussed in Sect. 4 along with their implications.
1. Properties of Multivariate Dependence
In this section, seven distinct observable properties are defined for binary test data, all of which are implied by the MH model. Let
\documentclass[12pt]{minimal}\usepackage{amsmath}\usepackage{wasysym}\usepackage{amsfonts}\usepackage{amssymb}\usepackage{amsbsy}\usepackage{mathrsfs}\usepackage{upgreek}\setlength{\oddsidemargin}{-69pt}\begin{document}$$\varvec{X}=(X_1,\ldots ,X_J)$$\end{document}
 be the random vector containing binary item response variables
\documentclass[12pt]{minimal}\usepackage{amsmath}\usepackage{wasysym}\usepackage{amsfonts}\usepackage{amssymb}\usepackage{amsbsy}\usepackage{mathrsfs}\usepackage{upgreek}\setlength{\oddsidemargin}{-69pt}\begin{document}$$X_i$$\end{document}
be the random vector containing binary item response variables
\documentclass[12pt]{minimal}\usepackage{amsmath}\usepackage{wasysym}\usepackage{amsfonts}\usepackage{amssymb}\usepackage{amsbsy}\usepackage{mathrsfs}\usepackage{upgreek}\setlength{\oddsidemargin}{-69pt}\begin{document}$$X_i$$\end{document}
 . Also, let
\documentclass[12pt]{minimal}\usepackage{amsmath}\usepackage{wasysym}\usepackage{amsfonts}\usepackage{amssymb}\usepackage{amsbsy}\usepackage{mathrsfs}\usepackage{upgreek}\setlength{\oddsidemargin}{-69pt}\begin{document}$$\varvec{\Theta }$$\end{document}
. Also, let
\documentclass[12pt]{minimal}\usepackage{amsmath}\usepackage{wasysym}\usepackage{amsfonts}\usepackage{amssymb}\usepackage{amsbsy}\usepackage{mathrsfs}\usepackage{upgreek}\setlength{\oddsidemargin}{-69pt}\begin{document}$$\varvec{\Theta }$$\end{document}
 denote the random vector of latent variables, with

The assumption of LI states that the variables
\documentclass[12pt]{minimal}\usepackage{amsmath}\usepackage{wasysym}\usepackage{amsfonts}\usepackage{amssymb}\usepackage{amsbsy}\usepackage{mathrsfs}\usepackage{upgreek}\setlength{\oddsidemargin}{-69pt}\begin{document}$$X_1,\ldots ,X_J$$\end{document}
 are locally or conditionally independent, given
\documentclass[12pt]{minimal}\usepackage{amsmath}\usepackage{wasysym}\usepackage{amsfonts}\usepackage{amssymb}\usepackage{amsbsy}\usepackage{mathrsfs}\usepackage{upgreek}\setlength{\oddsidemargin}{-69pt}\begin{document}$$\varvec{\Theta }=\varvec{\theta }$$\end{document}
are locally or conditionally independent, given
\documentclass[12pt]{minimal}\usepackage{amsmath}\usepackage{wasysym}\usepackage{amsfonts}\usepackage{amssymb}\usepackage{amsbsy}\usepackage{mathrsfs}\usepackage{upgreek}\setlength{\oddsidemargin}{-69pt}\begin{document}$$\varvec{\Theta }=\varvec{\theta }$$\end{document}
 . Further, let
\documentclass[12pt]{minimal}\usepackage{amsmath}\usepackage{wasysym}\usepackage{amsfonts}\usepackage{amssymb}\usepackage{amsbsy}\usepackage{mathrsfs}\usepackage{upgreek}\setlength{\oddsidemargin}{-69pt}\begin{document}$$P(X_i=1|\varvec{\Theta }=\varvec{\theta })$$\end{document}
. Further, let
\documentclass[12pt]{minimal}\usepackage{amsmath}\usepackage{wasysym}\usepackage{amsfonts}\usepackage{amssymb}\usepackage{amsbsy}\usepackage{mathrsfs}\usepackage{upgreek}\setlength{\oddsidemargin}{-69pt}\begin{document}$$P(X_i=1|\varvec{\Theta }=\varvec{\theta })$$\end{document}
 denote the ith response function, then the assumption M is satisfied whenever all J response functions are (element-wise) non-decreasing in
\documentclass[12pt]{minimal}\usepackage{amsmath}\usepackage{wasysym}\usepackage{amsfonts}\usepackage{amssymb}\usepackage{amsbsy}\usepackage{mathrsfs}\usepackage{upgreek}\setlength{\oddsidemargin}{-69pt}\begin{document}$$\varvec{\theta }$$\end{document}
denote the ith response function, then the assumption M is satisfied whenever all J response functions are (element-wise) non-decreasing in
\documentclass[12pt]{minimal}\usepackage{amsmath}\usepackage{wasysym}\usepackage{amsfonts}\usepackage{amssymb}\usepackage{amsbsy}\usepackage{mathrsfs}\usepackage{upgreek}\setlength{\oddsidemargin}{-69pt}\begin{document}$$\varvec{\theta }$$\end{document}
 , and assumption UD holds if
\documentclass[12pt]{minimal}\usepackage{amsmath}\usepackage{wasysym}\usepackage{amsfonts}\usepackage{amssymb}\usepackage{amsbsy}\usepackage{mathrsfs}\usepackage{upgreek}\setlength{\oddsidemargin}{-69pt}\begin{document}$$\varvec{\Theta }=\Theta $$\end{document}
, and assumption UD holds if
\documentclass[12pt]{minimal}\usepackage{amsmath}\usepackage{wasysym}\usepackage{amsfonts}\usepackage{amssymb}\usepackage{amsbsy}\usepackage{mathrsfs}\usepackage{upgreek}\setlength{\oddsidemargin}{-69pt}\begin{document}$$\varvec{\Theta }=\Theta $$\end{document}
 (i.e., scalar valued). The MH model is defined by the assumptions UD, LI, and M (Mokken, Reference Mokken1971).
It will be shown how the observable properties are related to each other, with property CA being the most restrictive of these properties. Next, several practical limitations will be discussed that relate to the number of inequality restrictions the properties impose on
\documentclass[12pt]{minimal}\usepackage{amsmath}\usepackage{wasysym}\usepackage{amsfonts}\usepackage{amssymb}\usepackage{amsbsy}\usepackage{mathrsfs}\usepackage{upgreek}\setlength{\oddsidemargin}{-69pt}\begin{document}$$\varvec{p}$$\end{document}
 and the problem of sparseness of observation. Finally, to account for these practical limitations, the assessment of the trivariate distributions of all triplets of item is considered, adding two more distinct properties for assessing the MH model assumption.
1.1. Observable Properties
Let
\documentclass[12pt]{minimal}\usepackage{amsmath}\usepackage{wasysym}\usepackage{amsfonts}\usepackage{amssymb}\usepackage{amsbsy}\usepackage{mathrsfs}\usepackage{upgreek}\setlength{\oddsidemargin}{-69pt}\begin{document}$$\varvec{p}$$\end{document}
 be a vector, which has as its elements
\documentclass[12pt]{minimal}\usepackage{amsmath}\usepackage{wasysym}\usepackage{amsfonts}\usepackage{amssymb}\usepackage{amsbsy}\usepackage{mathrsfs}\usepackage{upgreek}\setlength{\oddsidemargin}{-69pt}\begin{document}$$p_k=p(\varvec{x})$$\end{document}
be a vector, which has as its elements
\documentclass[12pt]{minimal}\usepackage{amsmath}\usepackage{wasysym}\usepackage{amsfonts}\usepackage{amssymb}\usepackage{amsbsy}\usepackage{mathrsfs}\usepackage{upgreek}\setlength{\oddsidemargin}{-69pt}\begin{document}$$p_k=p(\varvec{x})$$\end{document}
 , arranged in lexicographical order of
\documentclass[12pt]{minimal}\usepackage{amsmath}\usepackage{wasysym}\usepackage{amsfonts}\usepackage{amssymb}\usepackage{amsbsy}\usepackage{mathrsfs}\usepackage{upgreek}\setlength{\oddsidemargin}{-69pt}\begin{document}$$\varvec{x}$$\end{document}
, arranged in lexicographical order of
\documentclass[12pt]{minimal}\usepackage{amsmath}\usepackage{wasysym}\usepackage{amsfonts}\usepackage{amssymb}\usepackage{amsbsy}\usepackage{mathrsfs}\usepackage{upgreek}\setlength{\oddsidemargin}{-69pt}\begin{document}$$\varvec{x}$$\end{document}
 (i.e., scores on the right run faster from zero to one). Then,
\documentclass[12pt]{minimal}\usepackage{amsmath}\usepackage{wasysym}\usepackage{amsfonts}\usepackage{amssymb}\usepackage{amsbsy}\usepackage{mathrsfs}\usepackage{upgreek}\setlength{\oddsidemargin}{-69pt}\begin{document}$$\varvec{p}$$\end{document}
(i.e., scores on the right run faster from zero to one). Then,
\documentclass[12pt]{minimal}\usepackage{amsmath}\usepackage{wasysym}\usepackage{amsfonts}\usepackage{amssymb}\usepackage{amsbsy}\usepackage{mathrsfs}\usepackage{upgreek}\setlength{\oddsidemargin}{-69pt}\begin{document}$$\varvec{p}$$\end{document}
 contains the multinomial probabilities parameters for the distribution of the frequencies of
\documentclass[12pt]{minimal}\usepackage{amsmath}\usepackage{wasysym}\usepackage{amsfonts}\usepackage{amssymb}\usepackage{amsbsy}\usepackage{mathrsfs}\usepackage{upgreek}\setlength{\oddsidemargin}{-69pt}\begin{document}$$\varvec{X}=\varvec{x}$$\end{document}
contains the multinomial probabilities parameters for the distribution of the frequencies of
\documentclass[12pt]{minimal}\usepackage{amsmath}\usepackage{wasysym}\usepackage{amsfonts}\usepackage{amssymb}\usepackage{amsbsy}\usepackage{mathrsfs}\usepackage{upgreek}\setlength{\oddsidemargin}{-69pt}\begin{document}$$\varvec{X}=\varvec{x}$$\end{document}
 , with the restriction
\documentclass[12pt]{minimal}\usepackage{amsmath}\usepackage{wasysym}\usepackage{amsfonts}\usepackage{amssymb}\usepackage{amsbsy}\usepackage{mathrsfs}\usepackage{upgreek}\setlength{\oddsidemargin}{-69pt}\begin{document}$$\varvec{1}^\prime \varvec{p}=1$$\end{document}
, with the restriction
\documentclass[12pt]{minimal}\usepackage{amsmath}\usepackage{wasysym}\usepackage{amsfonts}\usepackage{amssymb}\usepackage{amsbsy}\usepackage{mathrsfs}\usepackage{upgreek}\setlength{\oddsidemargin}{-69pt}\begin{document}$$\varvec{1}^\prime \varvec{p}=1$$\end{document}
 (Holland, Reference Holland1990). Each of the observable properties that are discussed below differs with respect to the additional restrictions they impose on
\documentclass[12pt]{minimal}\usepackage{amsmath}\usepackage{wasysym}\usepackage{amsfonts}\usepackage{amssymb}\usepackage{amsbsy}\usepackage{mathrsfs}\usepackage{upgreek}\setlength{\oddsidemargin}{-69pt}\begin{document}$$\varvec{p}$$\end{document}
(Holland, Reference Holland1990). Each of the observable properties that are discussed below differs with respect to the additional restrictions they impose on
\documentclass[12pt]{minimal}\usepackage{amsmath}\usepackage{wasysym}\usepackage{amsfonts}\usepackage{amssymb}\usepackage{amsbsy}\usepackage{mathrsfs}\usepackage{upgreek}\setlength{\oddsidemargin}{-69pt}\begin{document}$$\varvec{p}$$\end{document}
 .
.
1.1.1. (Conditionally) Associated Random Variables
Esary et al. (Reference Esary, Proschan and Walkup1967) defined
\documentclass[12pt]{minimal}\usepackage{amsmath}\usepackage{wasysym}\usepackage{amsfonts}\usepackage{amssymb}\usepackage{amsbsy}\usepackage{mathrsfs}\usepackage{upgreek}\setlength{\oddsidemargin}{-69pt}\begin{document}$$\varvec{X}$$\end{document}
 to be associated (A), if the covariance between any pair of binary non-decreasing functions of
\documentclass[12pt]{minimal}\usepackage{amsmath}\usepackage{wasysym}\usepackage{amsfonts}\usepackage{amssymb}\usepackage{amsbsy}\usepackage{mathrsfs}\usepackage{upgreek}\setlength{\oddsidemargin}{-69pt}\begin{document}$$\varvec{X}$$\end{document}
to be associated (A), if the covariance between any pair of binary non-decreasing functions of
\documentclass[12pt]{minimal}\usepackage{amsmath}\usepackage{wasysym}\usepackage{amsfonts}\usepackage{amssymb}\usepackage{amsbsy}\usepackage{mathrsfs}\usepackage{upgreek}\setlength{\oddsidemargin}{-69pt}\begin{document}$$\varvec{X}$$\end{document}
 is nonnegative. A conditional version of property A was proposed by Holland and Rosenbaum (Reference Holland and Rosenbaum1986) and Rosenbaum (Reference Rosenbaum1984), where
\documentclass[12pt]{minimal}\usepackage{amsmath}\usepackage{wasysym}\usepackage{amsfonts}\usepackage{amssymb}\usepackage{amsbsy}\usepackage{mathrsfs}\usepackage{upgreek}\setlength{\oddsidemargin}{-69pt}\begin{document}$$\varvec{X}$$\end{document}
is nonnegative. A conditional version of property A was proposed by Holland and Rosenbaum (Reference Holland and Rosenbaum1986) and Rosenbaum (Reference Rosenbaum1984), where
\documentclass[12pt]{minimal}\usepackage{amsmath}\usepackage{wasysym}\usepackage{amsfonts}\usepackage{amssymb}\usepackage{amsbsy}\usepackage{mathrsfs}\usepackage{upgreek}\setlength{\oddsidemargin}{-69pt}\begin{document}$$\varvec{X}$$\end{document}
 is said to be CA, if for any partition
\documentclass[12pt]{minimal}\usepackage{amsmath}\usepackage{wasysym}\usepackage{amsfonts}\usepackage{amssymb}\usepackage{amsbsy}\usepackage{mathrsfs}\usepackage{upgreek}\setlength{\oddsidemargin}{-69pt}\begin{document}$$\varvec{X}=(\varvec{Y},\varvec{Z})$$\end{document}
is said to be CA, if for any partition
\documentclass[12pt]{minimal}\usepackage{amsmath}\usepackage{wasysym}\usepackage{amsfonts}\usepackage{amssymb}\usepackage{amsbsy}\usepackage{mathrsfs}\usepackage{upgreek}\setlength{\oddsidemargin}{-69pt}\begin{document}$$\varvec{X}=(\varvec{Y},\varvec{Z})$$\end{document}
 , the variables
\documentclass[12pt]{minimal}\usepackage{amsmath}\usepackage{wasysym}\usepackage{amsfonts}\usepackage{amssymb}\usepackage{amsbsy}\usepackage{mathrsfs}\usepackage{upgreek}\setlength{\oddsidemargin}{-69pt}\begin{document}$$\varvec{Y}$$\end{document}
, the variables
\documentclass[12pt]{minimal}\usepackage{amsmath}\usepackage{wasysym}\usepackage{amsfonts}\usepackage{amssymb}\usepackage{amsbsy}\usepackage{mathrsfs}\usepackage{upgreek}\setlength{\oddsidemargin}{-69pt}\begin{document}$$\varvec{Y}$$\end{document}
 are associated, given any arbitrary function of
\documentclass[12pt]{minimal}\usepackage{amsmath}\usepackage{wasysym}\usepackage{amsfonts}\usepackage{amssymb}\usepackage{amsbsy}\usepackage{mathrsfs}\usepackage{upgreek}\setlength{\oddsidemargin}{-69pt}\begin{document}$$\varvec{Z}$$\end{document}
are associated, given any arbitrary function of
\documentclass[12pt]{minimal}\usepackage{amsmath}\usepackage{wasysym}\usepackage{amsfonts}\usepackage{amssymb}\usepackage{amsbsy}\usepackage{mathrsfs}\usepackage{upgreek}\setlength{\oddsidemargin}{-69pt}\begin{document}$$\varvec{Z}$$\end{document}
 .
.
Assume that
\documentclass[12pt]{minimal}\usepackage{amsmath}\usepackage{wasysym}\usepackage{amsfonts}\usepackage{amssymb}\usepackage{amsbsy}\usepackage{mathrsfs}\usepackage{upgreek}\setlength{\oddsidemargin}{-69pt}\begin{document}$$\varvec{p}>\varvec{0}$$\end{document}
 , then CA can be concisely expressed in terms restricted log-odds ratios, as

with
\documentclass[12pt]{minimal}\usepackage{amsmath}\usepackage{wasysym}\usepackage{amsfonts}\usepackage{amssymb}\usepackage{amsbsy}\usepackage{mathrsfs}\usepackage{upgreek}\setlength{\oddsidemargin}{-69pt}\begin{document}$${\mathbf {K}}={\mathbf {I}}_v\otimes (1,-1,-1,1)$$\end{document}
 (Kronecker product),
\documentclass[12pt]{minimal}\usepackage{amsmath}\usepackage{wasysym}\usepackage{amsfonts}\usepackage{amssymb}\usepackage{amsbsy}\usepackage{mathrsfs}\usepackage{upgreek}\setlength{\oddsidemargin}{-69pt}\begin{document}$${\mathbf {I}}_v$$\end{document}
(Kronecker product),
\documentclass[12pt]{minimal}\usepackage{amsmath}\usepackage{wasysym}\usepackage{amsfonts}\usepackage{amssymb}\usepackage{amsbsy}\usepackage{mathrsfs}\usepackage{upgreek}\setlength{\oddsidemargin}{-69pt}\begin{document}$${\mathbf {I}}_v$$\end{document}
 is the identity matrix of dimensions equal to the number of restrictions v imposed by CA, and
\documentclass[12pt]{minimal}\usepackage{amsmath}\usepackage{wasysym}\usepackage{amsfonts}\usepackage{amssymb}\usepackage{amsbsy}\usepackage{mathrsfs}\usepackage{upgreek}\setlength{\oddsidemargin}{-69pt}\begin{document}$${\mathbf {M}}$$\end{document}
is the identity matrix of dimensions equal to the number of restrictions v imposed by CA, and
\documentclass[12pt]{minimal}\usepackage{amsmath}\usepackage{wasysym}\usepackage{amsfonts}\usepackage{amssymb}\usepackage{amsbsy}\usepackage{mathrsfs}\usepackage{upgreek}\setlength{\oddsidemargin}{-69pt}\begin{document}$${\mathbf {M}}$$\end{document}
 is a binary design matrix (Bartolucci & Forcina, Reference Bartolucci and Forcina2005). Each of the consecutive four rows of the matrix
\documentclass[12pt]{minimal}\usepackage{amsmath}\usepackage{wasysym}\usepackage{amsfonts}\usepackage{amssymb}\usepackage{amsbsy}\usepackage{mathrsfs}\usepackage{upgreek}\setlength{\oddsidemargin}{-69pt}\begin{document}$${\mathbf {M}}$$\end{document}
is a binary design matrix (Bartolucci & Forcina, Reference Bartolucci and Forcina2005). Each of the consecutive four rows of the matrix
\documentclass[12pt]{minimal}\usepackage{amsmath}\usepackage{wasysym}\usepackage{amsfonts}\usepackage{amssymb}\usepackage{amsbsy}\usepackage{mathrsfs}\usepackage{upgreek}\setlength{\oddsidemargin}{-69pt}\begin{document}$${\mathbf {M}}$$\end{document}
 in (1) correspond to a particular restriction imposed on
\documentclass[12pt]{minimal}\usepackage{amsmath}\usepackage{wasysym}\usepackage{amsfonts}\usepackage{amssymb}\usepackage{amsbsy}\usepackage{mathrsfs}\usepackage{upgreek}\setlength{\oddsidemargin}{-69pt}\begin{document}$$\varvec{p}$$\end{document}
in (1) correspond to a particular restriction imposed on
\documentclass[12pt]{minimal}\usepackage{amsmath}\usepackage{wasysym}\usepackage{amsfonts}\usepackage{amssymb}\usepackage{amsbsy}\usepackage{mathrsfs}\usepackage{upgreek}\setlength{\oddsidemargin}{-69pt}\begin{document}$$\varvec{p}$$\end{document}
 by property CA, with
\documentclass[12pt]{minimal}\usepackage{amsmath}\usepackage{wasysym}\usepackage{amsfonts}\usepackage{amssymb}\usepackage{amsbsy}\usepackage{mathrsfs}\usepackage{upgreek}\setlength{\oddsidemargin}{-69pt}\begin{document}$$v=(2^d-1)J(J-1)/2$$\end{document}
by property CA, with
\documentclass[12pt]{minimal}\usepackage{amsmath}\usepackage{wasysym}\usepackage{amsfonts}\usepackage{amssymb}\usepackage{amsbsy}\usepackage{mathrsfs}\usepackage{upgreek}\setlength{\oddsidemargin}{-69pt}\begin{document}$$v=(2^d-1)J(J-1)/2$$\end{document}
 and
\documentclass[12pt]{minimal}\usepackage{amsmath}\usepackage{wasysym}\usepackage{amsfonts}\usepackage{amssymb}\usepackage{amsbsy}\usepackage{mathrsfs}\usepackage{upgreek}\setlength{\oddsidemargin}{-69pt}\begin{document}$$d=2^{J-2}$$\end{document}
and
\documentclass[12pt]{minimal}\usepackage{amsmath}\usepackage{wasysym}\usepackage{amsfonts}\usepackage{amssymb}\usepackage{amsbsy}\usepackage{mathrsfs}\usepackage{upgreek}\setlength{\oddsidemargin}{-69pt}\begin{document}$$d=2^{J-2}$$\end{document}
 . For example, in case
\documentclass[12pt]{minimal}\usepackage{amsmath}\usepackage{wasysym}\usepackage{amsfonts}\usepackage{amssymb}\usepackage{amsbsy}\usepackage{mathrsfs}\usepackage{upgreek}\setlength{\oddsidemargin}{-69pt}\begin{document}$$J=2$$\end{document}
. For example, in case
\documentclass[12pt]{minimal}\usepackage{amsmath}\usepackage{wasysym}\usepackage{amsfonts}\usepackage{amssymb}\usepackage{amsbsy}\usepackage{mathrsfs}\usepackage{upgreek}\setlength{\oddsidemargin}{-69pt}\begin{document}$$J=2$$\end{document}
 ,
\documentclass[12pt]{minimal}\usepackage{amsmath}\usepackage{wasysym}\usepackage{amsfonts}\usepackage{amssymb}\usepackage{amsbsy}\usepackage{mathrsfs}\usepackage{upgreek}\setlength{\oddsidemargin}{-69pt}\begin{document}$${\mathbf {M}}={\mathbf {I}}_4$$\end{document}
,
\documentclass[12pt]{minimal}\usepackage{amsmath}\usepackage{wasysym}\usepackage{amsfonts}\usepackage{amssymb}\usepackage{amsbsy}\usepackage{mathrsfs}\usepackage{upgreek}\setlength{\oddsidemargin}{-69pt}\begin{document}$${\mathbf {M}}={\mathbf {I}}_4$$\end{document}
 and (1) yields
\documentclass[12pt]{minimal}\usepackage{amsmath}\usepackage{wasysym}\usepackage{amsfonts}\usepackage{amssymb}\usepackage{amsbsy}\usepackage{mathrsfs}\usepackage{upgreek}\setlength{\oddsidemargin}{-69pt}\begin{document}$$\ln p_1-\ln p_2-\ln p_3+\ln p_4\ge 0$$\end{document}
and (1) yields
\documentclass[12pt]{minimal}\usepackage{amsmath}\usepackage{wasysym}\usepackage{amsfonts}\usepackage{amssymb}\usepackage{amsbsy}\usepackage{mathrsfs}\usepackage{upgreek}\setlength{\oddsidemargin}{-69pt}\begin{document}$$\ln p_1-\ln p_2-\ln p_3+\ln p_4\ge 0$$\end{document}
 .
.
Walkup (Reference Walkup1968) characterized property A in terms of a collection of pairs of binary non-decreasing functions. For
\documentclass[12pt]{minimal}\usepackage{amsmath}\usepackage{wasysym}\usepackage{amsfonts}\usepackage{amssymb}\usepackage{amsbsy}\usepackage{mathrsfs}\usepackage{upgreek}\setlength{\oddsidemargin}{-69pt}\begin{document}$$J=3$$\end{document}
 , there are nine such pairs of functions. The constraints these functions impose correspond to restrictions on
\documentclass[12pt]{minimal}\usepackage{amsmath}\usepackage{wasysym}\usepackage{amsfonts}\usepackage{amssymb}\usepackage{amsbsy}\usepackage{mathrsfs}\usepackage{upgreek}\setlength{\oddsidemargin}{-69pt}\begin{document}$$\varvec{p}$$\end{document}
, there are nine such pairs of functions. The constraints these functions impose correspond to restrictions on
\documentclass[12pt]{minimal}\usepackage{amsmath}\usepackage{wasysym}\usepackage{amsfonts}\usepackage{amssymb}\usepackage{amsbsy}\usepackage{mathrsfs}\usepackage{upgreek}\setlength{\oddsidemargin}{-69pt}\begin{document}$$\varvec{p}$$\end{document}
 that can be expressed as (1), with the matrix
\documentclass[12pt]{minimal}\usepackage{amsmath}\usepackage{wasysym}\usepackage{amsfonts}\usepackage{amssymb}\usepackage{amsbsy}\usepackage{mathrsfs}\usepackage{upgreek}\setlength{\oddsidemargin}{-69pt}\begin{document}$${\mathbf {M}}$$\end{document}
that can be expressed as (1), with the matrix
\documentclass[12pt]{minimal}\usepackage{amsmath}\usepackage{wasysym}\usepackage{amsfonts}\usepackage{amssymb}\usepackage{amsbsy}\usepackage{mathrsfs}\usepackage{upgreek}\setlength{\oddsidemargin}{-69pt}\begin{document}$${\mathbf {M}}$$\end{document}
 equal to

The last row in (2), for example, corresponds to the restriction

or equivalently, Cov
\documentclass[12pt]{minimal}\usepackage{amsmath}\usepackage{wasysym}\usepackage{amsfonts}\usepackage{amssymb}\usepackage{amsbsy}\usepackage{mathrsfs}\usepackage{upgreek}\setlength{\oddsidemargin}{-69pt}\begin{document}$$(1-(1-X_1)(1-X_2),X_3)\ge 0$$\end{document}
 . For
\documentclass[12pt]{minimal}\usepackage{amsmath}\usepackage{wasysym}\usepackage{amsfonts}\usepackage{amssymb}\usepackage{amsbsy}\usepackage{mathrsfs}\usepackage{upgreek}\setlength{\oddsidemargin}{-69pt}\begin{document}$$J=4$$\end{document}
. For
\documentclass[12pt]{minimal}\usepackage{amsmath}\usepackage{wasysym}\usepackage{amsfonts}\usepackage{amssymb}\usepackage{amsbsy}\usepackage{mathrsfs}\usepackage{upgreek}\setlength{\oddsidemargin}{-69pt}\begin{document}$$J=4$$\end{document}
 , Walkup (Reference Walkup1968, pp. 1400–1401) enumerated
\documentclass[12pt]{minimal}\usepackage{amsmath}\usepackage{wasysym}\usepackage{amsfonts}\usepackage{amssymb}\usepackage{amsbsy}\usepackage{mathrsfs}\usepackage{upgreek}\setlength{\oddsidemargin}{-69pt}\begin{document}$$v=99$$\end{document}
, Walkup (Reference Walkup1968, pp. 1400–1401) enumerated
\documentclass[12pt]{minimal}\usepackage{amsmath}\usepackage{wasysym}\usepackage{amsfonts}\usepackage{amssymb}\usepackage{amsbsy}\usepackage{mathrsfs}\usepackage{upgreek}\setlength{\oddsidemargin}{-69pt}\begin{document}$$v=99$$\end{document}
 pairs of binary non-decreasing functions to characterize property A.
1.1.2. Multivariate Totally Positive
Next, consider the property of multivariate totally positivity of order 2 (MTP
\documentclass[12pt]{minimal}\usepackage{amsmath}\usepackage{wasysym}\usepackage{amsfonts}\usepackage{amssymb}\usepackage{amsbsy}\usepackage{mathrsfs}\usepackage{upgreek}\setlength{\oddsidemargin}{-69pt}\begin{document}$$_2$$\end{document}
 ; Karlin & Rinott, Reference Karlin and Rinott1980) for a random vector
\documentclass[12pt]{minimal}\usepackage{amsmath}\usepackage{wasysym}\usepackage{amsfonts}\usepackage{amssymb}\usepackage{amsbsy}\usepackage{mathrsfs}\usepackage{upgreek}\setlength{\oddsidemargin}{-69pt}\begin{document}$$\varvec{U}$$\end{document}
; Karlin & Rinott, Reference Karlin and Rinott1980) for a random vector
\documentclass[12pt]{minimal}\usepackage{amsmath}\usepackage{wasysym}\usepackage{amsfonts}\usepackage{amssymb}\usepackage{amsbsy}\usepackage{mathrsfs}\usepackage{upgreek}\setlength{\oddsidemargin}{-69pt}\begin{document}$$\varvec{U}$$\end{document}
 . The density
\documentclass[12pt]{minimal}\usepackage{amsmath}\usepackage{wasysym}\usepackage{amsfonts}\usepackage{amssymb}\usepackage{amsbsy}\usepackage{mathrsfs}\usepackage{upgreek}\setlength{\oddsidemargin}{-69pt}\begin{document}$$f(\varvec{u})$$\end{document}
. The density
\documentclass[12pt]{minimal}\usepackage{amsmath}\usepackage{wasysym}\usepackage{amsfonts}\usepackage{amssymb}\usepackage{amsbsy}\usepackage{mathrsfs}\usepackage{upgreek}\setlength{\oddsidemargin}{-69pt}\begin{document}$$f(\varvec{u})$$\end{document}
 is said to be
\documentclass[12pt]{minimal}\usepackage{amsmath}\usepackage{wasysym}\usepackage{amsfonts}\usepackage{amssymb}\usepackage{amsbsy}\usepackage{mathrsfs}\usepackage{upgreek}\setlength{\oddsidemargin}{-69pt}\begin{document}$$\hbox {MTP}_2$$\end{document}
is said to be
\documentclass[12pt]{minimal}\usepackage{amsmath}\usepackage{wasysym}\usepackage{amsfonts}\usepackage{amssymb}\usepackage{amsbsy}\usepackage{mathrsfs}\usepackage{upgreek}\setlength{\oddsidemargin}{-69pt}\begin{document}$$\hbox {MTP}_2$$\end{document}
 , if
\documentclass[12pt]{minimal}\usepackage{amsmath}\usepackage{wasysym}\usepackage{amsfonts}\usepackage{amssymb}\usepackage{amsbsy}\usepackage{mathrsfs}\usepackage{upgreek}\setlength{\oddsidemargin}{-69pt}\begin{document}$$f(\varvec{u})f(\varvec{v})\le f(\max (\varvec{u},\varvec{v}))f(\min (\varvec{u},\varvec{v}))$$\end{document}
, if
\documentclass[12pt]{minimal}\usepackage{amsmath}\usepackage{wasysym}\usepackage{amsfonts}\usepackage{amssymb}\usepackage{amsbsy}\usepackage{mathrsfs}\usepackage{upgreek}\setlength{\oddsidemargin}{-69pt}\begin{document}$$f(\varvec{u})f(\varvec{v})\le f(\max (\varvec{u},\varvec{v}))f(\min (\varvec{u},\varvec{v}))$$\end{document}
 , for all outcomes
\documentclass[12pt]{minimal}\usepackage{amsmath}\usepackage{wasysym}\usepackage{amsfonts}\usepackage{amssymb}\usepackage{amsbsy}\usepackage{mathrsfs}\usepackage{upgreek}\setlength{\oddsidemargin}{-69pt}\begin{document}$$\varvec{u},\varvec{v}$$\end{document}
, for all outcomes
\documentclass[12pt]{minimal}\usepackage{amsmath}\usepackage{wasysym}\usepackage{amsfonts}\usepackage{amssymb}\usepackage{amsbsy}\usepackage{mathrsfs}\usepackage{upgreek}\setlength{\oddsidemargin}{-69pt}\begin{document}$$\varvec{u},\varvec{v}$$\end{document}
 , and with the minimum and maximum applied element-wise. For bivariate densities, the property is called
\documentclass[12pt]{minimal}\usepackage{amsmath}\usepackage{wasysym}\usepackage{amsfonts}\usepackage{amssymb}\usepackage{amsbsy}\usepackage{mathrsfs}\usepackage{upgreek}\setlength{\oddsidemargin}{-69pt}\begin{document}$$\hbox {TP}_2$$\end{document}
, and with the minimum and maximum applied element-wise. For bivariate densities, the property is called
\documentclass[12pt]{minimal}\usepackage{amsmath}\usepackage{wasysym}\usepackage{amsfonts}\usepackage{amssymb}\usepackage{amsbsy}\usepackage{mathrsfs}\usepackage{upgreek}\setlength{\oddsidemargin}{-69pt}\begin{document}$$\hbox {TP}_2$$\end{document}
 and corresponds to a monotone likelihood ratio ordering (MLR) in case the joint density is strictly positive (Karlin, Reference Karlin1968; Sarkar, Reference Sarkar1969). This MLR property is relevant as it is the property used by Grayson (Reference Grayson1988) to establish the stochastic ordering on
\documentclass[12pt]{minimal}\usepackage{amsmath}\usepackage{wasysym}\usepackage{amsfonts}\usepackage{amssymb}\usepackage{amsbsy}\usepackage{mathrsfs}\usepackage{upgreek}\setlength{\oddsidemargin}{-69pt}\begin{document}$$\Theta $$\end{document}
and corresponds to a monotone likelihood ratio ordering (MLR) in case the joint density is strictly positive (Karlin, Reference Karlin1968; Sarkar, Reference Sarkar1969). This MLR property is relevant as it is the property used by Grayson (Reference Grayson1988) to establish the stochastic ordering on
\documentclass[12pt]{minimal}\usepackage{amsmath}\usepackage{wasysym}\usepackage{amsfonts}\usepackage{amssymb}\usepackage{amsbsy}\usepackage{mathrsfs}\usepackage{upgreek}\setlength{\oddsidemargin}{-69pt}\begin{document}$$\Theta $$\end{document}
 by the sum scores
\documentclass[12pt]{minimal}\usepackage{amsmath}\usepackage{wasysym}\usepackage{amsfonts}\usepackage{amssymb}\usepackage{amsbsy}\usepackage{mathrsfs}\usepackage{upgreek}\setlength{\oddsidemargin}{-69pt}\begin{document}$$S=X_1+\cdots +X_J$$\end{document}
by the sum scores
\documentclass[12pt]{minimal}\usepackage{amsmath}\usepackage{wasysym}\usepackage{amsfonts}\usepackage{amssymb}\usepackage{amsbsy}\usepackage{mathrsfs}\usepackage{upgreek}\setlength{\oddsidemargin}{-69pt}\begin{document}$$S=X_1+\cdots +X_J$$\end{document}
 under the MH model.
For the binary random vector
\documentclass[12pt]{minimal}\usepackage{amsmath}\usepackage{wasysym}\usepackage{amsfonts}\usepackage{amssymb}\usepackage{amsbsy}\usepackage{mathrsfs}\usepackage{upgreek}\setlength{\oddsidemargin}{-69pt}\begin{document}$$\varvec{X}$$\end{document}
 , assume that
\documentclass[12pt]{minimal}\usepackage{amsmath}\usepackage{wasysym}\usepackage{amsfonts}\usepackage{amssymb}\usepackage{amsbsy}\usepackage{mathrsfs}\usepackage{upgreek}\setlength{\oddsidemargin}{-69pt}\begin{document}$$\varvec{p}>\varvec{0}$$\end{document}
, assume that
\documentclass[12pt]{minimal}\usepackage{amsmath}\usepackage{wasysym}\usepackage{amsfonts}\usepackage{amssymb}\usepackage{amsbsy}\usepackage{mathrsfs}\usepackage{upgreek}\setlength{\oddsidemargin}{-69pt}\begin{document}$$\varvec{p}>\varvec{0}$$\end{document}
 . Then, (1) can also be used as an expression for
\documentclass[12pt]{minimal}\usepackage{amsmath}\usepackage{wasysym}\usepackage{amsfonts}\usepackage{amssymb}\usepackage{amsbsy}\usepackage{mathrsfs}\usepackage{upgreek}\setlength{\oddsidemargin}{-69pt}\begin{document}$$\hbox {MTP}_2$$\end{document}
. Then, (1) can also be used as an expression for
\documentclass[12pt]{minimal}\usepackage{amsmath}\usepackage{wasysym}\usepackage{amsfonts}\usepackage{amssymb}\usepackage{amsbsy}\usepackage{mathrsfs}\usepackage{upgreek}\setlength{\oddsidemargin}{-69pt}\begin{document}$$\hbox {MTP}_2$$\end{document}
 , by omitting the matrix
\documentclass[12pt]{minimal}\usepackage{amsmath}\usepackage{wasysym}\usepackage{amsfonts}\usepackage{amssymb}\usepackage{amsbsy}\usepackage{mathrsfs}\usepackage{upgreek}\setlength{\oddsidemargin}{-69pt}\begin{document}$${\mathbf {W}}$$\end{document}
, by omitting the matrix
\documentclass[12pt]{minimal}\usepackage{amsmath}\usepackage{wasysym}\usepackage{amsfonts}\usepackage{amssymb}\usepackage{amsbsy}\usepackage{mathrsfs}\usepackage{upgreek}\setlength{\oddsidemargin}{-69pt}\begin{document}$${\mathbf {W}}$$\end{document}
 in the algorithm by Bartolucci and Forcina (Reference Bartolucci and Forcina2005, p. 41) for constructing matrix
\documentclass[12pt]{minimal}\usepackage{amsmath}\usepackage{wasysym}\usepackage{amsfonts}\usepackage{amssymb}\usepackage{amsbsy}\usepackage{mathrsfs}\usepackage{upgreek}\setlength{\oddsidemargin}{-69pt}\begin{document}$${\mathbf {M}}$$\end{document}
in the algorithm by Bartolucci and Forcina (Reference Bartolucci and Forcina2005, p. 41) for constructing matrix
\documentclass[12pt]{minimal}\usepackage{amsmath}\usepackage{wasysym}\usepackage{amsfonts}\usepackage{amssymb}\usepackage{amsbsy}\usepackage{mathrsfs}\usepackage{upgreek}\setlength{\oddsidemargin}{-69pt}\begin{document}$${\mathbf {M}}$$\end{document}
 , and adjusting v accordingly. The
\documentclass[12pt]{minimal}\usepackage{amsmath}\usepackage{wasysym}\usepackage{amsfonts}\usepackage{amssymb}\usepackage{amsbsy}\usepackage{mathrsfs}\usepackage{upgreek}\setlength{\oddsidemargin}{-69pt}\begin{document}$$\hbox {MTP}_2$$\end{document}
, and adjusting v accordingly. The
\documentclass[12pt]{minimal}\usepackage{amsmath}\usepackage{wasysym}\usepackage{amsfonts}\usepackage{amssymb}\usepackage{amsbsy}\usepackage{mathrsfs}\usepackage{upgreek}\setlength{\oddsidemargin}{-69pt}\begin{document}$$\hbox {MTP}_2$$\end{document}
 property then corresponds to the requirement that Cov
\documentclass[12pt]{minimal}\usepackage{amsmath}\usepackage{wasysym}\usepackage{amsfonts}\usepackage{amssymb}\usepackage{amsbsy}\usepackage{mathrsfs}\usepackage{upgreek}\setlength{\oddsidemargin}{-69pt}\begin{document}$$(X_i,X_j|\varvec{Z}=\varvec{z})\ge 0$$\end{document}
property then corresponds to the requirement that Cov
\documentclass[12pt]{minimal}\usepackage{amsmath}\usepackage{wasysym}\usepackage{amsfonts}\usepackage{amssymb}\usepackage{amsbsy}\usepackage{mathrsfs}\usepackage{upgreek}\setlength{\oddsidemargin}{-69pt}\begin{document}$$(X_i,X_j|\varvec{Z}=\varvec{z})\ge 0$$\end{document}
 , for any partition
\documentclass[12pt]{minimal}\usepackage{amsmath}\usepackage{wasysym}\usepackage{amsfonts}\usepackage{amssymb}\usepackage{amsbsy}\usepackage{mathrsfs}\usepackage{upgreek}\setlength{\oddsidemargin}{-69pt}\begin{document}$$\varvec{X}=(X_i,X_j,\varvec{Z})$$\end{document}
, for any partition
\documentclass[12pt]{minimal}\usepackage{amsmath}\usepackage{wasysym}\usepackage{amsfonts}\usepackage{amssymb}\usepackage{amsbsy}\usepackage{mathrsfs}\usepackage{upgreek}\setlength{\oddsidemargin}{-69pt}\begin{document}$$\varvec{X}=(X_i,X_j,\varvec{Z})$$\end{document}
 and any vector
\documentclass[12pt]{minimal}\usepackage{amsmath}\usepackage{wasysym}\usepackage{amsfonts}\usepackage{amssymb}\usepackage{amsbsy}\usepackage{mathrsfs}\usepackage{upgreek}\setlength{\oddsidemargin}{-69pt}\begin{document}$$\varvec{z}$$\end{document}
and any vector
\documentclass[12pt]{minimal}\usepackage{amsmath}\usepackage{wasysym}\usepackage{amsfonts}\usepackage{amssymb}\usepackage{amsbsy}\usepackage{mathrsfs}\usepackage{upgreek}\setlength{\oddsidemargin}{-69pt}\begin{document}$$\varvec{z}$$\end{document}
 .
.
For a multidimensional vector
\documentclass[12pt]{minimal}\usepackage{amsmath}\usepackage{wasysym}\usepackage{amsfonts}\usepackage{amssymb}\usepackage{amsbsy}\usepackage{mathrsfs}\usepackage{upgreek}\setlength{\oddsidemargin}{-69pt}\begin{document}$$\varvec{\Theta }$$\end{document}
 , Holland and Rosenbaum (Reference Holland and Rosenbaum1986, Theorem 7) showed that the assumptions of LI and M imply that
\documentclass[12pt]{minimal}\usepackage{amsmath}\usepackage{wasysym}\usepackage{amsfonts}\usepackage{amssymb}\usepackage{amsbsy}\usepackage{mathrsfs}\usepackage{upgreek}\setlength{\oddsidemargin}{-69pt}\begin{document}$$\varvec{X}$$\end{document}
, Holland and Rosenbaum (Reference Holland and Rosenbaum1986, Theorem 7) showed that the assumptions of LI and M imply that
\documentclass[12pt]{minimal}\usepackage{amsmath}\usepackage{wasysym}\usepackage{amsfonts}\usepackage{amssymb}\usepackage{amsbsy}\usepackage{mathrsfs}\usepackage{upgreek}\setlength{\oddsidemargin}{-69pt}\begin{document}$$\varvec{X}$$\end{document}
 satisfies the property of
\documentclass[12pt]{minimal}\usepackage{amsmath}\usepackage{wasysym}\usepackage{amsfonts}\usepackage{amssymb}\usepackage{amsbsy}\usepackage{mathrsfs}\usepackage{upgreek}\setlength{\oddsidemargin}{-69pt}\begin{document}$$\hbox {MTP}_2$$\end{document}
satisfies the property of
\documentclass[12pt]{minimal}\usepackage{amsmath}\usepackage{wasysym}\usepackage{amsfonts}\usepackage{amssymb}\usepackage{amsbsy}\usepackage{mathrsfs}\usepackage{upgreek}\setlength{\oddsidemargin}{-69pt}\begin{document}$$\hbox {MTP}_2$$\end{document}
 , if
\documentclass[12pt]{minimal}\usepackage{amsmath}\usepackage{wasysym}\usepackage{amsfonts}\usepackage{amssymb}\usepackage{amsbsy}\usepackage{mathrsfs}\usepackage{upgreek}\setlength{\oddsidemargin}{-69pt}\begin{document}$$\varvec{\Theta }$$\end{document}
, if
\documentclass[12pt]{minimal}\usepackage{amsmath}\usepackage{wasysym}\usepackage{amsfonts}\usepackage{amssymb}\usepackage{amsbsy}\usepackage{mathrsfs}\usepackage{upgreek}\setlength{\oddsidemargin}{-69pt}\begin{document}$$\varvec{\Theta }$$\end{document}
 is
\documentclass[12pt]{minimal}\usepackage{amsmath}\usepackage{wasysym}\usepackage{amsfonts}\usepackage{amssymb}\usepackage{amsbsy}\usepackage{mathrsfs}\usepackage{upgreek}\setlength{\oddsidemargin}{-69pt}\begin{document}$$\hbox {MTP}_2$$\end{document}
is
\documentclass[12pt]{minimal}\usepackage{amsmath}\usepackage{wasysym}\usepackage{amsfonts}\usepackage{amssymb}\usepackage{amsbsy}\usepackage{mathrsfs}\usepackage{upgreek}\setlength{\oddsidemargin}{-69pt}\begin{document}$$\hbox {MTP}_2$$\end{document}
 . Also,
\documentclass[12pt]{minimal}\usepackage{amsmath}\usepackage{wasysym}\usepackage{amsfonts}\usepackage{amssymb}\usepackage{amsbsy}\usepackage{mathrsfs}\usepackage{upgreek}\setlength{\oddsidemargin}{-69pt}\begin{document}$$\varvec{X}$$\end{document}
. Also,
\documentclass[12pt]{minimal}\usepackage{amsmath}\usepackage{wasysym}\usepackage{amsfonts}\usepackage{amssymb}\usepackage{amsbsy}\usepackage{mathrsfs}\usepackage{upgreek}\setlength{\oddsidemargin}{-69pt}\begin{document}$$\varvec{X}$$\end{document}
 is
\documentclass[12pt]{minimal}\usepackage{amsmath}\usepackage{wasysym}\usepackage{amsfonts}\usepackage{amssymb}\usepackage{amsbsy}\usepackage{mathrsfs}\usepackage{upgreek}\setlength{\oddsidemargin}{-69pt}\begin{document}$$\hbox {MTP}_2$$\end{document}
is
\documentclass[12pt]{minimal}\usepackage{amsmath}\usepackage{wasysym}\usepackage{amsfonts}\usepackage{amssymb}\usepackage{amsbsy}\usepackage{mathrsfs}\usepackage{upgreek}\setlength{\oddsidemargin}{-69pt}\begin{document}$$\hbox {MTP}_2$$\end{document}
 , whenever
\documentclass[12pt]{minimal}\usepackage{amsmath}\usepackage{wasysym}\usepackage{amsfonts}\usepackage{amssymb}\usepackage{amsbsy}\usepackage{mathrsfs}\usepackage{upgreek}\setlength{\oddsidemargin}{-69pt}\begin{document}$$(\varvec{X},\varvec{\Theta })$$\end{document}
, whenever
\documentclass[12pt]{minimal}\usepackage{amsmath}\usepackage{wasysym}\usepackage{amsfonts}\usepackage{amssymb}\usepackage{amsbsy}\usepackage{mathrsfs}\usepackage{upgreek}\setlength{\oddsidemargin}{-69pt}\begin{document}$$(\varvec{X},\varvec{\Theta })$$\end{document}
 satisfying a particular higher-order factor structure (Ellis, Reference Ellis, Millsap, Bolt, van der Ark and Wang2015). These results imply that the property of
\documentclass[12pt]{minimal}\usepackage{amsmath}\usepackage{wasysym}\usepackage{amsfonts}\usepackage{amssymb}\usepackage{amsbsy}\usepackage{mathrsfs}\usepackage{upgreek}\setlength{\oddsidemargin}{-69pt}\begin{document}$$\hbox {MTP}_2$$\end{document}
satisfying a particular higher-order factor structure (Ellis, Reference Ellis, Millsap, Bolt, van der Ark and Wang2015). These results imply that the property of
\documentclass[12pt]{minimal}\usepackage{amsmath}\usepackage{wasysym}\usepackage{amsfonts}\usepackage{amssymb}\usepackage{amsbsy}\usepackage{mathrsfs}\usepackage{upgreek}\setlength{\oddsidemargin}{-69pt}\begin{document}$$\hbox {MTP}_2$$\end{document}
 is not confined to unidimensional models only.
1.1.3. Nonnegative Covariances
Equation (1) can also be used to restrict the bivariate distributions of pairs of item variables
\documentclass[12pt]{minimal}\usepackage{amsmath}\usepackage{wasysym}\usepackage{amsfonts}\usepackage{amssymb}\usepackage{amsbsy}\usepackage{mathrsfs}\usepackage{upgreek}\setlength{\oddsidemargin}{-69pt}\begin{document}$$X_i$$\end{document}
 and
\documentclass[12pt]{minimal}\usepackage{amsmath}\usepackage{wasysym}\usepackage{amsfonts}\usepackage{amssymb}\usepackage{amsbsy}\usepackage{mathrsfs}\usepackage{upgreek}\setlength{\oddsidemargin}{-69pt}\begin{document}$$X_j$$\end{document}
and
\documentclass[12pt]{minimal}\usepackage{amsmath}\usepackage{wasysym}\usepackage{amsfonts}\usepackage{amssymb}\usepackage{amsbsy}\usepackage{mathrsfs}\usepackage{upgreek}\setlength{\oddsidemargin}{-69pt}\begin{document}$$X_j$$\end{document}
 , such that Cov
\documentclass[12pt]{minimal}\usepackage{amsmath}\usepackage{wasysym}\usepackage{amsfonts}\usepackage{amssymb}\usepackage{amsbsy}\usepackage{mathrsfs}\usepackage{upgreek}\setlength{\oddsidemargin}{-69pt}\begin{document}$$(X_i,X_j)\ge 0$$\end{document}
, such that Cov
\documentclass[12pt]{minimal}\usepackage{amsmath}\usepackage{wasysym}\usepackage{amsfonts}\usepackage{amssymb}\usepackage{amsbsy}\usepackage{mathrsfs}\usepackage{upgreek}\setlength{\oddsidemargin}{-69pt}\begin{document}$$(X_i,X_j)\ge 0$$\end{document}
 , for all
\documentclass[12pt]{minimal}\usepackage{amsmath}\usepackage{wasysym}\usepackage{amsfonts}\usepackage{amssymb}\usepackage{amsbsy}\usepackage{mathrsfs}\usepackage{upgreek}\setlength{\oddsidemargin}{-69pt}\begin{document}$$1\le i<j\le J$$\end{document}
, for all
\documentclass[12pt]{minimal}\usepackage{amsmath}\usepackage{wasysym}\usepackage{amsfonts}\usepackage{amssymb}\usepackage{amsbsy}\usepackage{mathrsfs}\usepackage{upgreek}\setlength{\oddsidemargin}{-69pt}\begin{document}$$1\le i<j\le J$$\end{document}
 . Let
. Let

and let the matrix
\documentclass[12pt]{minimal}\usepackage{amsmath}\usepackage{wasysym}\usepackage{amsfonts}\usepackage{amssymb}\usepackage{amsbsy}\usepackage{mathrsfs}\usepackage{upgreek}\setlength{\oddsidemargin}{-69pt}\begin{document}$${\mathbf {M}}$$\end{document}
 be obtained by stacking on top of one another all matrices
\documentclass[12pt]{minimal}\usepackage{amsmath}\usepackage{wasysym}\usepackage{amsfonts}\usepackage{amssymb}\usepackage{amsbsy}\usepackage{mathrsfs}\usepackage{upgreek}\setlength{\oddsidemargin}{-69pt}\begin{document}$${\mathbf {T}}_{ij}$$\end{document}
be obtained by stacking on top of one another all matrices
\documentclass[12pt]{minimal}\usepackage{amsmath}\usepackage{wasysym}\usepackage{amsfonts}\usepackage{amssymb}\usepackage{amsbsy}\usepackage{mathrsfs}\usepackage{upgreek}\setlength{\oddsidemargin}{-69pt}\begin{document}$${\mathbf {T}}_{ij}$$\end{document}
 . With this matrix
\documentclass[12pt]{minimal}\usepackage{amsmath}\usepackage{wasysym}\usepackage{amsfonts}\usepackage{amssymb}\usepackage{amsbsy}\usepackage{mathrsfs}\usepackage{upgreek}\setlength{\oddsidemargin}{-69pt}\begin{document}$${\mathbf {M}}$$\end{document}
. With this matrix
\documentclass[12pt]{minimal}\usepackage{amsmath}\usepackage{wasysym}\usepackage{amsfonts}\usepackage{amssymb}\usepackage{amsbsy}\usepackage{mathrsfs}\usepackage{upgreek}\setlength{\oddsidemargin}{-69pt}\begin{document}$${\mathbf {M}}$$\end{document}
 and
\documentclass[12pt]{minimal}\usepackage{amsmath}\usepackage{wasysym}\usepackage{amsfonts}\usepackage{amssymb}\usepackage{amsbsy}\usepackage{mathrsfs}\usepackage{upgreek}\setlength{\oddsidemargin}{-69pt}\begin{document}$$v=J(J-1)/2$$\end{document}
and
\documentclass[12pt]{minimal}\usepackage{amsmath}\usepackage{wasysym}\usepackage{amsfonts}\usepackage{amssymb}\usepackage{amsbsy}\usepackage{mathrsfs}\usepackage{upgreek}\setlength{\oddsidemargin}{-69pt}\begin{document}$$v=J(J-1)/2$$\end{document}
 , expression (1) imposes the restriction of the property of nonnegative covariances (NC), which implies that all the scalability coefficients are nonnegative (Mokken, Reference Mokken1971; Sijtsma & Molenaar, Reference Sijtsma and Molenaar2002).
1.1.4. Manifest Monotonicity
The observable property MM pertains to the regression of each
\documentclass[12pt]{minimal}\usepackage{amsmath}\usepackage{wasysym}\usepackage{amsfonts}\usepackage{amssymb}\usepackage{amsbsy}\usepackage{mathrsfs}\usepackage{upgreek}\setlength{\oddsidemargin}{-69pt}\begin{document}$$X_i$$\end{document}
 on
\documentclass[12pt]{minimal}\usepackage{amsmath}\usepackage{wasysym}\usepackage{amsfonts}\usepackage{amssymb}\usepackage{amsbsy}\usepackage{mathrsfs}\usepackage{upgreek}\setlength{\oddsidemargin}{-69pt}\begin{document}$$S-X_i$$\end{document}
on
\documentclass[12pt]{minimal}\usepackage{amsmath}\usepackage{wasysym}\usepackage{amsfonts}\usepackage{amssymb}\usepackage{amsbsy}\usepackage{mathrsfs}\usepackage{upgreek}\setlength{\oddsidemargin}{-69pt}\begin{document}$$S-X_i$$\end{document}
 , with
\documentclass[12pt]{minimal}\usepackage{amsmath}\usepackage{wasysym}\usepackage{amsfonts}\usepackage{amssymb}\usepackage{amsbsy}\usepackage{mathrsfs}\usepackage{upgreek}\setlength{\oddsidemargin}{-69pt}\begin{document}$$S=X_1+\cdots +X_J$$\end{document}
, with
\documentclass[12pt]{minimal}\usepackage{amsmath}\usepackage{wasysym}\usepackage{amsfonts}\usepackage{amssymb}\usepackage{amsbsy}\usepackage{mathrsfs}\usepackage{upgreek}\setlength{\oddsidemargin}{-69pt}\begin{document}$$S=X_1+\cdots +X_J$$\end{document}
 . Junker (Reference Junker1993) showed that MM provides a partial characterization of a general class of latent variable models that include the MH model. To show CA implies MM, let
\documentclass[12pt]{minimal}\usepackage{amsmath}\usepackage{wasysym}\usepackage{amsfonts}\usepackage{amssymb}\usepackage{amsbsy}\usepackage{mathrsfs}\usepackage{upgreek}\setlength{\oddsidemargin}{-69pt}\begin{document}$$R=S-X_i-X_j$$\end{document}
. Junker (Reference Junker1993) showed that MM provides a partial characterization of a general class of latent variable models that include the MH model. To show CA implies MM, let
\documentclass[12pt]{minimal}\usepackage{amsmath}\usepackage{wasysym}\usepackage{amsfonts}\usepackage{amssymb}\usepackage{amsbsy}\usepackage{mathrsfs}\usepackage{upgreek}\setlength{\oddsidemargin}{-69pt}\begin{document}$$R=S-X_i-X_j$$\end{document}
 . Then, CA implies for all
\documentclass[12pt]{minimal}\usepackage{amsmath}\usepackage{wasysym}\usepackage{amsfonts}\usepackage{amssymb}\usepackage{amsbsy}\usepackage{mathrsfs}\usepackage{upgreek}\setlength{\oddsidemargin}{-69pt}\begin{document}$$R=r$$\end{document}
. Then, CA implies for all
\documentclass[12pt]{minimal}\usepackage{amsmath}\usepackage{wasysym}\usepackage{amsfonts}\usepackage{amssymb}\usepackage{amsbsy}\usepackage{mathrsfs}\usepackage{upgreek}\setlength{\oddsidemargin}{-69pt}\begin{document}$$R=r$$\end{document}
 , that

or equivalently
\documentclass[12pt]{minimal}\usepackage{amsmath}\usepackage{wasysym}\usepackage{amsfonts}\usepackage{amssymb}\usepackage{amsbsy}\usepackage{mathrsfs}\usepackage{upgreek}\setlength{\oddsidemargin}{-69pt}\begin{document}$$P(X_i=1|S-X_i=r)\le P(X_i=1|S-X_i=r+1)$$\end{document}
 . The inequalities imposed by MM thus correspond to a selection of consecutive rows of
\documentclass[12pt]{minimal}\usepackage{amsmath}\usepackage{wasysym}\usepackage{amsfonts}\usepackage{amssymb}\usepackage{amsbsy}\usepackage{mathrsfs}\usepackage{upgreek}\setlength{\oddsidemargin}{-69pt}\begin{document}$${\mathbf {M}}$$\end{document}
. The inequalities imposed by MM thus correspond to a selection of consecutive rows of
\documentclass[12pt]{minimal}\usepackage{amsmath}\usepackage{wasysym}\usepackage{amsfonts}\usepackage{amssymb}\usepackage{amsbsy}\usepackage{mathrsfs}\usepackage{upgreek}\setlength{\oddsidemargin}{-69pt}\begin{document}$${\mathbf {M}}$$\end{document}
 for CA. For example, for
\documentclass[12pt]{minimal}\usepackage{amsmath}\usepackage{wasysym}\usepackage{amsfonts}\usepackage{amssymb}\usepackage{amsbsy}\usepackage{mathrsfs}\usepackage{upgreek}\setlength{\oddsidemargin}{-69pt}\begin{document}$$J=3$$\end{document}
for CA. For example, for
\documentclass[12pt]{minimal}\usepackage{amsmath}\usepackage{wasysym}\usepackage{amsfonts}\usepackage{amssymb}\usepackage{amsbsy}\usepackage{mathrsfs}\usepackage{upgreek}\setlength{\oddsidemargin}{-69pt}\begin{document}$$J=3$$\end{document}
 , matrix
\documentclass[12pt]{minimal}\usepackage{amsmath}\usepackage{wasysym}\usepackage{amsfonts}\usepackage{amssymb}\usepackage{amsbsy}\usepackage{mathrsfs}\usepackage{upgreek}\setlength{\oddsidemargin}{-69pt}\begin{document}$${\mathbf {M}}$$\end{document}
, matrix
\documentclass[12pt]{minimal}\usepackage{amsmath}\usepackage{wasysym}\usepackage{amsfonts}\usepackage{amssymb}\usepackage{amsbsy}\usepackage{mathrsfs}\usepackage{upgreek}\setlength{\oddsidemargin}{-69pt}\begin{document}$${\mathbf {M}}$$\end{document}
 for MM becomes

Unlike the other observable properties that have been discussed thus far, MM for all test item does not imply that MM also holds for any subset of item. For example, for
\documentclass[12pt]{minimal}\usepackage{amsmath}\usepackage{wasysym}\usepackage{amsfonts}\usepackage{amssymb}\usepackage{amsbsy}\usepackage{mathrsfs}\usepackage{upgreek}\setlength{\oddsidemargin}{-69pt}\begin{document}$$J\ge 3$$\end{document}
 , MM does not imply NC nor the other way around.
1.1.5. Strongly Positive Orthant Dependency
Holland (Reference Holland1981) proposed a generalization of the MH model, by relaxing the LI condition. His approach to modeling the dependencies between the item variables uses clusters of item variables with outcomes of all zeros or ones. Let
\documentclass[12pt]{minimal}\usepackage{amsmath}\usepackage{wasysym}\usepackage{amsfonts}\usepackage{amssymb}\usepackage{amsbsy}\usepackage{mathrsfs}\usepackage{upgreek}\setlength{\oddsidemargin}{-69pt}\begin{document}$$\varvec{V}$$\end{document}
 contain a selection of variables from
\documentclass[12pt]{minimal}\usepackage{amsmath}\usepackage{wasysym}\usepackage{amsfonts}\usepackage{amssymb}\usepackage{amsbsy}\usepackage{mathrsfs}\usepackage{upgreek}\setlength{\oddsidemargin}{-69pt}\begin{document}$$\varvec{X}$$\end{document}
contain a selection of variables from
\documentclass[12pt]{minimal}\usepackage{amsmath}\usepackage{wasysym}\usepackage{amsfonts}\usepackage{amssymb}\usepackage{amsbsy}\usepackage{mathrsfs}\usepackage{upgreek}\setlength{\oddsidemargin}{-69pt}\begin{document}$$\varvec{X}$$\end{document}
 and consider the partition
\documentclass[12pt]{minimal}\usepackage{amsmath}\usepackage{wasysym}\usepackage{amsfonts}\usepackage{amssymb}\usepackage{amsbsy}\usepackage{mathrsfs}\usepackage{upgreek}\setlength{\oddsidemargin}{-69pt}\begin{document}$$\varvec{V}=(\varvec{Y},\varvec{Z})$$\end{document}
and consider the partition
\documentclass[12pt]{minimal}\usepackage{amsmath}\usepackage{wasysym}\usepackage{amsfonts}\usepackage{amssymb}\usepackage{amsbsy}\usepackage{mathrsfs}\usepackage{upgreek}\setlength{\oddsidemargin}{-69pt}\begin{document}$$\varvec{V}=(\varvec{Y},\varvec{Z})$$\end{document}
 . Besides UD, also assume that both


for any selection
\documentclass[12pt]{minimal}\usepackage{amsmath}\usepackage{wasysym}\usepackage{amsfonts}\usepackage{amssymb}\usepackage{amsbsy}\usepackage{mathrsfs}\usepackage{upgreek}\setlength{\oddsidemargin}{-69pt}\begin{document}$$\varvec{V}$$\end{document}
 . Then, Holland (Reference Holland1981) showed that these assumptions together with the assumption of local nonnegative dependence (LND) coincide with following three inequalities:


for any partition of the selected variables
\documentclass[12pt]{minimal}\usepackage{amsmath}\usepackage{wasysym}\usepackage{amsfonts}\usepackage{amssymb}\usepackage{amsbsy}\usepackage{mathrsfs}\usepackage{upgreek}\setlength{\oddsidemargin}{-69pt}\begin{document}$$\varvec{V}=(\varvec{Y},\varvec{Z})$$\end{document}
 , where the assumption LND is obtained from (5a–5c) by conditioning each term on
\documentclass[12pt]{minimal}\usepackage{amsmath}\usepackage{wasysym}\usepackage{amsfonts}\usepackage{amssymb}\usepackage{amsbsy}\usepackage{mathrsfs}\usepackage{upgreek}\setlength{\oddsidemargin}{-69pt}\begin{document}$$\Theta =\theta $$\end{document}
, where the assumption LND is obtained from (5a–5c) by conditioning each term on
\documentclass[12pt]{minimal}\usepackage{amsmath}\usepackage{wasysym}\usepackage{amsfonts}\usepackage{amssymb}\usepackage{amsbsy}\usepackage{mathrsfs}\usepackage{upgreek}\setlength{\oddsidemargin}{-69pt}\begin{document}$$\Theta =\theta $$\end{document}
 .
.
The observable property defined by (5a–5c), for any
\documentclass[12pt]{minimal}\usepackage{amsmath}\usepackage{wasysym}\usepackage{amsfonts}\usepackage{amssymb}\usepackage{amsbsy}\usepackage{mathrsfs}\usepackage{upgreek}\setlength{\oddsidemargin}{-69pt}\begin{document}$$\varvec{V}=(\varvec{Y},\varvec{Z})$$\end{document}
 implies strongly positive orthant dependency (SPOD; Joag-Dev, Reference Joag-Dev1983), with the latter obtained by taking
\documentclass[12pt]{minimal}\usepackage{amsmath}\usepackage{wasysym}\usepackage{amsfonts}\usepackage{amssymb}\usepackage{amsbsy}\usepackage{mathrsfs}\usepackage{upgreek}\setlength{\oddsidemargin}{-69pt}\begin{document}$$\varvec{V}=\varvec{X}$$\end{document}
implies strongly positive orthant dependency (SPOD; Joag-Dev, Reference Joag-Dev1983), with the latter obtained by taking
\documentclass[12pt]{minimal}\usepackage{amsmath}\usepackage{wasysym}\usepackage{amsfonts}\usepackage{amssymb}\usepackage{amsbsy}\usepackage{mathrsfs}\usepackage{upgreek}\setlength{\oddsidemargin}{-69pt}\begin{document}$$\varvec{V}=\varvec{X}$$\end{document}
 (Block & Fang, Reference Block and Fang1990). Following Holland and Rosenbaum (Reference Holland and Rosenbaum1986, p. 1531), we refer to the property defined by (5a–5c) as SPOD, but have it understood that it applies to any subset of item variables from
\documentclass[12pt]{minimal}\usepackage{amsmath}\usepackage{wasysym}\usepackage{amsfonts}\usepackage{amssymb}\usepackage{amsbsy}\usepackage{mathrsfs}\usepackage{upgreek}\setlength{\oddsidemargin}{-69pt}\begin{document}$$\varvec{X}$$\end{document}
(Block & Fang, Reference Block and Fang1990). Following Holland and Rosenbaum (Reference Holland and Rosenbaum1986, p. 1531), we refer to the property defined by (5a–5c) as SPOD, but have it understood that it applies to any subset of item variables from
\documentclass[12pt]{minimal}\usepackage{amsmath}\usepackage{wasysym}\usepackage{amsfonts}\usepackage{amssymb}\usepackage{amsbsy}\usepackage{mathrsfs}\usepackage{upgreek}\setlength{\oddsidemargin}{-69pt}\begin{document}$$\varvec{X}$$\end{document}
 .
.
The property SPOD can be expressed in terms of the log-odds ratios in (1) by appropriately adjusting matrix
\documentclass[12pt]{minimal}\usepackage{amsmath}\usepackage{wasysym}\usepackage{amsfonts}\usepackage{amssymb}\usepackage{amsbsy}\usepackage{mathrsfs}\usepackage{upgreek}\setlength{\oddsidemargin}{-69pt}\begin{document}$${\mathbf {M}}$$\end{document}
 and v. For example, for
\documentclass[12pt]{minimal}\usepackage{amsmath}\usepackage{wasysym}\usepackage{amsfonts}\usepackage{amssymb}\usepackage{amsbsy}\usepackage{mathrsfs}\usepackage{upgreek}\setlength{\oddsidemargin}{-69pt}\begin{document}$$\varvec{V}=(X_i,X_j)$$\end{document}
and v. For example, for
\documentclass[12pt]{minimal}\usepackage{amsmath}\usepackage{wasysym}\usepackage{amsfonts}\usepackage{amssymb}\usepackage{amsbsy}\usepackage{mathrsfs}\usepackage{upgreek}\setlength{\oddsidemargin}{-69pt}\begin{document}$$\varvec{V}=(X_i,X_j)$$\end{document}
 , all three inequalities coincide with Cov
\documentclass[12pt]{minimal}\usepackage{amsmath}\usepackage{wasysym}\usepackage{amsfonts}\usepackage{amssymb}\usepackage{amsbsy}\usepackage{mathrsfs}\usepackage{upgreek}\setlength{\oddsidemargin}{-69pt}\begin{document}$$(X_i,X_j)\ge 0$$\end{document}
, all three inequalities coincide with Cov
\documentclass[12pt]{minimal}\usepackage{amsmath}\usepackage{wasysym}\usepackage{amsfonts}\usepackage{amssymb}\usepackage{amsbsy}\usepackage{mathrsfs}\usepackage{upgreek}\setlength{\oddsidemargin}{-69pt}\begin{document}$$(X_i,X_j)\ge 0$$\end{document}
 . For
\documentclass[12pt]{minimal}\usepackage{amsmath}\usepackage{wasysym}\usepackage{amsfonts}\usepackage{amssymb}\usepackage{amsbsy}\usepackage{mathrsfs}\usepackage{upgreek}\setlength{\oddsidemargin}{-69pt}\begin{document}$$J=3$$\end{document}
. For
\documentclass[12pt]{minimal}\usepackage{amsmath}\usepackage{wasysym}\usepackage{amsfonts}\usepackage{amssymb}\usepackage{amsbsy}\usepackage{mathrsfs}\usepackage{upgreek}\setlength{\oddsidemargin}{-69pt}\begin{document}$$J=3$$\end{document}
 , let
\documentclass[12pt]{minimal}\usepackage{amsmath}\usepackage{wasysym}\usepackage{amsfonts}\usepackage{amssymb}\usepackage{amsbsy}\usepackage{mathrsfs}\usepackage{upgreek}\setlength{\oddsidemargin}{-69pt}\begin{document}$$\varvec{Y}=X_1$$\end{document}
, let
\documentclass[12pt]{minimal}\usepackage{amsmath}\usepackage{wasysym}\usepackage{amsfonts}\usepackage{amssymb}\usepackage{amsbsy}\usepackage{mathrsfs}\usepackage{upgreek}\setlength{\oddsidemargin}{-69pt}\begin{document}$$\varvec{Y}=X_1$$\end{document}
 and
\documentclass[12pt]{minimal}\usepackage{amsmath}\usepackage{wasysym}\usepackage{amsfonts}\usepackage{amssymb}\usepackage{amsbsy}\usepackage{mathrsfs}\usepackage{upgreek}\setlength{\oddsidemargin}{-69pt}\begin{document}$$\varvec{Z}=(X_2,X_3)$$\end{document}
and
\documentclass[12pt]{minimal}\usepackage{amsmath}\usepackage{wasysym}\usepackage{amsfonts}\usepackage{amssymb}\usepackage{amsbsy}\usepackage{mathrsfs}\usepackage{upgreek}\setlength{\oddsidemargin}{-69pt}\begin{document}$$\varvec{Z}=(X_2,X_3)$$\end{document}
 , so that (5a) and (5b) imply that

respectively. These two inequalities hold, if and only if (5c) holds, for
\documentclass[12pt]{minimal}\usepackage{amsmath}\usepackage{wasysym}\usepackage{amsfonts}\usepackage{amssymb}\usepackage{amsbsy}\usepackage{mathrsfs}\usepackage{upgreek}\setlength{\oddsidemargin}{-69pt}\begin{document}$$\varvec{Y}=(X_2,X_3)$$\end{document}
 and
\documentclass[12pt]{minimal}\usepackage{amsmath}\usepackage{wasysym}\usepackage{amsfonts}\usepackage{amssymb}\usepackage{amsbsy}\usepackage{mathrsfs}\usepackage{upgreek}\setlength{\oddsidemargin}{-69pt}\begin{document}$$\varvec{Z}=X_1$$\end{document}
and
\documentclass[12pt]{minimal}\usepackage{amsmath}\usepackage{wasysym}\usepackage{amsfonts}\usepackage{amssymb}\usepackage{amsbsy}\usepackage{mathrsfs}\usepackage{upgreek}\setlength{\oddsidemargin}{-69pt}\begin{document}$$\varvec{Z}=X_1$$\end{document}
 , and
\documentclass[12pt]{minimal}\usepackage{amsmath}\usepackage{wasysym}\usepackage{amsfonts}\usepackage{amssymb}\usepackage{amsbsy}\usepackage{mathrsfs}\usepackage{upgreek}\setlength{\oddsidemargin}{-69pt}\begin{document}$$\varvec{Y}=X_1$$\end{document}
, and
\documentclass[12pt]{minimal}\usepackage{amsmath}\usepackage{wasysym}\usepackage{amsfonts}\usepackage{amssymb}\usepackage{amsbsy}\usepackage{mathrsfs}\usepackage{upgreek}\setlength{\oddsidemargin}{-69pt}\begin{document}$$\varvec{Y}=X_1$$\end{document}
 and
\documentclass[12pt]{minimal}\usepackage{amsmath}\usepackage{wasysym}\usepackage{amsfonts}\usepackage{amssymb}\usepackage{amsbsy}\usepackage{mathrsfs}\usepackage{upgreek}\setlength{\oddsidemargin}{-69pt}\begin{document}$$\varvec{Z}=(X_2,X_3)$$\end{document}
and
\documentclass[12pt]{minimal}\usepackage{amsmath}\usepackage{wasysym}\usepackage{amsfonts}\usepackage{amssymb}\usepackage{amsbsy}\usepackage{mathrsfs}\usepackage{upgreek}\setlength{\oddsidemargin}{-69pt}\begin{document}$$\varvec{Z}=(X_2,X_3)$$\end{document}
 , respectively. Hence, for
\documentclass[12pt]{minimal}\usepackage{amsmath}\usepackage{wasysym}\usepackage{amsfonts}\usepackage{amssymb}\usepackage{amsbsy}\usepackage{mathrsfs}\usepackage{upgreek}\setlength{\oddsidemargin}{-69pt}\begin{document}$$J=3$$\end{document}
, respectively. Hence, for
\documentclass[12pt]{minimal}\usepackage{amsmath}\usepackage{wasysym}\usepackage{amsfonts}\usepackage{amssymb}\usepackage{amsbsy}\usepackage{mathrsfs}\usepackage{upgreek}\setlength{\oddsidemargin}{-69pt}\begin{document}$$J=3$$\end{document}
 , SPOD reduces to inequality (5c), for all
\documentclass[12pt]{minimal}\usepackage{amsmath}\usepackage{wasysym}\usepackage{amsfonts}\usepackage{amssymb}\usepackage{amsbsy}\usepackage{mathrsfs}\usepackage{upgreek}\setlength{\oddsidemargin}{-69pt}\begin{document}$$\varvec{V}=(\varvec{Y},\varvec{Z})$$\end{document}
, SPOD reduces to inequality (5c), for all
\documentclass[12pt]{minimal}\usepackage{amsmath}\usepackage{wasysym}\usepackage{amsfonts}\usepackage{amssymb}\usepackage{amsbsy}\usepackage{mathrsfs}\usepackage{upgreek}\setlength{\oddsidemargin}{-69pt}\begin{document}$$\varvec{V}=(\varvec{Y},\varvec{Z})$$\end{document}
 .
.
1.1.6. Nonnegative Partial Correlations
Unlike the observable properties discussed above, NPC does not lend itself to be expressed as restrictions on the log-odds ratios. Instead, consider the selection of variables
\documentclass[12pt]{minimal}\usepackage{amsmath}\usepackage{wasysym}\usepackage{amsfonts}\usepackage{amssymb}\usepackage{amsbsy}\usepackage{mathrsfs}\usepackage{upgreek}\setlength{\oddsidemargin}{-69pt}\begin{document}$$(X_i,X_j,X_k)$$\end{document}
 from
\documentclass[12pt]{minimal}\usepackage{amsmath}\usepackage{wasysym}\usepackage{amsfonts}\usepackage{amssymb}\usepackage{amsbsy}\usepackage{mathrsfs}\usepackage{upgreek}\setlength{\oddsidemargin}{-69pt}\begin{document}$$\varvec{X}$$\end{document}
from
\documentclass[12pt]{minimal}\usepackage{amsmath}\usepackage{wasysym}\usepackage{amsfonts}\usepackage{amssymb}\usepackage{amsbsy}\usepackage{mathrsfs}\usepackage{upgreek}\setlength{\oddsidemargin}{-69pt}\begin{document}$$\varvec{X}$$\end{document}
 . Then, for any such selection of variables, the property NPC requires that

which each selected variable taking on the role of
\documentclass[12pt]{minimal}\usepackage{amsmath}\usepackage{wasysym}\usepackage{amsfonts}\usepackage{amssymb}\usepackage{amsbsy}\usepackage{mathrsfs}\usepackage{upgreek}\setlength{\oddsidemargin}{-69pt}\begin{document}$$X_k$$\end{document}
 once (Ellis, Reference Ellis2014). NPC holds, whenever all trivariate distributions of triplets of response variables satisfy
\documentclass[12pt]{minimal}\usepackage{amsmath}\usepackage{wasysym}\usepackage{amsfonts}\usepackage{amssymb}\usepackage{amsbsy}\usepackage{mathrsfs}\usepackage{upgreek}\setlength{\oddsidemargin}{-69pt}\begin{document}$$\hbox {MTP}_2$$\end{document}
once (Ellis, Reference Ellis2014). NPC holds, whenever all trivariate distributions of triplets of response variables satisfy
\documentclass[12pt]{minimal}\usepackage{amsmath}\usepackage{wasysym}\usepackage{amsfonts}\usepackage{amssymb}\usepackage{amsbsy}\usepackage{mathrsfs}\usepackage{upgreek}\setlength{\oddsidemargin}{-69pt}\begin{document}$$\hbox {MTP}_2$$\end{document}
 (Ellis, Reference Ellis, Millsap, Bolt, van der Ark and Wang2015).
1.2. Relationships Between the Observable Properties
All observable properties for the binary response data above are implied by CA (Holland & Rosenbaum, Reference Holland and Rosenbaum1986, p. 1536). Figure 1 (left) shows an overview of the observable properties and their relationships, for
\documentclass[12pt]{minimal}\usepackage{amsmath}\usepackage{wasysym}\usepackage{amsfonts}\usepackage{amssymb}\usepackage{amsbsy}\usepackage{mathrsfs}\usepackage{upgreek}\setlength{\oddsidemargin}{-69pt}\begin{document}$$J\ge 4$$\end{document}
 . The property MM is implied by CA, but MM neither implies, nor is implied by any of the other properties. In Fig. 1, NPC pertains to the trivariate distributions of all triplets of items, and NC pertains to the bivariate distributions of all pairs of items. The remaining observable properties apply to the multivariate distribution of all the J item variables. In case
\documentclass[12pt]{minimal}\usepackage{amsmath}\usepackage{wasysym}\usepackage{amsfonts}\usepackage{amssymb}\usepackage{amsbsy}\usepackage{mathrsfs}\usepackage{upgreek}\setlength{\oddsidemargin}{-69pt}\begin{document}$$J=2$$\end{document}
. The property MM is implied by CA, but MM neither implies, nor is implied by any of the other properties. In Fig. 1, NPC pertains to the trivariate distributions of all triplets of items, and NC pertains to the bivariate distributions of all pairs of items. The remaining observable properties apply to the multivariate distribution of all the J item variables. In case
\documentclass[12pt]{minimal}\usepackage{amsmath}\usepackage{wasysym}\usepackage{amsfonts}\usepackage{amssymb}\usepackage{amsbsy}\usepackage{mathrsfs}\usepackage{upgreek}\setlength{\oddsidemargin}{-69pt}\begin{document}$$J=2$$\end{document}
 , all the properties coincide with Cov
\documentclass[12pt]{minimal}\usepackage{amsmath}\usepackage{wasysym}\usepackage{amsfonts}\usepackage{amssymb}\usepackage{amsbsy}\usepackage{mathrsfs}\usepackage{upgreek}\setlength{\oddsidemargin}{-69pt}\begin{document}$$(X_1,X_2)\ge 0$$\end{document}
, all the properties coincide with Cov
\documentclass[12pt]{minimal}\usepackage{amsmath}\usepackage{wasysym}\usepackage{amsfonts}\usepackage{amssymb}\usepackage{amsbsy}\usepackage{mathrsfs}\usepackage{upgreek}\setlength{\oddsidemargin}{-69pt}\begin{document}$$(X_1,X_2)\ge 0$$\end{document}
 . For
\documentclass[12pt]{minimal}\usepackage{amsmath}\usepackage{wasysym}\usepackage{amsfonts}\usepackage{amssymb}\usepackage{amsbsy}\usepackage{mathrsfs}\usepackage{upgreek}\setlength{\oddsidemargin}{-69pt}\begin{document}$$J=3$$\end{document}
. For
\documentclass[12pt]{minimal}\usepackage{amsmath}\usepackage{wasysym}\usepackage{amsfonts}\usepackage{amssymb}\usepackage{amsbsy}\usepackage{mathrsfs}\usepackage{upgreek}\setlength{\oddsidemargin}{-69pt}\begin{document}$$J=3$$\end{document}
 , binary random variables, Ellis (Reference Ellis, Millsap, Bolt, van der Ark and Wang2015) showed that the properties CA and
\documentclass[12pt]{minimal}\usepackage{amsmath}\usepackage{wasysym}\usepackage{amsfonts}\usepackage{amssymb}\usepackage{amsbsy}\usepackage{mathrsfs}\usepackage{upgreek}\setlength{\oddsidemargin}{-69pt}\begin{document}$$\hbox {MTP}_2$$\end{document}
, binary random variables, Ellis (Reference Ellis, Millsap, Bolt, van der Ark and Wang2015) showed that the properties CA and
\documentclass[12pt]{minimal}\usepackage{amsmath}\usepackage{wasysym}\usepackage{amsfonts}\usepackage{amssymb}\usepackage{amsbsy}\usepackage{mathrsfs}\usepackage{upgreek}\setlength{\oddsidemargin}{-69pt}\begin{document}$$\hbox {MTP}_2$$\end{document}
 coincide. Also, the properties A and SPOD coincide (‘Appendix’), as shown in Fig. 1 (right).
Hierarchical relationships between the observable properties, for J binary variables.

1.3. Practical Considerations
Figure 2 also shows the natural logarithm of the number of restrictions v imposed on the multivariate distribution of the item variables by the observable properties in Fig. 1. The bold line is included for reference and shows that the number of restrictions imposed by CA fast exceeds
\documentclass[12pt]{minimal}\usepackage{amsmath}\usepackage{wasysym}\usepackage{amsfonts}\usepackage{amssymb}\usepackage{amsbsy}\usepackage{mathrsfs}\usepackage{upgreek}\setlength{\oddsidemargin}{-69pt}\begin{document}$$10^J$$\end{document}
 for
\documentclass[12pt]{minimal}\usepackage{amsmath}\usepackage{wasysym}\usepackage{amsfonts}\usepackage{amssymb}\usepackage{amsbsy}\usepackage{mathrsfs}\usepackage{upgreek}\setlength{\oddsidemargin}{-69pt}\begin{document}$$J>6$$\end{document}
for
\documentclass[12pt]{minimal}\usepackage{amsmath}\usepackage{wasysym}\usepackage{amsfonts}\usepackage{amssymb}\usepackage{amsbsy}\usepackage{mathrsfs}\usepackage{upgreek}\setlength{\oddsidemargin}{-69pt}\begin{document}$$J>6$$\end{document}
 . This means that an exhaustive or complete test of CA is practically infeasible for more than five items (Bartolucci & Forcina, Reference Bartolucci and Forcina2005; De Gooijer & Yuan, Reference De Gooijer and Yuan2011).
The number of restrictions imposed by the observable properties as a function of J.

The many inequality restrictions imposed by the various properties limit the use of likelihood ratio tests (Bartolucci & Forcina, Reference Bartolucci and Forcina2000, Reference Bartolucci and Forcina2005; Tijmstra et al., Reference Tijmstra, Hessen, Van der Heijden and Sijtsma2013) that require the estimation of
\documentclass[12pt]{minimal}\usepackage{amsmath}\usepackage{wasysym}\usepackage{amsfonts}\usepackage{amssymb}\usepackage{amsbsy}\usepackage{mathrsfs}\usepackage{upgreek}\setlength{\oddsidemargin}{-69pt}\begin{document}$$\varvec{p}$$\end{document}
 under all constraints imposed by the restriction. Also, obtaining the distribution of the test statistics often involves simulations, where the problem is similar to Bayesian methods for testing the properties (e.g., Tijmstra et al., Reference Tijmstra, Hoijtink and Sijtsma2015, for MM), in that the agreement to all v restrictions need to be assessed for many samples of
\documentclass[12pt]{minimal}\usepackage{amsmath}\usepackage{wasysym}\usepackage{amsfonts}\usepackage{amssymb}\usepackage{amsbsy}\usepackage{mathrsfs}\usepackage{upgreek}\setlength{\oddsidemargin}{-69pt}\begin{document}$$\varvec{p}$$\end{document}
under all constraints imposed by the restriction. Also, obtaining the distribution of the test statistics often involves simulations, where the problem is similar to Bayesian methods for testing the properties (e.g., Tijmstra et al., Reference Tijmstra, Hoijtink and Sijtsma2015, for MM), in that the agreement to all v restrictions need to be assessed for many samples of
\documentclass[12pt]{minimal}\usepackage{amsmath}\usepackage{wasysym}\usepackage{amsfonts}\usepackage{amssymb}\usepackage{amsbsy}\usepackage{mathrsfs}\usepackage{upgreek}\setlength{\oddsidemargin}{-69pt}\begin{document}$$\varvec{p}$$\end{document}
 . For local (diagnostic) tests, as performed in Mokken scale analysis (Molenaar & Sijtsma, Reference Molenaar and Sijtsma2000; Van der Ark, Reference Van der Ark2007), the problem induced by the many restrictions is that of multiple testing (Ellis, Reference Ellis2014).
Beside the many restrictions, another problem for assessing the observable properties relates to sparseness of observations. Because the number of response patterns
\documentclass[12pt]{minimal}\usepackage{amsmath}\usepackage{wasysym}\usepackage{amsfonts}\usepackage{amssymb}\usepackage{amsbsy}\usepackage{mathrsfs}\usepackage{upgreek}\setlength{\oddsidemargin}{-69pt}\begin{document}$$\varvec{x}$$\end{document}
 increases exponentially with the number of items, many of these response patterns will be expected to have sparse observations, even for large sample sizes. The sparse observations may thus not only limit the extent to which one can rely on the asymptotic results of a likelihood ratio test, but also make the results of locally performed tests sensitive to sampling error.
Not all properties are equally sensitive to sparse observation. By pertaining only to the (marginal) bivariate distributions, the assessment of property of NC will generally involve fewer number of sparse observations than
\documentclass[12pt]{minimal}\usepackage{amsmath}\usepackage{wasysym}\usepackage{amsfonts}\usepackage{amssymb}\usepackage{amsbsy}\usepackage{mathrsfs}\usepackage{upgreek}\setlength{\oddsidemargin}{-69pt}\begin{document}$$\hbox {MTP}_2$$\end{document}
 , for example, where each restriction involves the joint distribution of four response patterns. For illustration, data on the performance of 425 pupils on four transitive reasoning tasks (Length) were analyzed (Verweij et al., Reference Verweij, Sijtsma and Koops1996, available from the mokken package, Van der Ark, Reference Van der Ark2007). Two of the vectors
\documentclass[12pt]{minimal}\usepackage{amsmath}\usepackage{wasysym}\usepackage{amsfonts}\usepackage{amssymb}\usepackage{amsbsy}\usepackage{mathrsfs}\usepackage{upgreek}\setlength{\oddsidemargin}{-69pt}\begin{document}$$\varvec{x}$$\end{document}
, for example, where each restriction involves the joint distribution of four response patterns. For illustration, data on the performance of 425 pupils on four transitive reasoning tasks (Length) were analyzed (Verweij et al., Reference Verweij, Sijtsma and Koops1996, available from the mokken package, Van der Ark, Reference Van der Ark2007). Two of the vectors
\documentclass[12pt]{minimal}\usepackage{amsmath}\usepackage{wasysym}\usepackage{amsfonts}\usepackage{amssymb}\usepackage{amsbsy}\usepackage{mathrsfs}\usepackage{upgreek}\setlength{\oddsidemargin}{-69pt}\begin{document}$$\varvec{x}$$\end{document}
 contained no observations, so that the active number of restrictions of CA was reduced by 12–78. Figure 3 shows the 78 estimated log-odds ratios in ascending order, along with their 95% confidence interval. The figure shows that there are 33 violations of CA; one significant violation. Figure 3 also shows the 15 out of 24 (active) logs-odds ratios for property
\documentclass[12pt]{minimal}\usepackage{amsmath}\usepackage{wasysym}\usepackage{amsfonts}\usepackage{amssymb}\usepackage{amsbsy}\usepackage{mathrsfs}\usepackage{upgreek}\setlength{\oddsidemargin}{-69pt}\begin{document}$$\hbox {MTP}_2$$\end{document}
contained no observations, so that the active number of restrictions of CA was reduced by 12–78. Figure 3 shows the 78 estimated log-odds ratios in ascending order, along with their 95% confidence interval. The figure shows that there are 33 violations of CA; one significant violation. Figure 3 also shows the 15 out of 24 (active) logs-odds ratios for property
\documentclass[12pt]{minimal}\usepackage{amsmath}\usepackage{wasysym}\usepackage{amsfonts}\usepackage{amssymb}\usepackage{amsbsy}\usepackage{mathrsfs}\usepackage{upgreek}\setlength{\oddsidemargin}{-69pt}\begin{document}$$\hbox {MTP}_2$$\end{document}
 and the six estimated values for NC. Comparing the results of
\documentclass[12pt]{minimal}\usepackage{amsmath}\usepackage{wasysym}\usepackage{amsfonts}\usepackage{amssymb}\usepackage{amsbsy}\usepackage{mathrsfs}\usepackage{upgreek}\setlength{\oddsidemargin}{-69pt}\begin{document}$$\hbox {MTP}_2$$\end{document}
and the six estimated values for NC. Comparing the results of
\documentclass[12pt]{minimal}\usepackage{amsmath}\usepackage{wasysym}\usepackage{amsfonts}\usepackage{amssymb}\usepackage{amsbsy}\usepackage{mathrsfs}\usepackage{upgreek}\setlength{\oddsidemargin}{-69pt}\begin{document}$$\hbox {MTP}_2$$\end{document}
 to NC clearly illustrates how the property NC is more robust to sampling error, as reflected by the narrow confidence intervals compared to those for
\documentclass[12pt]{minimal}\usepackage{amsmath}\usepackage{wasysym}\usepackage{amsfonts}\usepackage{amssymb}\usepackage{amsbsy}\usepackage{mathrsfs}\usepackage{upgreek}\setlength{\oddsidemargin}{-69pt}\begin{document}$$\hbox {MTP}_2$$\end{document}
to NC clearly illustrates how the property NC is more robust to sampling error, as reflected by the narrow confidence intervals compared to those for
\documentclass[12pt]{minimal}\usepackage{amsmath}\usepackage{wasysym}\usepackage{amsfonts}\usepackage{amssymb}\usepackage{amsbsy}\usepackage{mathrsfs}\usepackage{upgreek}\setlength{\oddsidemargin}{-69pt}\begin{document}$$\hbox {MTP}_2$$\end{document}
 . However, NC is also associated with a substantial loss of power, with the log-odds ratios generally located more to the right.
Log-odds ratios for the properties CA,
\documentclass[12pt]{minimal}\usepackage{amsmath}\usepackage{wasysym}\usepackage{amsfonts}\usepackage{amssymb}\usepackage{amsbsy}\usepackage{mathrsfs}\usepackage{upgreek}\setlength{\oddsidemargin}{-69pt}\begin{document}$$\hbox {MTP}_2$$\end{document}
 , and NC (for each in ascending order), along with the 95% confidence intervals.

1.4. Properties for Trivariate Distributions of Item Triplets
The previous section showed that, on the one hand, the property NC overcomes the problem of sparse observations by pertaining to the bivariate (marginal) distributions of pairs of items, but is also associated with a substantial loss of information about the validity of the MH model assumptions. On the other hand, the property
\documentclass[12pt]{minimal}\usepackage{amsmath}\usepackage{wasysym}\usepackage{amsfonts}\usepackage{amssymb}\usepackage{amsbsy}\usepackage{mathrsfs}\usepackage{upgreek}\setlength{\oddsidemargin}{-69pt}\begin{document}$$\hbox {MTP}_2$$\end{document}
 does appear to be more powerful in detecting violations of the model assumptions, but is rather sensitive to sparseness of observations, rendering it sensitive to sampling error.
The property NPC utilizes the information contained in the trivariate distributions of all triplets of item variables and thereby strikes a balance between the practical limitations that affect property NC and
\documentclass[12pt]{minimal}\usepackage{amsmath}\usepackage{wasysym}\usepackage{amsfonts}\usepackage{amssymb}\usepackage{amsbsy}\usepackage{mathrsfs}\usepackage{upgreek}\setlength{\oddsidemargin}{-69pt}\begin{document}$$\hbox {MTP}_2$$\end{document}
 . Property NPC imposes tighter constraints on
\documentclass[12pt]{minimal}\usepackage{amsmath}\usepackage{wasysym}\usepackage{amsfonts}\usepackage{amssymb}\usepackage{amsbsy}\usepackage{mathrsfs}\usepackage{upgreek}\setlength{\oddsidemargin}{-69pt}\begin{document}$$\varvec{p}$$\end{document}
. Property NPC imposes tighter constraints on
\documentclass[12pt]{minimal}\usepackage{amsmath}\usepackage{wasysym}\usepackage{amsfonts}\usepackage{amssymb}\usepackage{amsbsy}\usepackage{mathrsfs}\usepackage{upgreek}\setlength{\oddsidemargin}{-69pt}\begin{document}$$\varvec{p}$$\end{document}
 than NC and might therefor provide a more powerful test for detecting violations of the MH model assumptions. Also, the trivariate distribution of item triplets will generally contain few sparse observations for sufficiently large sample sizes,
\documentclass[12pt]{minimal}\usepackage{amsmath}\usepackage{wasysym}\usepackage{amsfonts}\usepackage{amssymb}\usepackage{amsbsy}\usepackage{mathrsfs}\usepackage{upgreek}\setlength{\oddsidemargin}{-69pt}\begin{document}$$N>200$$\end{document}
than NC and might therefor provide a more powerful test for detecting violations of the MH model assumptions. Also, the trivariate distribution of item triplets will generally contain few sparse observations for sufficiently large sample sizes,
\documentclass[12pt]{minimal}\usepackage{amsmath}\usepackage{wasysym}\usepackage{amsfonts}\usepackage{amssymb}\usepackage{amsbsy}\usepackage{mathrsfs}\usepackage{upgreek}\setlength{\oddsidemargin}{-69pt}\begin{document}$$N>200$$\end{document}
 , say.
Like property NPC, consider applying the multivariate observable properties to the trivariate distributions of all triplets of item variables, and let 3-CA denote the property CA applied to the trivariate distributions of all triplets of items (similar for the other properties). Then, the properties applied to the trivariate distributions are related as shown in Fig. 4. The top two rows in Fig. 4 coincide in case
\documentclass[12pt]{minimal}\usepackage{amsmath}\usepackage{wasysym}\usepackage{amsfonts}\usepackage{amssymb}\usepackage{amsbsy}\usepackage{mathrsfs}\usepackage{upgreek}\setlength{\oddsidemargin}{-69pt}\begin{document}$$J=3$$\end{document}
 .
.
Hierarchical relationships between the observable properties (excluding MM), for
\documentclass[12pt]{minimal}\usepackage{amsmath}\usepackage{wasysym}\usepackage{amsfonts}\usepackage{amssymb}\usepackage{amsbsy}\usepackage{mathrsfs}\usepackage{upgreek}\setlength{\oddsidemargin}{-69pt}\begin{document}$$J\ge 4$$\end{document}
 binary variables.

2. Incomplete Tests of Conditional Association
In this section, the tightness of the constraints imposed on
\documentclass[12pt]{minimal}\usepackage{amsmath}\usepackage{wasysym}\usepackage{amsfonts}\usepackage{amssymb}\usepackage{amsbsy}\usepackage{mathrsfs}\usepackage{upgreek}\setlength{\oddsidemargin}{-69pt}\begin{document}$$\varvec{p}$$\end{document}
 by the observable properties is investigated. With property CA implying all the other properties considered in the previous section, the other properties for assessing the MH model assumptions can be considered to be incomplete tests of CA; in the sense the properties can be obtained by relaxing some of the restrictions imposed by CA (Maraun et al., Reference Maraun, Jackson, Luccock, Belfer and Chrisjohn1998). In practice, we rely on such incomplete tests, due to the large number of restrictions CA imposes. However, the number of inequality restrictions does not provide a clear indication of the tightness of the constraints imposed by the observable properties. For example, for
\documentclass[12pt]{minimal}\usepackage{amsmath}\usepackage{wasysym}\usepackage{amsfonts}\usepackage{amssymb}\usepackage{amsbsy}\usepackage{mathrsfs}\usepackage{upgreek}\setlength{\oddsidemargin}{-69pt}\begin{document}$$J=4$$\end{document}
by the observable properties is investigated. With property CA implying all the other properties considered in the previous section, the other properties for assessing the MH model assumptions can be considered to be incomplete tests of CA; in the sense the properties can be obtained by relaxing some of the restrictions imposed by CA (Maraun et al., Reference Maraun, Jackson, Luccock, Belfer and Chrisjohn1998). In practice, we rely on such incomplete tests, due to the large number of restrictions CA imposes. However, the number of inequality restrictions does not provide a clear indication of the tightness of the constraints imposed by the observable properties. For example, for
\documentclass[12pt]{minimal}\usepackage{amsmath}\usepackage{wasysym}\usepackage{amsfonts}\usepackage{amssymb}\usepackage{amsbsy}\usepackage{mathrsfs}\usepackage{upgreek}\setlength{\oddsidemargin}{-69pt}\begin{document}$$J=4$$\end{document}
 property A imposed 99 restrictions, which are all implied by the 24 constraints imposed by
\documentclass[12pt]{minimal}\usepackage{amsmath}\usepackage{wasysym}\usepackage{amsfonts}\usepackage{amssymb}\usepackage{amsbsy}\usepackage{mathrsfs}\usepackage{upgreek}\setlength{\oddsidemargin}{-69pt}\begin{document}$$\hbox {MTP}_2$$\end{document}
property A imposed 99 restrictions, which are all implied by the 24 constraints imposed by
\documentclass[12pt]{minimal}\usepackage{amsmath}\usepackage{wasysym}\usepackage{amsfonts}\usepackage{amssymb}\usepackage{amsbsy}\usepackage{mathrsfs}\usepackage{upgreek}\setlength{\oddsidemargin}{-69pt}\begin{document}$$\hbox {MTP}_2$$\end{document}
 . Figure 1 shows the hierarchical relationships of the observable properties, but it does not show how much information is lost when, instead of CA, an incomplete test of CA is used to make inferences about the MH model assumptions. The advantage of the use of incomplete tests is that their assessment generally involves fewer inequality restrictions, and these incomplete tests are generally less sensitive to sparse observations. As a consequence, incomplete tests of CA are practically useful, but only to the extent that they are not associated with a substantial loss of information about CA. Such a loss of information would namely result in loss of power when assessing the MH model assumptions.
In the application of their likelihood ratio procedure, Bartolucci and Forcina (Reference Bartolucci and Forcina2005) observed that only a few CA restrictions were ‘activated’ in addition the restrictions imposed by
\documentclass[12pt]{minimal}\usepackage{amsmath}\usepackage{wasysym}\usepackage{amsfonts}\usepackage{amssymb}\usepackage{amsbsy}\usepackage{mathrsfs}\usepackage{upgreek}\setlength{\oddsidemargin}{-69pt}\begin{document}$$\hbox {MTP}_2$$\end{document}
 . This suggests that little information may be lost when
\documentclass[12pt]{minimal}\usepackage{amsmath}\usepackage{wasysym}\usepackage{amsfonts}\usepackage{amssymb}\usepackage{amsbsy}\usepackage{mathrsfs}\usepackage{upgreek}\setlength{\oddsidemargin}{-69pt}\begin{document}$$\hbox {MTP}_2$$\end{document}
. This suggests that little information may be lost when
\documentclass[12pt]{minimal}\usepackage{amsmath}\usepackage{wasysym}\usepackage{amsfonts}\usepackage{amssymb}\usepackage{amsbsy}\usepackage{mathrsfs}\usepackage{upgreek}\setlength{\oddsidemargin}{-69pt}\begin{document}$$\hbox {MTP}_2$$\end{document}
 is assessed, instead of property CA. Here, the tightness of the constraints imposed on
\documentclass[12pt]{minimal}\usepackage{amsmath}\usepackage{wasysym}\usepackage{amsfonts}\usepackage{amssymb}\usepackage{amsbsy}\usepackage{mathrsfs}\usepackage{upgreek}\setlength{\oddsidemargin}{-69pt}\begin{document}$$\varvec{p}$$\end{document}
is assessed, instead of property CA. Here, the tightness of the constraints imposed on
\documentclass[12pt]{minimal}\usepackage{amsmath}\usepackage{wasysym}\usepackage{amsfonts}\usepackage{amssymb}\usepackage{amsbsy}\usepackage{mathrsfs}\usepackage{upgreek}\setlength{\oddsidemargin}{-69pt}\begin{document}$$\varvec{p}$$\end{document}
 is investigated in terms of model complexities, which provides a general assessment of the observable properties that does not rely on the data. With the observable properties all impose inequality restrictions on the probabilities associated with the multinomial frequencies, we can think of each of these properties as a model for the multinomial response frequencies and rephrase the choice for an incomplete test for the MH model assumptions as a model selection problem.
In general, model selection involves a tradeoff between the goodness of fit of the models under consideration and the model complexities. A model is selected, if it can accurately predict future data. This requires accurate model-data fit, while also providing a description of the data that is as simple as possible (Occam’s razor), as not to overfit the data. Statistics that balance goodness of fit against model complexity include Akaike’s (Reference Akaike1974) AIC and Schwarz’s (Reference Schwarz1978) BIC, where the goodness of fit is expressed by the likelihood function, and the model is penalized by the estimated number of parameters. Complexity, however, involves more than the number of estimated parameter (Myung et al., Reference Myung, Pitt and Kim2005). For example, Bonifay and Cai (Reference Bonifay and Cai2017) found that different parametric models for response data that had the same number of parameters differed in the extent to which they fit diverse patterns of data. They thereby showed that model complexity is only partly described by the number of model parameters (Pitt et al., Reference Pitt, Myung and Zhang2002; Preacher, Reference Preacher2006). Similar to the idea of fitting propensity suggested by Preacher (Reference Preacher2006), we here define the complexities of the observable properties as the proportion of samples from the (unconstrained) multinomial model that satisfy the inequality constraints of the observable properties. By assigning a distribution to the multinomial probability parameters, this notion of complexity corresponds to the definition of model complexity for Bayes factors, with the distribution of the multinomial parameters taking up the role of the encompassing prior (Hoijtink, Reference Hoijtink2011; Klugkist & Hoijtink, Reference Klugkist and Hoijtink2007). A more complex property is then said to impose looser constraints on the outcomes, thus fitting a wider range of patters of data. In this respect, a higher complexity means that the property is generally less sensitive to model violations. Hence, property CA is the least complex of the properties considered, and NC is the most complex.
2.1. On the Complexity of the Observable Properties
A simulation study was performed as an initial assessment of the complexities of the observable properties, for
\documentclass[12pt]{minimal}\usepackage{amsmath}\usepackage{wasysym}\usepackage{amsfonts}\usepackage{amssymb}\usepackage{amsbsy}\usepackage{mathrsfs}\usepackage{upgreek}\setlength{\oddsidemargin}{-69pt}\begin{document}$$J=3$$\end{document}
 . A total of one million vectors
\documentclass[12pt]{minimal}\usepackage{amsmath}\usepackage{wasysym}\usepackage{amsfonts}\usepackage{amssymb}\usepackage{amsbsy}\usepackage{mathrsfs}\usepackage{upgreek}\setlength{\oddsidemargin}{-69pt}\begin{document}$$\varvec{p}$$\end{document}
. A total of one million vectors
\documentclass[12pt]{minimal}\usepackage{amsmath}\usepackage{wasysym}\usepackage{amsfonts}\usepackage{amssymb}\usepackage{amsbsy}\usepackage{mathrsfs}\usepackage{upgreek}\setlength{\oddsidemargin}{-69pt}\begin{document}$$\varvec{p}$$\end{document}
 where samples from a flat Dirichlet distribution, with
\documentclass[12pt]{minimal}\usepackage{amsmath}\usepackage{wasysym}\usepackage{amsfonts}\usepackage{amssymb}\usepackage{amsbsy}\usepackage{mathrsfs}\usepackage{upgreek}\setlength{\oddsidemargin}{-69pt}\begin{document}$$\varvec{p}>\varvec{0}$$\end{document}
where samples from a flat Dirichlet distribution, with
\documentclass[12pt]{minimal}\usepackage{amsmath}\usepackage{wasysym}\usepackage{amsfonts}\usepackage{amssymb}\usepackage{amsbsy}\usepackage{mathrsfs}\usepackage{upgreek}\setlength{\oddsidemargin}{-69pt}\begin{document}$$\varvec{p}>\varvec{0}$$\end{document}
 and
\documentclass[12pt]{minimal}\usepackage{amsmath}\usepackage{wasysym}\usepackage{amsfonts}\usepackage{amssymb}\usepackage{amsbsy}\usepackage{mathrsfs}\usepackage{upgreek}\setlength{\oddsidemargin}{-69pt}\begin{document}$$\varvec{1}^\prime \varvec{p}=1$$\end{document}
and
\documentclass[12pt]{minimal}\usepackage{amsmath}\usepackage{wasysym}\usepackage{amsfonts}\usepackage{amssymb}\usepackage{amsbsy}\usepackage{mathrsfs}\usepackage{upgreek}\setlength{\oddsidemargin}{-69pt}\begin{document}$$\varvec{1}^\prime \varvec{p}=1$$\end{document}
 . These samples provided a uniform coverage of the outcome space of
\documentclass[12pt]{minimal}\usepackage{amsmath}\usepackage{wasysym}\usepackage{amsfonts}\usepackage{amssymb}\usepackage{amsbsy}\usepackage{mathrsfs}\usepackage{upgreek}\setlength{\oddsidemargin}{-69pt}\begin{document}$$\varvec{p}$$\end{document}
. These samples provided a uniform coverage of the outcome space of
\documentclass[12pt]{minimal}\usepackage{amsmath}\usepackage{wasysym}\usepackage{amsfonts}\usepackage{amssymb}\usepackage{amsbsy}\usepackage{mathrsfs}\usepackage{upgreek}\setlength{\oddsidemargin}{-69pt}\begin{document}$$\varvec{p}$$\end{document}
 (cf. Bonifay & Cai, Reference Bonifay and Cai2017). Subsequently, for each vector
\documentclass[12pt]{minimal}\usepackage{amsmath}\usepackage{wasysym}\usepackage{amsfonts}\usepackage{amssymb}\usepackage{amsbsy}\usepackage{mathrsfs}\usepackage{upgreek}\setlength{\oddsidemargin}{-69pt}\begin{document}$$\varvec{p}$$\end{document}
(cf. Bonifay & Cai, Reference Bonifay and Cai2017). Subsequently, for each vector
\documentclass[12pt]{minimal}\usepackage{amsmath}\usepackage{wasysym}\usepackage{amsfonts}\usepackage{amssymb}\usepackage{amsbsy}\usepackage{mathrsfs}\usepackage{upgreek}\setlength{\oddsidemargin}{-69pt}\begin{document}$$\varvec{p}$$\end{document}
 , all the observable properties in Fig. 1 (right) were assessed. The proportion of samples that satisfy a given observable property then provides an indication of the complexity of the property.
The results of the simulation show that a total of 163,627 samples (16.36%) satisfy either NC or MM or both, with a small percentage (0.36%) that only satisfied MM, and about 5.04% that satisfy both NC and MM. Figure 5 shows the overlap between the observable properties, with the conditional percentages, given that either NC or MM or both are satisfied. Note that the intersection of NC and MM is contained in SPOD. In ‘Appendix,’ it is proven that this is always the case. Figure 5 shows that SPOD accounts for about 75.08% of all samples that satisfy either NC or MM. Of the 10 million samples (unconditionally), CA was satisfied by about 2.09% of the samples. The constraints imposed by CA are considerably tighter than those imposed by the other observable properties, with no one property containing more than 40% (38.56% for MM) of samples that also agree with CA. If both NC and MM satisfied, then about 41.35% of these samples also satisfy CA.
Triangular Venn diagram of properties in Fig. 1 (
\documentclass[12pt]{minimal}\usepackage{amsmath}\usepackage{wasysym}\usepackage{amsfonts}\usepackage{amssymb}\usepackage{amsbsy}\usepackage{mathrsfs}\usepackage{upgreek}\setlength{\oddsidemargin}{-69pt}\begin{document}$$J=3$$\end{document}
 ), with the overlap between NC and MM in gray, with the conditional percentages, given either NC or MM (or both).

2.2. Scalability Coefficient
Rather than using an incomplete test of CA to assess the MH model assumptions, the associations between the response variables can be expressed by a statistics, like a scalability coefficient. A desirable property of such a statistic would be that it is related to the tightness of the imposed bounds on
\documentclass[12pt]{minimal}\usepackage{amsmath}\usepackage{wasysym}\usepackage{amsfonts}\usepackage{amssymb}\usepackage{amsbsy}\usepackage{mathrsfs}\usepackage{upgreek}\setlength{\oddsidemargin}{-69pt}\begin{document}$$\varvec{p}$$\end{document}
 (Kimeldorf & Sampson, Reference Kimeldorf and Sampson1989), such that the value of the statistic corresponds to the hierarchical relationship in Fig. 1. To assess whether property CA can be reliably inferred from the value of scalability coefficients H, the coefficient was computed for each of the previously sampled vectors
\documentclass[12pt]{minimal}\usepackage{amsmath}\usepackage{wasysym}\usepackage{amsfonts}\usepackage{amssymb}\usepackage{amsbsy}\usepackage{mathrsfs}\usepackage{upgreek}\setlength{\oddsidemargin}{-69pt}\begin{document}$$\varvec{p}$$\end{document}
(Kimeldorf & Sampson, Reference Kimeldorf and Sampson1989), such that the value of the statistic corresponds to the hierarchical relationship in Fig. 1. To assess whether property CA can be reliably inferred from the value of scalability coefficients H, the coefficient was computed for each of the previously sampled vectors
\documentclass[12pt]{minimal}\usepackage{amsmath}\usepackage{wasysym}\usepackage{amsfonts}\usepackage{amssymb}\usepackage{amsbsy}\usepackage{mathrsfs}\usepackage{upgreek}\setlength{\oddsidemargin}{-69pt}\begin{document}$$\varvec{p}$$\end{document}
 (e.g., Roskam et al., Reference Roskam, Van den Wollenberg and Jansen1986, p. 266).
Figure 6 shows the estimated conditional densities of H, given each of the observable properties in Fig. 1 (right). Although the ordering of these densities roughly agrees with the hierarchical relationships between the properties, Fig. 6 shows that the densities have a considerable overlap. This means that it is practically impossible to reliably infer which property holds, given the value of H. Moreover, the value of coefficient H was below the default recommended value of 0.30 for 40.75% of the cases for which property CA was satisfied.
Conditional densities (vertically displayed) of the scalability H, given the properties in Fig. 1 (
\documentclass[12pt]{minimal}\usepackage{amsmath}\usepackage{wasysym}\usepackage{amsfonts}\usepackage{amssymb}\usepackage{amsbsy}\usepackage{mathrsfs}\usepackage{upgreek}\setlength{\oddsidemargin}{-69pt}\begin{document}$$J=3$$\end{document}
 ), along with the percentages
\documentclass[12pt]{minimal}\usepackage{amsmath}\usepackage{wasysym}\usepackage{amsfonts}\usepackage{amssymb}\usepackage{amsbsy}\usepackage{mathrsfs}\usepackage{upgreek}\setlength{\oddsidemargin}{-69pt}\begin{document}$$H<0.30$$\end{document}
), along with the percentages
\documentclass[12pt]{minimal}\usepackage{amsmath}\usepackage{wasysym}\usepackage{amsfonts}\usepackage{amssymb}\usepackage{amsbsy}\usepackage{mathrsfs}\usepackage{upgreek}\setlength{\oddsidemargin}{-69pt}\begin{document}$$H<0.30$$\end{document}
 .
.

2.3. Manifest Monotonicity
Property MM was found to be the least complex of the incomplete tests of CA for
\documentclass[12pt]{minimal}\usepackage{amsmath}\usepackage{wasysym}\usepackage{amsfonts}\usepackage{amssymb}\usepackage{amsbsy}\usepackage{mathrsfs}\usepackage{upgreek}\setlength{\oddsidemargin}{-69pt}\begin{document}$$J=3$$\end{document}
 , imposing the tightest constraints on
\documentclass[12pt]{minimal}\usepackage{amsmath}\usepackage{wasysym}\usepackage{amsfonts}\usepackage{amssymb}\usepackage{amsbsy}\usepackage{mathrsfs}\usepackage{upgreek}\setlength{\oddsidemargin}{-69pt}\begin{document}$$\varvec{p}$$\end{document}
, imposing the tightest constraints on
\documentclass[12pt]{minimal}\usepackage{amsmath}\usepackage{wasysym}\usepackage{amsfonts}\usepackage{amssymb}\usepackage{amsbsy}\usepackage{mathrsfs}\usepackage{upgreek}\setlength{\oddsidemargin}{-69pt}\begin{document}$$\varvec{p}$$\end{document}
 after CA. Here, we further explore the discrepancy in complexity between MM and CA as J increases. To this end, a Gibbs sampler was employed to sample 10,000 vectors
\documentclass[12pt]{minimal}\usepackage{amsmath}\usepackage{wasysym}\usepackage{amsfonts}\usepackage{amssymb}\usepackage{amsbsy}\usepackage{mathrsfs}\usepackage{upgreek}\setlength{\oddsidemargin}{-69pt}\begin{document}$$\varvec{p}$$\end{document}
after CA. Here, we further explore the discrepancy in complexity between MM and CA as J increases. To this end, a Gibbs sampler was employed to sample 10,000 vectors
\documentclass[12pt]{minimal}\usepackage{amsmath}\usepackage{wasysym}\usepackage{amsfonts}\usepackage{amssymb}\usepackage{amsbsy}\usepackage{mathrsfs}\usepackage{upgreek}\setlength{\oddsidemargin}{-69pt}\begin{document}$$\varvec{p}$$\end{document}
 under the constraints imposed by MM and assess the percentage of these samples that also satisfy CA. We first explain the Gibbs sampling procedure (cf. Ligtvoet & Vermunt, Reference Ligtvoet and Vermunt2012; Hoijtink & Molenaar, Reference Hoijtink and Molenaar1997).
Gibbs sampler Suppose we wish to sample a vector
\documentclass[12pt]{minimal}\usepackage{amsmath}\usepackage{wasysym}\usepackage{amsfonts}\usepackage{amssymb}\usepackage{amsbsy}\usepackage{mathrsfs}\usepackage{upgreek}\setlength{\oddsidemargin}{-69pt}\begin{document}$$\varvec{p}$$\end{document}
 from a flat Dirichlet distribution under the constraints imposed by v inequality restrictions. Also, suppose we already have the vector
\documentclass[12pt]{minimal}\usepackage{amsmath}\usepackage{wasysym}\usepackage{amsfonts}\usepackage{amssymb}\usepackage{amsbsy}\usepackage{mathrsfs}\usepackage{upgreek}\setlength{\oddsidemargin}{-69pt}\begin{document}$$\varvec{q}$$\end{document}
from a flat Dirichlet distribution under the constraints imposed by v inequality restrictions. Also, suppose we already have the vector
\documentclass[12pt]{minimal}\usepackage{amsmath}\usepackage{wasysym}\usepackage{amsfonts}\usepackage{amssymb}\usepackage{amsbsy}\usepackage{mathrsfs}\usepackage{upgreek}\setlength{\oddsidemargin}{-69pt}\begin{document}$$\varvec{q}$$\end{document}
 that satisfies these constraints. Then, we can sequentially sample the values
\documentclass[12pt]{minimal}\usepackage{amsmath}\usepackage{wasysym}\usepackage{amsfonts}\usepackage{amssymb}\usepackage{amsbsy}\usepackage{mathrsfs}\usepackage{upgreek}\setlength{\oddsidemargin}{-69pt}\begin{document}$$p_j$$\end{document}
that satisfies these constraints. Then, we can sequentially sample the values
\documentclass[12pt]{minimal}\usepackage{amsmath}\usepackage{wasysym}\usepackage{amsfonts}\usepackage{amssymb}\usepackage{amsbsy}\usepackage{mathrsfs}\usepackage{upgreek}\setlength{\oddsidemargin}{-69pt}\begin{document}$$p_j$$\end{document}
 by following the next three steps. First, compute from the inequalities imposed on
\documentclass[12pt]{minimal}\usepackage{amsmath}\usepackage{wasysym}\usepackage{amsfonts}\usepackage{amssymb}\usepackage{amsbsy}\usepackage{mathrsfs}\usepackage{upgreek}\setlength{\oddsidemargin}{-69pt}\begin{document}$$p_j$$\end{document}
by following the next three steps. First, compute from the inequalities imposed on
\documentclass[12pt]{minimal}\usepackage{amsmath}\usepackage{wasysym}\usepackage{amsfonts}\usepackage{amssymb}\usepackage{amsbsy}\usepackage{mathrsfs}\usepackage{upgreek}\setlength{\oddsidemargin}{-69pt}\begin{document}$$p_j$$\end{document}
 the maximum lower bound
\documentclass[12pt]{minimal}\usepackage{amsmath}\usepackage{wasysym}\usepackage{amsfonts}\usepackage{amssymb}\usepackage{amsbsy}\usepackage{mathrsfs}\usepackage{upgreek}\setlength{\oddsidemargin}{-69pt}\begin{document}$$a_j$$\end{document}
the maximum lower bound
\documentclass[12pt]{minimal}\usepackage{amsmath}\usepackage{wasysym}\usepackage{amsfonts}\usepackage{amssymb}\usepackage{amsbsy}\usepackage{mathrsfs}\usepackage{upgreek}\setlength{\oddsidemargin}{-69pt}\begin{document}$$a_j$$\end{document}
 and the minimum upper bounds
\documentclass[12pt]{minimal}\usepackage{amsmath}\usepackage{wasysym}\usepackage{amsfonts}\usepackage{amssymb}\usepackage{amsbsy}\usepackage{mathrsfs}\usepackage{upgreek}\setlength{\oddsidemargin}{-69pt}\begin{document}$$b_j$$\end{document}
and the minimum upper bounds
\documentclass[12pt]{minimal}\usepackage{amsmath}\usepackage{wasysym}\usepackage{amsfonts}\usepackage{amssymb}\usepackage{amsbsy}\usepackage{mathrsfs}\usepackage{upgreek}\setlength{\oddsidemargin}{-69pt}\begin{document}$$b_j$$\end{document}
 , using the values
\documentclass[12pt]{minimal}\usepackage{amsmath}\usepackage{wasysym}\usepackage{amsfonts}\usepackage{amssymb}\usepackage{amsbsy}\usepackage{mathrsfs}\usepackage{upgreek}\setlength{\oddsidemargin}{-69pt}\begin{document}$$q_1,\ldots ,q_{j-1},q_{j+1},\ldots , q_{2^J}$$\end{document}
, using the values
\documentclass[12pt]{minimal}\usepackage{amsmath}\usepackage{wasysym}\usepackage{amsfonts}\usepackage{amssymb}\usepackage{amsbsy}\usepackage{mathrsfs}\usepackage{upgreek}\setlength{\oddsidemargin}{-69pt}\begin{document}$$q_1,\ldots ,q_{j-1},q_{j+1},\ldots , q_{2^J}$$\end{document}
 . For example, for
\documentclass[12pt]{minimal}\usepackage{amsmath}\usepackage{wasysym}\usepackage{amsfonts}\usepackage{amssymb}\usepackage{amsbsy}\usepackage{mathrsfs}\usepackage{upgreek}\setlength{\oddsidemargin}{-69pt}\begin{document}$$J=3$$\end{document}
. For example, for
\documentclass[12pt]{minimal}\usepackage{amsmath}\usepackage{wasysym}\usepackage{amsfonts}\usepackage{amssymb}\usepackage{amsbsy}\usepackage{mathrsfs}\usepackage{upgreek}\setlength{\oddsidemargin}{-69pt}\begin{document}$$J=3$$\end{document}
 , the element
\documentclass[12pt]{minimal}\usepackage{amsmath}\usepackage{wasysym}\usepackage{amsfonts}\usepackage{amssymb}\usepackage{amsbsy}\usepackage{mathrsfs}\usepackage{upgreek}\setlength{\oddsidemargin}{-69pt}\begin{document}$$p_2$$\end{document}
, the element
\documentclass[12pt]{minimal}\usepackage{amsmath}\usepackage{wasysym}\usepackage{amsfonts}\usepackage{amssymb}\usepackage{amsbsy}\usepackage{mathrsfs}\usepackage{upgreek}\setlength{\oddsidemargin}{-69pt}\begin{document}$$p_2$$\end{document}
 is bounded from above by MM by the first restriction in (3):
\documentclass[12pt]{minimal}\usepackage{amsmath}\usepackage{wasysym}\usepackage{amsfonts}\usepackage{amssymb}\usepackage{amsbsy}\usepackage{mathrsfs}\usepackage{upgreek}\setlength{\oddsidemargin}{-69pt}\begin{document}$$p_2\le q_1(q_7+q_7)/q_5-q_3$$\end{document}
is bounded from above by MM by the first restriction in (3):
\documentclass[12pt]{minimal}\usepackage{amsmath}\usepackage{wasysym}\usepackage{amsfonts}\usepackage{amssymb}\usepackage{amsbsy}\usepackage{mathrsfs}\usepackage{upgreek}\setlength{\oddsidemargin}{-69pt}\begin{document}$$p_2\le q_1(q_7+q_7)/q_5-q_3$$\end{document}
 . Second, sample a value
\documentclass[12pt]{minimal}\usepackage{amsmath}\usepackage{wasysym}\usepackage{amsfonts}\usepackage{amssymb}\usepackage{amsbsy}\usepackage{mathrsfs}\usepackage{upgreek}\setlength{\oddsidemargin}{-69pt}\begin{document}$$q^*_j$$\end{document}
. Second, sample a value
\documentclass[12pt]{minimal}\usepackage{amsmath}\usepackage{wasysym}\usepackage{amsfonts}\usepackage{amssymb}\usepackage{amsbsy}\usepackage{mathrsfs}\usepackage{upgreek}\setlength{\oddsidemargin}{-69pt}\begin{document}$$q^*_j$$\end{document}
 from a gamma distribution (unit shape) that is truncated from below by
\documentclass[12pt]{minimal}\usepackage{amsmath}\usepackage{wasysym}\usepackage{amsfonts}\usepackage{amssymb}\usepackage{amsbsy}\usepackage{mathrsfs}\usepackage{upgreek}\setlength{\oddsidemargin}{-69pt}\begin{document}$$\max (0,a_j)$$\end{document}
from a gamma distribution (unit shape) that is truncated from below by
\documentclass[12pt]{minimal}\usepackage{amsmath}\usepackage{wasysym}\usepackage{amsfonts}\usepackage{amssymb}\usepackage{amsbsy}\usepackage{mathrsfs}\usepackage{upgreek}\setlength{\oddsidemargin}{-69pt}\begin{document}$$\max (0,a_j)$$\end{document}
 and from above by
\documentclass[12pt]{minimal}\usepackage{amsmath}\usepackage{wasysym}\usepackage{amsfonts}\usepackage{amssymb}\usepackage{amsbsy}\usepackage{mathrsfs}\usepackage{upgreek}\setlength{\oddsidemargin}{-69pt}\begin{document}$$b_j$$\end{document}
and from above by
\documentclass[12pt]{minimal}\usepackage{amsmath}\usepackage{wasysym}\usepackage{amsfonts}\usepackage{amssymb}\usepackage{amsbsy}\usepackage{mathrsfs}\usepackage{upgreek}\setlength{\oddsidemargin}{-69pt}\begin{document}$$b_j$$\end{document}
 . From this, the new vector
\documentclass[12pt]{minimal}\usepackage{amsmath}\usepackage{wasysym}\usepackage{amsfonts}\usepackage{amssymb}\usepackage{amsbsy}\usepackage{mathrsfs}\usepackage{upgreek}\setlength{\oddsidemargin}{-69pt}\begin{document}$$\varvec{q}=\varvec{q}^*/\varvec{1}^\prime \varvec{q}^*$$\end{document}
. From this, the new vector
\documentclass[12pt]{minimal}\usepackage{amsmath}\usepackage{wasysym}\usepackage{amsfonts}\usepackage{amssymb}\usepackage{amsbsy}\usepackage{mathrsfs}\usepackage{upgreek}\setlength{\oddsidemargin}{-69pt}\begin{document}$$\varvec{q}=\varvec{q}^*/\varvec{1}^\prime \varvec{q}^*$$\end{document}
 is obtained, with
\documentclass[12pt]{minimal}\usepackage{amsmath}\usepackage{wasysym}\usepackage{amsfonts}\usepackage{amssymb}\usepackage{amsbsy}\usepackage{mathrsfs}\usepackage{upgreek}\setlength{\oddsidemargin}{-69pt}\begin{document}$$\varvec{q}^*=(q_1,\ldots ,q_{j-1},q_j^*,q_{j+1},\ldots , q_{2^J})^\prime $$\end{document}
is obtained, with
\documentclass[12pt]{minimal}\usepackage{amsmath}\usepackage{wasysym}\usepackage{amsfonts}\usepackage{amssymb}\usepackage{amsbsy}\usepackage{mathrsfs}\usepackage{upgreek}\setlength{\oddsidemargin}{-69pt}\begin{document}$$\varvec{q}^*=(q_1,\ldots ,q_{j-1},q_j^*,q_{j+1},\ldots , q_{2^J})^\prime $$\end{document}
 . Third, we have for
\documentclass[12pt]{minimal}\usepackage{amsmath}\usepackage{wasysym}\usepackage{amsfonts}\usepackage{amssymb}\usepackage{amsbsy}\usepackage{mathrsfs}\usepackage{upgreek}\setlength{\oddsidemargin}{-69pt}\begin{document}$$\varvec{p}$$\end{document}
. Third, we have for
\documentclass[12pt]{minimal}\usepackage{amsmath}\usepackage{wasysym}\usepackage{amsfonts}\usepackage{amssymb}\usepackage{amsbsy}\usepackage{mathrsfs}\usepackage{upgreek}\setlength{\oddsidemargin}{-69pt}\begin{document}$$\varvec{p}$$\end{document}
 the vector
\documentclass[12pt]{minimal}\usepackage{amsmath}\usepackage{wasysym}\usepackage{amsfonts}\usepackage{amssymb}\usepackage{amsbsy}\usepackage{mathrsfs}\usepackage{upgreek}\setlength{\oddsidemargin}{-69pt}\begin{document}$$\varvec{q}$$\end{document}
the vector
\documentclass[12pt]{minimal}\usepackage{amsmath}\usepackage{wasysym}\usepackage{amsfonts}\usepackage{amssymb}\usepackage{amsbsy}\usepackage{mathrsfs}\usepackage{upgreek}\setlength{\oddsidemargin}{-69pt}\begin{document}$$\varvec{q}$$\end{document}
 obtained by repeating the first two steps for all
\documentclass[12pt]{minimal}\usepackage{amsmath}\usepackage{wasysym}\usepackage{amsfonts}\usepackage{amssymb}\usepackage{amsbsy}\usepackage{mathrsfs}\usepackage{upgreek}\setlength{\oddsidemargin}{-69pt}\begin{document}$$p_j$$\end{document}
obtained by repeating the first two steps for all
\documentclass[12pt]{minimal}\usepackage{amsmath}\usepackage{wasysym}\usepackage{amsfonts}\usepackage{amssymb}\usepackage{amsbsy}\usepackage{mathrsfs}\usepackage{upgreek}\setlength{\oddsidemargin}{-69pt}\begin{document}$$p_j$$\end{document}
 .
.
To obtain the initial vector
\documentclass[12pt]{minimal}\usepackage{amsmath}\usepackage{wasysym}\usepackage{amsfonts}\usepackage{amssymb}\usepackage{amsbsy}\usepackage{mathrsfs}\usepackage{upgreek}\setlength{\oddsidemargin}{-69pt}\begin{document}$$\varvec{q}$$\end{document}
 for the Gibbs sampler, a single sample is taken from the flat Dirichlet distribution, for which we assess the required restrictions. Those restrictions that are satisfied are then ‘activated’ and the Gibbs sampler is run using the active restrictions only, resulting in a new vector for which at least the active restrictions are satisfied. The vector
\documentclass[12pt]{minimal}\usepackage{amsmath}\usepackage{wasysym}\usepackage{amsfonts}\usepackage{amssymb}\usepackage{amsbsy}\usepackage{mathrsfs}\usepackage{upgreek}\setlength{\oddsidemargin}{-69pt}\begin{document}$$\varvec{q}$$\end{document}
for the Gibbs sampler, a single sample is taken from the flat Dirichlet distribution, for which we assess the required restrictions. Those restrictions that are satisfied are then ‘activated’ and the Gibbs sampler is run using the active restrictions only, resulting in a new vector for which at least the active restrictions are satisfied. The vector
\documentclass[12pt]{minimal}\usepackage{amsmath}\usepackage{wasysym}\usepackage{amsfonts}\usepackage{amssymb}\usepackage{amsbsy}\usepackage{mathrsfs}\usepackage{upgreek}\setlength{\oddsidemargin}{-69pt}\begin{document}$$\varvec{q}$$\end{document}
 is then obtained by repeating the Gibbs sampler and activating those (additional) restrictions that are satisfied at each step, until all v restrictions are active.
Recall that for
\documentclass[12pt]{minimal}\usepackage{amsmath}\usepackage{wasysym}\usepackage{amsfonts}\usepackage{amssymb}\usepackage{amsbsy}\usepackage{mathrsfs}\usepackage{upgreek}\setlength{\oddsidemargin}{-69pt}\begin{document}$$J=3$$\end{document}
 , 38.56% of the samples that satisfied property MM also satisfied CA. Of the 10,000 samples obtained from the Gibbs sampler for
\documentclass[12pt]{minimal}\usepackage{amsmath}\usepackage{wasysym}\usepackage{amsfonts}\usepackage{amssymb}\usepackage{amsbsy}\usepackage{mathrsfs}\usepackage{upgreek}\setlength{\oddsidemargin}{-69pt}\begin{document}$$J=4$$\end{document}
, 38.56% of the samples that satisfied property MM also satisfied CA. Of the 10,000 samples obtained from the Gibbs sampler for
\documentclass[12pt]{minimal}\usepackage{amsmath}\usepackage{wasysym}\usepackage{amsfonts}\usepackage{amssymb}\usepackage{amsbsy}\usepackage{mathrsfs}\usepackage{upgreek}\setlength{\oddsidemargin}{-69pt}\begin{document}$$J=4$$\end{document}
 , about 0.06% were found to also satisfy CA. Increasing the number of items to five further reduced this percentage to below 0.01%. The results strongly suggest that the discrepancy in complexity between the properties MM and CA increases as the number of items increases.
2.4. The Distributions of Subsets of Item Variables
The complexities of the properties are further investigated for
\documentclass[12pt]{minimal}\usepackage{amsmath}\usepackage{wasysym}\usepackage{amsfonts}\usepackage{amssymb}\usepackage{amsbsy}\usepackage{mathrsfs}\usepackage{upgreek}\setlength{\oddsidemargin}{-69pt}\begin{document}$$J=4$$\end{document}
 , which extends the results in Fig. 5 (excluding MM) and includes the properties
\documentclass[12pt]{minimal}\usepackage{amsmath}\usepackage{wasysym}\usepackage{amsfonts}\usepackage{amssymb}\usepackage{amsbsy}\usepackage{mathrsfs}\usepackage{upgreek}\setlength{\oddsidemargin}{-69pt}\begin{document}$$\hbox {MTP}_2$$\end{document}
, which extends the results in Fig. 5 (excluding MM) and includes the properties
\documentclass[12pt]{minimal}\usepackage{amsmath}\usepackage{wasysym}\usepackage{amsfonts}\usepackage{amssymb}\usepackage{amsbsy}\usepackage{mathrsfs}\usepackage{upgreek}\setlength{\oddsidemargin}{-69pt}\begin{document}$$\hbox {MTP}_2$$\end{document}
 and A, along with 3-CA and 3-SPOD for the trivariate distributions of all four triplets of item variables. A total of 10 million samples of the vector
\documentclass[12pt]{minimal}\usepackage{amsmath}\usepackage{wasysym}\usepackage{amsfonts}\usepackage{amssymb}\usepackage{amsbsy}\usepackage{mathrsfs}\usepackage{upgreek}\setlength{\oddsidemargin}{-69pt}\begin{document}$$\varvec{p}$$\end{document}
and A, along with 3-CA and 3-SPOD for the trivariate distributions of all four triplets of item variables. A total of 10 million samples of the vector
\documentclass[12pt]{minimal}\usepackage{amsmath}\usepackage{wasysym}\usepackage{amsfonts}\usepackage{amssymb}\usepackage{amsbsy}\usepackage{mathrsfs}\usepackage{upgreek}\setlength{\oddsidemargin}{-69pt}\begin{document}$$\varvec{p}$$\end{document}
 were obtained from a flat Dirichlet distribution. Of these 10 million samples, 343,556 (3.44%) satisfied NC. For these 343,556 samples, Fig. 7 shows the percentages of overlap between the observable properties. For example, the gray areas in Fig. 7 correspond to the properties A and 3-CA, where A accounts for about 34.76% of the samples that satisfy NC and the property 3-CA accounts for about 0.45%, with the latter, thus imposing considerably tighter constraints on
\documentclass[12pt]{minimal}\usepackage{amsmath}\usepackage{wasysym}\usepackage{amsfonts}\usepackage{amssymb}\usepackage{amsbsy}\usepackage{mathrsfs}\usepackage{upgreek}\setlength{\oddsidemargin}{-69pt}\begin{document}$$\varvec{p}$$\end{document}
were obtained from a flat Dirichlet distribution. Of these 10 million samples, 343,556 (3.44%) satisfied NC. For these 343,556 samples, Fig. 7 shows the percentages of overlap between the observable properties. For example, the gray areas in Fig. 7 correspond to the properties A and 3-CA, where A accounts for about 34.76% of the samples that satisfy NC and the property 3-CA accounts for about 0.45%, with the latter, thus imposing considerably tighter constraints on
\documentclass[12pt]{minimal}\usepackage{amsmath}\usepackage{wasysym}\usepackage{amsfonts}\usepackage{amssymb}\usepackage{amsbsy}\usepackage{mathrsfs}\usepackage{upgreek}\setlength{\oddsidemargin}{-69pt}\begin{document}$$\varvec{p}$$\end{document}
 (less complex). Of the samples that satisfy NC, both
\documentclass[12pt]{minimal}\usepackage{amsmath}\usepackage{wasysym}\usepackage{amsfonts}\usepackage{amssymb}\usepackage{amsbsy}\usepackage{mathrsfs}\usepackage{upgreek}\setlength{\oddsidemargin}{-69pt}\begin{document}$$\hbox {MTP}_2$$\end{document}
(less complex). Of the samples that satisfy NC, both
\documentclass[12pt]{minimal}\usepackage{amsmath}\usepackage{wasysym}\usepackage{amsfonts}\usepackage{amssymb}\usepackage{amsbsy}\usepackage{mathrsfs}\usepackage{upgreek}\setlength{\oddsidemargin}{-69pt}\begin{document}$$\hbox {MTP}_2$$\end{document}
 and CA were satisfied by less than 0.01%. After CA and
\documentclass[12pt]{minimal}\usepackage{amsmath}\usepackage{wasysym}\usepackage{amsfonts}\usepackage{amssymb}\usepackage{amsbsy}\usepackage{mathrsfs}\usepackage{upgreek}\setlength{\oddsidemargin}{-69pt}\begin{document}$$\hbox {MTP}_2$$\end{document}
and CA were satisfied by less than 0.01%. After CA and
\documentclass[12pt]{minimal}\usepackage{amsmath}\usepackage{wasysym}\usepackage{amsfonts}\usepackage{amssymb}\usepackage{amsbsy}\usepackage{mathrsfs}\usepackage{upgreek}\setlength{\oddsidemargin}{-69pt}\begin{document}$$\hbox {MTP}_2$$\end{document}
 , the properties 3-CA and NPC imposed the tightest constraints on
\documentclass[12pt]{minimal}\usepackage{amsmath}\usepackage{wasysym}\usepackage{amsfonts}\usepackage{amssymb}\usepackage{amsbsy}\usepackage{mathrsfs}\usepackage{upgreek}\setlength{\oddsidemargin}{-69pt}\begin{document}$$\varvec{p}$$\end{document}
, the properties 3-CA and NPC imposed the tightest constraints on
\documentclass[12pt]{minimal}\usepackage{amsmath}\usepackage{wasysym}\usepackage{amsfonts}\usepackage{amssymb}\usepackage{amsbsy}\usepackage{mathrsfs}\usepackage{upgreek}\setlength{\oddsidemargin}{-69pt}\begin{document}$$\varvec{p}$$\end{document}
 , which were satisfied by, respectively, 0.45% and 33.83% of all samples that satisfied NC (0.02% and 1.16% of all 10 million samples). However, even for those samples that satisfied 3-CA, only about 0.77% also satisfied CA. Hence, for
\documentclass[12pt]{minimal}\usepackage{amsmath}\usepackage{wasysym}\usepackage{amsfonts}\usepackage{amssymb}\usepackage{amsbsy}\usepackage{mathrsfs}\usepackage{upgreek}\setlength{\oddsidemargin}{-69pt}\begin{document}$$J=4$$\end{document}
, which were satisfied by, respectively, 0.45% and 33.83% of all samples that satisfied NC (0.02% and 1.16% of all 10 million samples). However, even for those samples that satisfied 3-CA, only about 0.77% also satisfied CA. Hence, for
\documentclass[12pt]{minimal}\usepackage{amsmath}\usepackage{wasysym}\usepackage{amsfonts}\usepackage{amssymb}\usepackage{amsbsy}\usepackage{mathrsfs}\usepackage{upgreek}\setlength{\oddsidemargin}{-69pt}\begin{document}$$J=4$$\end{document}
 , the results show that there exists a considerable gap between the complexity of property CA and any of the incomplete tests for CA (except
\documentclass[12pt]{minimal}\usepackage{amsmath}\usepackage{wasysym}\usepackage{amsfonts}\usepackage{amssymb}\usepackage{amsbsy}\usepackage{mathrsfs}\usepackage{upgreek}\setlength{\oddsidemargin}{-69pt}\begin{document}$$\hbox {MTP}_2$$\end{document}
, the results show that there exists a considerable gap between the complexity of property CA and any of the incomplete tests for CA (except
\documentclass[12pt]{minimal}\usepackage{amsmath}\usepackage{wasysym}\usepackage{amsfonts}\usepackage{amssymb}\usepackage{amsbsy}\usepackage{mathrsfs}\usepackage{upgreek}\setlength{\oddsidemargin}{-69pt}\begin{document}$$\hbox {MTP}_2$$\end{document}
 ).
).
Triangular Venn diagram of properties in Fig. 4, with the conditional percentages, given NC. The properties A and 3-CA and their overlap are shown in gray.

For
\documentclass[12pt]{minimal}\usepackage{amsmath}\usepackage{wasysym}\usepackage{amsfonts}\usepackage{amssymb}\usepackage{amsbsy}\usepackage{mathrsfs}\usepackage{upgreek}\setlength{\oddsidemargin}{-69pt}\begin{document}$$J>3$$\end{document}
 , the property CA implies
\documentclass[12pt]{minimal}\usepackage{amsmath}\usepackage{wasysym}\usepackage{amsfonts}\usepackage{amssymb}\usepackage{amsbsy}\usepackage{mathrsfs}\usepackage{upgreek}\setlength{\oddsidemargin}{-69pt}\begin{document}$$\hbox {MTP}_2$$\end{document}
, the property CA implies
\documentclass[12pt]{minimal}\usepackage{amsmath}\usepackage{wasysym}\usepackage{amsfonts}\usepackage{amssymb}\usepackage{amsbsy}\usepackage{mathrsfs}\usepackage{upgreek}\setlength{\oddsidemargin}{-69pt}\begin{document}$$\hbox {MTP}_2$$\end{document}
 , but not the other way around. However, because of the small number of cases that satisfied
\documentclass[12pt]{minimal}\usepackage{amsmath}\usepackage{wasysym}\usepackage{amsfonts}\usepackage{amssymb}\usepackage{amsbsy}\usepackage{mathrsfs}\usepackage{upgreek}\setlength{\oddsidemargin}{-69pt}\begin{document}$$\hbox {MTP}_2$$\end{document}
, but not the other way around. However, because of the small number of cases that satisfied
\documentclass[12pt]{minimal}\usepackage{amsmath}\usepackage{wasysym}\usepackage{amsfonts}\usepackage{amssymb}\usepackage{amsbsy}\usepackage{mathrsfs}\usepackage{upgreek}\setlength{\oddsidemargin}{-69pt}\begin{document}$$\hbox {MTP}_2$$\end{document}
 , none of the samples contained cases for which
\documentclass[12pt]{minimal}\usepackage{amsmath}\usepackage{wasysym}\usepackage{amsfonts}\usepackage{amssymb}\usepackage{amsbsy}\usepackage{mathrsfs}\usepackage{upgreek}\setlength{\oddsidemargin}{-69pt}\begin{document}$$\hbox {MTP}_2$$\end{document}
, none of the samples contained cases for which
\documentclass[12pt]{minimal}\usepackage{amsmath}\usepackage{wasysym}\usepackage{amsfonts}\usepackage{amssymb}\usepackage{amsbsy}\usepackage{mathrsfs}\usepackage{upgreek}\setlength{\oddsidemargin}{-69pt}\begin{document}$$\hbox {MTP}_2$$\end{document}
 was satisfied and CA was not. To further investigate the distinction between the complexity of
\documentclass[12pt]{minimal}\usepackage{amsmath}\usepackage{wasysym}\usepackage{amsfonts}\usepackage{amssymb}\usepackage{amsbsy}\usepackage{mathrsfs}\usepackage{upgreek}\setlength{\oddsidemargin}{-69pt}\begin{document}$$\hbox {MTP}_2$$\end{document}
was satisfied and CA was not. To further investigate the distinction between the complexity of
\documentclass[12pt]{minimal}\usepackage{amsmath}\usepackage{wasysym}\usepackage{amsfonts}\usepackage{amssymb}\usepackage{amsbsy}\usepackage{mathrsfs}\usepackage{upgreek}\setlength{\oddsidemargin}{-69pt}\begin{document}$$\hbox {MTP}_2$$\end{document}
 and CA, the Gibbs sampler (Sect. 2.3) was employed to sample 10,000 vectors
\documentclass[12pt]{minimal}\usepackage{amsmath}\usepackage{wasysym}\usepackage{amsfonts}\usepackage{amssymb}\usepackage{amsbsy}\usepackage{mathrsfs}\usepackage{upgreek}\setlength{\oddsidemargin}{-69pt}\begin{document}$$\varvec{p}$$\end{document}
and CA, the Gibbs sampler (Sect. 2.3) was employed to sample 10,000 vectors
\documentclass[12pt]{minimal}\usepackage{amsmath}\usepackage{wasysym}\usepackage{amsfonts}\usepackage{amssymb}\usepackage{amsbsy}\usepackage{mathrsfs}\usepackage{upgreek}\setlength{\oddsidemargin}{-69pt}\begin{document}$$\varvec{p}$$\end{document}
 under the constraints imposed by
\documentclass[12pt]{minimal}\usepackage{amsmath}\usepackage{wasysym}\usepackage{amsfonts}\usepackage{amssymb}\usepackage{amsbsy}\usepackage{mathrsfs}\usepackage{upgreek}\setlength{\oddsidemargin}{-69pt}\begin{document}$$\hbox {MTP}_2$$\end{document}
under the constraints imposed by
\documentclass[12pt]{minimal}\usepackage{amsmath}\usepackage{wasysym}\usepackage{amsfonts}\usepackage{amssymb}\usepackage{amsbsy}\usepackage{mathrsfs}\usepackage{upgreek}\setlength{\oddsidemargin}{-69pt}\begin{document}$$\hbox {MTP}_2$$\end{document}
 . For
\documentclass[12pt]{minimal}\usepackage{amsmath}\usepackage{wasysym}\usepackage{amsfonts}\usepackage{amssymb}\usepackage{amsbsy}\usepackage{mathrsfs}\usepackage{upgreek}\setlength{\oddsidemargin}{-69pt}\begin{document}$$J=4$$\end{document}
. For
\documentclass[12pt]{minimal}\usepackage{amsmath}\usepackage{wasysym}\usepackage{amsfonts}\usepackage{amssymb}\usepackage{amsbsy}\usepackage{mathrsfs}\usepackage{upgreek}\setlength{\oddsidemargin}{-69pt}\begin{document}$$J=4$$\end{document}
 , the percentage of samples that satisfied CA was about 98.38%. Using the same procedure for
\documentclass[12pt]{minimal}\usepackage{amsmath}\usepackage{wasysym}\usepackage{amsfonts}\usepackage{amssymb}\usepackage{amsbsy}\usepackage{mathrsfs}\usepackage{upgreek}\setlength{\oddsidemargin}{-69pt}\begin{document}$$J=5$$\end{document}
, the percentage of samples that satisfied CA was about 98.38%. Using the same procedure for
\documentclass[12pt]{minimal}\usepackage{amsmath}\usepackage{wasysym}\usepackage{amsfonts}\usepackage{amssymb}\usepackage{amsbsy}\usepackage{mathrsfs}\usepackage{upgreek}\setlength{\oddsidemargin}{-69pt}\begin{document}$$J=5$$\end{document}
 , this percentage slightly reduced to 94.48%, with the log-odds ratio of the largest observed violation of CA corresponding to a small effect size (Haddock et al., Reference Haddock, Rindskopf and Shadish1998; Hasselblad & Hedges, Reference Hasselblad and Hedges1995). This result agrees with the observation mentioned earlier by Bartolucci and Forcina (Reference Bartolucci and Forcina2005).
3. Sensitivity to Model Violations
All the observable properties considered in the previous section are implied by the MH model for binary response variables, such that the violation of any of these properties discredits the assumptions that define the MH model. The different properties may, however, not be equally sensitive to different model violations. Insights into the sensitivity of the observable properties to various model violations may aid the development of goodness-of-fit statistics for specific model assumptions.
3.1. Violations of Local Independence
The MH model consists of the assumptions of LI, UD, and M. Holland (Reference Holland1981) suggested an alternative set of assumptions, consisting of LND, UD, and the monotonicity assumption of perfect scores in (4a) and (4b), which imply M. Here, LND relaxes the LI assumption, whereby LI is obtained from the LND assumption by replacing the inequality restrictions of LND by equalities (Holland Reference Holland1981, Theorem 1). The alternative set of assumptions coincide with the observable property of SPOD, which means that SPOD corresponds to a model for which LI is not assumed to hold. Furthermore, the MH model implies CA, which in turn implies SPOD Rosenbaum (Reference Rosenbaum1984).
As was shown in the previous section, CA occupies only a very small section of the outcomes space that satisfies SPOD. Hence, CA is a priori unlikely to hold, given that the data satisfy a model that does not imply LI. Consequently, we may conclude that CA is sensitive to violations of the LI assumptions. Based on the results in Fig. 7 (
\documentclass[12pt]{minimal}\usepackage{amsmath}\usepackage{wasysym}\usepackage{amsfonts}\usepackage{amssymb}\usepackage{amsbsy}\usepackage{mathrsfs}\usepackage{upgreek}\setlength{\oddsidemargin}{-69pt}\begin{document}$$J=4$$\end{document}
 ), the same may be concluded for
\documentclass[12pt]{minimal}\usepackage{amsmath}\usepackage{wasysym}\usepackage{amsfonts}\usepackage{amssymb}\usepackage{amsbsy}\usepackage{mathrsfs}\usepackage{upgreek}\setlength{\oddsidemargin}{-69pt}\begin{document}$$\hbox {MTP}_2$$\end{document}
), the same may be concluded for
\documentclass[12pt]{minimal}\usepackage{amsmath}\usepackage{wasysym}\usepackage{amsfonts}\usepackage{amssymb}\usepackage{amsbsy}\usepackage{mathrsfs}\usepackage{upgreek}\setlength{\oddsidemargin}{-69pt}\begin{document}$$\hbox {MTP}_2$$\end{document}
 and (tentatively) for 3-CA, as these properties show little overlap with SPOD.
Neither of the properties NC, NPC nor MM imply SPOD, which means that these properties may or may not hold, irrespective of SPOD. The properties may then be sensitive to violations of LI when modeled in a specific way, but not to violations of LI in general. Property MM, however, is shown in Fig. 5 to be almost completely encompassed by SPOD and thus may be found to be sensitive to violations of LI more generally. For Mokken scale analysis based on these properties, this means that a violation of NC or NPC discredits the MH model, but from this it cannot be concluded that the observed violation was due to a violation of the LI assumption.
3.2. Violations of Unidimensionality
Holland and Rosenbaum (Reference Holland and Rosenbaum1986) referred to a model that satisfies LI and M, but allows
\documentclass[12pt]{minimal}\usepackage{amsmath}\usepackage{wasysym}\usepackage{amsfonts}\usepackage{amssymb}\usepackage{amsbsy}\usepackage{mathrsfs}\usepackage{upgreek}\setlength{\oddsidemargin}{-69pt}\begin{document}$$\varvec{\Theta }$$\end{document}
 to be multidimensional, as a monotone latent variable model. They showed that any monotone latent variable model implies property
\documentclass[12pt]{minimal}\usepackage{amsmath}\usepackage{wasysym}\usepackage{amsfonts}\usepackage{amssymb}\usepackage{amsbsy}\usepackage{mathrsfs}\usepackage{upgreek}\setlength{\oddsidemargin}{-69pt}\begin{document}$$\hbox {MTP}_2$$\end{document}
to be multidimensional, as a monotone latent variable model. They showed that any monotone latent variable model implies property
\documentclass[12pt]{minimal}\usepackage{amsmath}\usepackage{wasysym}\usepackage{amsfonts}\usepackage{amssymb}\usepackage{amsbsy}\usepackage{mathrsfs}\usepackage{upgreek}\setlength{\oddsidemargin}{-69pt}\begin{document}$$\hbox {MTP}_2$$\end{document}
 , if the density of
\documentclass[12pt]{minimal}\usepackage{amsmath}\usepackage{wasysym}\usepackage{amsfonts}\usepackage{amssymb}\usepackage{amsbsy}\usepackage{mathrsfs}\usepackage{upgreek}\setlength{\oddsidemargin}{-69pt}\begin{document}$$\varvec{\Theta }$$\end{document}
, if the density of
\documentclass[12pt]{minimal}\usepackage{amsmath}\usepackage{wasysym}\usepackage{amsfonts}\usepackage{amssymb}\usepackage{amsbsy}\usepackage{mathrsfs}\usepackage{upgreek}\setlength{\oddsidemargin}{-69pt}\begin{document}$$\varvec{\Theta }$$\end{document}
 is
\documentclass[12pt]{minimal}\usepackage{amsmath}\usepackage{wasysym}\usepackage{amsfonts}\usepackage{amssymb}\usepackage{amsbsy}\usepackage{mathrsfs}\usepackage{upgreek}\setlength{\oddsidemargin}{-69pt}\begin{document}$$\hbox {MTP}_2$$\end{document}
is
\documentclass[12pt]{minimal}\usepackage{amsmath}\usepackage{wasysym}\usepackage{amsfonts}\usepackage{amssymb}\usepackage{amsbsy}\usepackage{mathrsfs}\usepackage{upgreek}\setlength{\oddsidemargin}{-69pt}\begin{document}$$\hbox {MTP}_2$$\end{document}
 . A similar result was obtained by Ellis (Reference Ellis, Millsap, Bolt, van der Ark and Wang2015), in case
\documentclass[12pt]{minimal}\usepackage{amsmath}\usepackage{wasysym}\usepackage{amsfonts}\usepackage{amssymb}\usepackage{amsbsy}\usepackage{mathrsfs}\usepackage{upgreek}\setlength{\oddsidemargin}{-69pt}\begin{document}$$(\varvec{X},\varvec{\Theta })$$\end{document}
. A similar result was obtained by Ellis (Reference Ellis, Millsap, Bolt, van der Ark and Wang2015), in case
\documentclass[12pt]{minimal}\usepackage{amsmath}\usepackage{wasysym}\usepackage{amsfonts}\usepackage{amssymb}\usepackage{amsbsy}\usepackage{mathrsfs}\usepackage{upgreek}\setlength{\oddsidemargin}{-69pt}\begin{document}$$(\varvec{X},\varvec{\Theta })$$\end{document}
 satisfies a particular higher-order factor structure. This means that one cannot make inferences about the dimensionality of (the unobserved)
\documentclass[12pt]{minimal}\usepackage{amsmath}\usepackage{wasysym}\usepackage{amsfonts}\usepackage{amssymb}\usepackage{amsbsy}\usepackage{mathrsfs}\usepackage{upgreek}\setlength{\oddsidemargin}{-69pt}\begin{document}$$\varvec{\Theta }$$\end{document}
satisfies a particular higher-order factor structure. This means that one cannot make inferences about the dimensionality of (the unobserved)
\documentclass[12pt]{minimal}\usepackage{amsmath}\usepackage{wasysym}\usepackage{amsfonts}\usepackage{amssymb}\usepackage{amsbsy}\usepackage{mathrsfs}\usepackage{upgreek}\setlength{\oddsidemargin}{-69pt}\begin{document}$$\varvec{\Theta }$$\end{document}
 based on the confirmation of
\documentclass[12pt]{minimal}\usepackage{amsmath}\usepackage{wasysym}\usepackage{amsfonts}\usepackage{amssymb}\usepackage{amsbsy}\usepackage{mathrsfs}\usepackage{upgreek}\setlength{\oddsidemargin}{-69pt}\begin{document}$$\hbox {MTP}_2$$\end{document}
based on the confirmation of
\documentclass[12pt]{minimal}\usepackage{amsmath}\usepackage{wasysym}\usepackage{amsfonts}\usepackage{amssymb}\usepackage{amsbsy}\usepackage{mathrsfs}\usepackage{upgreek}\setlength{\oddsidemargin}{-69pt}\begin{document}$$\hbox {MTP}_2$$\end{document}
 or any property it implies. Because of the minor discrepancy found between the properties
\documentclass[12pt]{minimal}\usepackage{amsmath}\usepackage{wasysym}\usepackage{amsfonts}\usepackage{amssymb}\usepackage{amsbsy}\usepackage{mathrsfs}\usepackage{upgreek}\setlength{\oddsidemargin}{-69pt}\begin{document}$$\hbox {MTP}_2$$\end{document}
or any property it implies. Because of the minor discrepancy found between the properties
\documentclass[12pt]{minimal}\usepackage{amsmath}\usepackage{wasysym}\usepackage{amsfonts}\usepackage{amssymb}\usepackage{amsbsy}\usepackage{mathrsfs}\usepackage{upgreek}\setlength{\oddsidemargin}{-69pt}\begin{document}$$\hbox {MTP}_2$$\end{document}
 and CA, the assessment of the dimensionality of
\documentclass[12pt]{minimal}\usepackage{amsmath}\usepackage{wasysym}\usepackage{amsfonts}\usepackage{amssymb}\usepackage{amsbsy}\usepackage{mathrsfs}\usepackage{upgreek}\setlength{\oddsidemargin}{-69pt}\begin{document}$$\varvec{\Theta }$$\end{document}
and CA, the assessment of the dimensionality of
\documentclass[12pt]{minimal}\usepackage{amsmath}\usepackage{wasysym}\usepackage{amsfonts}\usepackage{amssymb}\usepackage{amsbsy}\usepackage{mathrsfs}\usepackage{upgreek}\setlength{\oddsidemargin}{-69pt}\begin{document}$$\varvec{\Theta }$$\end{document}
 poses a real challenge for future research.
Another difficulty, when studying the influence of violations of UD, is that the addition of more latent variables in a model generally coincides with a violation of the LI assumptions when fitting a unidimensional model.
3.3. Violations of Monotonicity
A small simulation study is performed to investigate the sensitivity of the observable properties to violations of assumption M. Given the assumptions of LI and UD, a choice needs to be made for the number of items, the distribution of the latent variable, and a way of inducing and quantifying violations of M. The results of the analysis on the sensitivity of the observable properties to violations of M highly depend on these choices. In order to make the results fairly generalizable across a wide range of choices of model specifications, a latent class approach is used (e.g., Croon, Reference Croon1990; Heinen, Reference Heinen1993; Lazarsfeld, Reference Lazarsfeld, Stouffer, Guttman, Suchman, Lazarsfeld, Star and Clausen1950). The approach consists of assuming a discrete distribution for the latent variable. By taking the number of latent classes to equal to the number of distinct response patterns, this approach is highly flexible with respect to the shape of the distribution of the latent variable and the shape of the response functions.
The choice for the number of items is motivated by the results on the complexities of the properties, which were shown to be very restrictive, especially for large numbers of items. By initially taking
\documentclass[12pt]{minimal}\usepackage{amsmath}\usepackage{wasysym}\usepackage{amsfonts}\usepackage{amssymb}\usepackage{amsbsy}\usepackage{mathrsfs}\usepackage{upgreek}\setlength{\oddsidemargin}{-69pt}\begin{document}$$J=4$$\end{document}
 , we may expect the latent class model to generate sufficient samples of the vector
\documentclass[12pt]{minimal}\usepackage{amsmath}\usepackage{wasysym}\usepackage{amsfonts}\usepackage{amssymb}\usepackage{amsbsy}\usepackage{mathrsfs}\usepackage{upgreek}\setlength{\oddsidemargin}{-69pt}\begin{document}$$\varvec{p}$$\end{document}
, we may expect the latent class model to generate sufficient samples of the vector
\documentclass[12pt]{minimal}\usepackage{amsmath}\usepackage{wasysym}\usepackage{amsfonts}\usepackage{amssymb}\usepackage{amsbsy}\usepackage{mathrsfs}\usepackage{upgreek}\setlength{\oddsidemargin}{-69pt}\begin{document}$$\varvec{p}$$\end{document}
 for which the properties hold, in order to compare the size of the violations of M between those cases where the property is violated to those cases where the property holds. For
\documentclass[12pt]{minimal}\usepackage{amsmath}\usepackage{wasysym}\usepackage{amsfonts}\usepackage{amssymb}\usepackage{amsbsy}\usepackage{mathrsfs}\usepackage{upgreek}\setlength{\oddsidemargin}{-69pt}\begin{document}$$J=3$$\end{document}
for which the properties hold, in order to compare the size of the violations of M between those cases where the property is violated to those cases where the property holds. For
\documentclass[12pt]{minimal}\usepackage{amsmath}\usepackage{wasysym}\usepackage{amsfonts}\usepackage{amssymb}\usepackage{amsbsy}\usepackage{mathrsfs}\usepackage{upgreek}\setlength{\oddsidemargin}{-69pt}\begin{document}$$J=3$$\end{document}
 , the results are similar to the ones presented here.
3.3.1. Procedure
For the distribution of
\documentclass[12pt]{minimal}\usepackage{amsmath}\usepackage{wasysym}\usepackage{amsfonts}\usepackage{amssymb}\usepackage{amsbsy}\usepackage{mathrsfs}\usepackage{upgreek}\setlength{\oddsidemargin}{-69pt}\begin{document}$$\Theta $$\end{document}
 , a vector
\documentclass[12pt]{minimal}\usepackage{amsmath}\usepackage{wasysym}\usepackage{amsfonts}\usepackage{amssymb}\usepackage{amsbsy}\usepackage{mathrsfs}\usepackage{upgreek}\setlength{\oddsidemargin}{-69pt}\begin{document}$$\varvec{c}=(c_1,\ldots ,c_{16})^\prime $$\end{document}
, a vector
\documentclass[12pt]{minimal}\usepackage{amsmath}\usepackage{wasysym}\usepackage{amsfonts}\usepackage{amssymb}\usepackage{amsbsy}\usepackage{mathrsfs}\usepackage{upgreek}\setlength{\oddsidemargin}{-69pt}\begin{document}$$\varvec{c}=(c_1,\ldots ,c_{16})^\prime $$\end{document}
 was sampled from a Dirichlet distribution, which contains the latent class proportions
\documentclass[12pt]{minimal}\usepackage{amsmath}\usepackage{wasysym}\usepackage{amsfonts}\usepackage{amssymb}\usepackage{amsbsy}\usepackage{mathrsfs}\usepackage{upgreek}\setlength{\oddsidemargin}{-69pt}\begin{document}$$c_k=P(\Theta =k)$$\end{document}
was sampled from a Dirichlet distribution, which contains the latent class proportions
\documentclass[12pt]{minimal}\usepackage{amsmath}\usepackage{wasysym}\usepackage{amsfonts}\usepackage{amssymb}\usepackage{amsbsy}\usepackage{mathrsfs}\usepackage{upgreek}\setlength{\oddsidemargin}{-69pt}\begin{document}$$c_k=P(\Theta =k)$$\end{document}
 . The parameters of the Dirichlet distribution were chosen, such that the middle latent classes had generally more support. Further, let
\documentclass[12pt]{minimal}\usepackage{amsmath}\usepackage{wasysym}\usepackage{amsfonts}\usepackage{amssymb}\usepackage{amsbsy}\usepackage{mathrsfs}\usepackage{upgreek}\setlength{\oddsidemargin}{-69pt}\begin{document}$$\varvec{b}_i=(b_{i1},\ldots ,b_{i16})^\prime $$\end{document}
. The parameters of the Dirichlet distribution were chosen, such that the middle latent classes had generally more support. Further, let
\documentclass[12pt]{minimal}\usepackage{amsmath}\usepackage{wasysym}\usepackage{amsfonts}\usepackage{amssymb}\usepackage{amsbsy}\usepackage{mathrsfs}\usepackage{upgreek}\setlength{\oddsidemargin}{-69pt}\begin{document}$$\varvec{b}_i=(b_{i1},\ldots ,b_{i16})^\prime $$\end{document}
 , with
\documentclass[12pt]{minimal}\usepackage{amsmath}\usepackage{wasysym}\usepackage{amsfonts}\usepackage{amssymb}\usepackage{amsbsy}\usepackage{mathrsfs}\usepackage{upgreek}\setlength{\oddsidemargin}{-69pt}\begin{document}$$b_{ik}=P(X_i=1|\Theta =k)$$\end{document}
, with
\documentclass[12pt]{minimal}\usepackage{amsmath}\usepackage{wasysym}\usepackage{amsfonts}\usepackage{amssymb}\usepackage{amsbsy}\usepackage{mathrsfs}\usepackage{upgreek}\setlength{\oddsidemargin}{-69pt}\begin{document}$$b_{ik}=P(X_i=1|\Theta =k)$$\end{document}
 sampled from a beta distribution, and with the elements in
\documentclass[12pt]{minimal}\usepackage{amsmath}\usepackage{wasysym}\usepackage{amsfonts}\usepackage{amssymb}\usepackage{amsbsy}\usepackage{mathrsfs}\usepackage{upgreek}\setlength{\oddsidemargin}{-69pt}\begin{document}$$\varvec{b}_i$$\end{document}
sampled from a beta distribution, and with the elements in
\documentclass[12pt]{minimal}\usepackage{amsmath}\usepackage{wasysym}\usepackage{amsfonts}\usepackage{amssymb}\usepackage{amsbsy}\usepackage{mathrsfs}\usepackage{upgreek}\setlength{\oddsidemargin}{-69pt}\begin{document}$$\varvec{b}_i$$\end{document}
 arranged in increasing order in agreement with assumption of M. Figure 8 shows an example of four response functions
\documentclass[12pt]{minimal}\usepackage{amsmath}\usepackage{wasysym}\usepackage{amsfonts}\usepackage{amssymb}\usepackage{amsbsy}\usepackage{mathrsfs}\usepackage{upgreek}\setlength{\oddsidemargin}{-69pt}\begin{document}$$P(X_i=1|\Theta =k)$$\end{document}
arranged in increasing order in agreement with assumption of M. Figure 8 shows an example of four response functions
\documentclass[12pt]{minimal}\usepackage{amsmath}\usepackage{wasysym}\usepackage{amsfonts}\usepackage{amssymb}\usepackage{amsbsy}\usepackage{mathrsfs}\usepackage{upgreek}\setlength{\oddsidemargin}{-69pt}\begin{document}$$P(X_i=1|\Theta =k)$$\end{document}
 , with in light gray the 95% intervals of the response functions under the simulation conditions, along with the intervals for the latent classes. To induce a violation of M, six adjacent element of
\documentclass[12pt]{minimal}\usepackage{amsmath}\usepackage{wasysym}\usepackage{amsfonts}\usepackage{amssymb}\usepackage{amsbsy}\usepackage{mathrsfs}\usepackage{upgreek}\setlength{\oddsidemargin}{-69pt}\begin{document}$$\varvec{b}_i$$\end{document}
, with in light gray the 95% intervals of the response functions under the simulation conditions, along with the intervals for the latent classes. To induce a violation of M, six adjacent element of
\documentclass[12pt]{minimal}\usepackage{amsmath}\usepackage{wasysym}\usepackage{amsfonts}\usepackage{amssymb}\usepackage{amsbsy}\usepackage{mathrsfs}\usepackage{upgreek}\setlength{\oddsidemargin}{-69pt}\begin{document}$$\varvec{b}_i$$\end{document}
 were randomly selected, and reversely ordered, leading to locally decreasing response functions. Assuming LI, we then get
\documentclass[12pt]{minimal}\usepackage{amsmath}\usepackage{wasysym}\usepackage{amsfonts}\usepackage{amssymb}\usepackage{amsbsy}\usepackage{mathrsfs}\usepackage{upgreek}\setlength{\oddsidemargin}{-69pt}\begin{document}$$\varvec{p}={\mathbf {A}}\varvec{c}$$\end{document}
were randomly selected, and reversely ordered, leading to locally decreasing response functions. Assuming LI, we then get
\documentclass[12pt]{minimal}\usepackage{amsmath}\usepackage{wasysym}\usepackage{amsfonts}\usepackage{amssymb}\usepackage{amsbsy}\usepackage{mathrsfs}\usepackage{upgreek}\setlength{\oddsidemargin}{-69pt}\begin{document}$$\varvec{p}={\mathbf {A}}\varvec{c}$$\end{document}
 , with
\documentclass[12pt]{minimal}\usepackage{amsmath}\usepackage{wasysym}\usepackage{amsfonts}\usepackage{amssymb}\usepackage{amsbsy}\usepackage{mathrsfs}\usepackage{upgreek}\setlength{\oddsidemargin}{-69pt}\begin{document}$${\mathbf {A}}=(\varvec{a}_1,\ldots ,\varvec{a}_{16})$$\end{document}
, with
\documentclass[12pt]{minimal}\usepackage{amsmath}\usepackage{wasysym}\usepackage{amsfonts}\usepackage{amssymb}\usepackage{amsbsy}\usepackage{mathrsfs}\usepackage{upgreek}\setlength{\oddsidemargin}{-69pt}\begin{document}$${\mathbf {A}}=(\varvec{a}_1,\ldots ,\varvec{a}_{16})$$\end{document}
 and
\documentclass[12pt]{minimal}\usepackage{amsmath}\usepackage{wasysym}\usepackage{amsfonts}\usepackage{amssymb}\usepackage{amsbsy}\usepackage{mathrsfs}\usepackage{upgreek}\setlength{\oddsidemargin}{-69pt}\begin{document}$$\varvec{a}_k=(1-b_{1k},b_{1k})^\prime \otimes \cdots \otimes (1-b_{4k},b_{4k})^\prime $$\end{document}
and
\documentclass[12pt]{minimal}\usepackage{amsmath}\usepackage{wasysym}\usepackage{amsfonts}\usepackage{amssymb}\usepackage{amsbsy}\usepackage{mathrsfs}\usepackage{upgreek}\setlength{\oddsidemargin}{-69pt}\begin{document}$$\varvec{a}_k=(1-b_{1k},b_{1k})^\prime \otimes \cdots \otimes (1-b_{4k},b_{4k})^\prime $$\end{document}
 . A total of 10,000 such vectors
\documentclass[12pt]{minimal}\usepackage{amsmath}\usepackage{wasysym}\usepackage{amsfonts}\usepackage{amssymb}\usepackage{amsbsy}\usepackage{mathrsfs}\usepackage{upgreek}\setlength{\oddsidemargin}{-69pt}\begin{document}$$\varvec{p}$$\end{document}
. A total of 10,000 such vectors
\documentclass[12pt]{minimal}\usepackage{amsmath}\usepackage{wasysym}\usepackage{amsfonts}\usepackage{amssymb}\usepackage{amsbsy}\usepackage{mathrsfs}\usepackage{upgreek}\setlength{\oddsidemargin}{-69pt}\begin{document}$$\varvec{p}$$\end{document}
 were generated, each containing the multinomial parameters for the outcomes of the four item variables, with each response functions violating the assumption M.
Example of four item response functions that violate M, with the density of
\documentclass[12pt]{minimal}\usepackage{amsmath}\usepackage{wasysym}\usepackage{amsfonts}\usepackage{amssymb}\usepackage{amsbsy}\usepackage{mathrsfs}\usepackage{upgreek}\setlength{\oddsidemargin}{-69pt}\begin{document}$$\Theta $$\end{document}
 given below. The light-gray areas show the 95% intervals under which the functions were generated before inducing a violation of M. The dark-gray areas (above the local decreases) show the size of the violations of M, with
\documentclass[12pt]{minimal}\usepackage{amsmath}\usepackage{wasysym}\usepackage{amsfonts}\usepackage{amssymb}\usepackage{amsbsy}\usepackage{mathrsfs}\usepackage{upgreek}\setlength{\oddsidemargin}{-69pt}\begin{document}$$V_i$$\end{document}
given below. The light-gray areas show the 95% intervals under which the functions were generated before inducing a violation of M. The dark-gray areas (above the local decreases) show the size of the violations of M, with
\documentclass[12pt]{minimal}\usepackage{amsmath}\usepackage{wasysym}\usepackage{amsfonts}\usepackage{amssymb}\usepackage{amsbsy}\usepackage{mathrsfs}\usepackage{upgreek}\setlength{\oddsidemargin}{-69pt}\begin{document}$$V_i$$\end{document}
 expressing the size of the area weighted by the density of the latent variable.

To quantify the size of the violation of M, let
\documentclass[12pt]{minimal}\usepackage{amsmath}\usepackage{wasysym}\usepackage{amsfonts}\usepackage{amssymb}\usepackage{amsbsy}\usepackage{mathrsfs}\usepackage{upgreek}\setlength{\oddsidemargin}{-69pt}\begin{document}$$\varvec{d}_i=(b_{i1},d_{i2},\ldots ,d_{i16})^\prime $$\end{document}
 , with the values of
\documentclass[12pt]{minimal}\usepackage{amsmath}\usepackage{wasysym}\usepackage{amsfonts}\usepackage{amssymb}\usepackage{amsbsy}\usepackage{mathrsfs}\usepackage{upgreek}\setlength{\oddsidemargin}{-69pt}\begin{document}$$d_{i2},\ldots ,d_{i16}$$\end{document}
, with the values of
\documentclass[12pt]{minimal}\usepackage{amsmath}\usepackage{wasysym}\usepackage{amsfonts}\usepackage{amssymb}\usepackage{amsbsy}\usepackage{mathrsfs}\usepackage{upgreek}\setlength{\oddsidemargin}{-69pt}\begin{document}$$d_{i2},\ldots ,d_{i16}$$\end{document}
 obtained sequentially as
\documentclass[12pt]{minimal}\usepackage{amsmath}\usepackage{wasysym}\usepackage{amsfonts}\usepackage{amssymb}\usepackage{amsbsy}\usepackage{mathrsfs}\usepackage{upgreek}\setlength{\oddsidemargin}{-69pt}\begin{document}$$d_{ik}=\max (d_{i,k-1},b_{ik})$$\end{document}
obtained sequentially as
\documentclass[12pt]{minimal}\usepackage{amsmath}\usepackage{wasysym}\usepackage{amsfonts}\usepackage{amssymb}\usepackage{amsbsy}\usepackage{mathrsfs}\usepackage{upgreek}\setlength{\oddsidemargin}{-69pt}\begin{document}$$d_{ik}=\max (d_{i,k-1},b_{ik})$$\end{document}
 . Then,

which expresses the average probability (as percentage) required to compensate for the local decreases of the initial response function. Figure 8 shows for each item the value
\documentclass[12pt]{minimal}\usepackage{amsmath}\usepackage{wasysym}\usepackage{amsfonts}\usepackage{amssymb}\usepackage{amsbsy}\usepackage{mathrsfs}\usepackage{upgreek}\setlength{\oddsidemargin}{-69pt}\begin{document}$$V_i$$\end{document}
 , corresponding to the dark-gray area above the local decrease, weighted by the probability mass function of
\documentclass[12pt]{minimal}\usepackage{amsmath}\usepackage{wasysym}\usepackage{amsfonts}\usepackage{amssymb}\usepackage{amsbsy}\usepackage{mathrsfs}\usepackage{upgreek}\setlength{\oddsidemargin}{-69pt}\begin{document}$$\Theta $$\end{document}
, corresponding to the dark-gray area above the local decrease, weighted by the probability mass function of
\documentclass[12pt]{minimal}\usepackage{amsmath}\usepackage{wasysym}\usepackage{amsfonts}\usepackage{amssymb}\usepackage{amsbsy}\usepackage{mathrsfs}\usepackage{upgreek}\setlength{\oddsidemargin}{-69pt}\begin{document}$$\Theta $$\end{document}
 . For example, for the first two items in Fig. 8,
\documentclass[12pt]{minimal}\usepackage{amsmath}\usepackage{wasysym}\usepackage{amsfonts}\usepackage{amssymb}\usepackage{amsbsy}\usepackage{mathrsfs}\usepackage{upgreek}\setlength{\oddsidemargin}{-69pt}\begin{document}$$V_1=4.69$$\end{document}
. For example, for the first two items in Fig. 8,
\documentclass[12pt]{minimal}\usepackage{amsmath}\usepackage{wasysym}\usepackage{amsfonts}\usepackage{amssymb}\usepackage{amsbsy}\usepackage{mathrsfs}\usepackage{upgreek}\setlength{\oddsidemargin}{-69pt}\begin{document}$$V_1=4.69$$\end{document}
 and
\documentclass[12pt]{minimal}\usepackage{amsmath}\usepackage{wasysym}\usepackage{amsfonts}\usepackage{amssymb}\usepackage{amsbsy}\usepackage{mathrsfs}\usepackage{upgreek}\setlength{\oddsidemargin}{-69pt}\begin{document}$$V_2=16.99$$\end{document}
and
\documentclass[12pt]{minimal}\usepackage{amsmath}\usepackage{wasysym}\usepackage{amsfonts}\usepackage{amssymb}\usepackage{amsbsy}\usepackage{mathrsfs}\usepackage{upgreek}\setlength{\oddsidemargin}{-69pt}\begin{document}$$V_2=16.99$$\end{document}
 , where the second response function shows a decrease at a denser region of
\documentclass[12pt]{minimal}\usepackage{amsmath}\usepackage{wasysym}\usepackage{amsfonts}\usepackage{amssymb}\usepackage{amsbsy}\usepackage{mathrsfs}\usepackage{upgreek}\setlength{\oddsidemargin}{-69pt}\begin{document}$$\Theta $$\end{document}
, where the second response function shows a decrease at a denser region of
\documentclass[12pt]{minimal}\usepackage{amsmath}\usepackage{wasysym}\usepackage{amsfonts}\usepackage{amssymb}\usepackage{amsbsy}\usepackage{mathrsfs}\usepackage{upgreek}\setlength{\oddsidemargin}{-69pt}\begin{document}$$\Theta $$\end{document}
 .
.
3.3.2. Results
Let
\documentclass[12pt]{minimal}\usepackage{amsmath}\usepackage{wasysym}\usepackage{amsfonts}\usepackage{amssymb}\usepackage{amsbsy}\usepackage{mathrsfs}\usepackage{upgreek}\setlength{\oddsidemargin}{-69pt}\begin{document}$$V_{\text{ M }}$$\end{document}
 denote the average value of
\documentclass[12pt]{minimal}\usepackage{amsmath}\usepackage{wasysym}\usepackage{amsfonts}\usepackage{amssymb}\usepackage{amsbsy}\usepackage{mathrsfs}\usepackage{upgreek}\setlength{\oddsidemargin}{-69pt}\begin{document}$$V_i$$\end{document}
denote the average value of
\documentclass[12pt]{minimal}\usepackage{amsmath}\usepackage{wasysym}\usepackage{amsfonts}\usepackage{amssymb}\usepackage{amsbsy}\usepackage{mathrsfs}\usepackage{upgreek}\setlength{\oddsidemargin}{-69pt}\begin{document}$$V_i$$\end{document}
 , across the four items. The results of the simulation show that
\documentclass[12pt]{minimal}\usepackage{amsmath}\usepackage{wasysym}\usepackage{amsfonts}\usepackage{amssymb}\usepackage{amsbsy}\usepackage{mathrsfs}\usepackage{upgreek}\setlength{\oddsidemargin}{-69pt}\begin{document}$${\overline{V}}_{\text{ M }}=8.169$$\end{document}
, across the four items. The results of the simulation show that
\documentclass[12pt]{minimal}\usepackage{amsmath}\usepackage{wasysym}\usepackage{amsfonts}\usepackage{amssymb}\usepackage{amsbsy}\usepackage{mathrsfs}\usepackage{upgreek}\setlength{\oddsidemargin}{-69pt}\begin{document}$${\overline{V}}_{\text{ M }}=8.169$$\end{document}
 across the 10,000 generated cases (with the 1st and 3th quartile at 6.389 and 9.700, respectively), which is about equal to the value of
\documentclass[12pt]{minimal}\usepackage{amsmath}\usepackage{wasysym}\usepackage{amsfonts}\usepackage{amssymb}\usepackage{amsbsy}\usepackage{mathrsfs}\usepackage{upgreek}\setlength{\oddsidemargin}{-69pt}\begin{document}$$V_{\text{ M }}$$\end{document}
across the 10,000 generated cases (with the 1st and 3th quartile at 6.389 and 9.700, respectively), which is about equal to the value of
\documentclass[12pt]{minimal}\usepackage{amsmath}\usepackage{wasysym}\usepackage{amsfonts}\usepackage{amssymb}\usepackage{amsbsy}\usepackage{mathrsfs}\usepackage{upgreek}\setlength{\oddsidemargin}{-69pt}\begin{document}$$V_{\text{ M }}$$\end{document}
 obtained for Fig. 8.
Assessing the validity of the observable properties and evaluating the distributions of
\documentclass[12pt]{minimal}\usepackage{amsmath}\usepackage{wasysym}\usepackage{amsfonts}\usepackage{amssymb}\usepackage{amsbsy}\usepackage{mathrsfs}\usepackage{upgreek}\setlength{\oddsidemargin}{-69pt}\begin{document}$$V_{\text{ M }}$$\end{document}
 for those cases for which the properties held true showed that the distributions of
\documentclass[12pt]{minimal}\usepackage{amsmath}\usepackage{wasysym}\usepackage{amsfonts}\usepackage{amssymb}\usepackage{amsbsy}\usepackage{mathrsfs}\usepackage{upgreek}\setlength{\oddsidemargin}{-69pt}\begin{document}$$V_{\text{ M }}$$\end{document}
for those cases for which the properties held true showed that the distributions of
\documentclass[12pt]{minimal}\usepackage{amsmath}\usepackage{wasysym}\usepackage{amsfonts}\usepackage{amssymb}\usepackage{amsbsy}\usepackage{mathrsfs}\usepackage{upgreek}\setlength{\oddsidemargin}{-69pt}\begin{document}$$V_{\text{ M }}$$\end{document}
 were about the same for the properties 3-SPOD, A, and SPOD, and about the same for both
\documentclass[12pt]{minimal}\usepackage{amsmath}\usepackage{wasysym}\usepackage{amsfonts}\usepackage{amssymb}\usepackage{amsbsy}\usepackage{mathrsfs}\usepackage{upgreek}\setlength{\oddsidemargin}{-69pt}\begin{document}$$\hbox {MTP}_2$$\end{document}
were about the same for the properties 3-SPOD, A, and SPOD, and about the same for both
\documentclass[12pt]{minimal}\usepackage{amsmath}\usepackage{wasysym}\usepackage{amsfonts}\usepackage{amssymb}\usepackage{amsbsy}\usepackage{mathrsfs}\usepackage{upgreek}\setlength{\oddsidemargin}{-69pt}\begin{document}$$\hbox {MTP}_2$$\end{document}
 and CA. The results of the simulation are therefore discussed further only for the properties NC, 3-CA, NPC, SPOD, MM, and CA.
For each property, Fig. 9 shows the estimated densities of
\documentclass[12pt]{minimal}\usepackage{amsmath}\usepackage{wasysym}\usepackage{amsfonts}\usepackage{amssymb}\usepackage{amsbsy}\usepackage{mathrsfs}\usepackage{upgreek}\setlength{\oddsidemargin}{-69pt}\begin{document}$$V_{\text{ M }}$$\end{document}
 (vertically displayed) in case the property was satisfied (True; false discovery) and in case it was violated (False). Figure 9 also shows the percentage of times each property was satisfied, with property CA satisfied about 24.67% of the time, 3-CA satisfied about half the time, and the remaining properties satisfied most of the time. The percentages listed in Fig. 9 roughly agree with the hierarchical ordering of the property in Fig. 1.
Conditions distributions of the size of the violations of M (
\documentclass[12pt]{minimal}\usepackage{amsmath}\usepackage{wasysym}\usepackage{amsfonts}\usepackage{amssymb}\usepackage{amsbsy}\usepackage{mathrsfs}\usepackage{upgreek}\setlength{\oddsidemargin}{-69pt}\begin{document}$$V_{\text{ M }}$$\end{document}
 ), given that the properties NC, 3-CA, NPC, SPOD, MM, and CA hold (True; with percentage of cases) or are violated (False). Results for the properties 3-SPOD and A are similar as for 3-CA, and the results for
\documentclass[12pt]{minimal}\usepackage{amsmath}\usepackage{wasysym}\usepackage{amsfonts}\usepackage{amssymb}\usepackage{amsbsy}\usepackage{mathrsfs}\usepackage{upgreek}\setlength{\oddsidemargin}{-69pt}\begin{document}$$\hbox {MTP}_2$$\end{document}
), given that the properties NC, 3-CA, NPC, SPOD, MM, and CA hold (True; with percentage of cases) or are violated (False). Results for the properties 3-SPOD and A are similar as for 3-CA, and the results for
\documentclass[12pt]{minimal}\usepackage{amsmath}\usepackage{wasysym}\usepackage{amsfonts}\usepackage{amssymb}\usepackage{amsbsy}\usepackage{mathrsfs}\usepackage{upgreek}\setlength{\oddsidemargin}{-69pt}\begin{document}$$\hbox {MTP}_2$$\end{document}
 are similar as for CA.

The differences of the violations
\documentclass[12pt]{minimal}\usepackage{amsmath}\usepackage{wasysym}\usepackage{amsfonts}\usepackage{amssymb}\usepackage{amsbsy}\usepackage{mathrsfs}\usepackage{upgreek}\setlength{\oddsidemargin}{-69pt}\begin{document}$$V_{\text{ M }}$$\end{document}
 between the True cases and the False cases were found to be of a small to medium size for the properties 3-CA, MM, and CA, in in accordance to Cohen’s (Reference Cohen1988) d. Figure 9 shows that the properties NPC, NC, and SPOD are most sensitive to the size of the violations of M, each corresponding to a large effect size, with the larges value
\documentclass[12pt]{minimal}\usepackage{amsmath}\usepackage{wasysym}\usepackage{amsfonts}\usepackage{amssymb}\usepackage{amsbsy}\usepackage{mathrsfs}\usepackage{upgreek}\setlength{\oddsidemargin}{-69pt}\begin{document}$$d=1.127$$\end{document}
between the True cases and the False cases were found to be of a small to medium size for the properties 3-CA, MM, and CA, in in accordance to Cohen’s (Reference Cohen1988) d. Figure 9 shows that the properties NPC, NC, and SPOD are most sensitive to the size of the violations of M, each corresponding to a large effect size, with the larges value
\documentclass[12pt]{minimal}\usepackage{amsmath}\usepackage{wasysym}\usepackage{amsfonts}\usepackage{amssymb}\usepackage{amsbsy}\usepackage{mathrsfs}\usepackage{upgreek}\setlength{\oddsidemargin}{-69pt}\begin{document}$$d=1.127$$\end{document}
 . Hence, SPOD is not sensitive to violations of M in a strict sense (only rejected about 6.21% of the time), but the property is more likely to be rejected when the violations of M are larger. This in contrast to property CA, which is generally more likely to be rejected, irrespective of the size of the violations. For practical purposes, however, it may be argued that a relative small violation of M should not matter. This would mean that CA may impose constraints on the observable data distribution that just are too restrictive. For example, one might only be interested in testing the MH model assumptions, because this model implies a MLR ordering on the latent variable by the sum score. Then, for the practical use of the sum score, the size of the violation of assumption M matters only to the extent to which it jeopardizes the MLR property.
3.3.3. The Monotone Likelihood Ratio Property
To assess the influence of the M assumption on the MLR property, the response functions that violate M are combined for each of the 10,000 cases to give an expression for the violation of property MLR, similar to
\documentclass[12pt]{minimal}\usepackage{amsmath}\usepackage{wasysym}\usepackage{amsfonts}\usepackage{amssymb}\usepackage{amsbsy}\usepackage{mathrsfs}\usepackage{upgreek}\setlength{\oddsidemargin}{-69pt}\begin{document}$$V_{\text{ M }}$$\end{document}
 . To this end, let
\documentclass[12pt]{minimal}\usepackage{amsmath}\usepackage{wasysym}\usepackage{amsfonts}\usepackage{amssymb}\usepackage{amsbsy}\usepackage{mathrsfs}\usepackage{upgreek}\setlength{\oddsidemargin}{-69pt}\begin{document}$${\mathbf {E}}=\mathbf {HA}$$\end{document}
. To this end, let
\documentclass[12pt]{minimal}\usepackage{amsmath}\usepackage{wasysym}\usepackage{amsfonts}\usepackage{amssymb}\usepackage{amsbsy}\usepackage{mathrsfs}\usepackage{upgreek}\setlength{\oddsidemargin}{-69pt}\begin{document}$${\mathbf {E}}=\mathbf {HA}$$\end{document}
 , with element
\documentclass[12pt]{minimal}\usepackage{amsmath}\usepackage{wasysym}\usepackage{amsfonts}\usepackage{amssymb}\usepackage{amsbsy}\usepackage{mathrsfs}\usepackage{upgreek}\setlength{\oddsidemargin}{-69pt}\begin{document}$$e_{sk}=P(S=s-1|\Theta =k)$$\end{document}
, with element
\documentclass[12pt]{minimal}\usepackage{amsmath}\usepackage{wasysym}\usepackage{amsfonts}\usepackage{amssymb}\usepackage{amsbsy}\usepackage{mathrsfs}\usepackage{upgreek}\setlength{\oddsidemargin}{-69pt}\begin{document}$$e_{sk}=P(S=s-1|\Theta =k)$$\end{document}
 . Here,
\documentclass[12pt]{minimal}\usepackage{amsmath}\usepackage{wasysym}\usepackage{amsfonts}\usepackage{amssymb}\usepackage{amsbsy}\usepackage{mathrsfs}\usepackage{upgreek}\setlength{\oddsidemargin}{-69pt}\begin{document}$${\mathbf {A}}$$\end{document}
. Here,
\documentclass[12pt]{minimal}\usepackage{amsmath}\usepackage{wasysym}\usepackage{amsfonts}\usepackage{amssymb}\usepackage{amsbsy}\usepackage{mathrsfs}\usepackage{upgreek}\setlength{\oddsidemargin}{-69pt}\begin{document}$${\mathbf {A}}$$\end{document}
 is obtained from the simulation and
\documentclass[12pt]{minimal}\usepackage{amsmath}\usepackage{wasysym}\usepackage{amsfonts}\usepackage{amssymb}\usepackage{amsbsy}\usepackage{mathrsfs}\usepackage{upgreek}\setlength{\oddsidemargin}{-69pt}\begin{document}$${\mathbf {H}}$$\end{document}
is obtained from the simulation and
\documentclass[12pt]{minimal}\usepackage{amsmath}\usepackage{wasysym}\usepackage{amsfonts}\usepackage{amssymb}\usepackage{amsbsy}\usepackage{mathrsfs}\usepackage{upgreek}\setlength{\oddsidemargin}{-69pt}\begin{document}$${\mathbf {H}}$$\end{document}
 is a matrix to relate the vectors
\documentclass[12pt]{minimal}\usepackage{amsmath}\usepackage{wasysym}\usepackage{amsfonts}\usepackage{amssymb}\usepackage{amsbsy}\usepackage{mathrsfs}\usepackage{upgreek}\setlength{\oddsidemargin}{-69pt}\begin{document}$$\varvec{x}$$\end{document}
is a matrix to relate the vectors
\documentclass[12pt]{minimal}\usepackage{amsmath}\usepackage{wasysym}\usepackage{amsfonts}\usepackage{amssymb}\usepackage{amsbsy}\usepackage{mathrsfs}\usepackage{upgreek}\setlength{\oddsidemargin}{-69pt}\begin{document}$$\varvec{x}$$\end{document}
 to their sum scores. Specifically, let
\documentclass[12pt]{minimal}\usepackage{amsmath}\usepackage{wasysym}\usepackage{amsfonts}\usepackage{amssymb}\usepackage{amsbsy}\usepackage{mathrsfs}\usepackage{upgreek}\setlength{\oddsidemargin}{-69pt}\begin{document}$${\mathbf {H}}_1={\mathbf {I}}_2$$\end{document}
to their sum scores. Specifically, let
\documentclass[12pt]{minimal}\usepackage{amsmath}\usepackage{wasysym}\usepackage{amsfonts}\usepackage{amssymb}\usepackage{amsbsy}\usepackage{mathrsfs}\usepackage{upgreek}\setlength{\oddsidemargin}{-69pt}\begin{document}$${\mathbf {H}}_1={\mathbf {I}}_2$$\end{document}
 and
\documentclass[12pt]{minimal}\usepackage{amsmath}\usepackage{wasysym}\usepackage{amsfonts}\usepackage{amssymb}\usepackage{amsbsy}\usepackage{mathrsfs}\usepackage{upgreek}\setlength{\oddsidemargin}{-69pt}\begin{document}$${\mathbf {H}}_{i+1}=[({\mathbf {H}}_i,\varvec{0}^\prime )^\prime ,(\varvec{0}^\prime ,{\mathbf {H}}_i)^\prime ]$$\end{document}
and
\documentclass[12pt]{minimal}\usepackage{amsmath}\usepackage{wasysym}\usepackage{amsfonts}\usepackage{amssymb}\usepackage{amsbsy}\usepackage{mathrsfs}\usepackage{upgreek}\setlength{\oddsidemargin}{-69pt}\begin{document}$${\mathbf {H}}_{i+1}=[({\mathbf {H}}_i,\varvec{0}^\prime )^\prime ,(\varvec{0}^\prime ,{\mathbf {H}}_i)^\prime ]$$\end{document}
 , from which
\documentclass[12pt]{minimal}\usepackage{amsmath}\usepackage{wasysym}\usepackage{amsfonts}\usepackage{amssymb}\usepackage{amsbsy}\usepackage{mathrsfs}\usepackage{upgreek}\setlength{\oddsidemargin}{-69pt}\begin{document}$${\mathbf {H}}={\mathbf {H}}_J$$\end{document}
, from which
\documentclass[12pt]{minimal}\usepackage{amsmath}\usepackage{wasysym}\usepackage{amsfonts}\usepackage{amssymb}\usepackage{amsbsy}\usepackage{mathrsfs}\usepackage{upgreek}\setlength{\oddsidemargin}{-69pt}\begin{document}$${\mathbf {H}}={\mathbf {H}}_J$$\end{document}
 is obtained sequentially. Then, vector
\documentclass[12pt]{minimal}\usepackage{amsmath}\usepackage{wasysym}\usepackage{amsfonts}\usepackage{amssymb}\usepackage{amsbsy}\usepackage{mathrsfs}\usepackage{upgreek}\setlength{\oddsidemargin}{-69pt}\begin{document}$$\varvec{b}_s=(b_{s1},\ldots ,b_{s16})^\prime $$\end{document}
is obtained sequentially. Then, vector
\documentclass[12pt]{minimal}\usepackage{amsmath}\usepackage{wasysym}\usepackage{amsfonts}\usepackage{amssymb}\usepackage{amsbsy}\usepackage{mathrsfs}\usepackage{upgreek}\setlength{\oddsidemargin}{-69pt}\begin{document}$$\varvec{b}_s=(b_{s1},\ldots ,b_{s16})^\prime $$\end{document}
 , with

The MLR property requires this last expression is non-decreasing in k. Hence, defining
\documentclass[12pt]{minimal}\usepackage{amsmath}\usepackage{wasysym}\usepackage{amsfonts}\usepackage{amssymb}\usepackage{amsbsy}\usepackage{mathrsfs}\usepackage{upgreek}\setlength{\oddsidemargin}{-69pt}\begin{document}$$\varvec{d}_s$$\end{document}
 analogous to
\documentclass[12pt]{minimal}\usepackage{amsmath}\usepackage{wasysym}\usepackage{amsfonts}\usepackage{amssymb}\usepackage{amsbsy}\usepackage{mathrsfs}\usepackage{upgreek}\setlength{\oddsidemargin}{-69pt}\begin{document}$$\varvec{d}_i$$\end{document}
analogous to
\documentclass[12pt]{minimal}\usepackage{amsmath}\usepackage{wasysym}\usepackage{amsfonts}\usepackage{amssymb}\usepackage{amsbsy}\usepackage{mathrsfs}\usepackage{upgreek}\setlength{\oddsidemargin}{-69pt}\begin{document}$$\varvec{d}_i$$\end{document}
 , we define
\documentclass[12pt]{minimal}\usepackage{amsmath}\usepackage{wasysym}\usepackage{amsfonts}\usepackage{amssymb}\usepackage{amsbsy}\usepackage{mathrsfs}\usepackage{upgreek}\setlength{\oddsidemargin}{-69pt}\begin{document}$$V_{\text{ MLR }}$$\end{document}
, we define
\documentclass[12pt]{minimal}\usepackage{amsmath}\usepackage{wasysym}\usepackage{amsfonts}\usepackage{amssymb}\usepackage{amsbsy}\usepackage{mathrsfs}\usepackage{upgreek}\setlength{\oddsidemargin}{-69pt}\begin{document}$$V_{\text{ MLR }}$$\end{document}
 as the average of
\documentclass[12pt]{minimal}\usepackage{amsmath}\usepackage{wasysym}\usepackage{amsfonts}\usepackage{amssymb}\usepackage{amsbsy}\usepackage{mathrsfs}\usepackage{upgreek}\setlength{\oddsidemargin}{-69pt}\begin{document}$$V_s$$\end{document}
as the average of
\documentclass[12pt]{minimal}\usepackage{amsmath}\usepackage{wasysym}\usepackage{amsfonts}\usepackage{amssymb}\usepackage{amsbsy}\usepackage{mathrsfs}\usepackage{upgreek}\setlength{\oddsidemargin}{-69pt}\begin{document}$$V_s$$\end{document}
 obtained from (7) after substituting the item index by the sum score s.
Figure 10 contains the density plot with the estimated 50%, 95%, and 99% confidence regions of
\documentclass[12pt]{minimal}\usepackage{amsmath}\usepackage{wasysym}\usepackage{amsfonts}\usepackage{amssymb}\usepackage{amsbsy}\usepackage{mathrsfs}\usepackage{upgreek}\setlength{\oddsidemargin}{-69pt}\begin{document}$$\ln V_{\text{ M }}$$\end{document}
 and
\documentclass[12pt]{minimal}\usepackage{amsmath}\usepackage{wasysym}\usepackage{amsfonts}\usepackage{amssymb}\usepackage{amsbsy}\usepackage{mathrsfs}\usepackage{upgreek}\setlength{\oddsidemargin}{-69pt}\begin{document}$$\ln V_{\text{ MLR }}$$\end{document}
and
\documentclass[12pt]{minimal}\usepackage{amsmath}\usepackage{wasysym}\usepackage{amsfonts}\usepackage{amssymb}\usepackage{amsbsy}\usepackage{mathrsfs}\usepackage{upgreek}\setlength{\oddsidemargin}{-69pt}\begin{document}$$\ln V_{\text{ MLR }}$$\end{document}
 , which shows a weak but positive relationship between the size of the violations of M and the size of the violations of MLR. As the size of the violation of M increases, so does the strength of the relationship. However, the size of the violations of MLR is generally small, with
\documentclass[12pt]{minimal}\usepackage{amsmath}\usepackage{wasysym}\usepackage{amsfonts}\usepackage{amssymb}\usepackage{amsbsy}\usepackage{mathrsfs}\usepackage{upgreek}\setlength{\oddsidemargin}{-69pt}\begin{document}$${\overline{V}}_{\text{ MLR }}=2.011$$\end{document}
, which shows a weak but positive relationship between the size of the violations of M and the size of the violations of MLR. As the size of the violation of M increases, so does the strength of the relationship. However, the size of the violations of MLR is generally small, with
\documentclass[12pt]{minimal}\usepackage{amsmath}\usepackage{wasysym}\usepackage{amsfonts}\usepackage{amssymb}\usepackage{amsbsy}\usepackage{mathrsfs}\usepackage{upgreek}\setlength{\oddsidemargin}{-69pt}\begin{document}$${\overline{V}}_{\text{ MLR }}=2.011$$\end{document}
 (the 1st and 3th quartile at 1.018 and 2.565, respectively). This means that none of the violations of M substantially invalidate the MLR property. The values
\documentclass[12pt]{minimal}\usepackage{amsmath}\usepackage{wasysym}\usepackage{amsfonts}\usepackage{amssymb}\usepackage{amsbsy}\usepackage{mathrsfs}\usepackage{upgreek}\setlength{\oddsidemargin}{-69pt}\begin{document}$$V_{\text{ MLR }}$$\end{document}
(the 1st and 3th quartile at 1.018 and 2.565, respectively). This means that none of the violations of M substantially invalidate the MLR property. The values
\documentclass[12pt]{minimal}\usepackage{amsmath}\usepackage{wasysym}\usepackage{amsfonts}\usepackage{amssymb}\usepackage{amsbsy}\usepackage{mathrsfs}\usepackage{upgreek}\setlength{\oddsidemargin}{-69pt}\begin{document}$$V_{\text{ MLR }}$$\end{document}
 were further compared between the True and False cases, for each property. These results showed no difference beyond a small effect size for any of the observable properties. Hence, the results suggest that the MLR property is robust against violations of assumption M.
Empirical confidence regions of the size of the violation of M against the size of the violation of property MLR (on a logarithmic scale).

Molenaar (Reference Molenaar1997) generalized the MH model to polytomously scored items, where assumption M can be defined for different definitions of the response function (Mellenbergh, Reference Mellenbergh1995). Unlike the MH model for binary response data, these polytomous models do not imply the MLR property (Hemker et al., Reference Hemker, Sijtsma, Molenaar and Junker1996, Reference Hemker, Sijtsma, Molenaar and Junker1997) without imposing additional restrictions on the shape of the response function (Ligtvoet, Reference Ligtvoet2012). Although these polytomous models (assuming UD and LI) do not imply the MLR property, Van der Ark (Reference Van der Ark2005) found that generally only few violations of MLR actually occurred, and that these violations had little effect on the ordering of respondents by their sum score. Our results for violations of M for binary response data are in line with these findings.
3.4. Violations of Local Independence (Continued)
For the practical use of the sum score, it was found that the violations of M have little impact on the validity of the MLR property. Here, we consider again the MH model assumption of LI and investigate the impact a violation of LI has on the MLR property, using a latent class approach. As a model for generating the probabilities
\documentclass[12pt]{minimal}\usepackage{amsmath}\usepackage{wasysym}\usepackage{amsfonts}\usepackage{amssymb}\usepackage{amsbsy}\usepackage{mathrsfs}\usepackage{upgreek}\setlength{\oddsidemargin}{-69pt}\begin{document}$$P(\varvec{X}=\varvec{x}|\Theta =k)$$\end{document}
 , the assumptions proposed by Holland (Reference Holland1981) are considered (Sect. 1.1.5), for
\documentclass[12pt]{minimal}\usepackage{amsmath}\usepackage{wasysym}\usepackage{amsfonts}\usepackage{amssymb}\usepackage{amsbsy}\usepackage{mathrsfs}\usepackage{upgreek}\setlength{\oddsidemargin}{-69pt}\begin{document}$$J=3$$\end{document}
, the assumptions proposed by Holland (Reference Holland1981) are considered (Sect. 1.1.5), for
\documentclass[12pt]{minimal}\usepackage{amsmath}\usepackage{wasysym}\usepackage{amsfonts}\usepackage{amssymb}\usepackage{amsbsy}\usepackage{mathrsfs}\usepackage{upgreek}\setlength{\oddsidemargin}{-69pt}\begin{document}$$J=3$$\end{document}
 items. This small number of items clearly limits the extent to which the results can be generalized (as with the previous studies), so the results of this study should only be interpreted tentatively.
3.4.1. Procedure
For eight latent classes, let the matrix
\documentclass[12pt]{minimal}\usepackage{amsmath}\usepackage{wasysym}\usepackage{amsfonts}\usepackage{amssymb}\usepackage{amsbsy}\usepackage{mathrsfs}\usepackage{upgreek}\setlength{\oddsidemargin}{-69pt}\begin{document}$${\mathbf {P}}=(\varvec{p}_1,\ldots ,\varvec{p}_8)$$\end{document}
 contain the elements
\documentclass[12pt]{minimal}\usepackage{amsmath}\usepackage{wasysym}\usepackage{amsfonts}\usepackage{amssymb}\usepackage{amsbsy}\usepackage{mathrsfs}\usepackage{upgreek}\setlength{\oddsidemargin}{-69pt}\begin{document}$$p_{jk}=P(\varvec{X}=\varvec{x}|\Theta =k)$$\end{document}
contain the elements
\documentclass[12pt]{minimal}\usepackage{amsmath}\usepackage{wasysym}\usepackage{amsfonts}\usepackage{amssymb}\usepackage{amsbsy}\usepackage{mathrsfs}\usepackage{upgreek}\setlength{\oddsidemargin}{-69pt}\begin{document}$$p_{jk}=P(\varvec{X}=\varvec{x}|\Theta =k)$$\end{document}
 , for which assumption LND dictates that each
\documentclass[12pt]{minimal}\usepackage{amsmath}\usepackage{wasysym}\usepackage{amsfonts}\usepackage{amssymb}\usepackage{amsbsy}\usepackage{mathrsfs}\usepackage{upgreek}\setlength{\oddsidemargin}{-69pt}\begin{document}$$\varvec{p}_k$$\end{document}
, for which assumption LND dictates that each
\documentclass[12pt]{minimal}\usepackage{amsmath}\usepackage{wasysym}\usepackage{amsfonts}\usepackage{amssymb}\usepackage{amsbsy}\usepackage{mathrsfs}\usepackage{upgreek}\setlength{\oddsidemargin}{-69pt}\begin{document}$$\varvec{p}_k$$\end{document}
 is SPOD. For three items, SPOD coincides with property A, so LND implies that
\documentclass[12pt]{minimal}\usepackage{amsmath}\usepackage{wasysym}\usepackage{amsfonts}\usepackage{amssymb}\usepackage{amsbsy}\usepackage{mathrsfs}\usepackage{upgreek}\setlength{\oddsidemargin}{-69pt}\begin{document}$${\mathbf {K}}\log ({\mathbf {M}}\varvec{p}_k)\ge \varvec{0}$$\end{document}
is SPOD. For three items, SPOD coincides with property A, so LND implies that
\documentclass[12pt]{minimal}\usepackage{amsmath}\usepackage{wasysym}\usepackage{amsfonts}\usepackage{amssymb}\usepackage{amsbsy}\usepackage{mathrsfs}\usepackage{upgreek}\setlength{\oddsidemargin}{-69pt}\begin{document}$${\mathbf {K}}\log ({\mathbf {M}}\varvec{p}_k)\ge \varvec{0}$$\end{document}
 , for
\documentclass[12pt]{minimal}\usepackage{amsmath}\usepackage{wasysym}\usepackage{amsfonts}\usepackage{amssymb}\usepackage{amsbsy}\usepackage{mathrsfs}\usepackage{upgreek}\setlength{\oddsidemargin}{-69pt}\begin{document}$$k=1,\ldots ,8$$\end{document}
, for
\documentclass[12pt]{minimal}\usepackage{amsmath}\usepackage{wasysym}\usepackage{amsfonts}\usepackage{amssymb}\usepackage{amsbsy}\usepackage{mathrsfs}\usepackage{upgreek}\setlength{\oddsidemargin}{-69pt}\begin{document}$$k=1,\ldots ,8$$\end{document}
 , and with the design matrix
\documentclass[12pt]{minimal}\usepackage{amsmath}\usepackage{wasysym}\usepackage{amsfonts}\usepackage{amssymb}\usepackage{amsbsy}\usepackage{mathrsfs}\usepackage{upgreek}\setlength{\oddsidemargin}{-69pt}\begin{document}$${\mathbf {M}}$$\end{document}
, and with the design matrix
\documentclass[12pt]{minimal}\usepackage{amsmath}\usepackage{wasysym}\usepackage{amsfonts}\usepackage{amssymb}\usepackage{amsbsy}\usepackage{mathrsfs}\usepackage{upgreek}\setlength{\oddsidemargin}{-69pt}\begin{document}$${\mathbf {M}}$$\end{document}
 given in (2). That is, LND imposed constraints on the entries within each column of
\documentclass[12pt]{minimal}\usepackage{amsmath}\usepackage{wasysym}\usepackage{amsfonts}\usepackage{amssymb}\usepackage{amsbsy}\usepackage{mathrsfs}\usepackage{upgreek}\setlength{\oddsidemargin}{-69pt}\begin{document}$${\mathbf {P}}$$\end{document}
given in (2). That is, LND imposed constraints on the entries within each column of
\documentclass[12pt]{minimal}\usepackage{amsmath}\usepackage{wasysym}\usepackage{amsfonts}\usepackage{amssymb}\usepackage{amsbsy}\usepackage{mathrsfs}\usepackage{upgreek}\setlength{\oddsidemargin}{-69pt}\begin{document}$${\mathbf {P}}$$\end{document}
 . The monotonicity requirements in (4a) and (4a) impose additional constraints across the columns of
\documentclass[12pt]{minimal}\usepackage{amsmath}\usepackage{wasysym}\usepackage{amsfonts}\usepackage{amssymb}\usepackage{amsbsy}\usepackage{mathrsfs}\usepackage{upgreek}\setlength{\oddsidemargin}{-69pt}\begin{document}$${\mathbf {P}}$$\end{document}
. The monotonicity requirements in (4a) and (4a) impose additional constraints across the columns of
\documentclass[12pt]{minimal}\usepackage{amsmath}\usepackage{wasysym}\usepackage{amsfonts}\usepackage{amssymb}\usepackage{amsbsy}\usepackage{mathrsfs}\usepackage{upgreek}\setlength{\oddsidemargin}{-69pt}\begin{document}$${\mathbf {P}}$$\end{document}
 . Let
\documentclass[12pt]{minimal}\usepackage{amsmath}\usepackage{wasysym}\usepackage{amsfonts}\usepackage{amssymb}\usepackage{amsbsy}\usepackage{mathrsfs}\usepackage{upgreek}\setlength{\oddsidemargin}{-69pt}\begin{document}$${\mathbf {N}}_0=((0,1)^\prime ,(1,1)^\prime )$$\end{document}
. Let
\documentclass[12pt]{minimal}\usepackage{amsmath}\usepackage{wasysym}\usepackage{amsfonts}\usepackage{amssymb}\usepackage{amsbsy}\usepackage{mathrsfs}\usepackage{upgreek}\setlength{\oddsidemargin}{-69pt}\begin{document}$${\mathbf {N}}_0=((0,1)^\prime ,(1,1)^\prime )$$\end{document}
 ,
\documentclass[12pt]{minimal}\usepackage{amsmath}\usepackage{wasysym}\usepackage{amsfonts}\usepackage{amssymb}\usepackage{amsbsy}\usepackage{mathrsfs}\usepackage{upgreek}\setlength{\oddsidemargin}{-69pt}\begin{document}$${\mathbf {N}}_1={\mathbf {N}}_0\otimes {\mathbf {N}}_0\otimes {\mathbf {N}}_0$$\end{document}
,
\documentclass[12pt]{minimal}\usepackage{amsmath}\usepackage{wasysym}\usepackage{amsfonts}\usepackage{amssymb}\usepackage{amsbsy}\usepackage{mathrsfs}\usepackage{upgreek}\setlength{\oddsidemargin}{-69pt}\begin{document}$${\mathbf {N}}_1={\mathbf {N}}_0\otimes {\mathbf {N}}_0\otimes {\mathbf {N}}_0$$\end{document}
 , and
\documentclass[12pt]{minimal}\usepackage{amsmath}\usepackage{wasysym}\usepackage{amsfonts}\usepackage{amssymb}\usepackage{amsbsy}\usepackage{mathrsfs}\usepackage{upgreek}\setlength{\oddsidemargin}{-69pt}\begin{document}$${\mathbf {N}}_2$$\end{document}
, and
\documentclass[12pt]{minimal}\usepackage{amsmath}\usepackage{wasysym}\usepackage{amsfonts}\usepackage{amssymb}\usepackage{amsbsy}\usepackage{mathrsfs}\usepackage{upgreek}\setlength{\oddsidemargin}{-69pt}\begin{document}$${\mathbf {N}}_2$$\end{document}
 is like
\documentclass[12pt]{minimal}\usepackage{amsmath}\usepackage{wasysym}\usepackage{amsfonts}\usepackage{amssymb}\usepackage{amsbsy}\usepackage{mathrsfs}\usepackage{upgreek}\setlength{\oddsidemargin}{-69pt}\begin{document}$${\mathbf {N}}_1$$\end{document}
is like
\documentclass[12pt]{minimal}\usepackage{amsmath}\usepackage{wasysym}\usepackage{amsfonts}\usepackage{amssymb}\usepackage{amsbsy}\usepackage{mathrsfs}\usepackage{upgreek}\setlength{\oddsidemargin}{-69pt}\begin{document}$${\mathbf {N}}_1$$\end{document}
 but with its columns reversed. Then, the monotonicity assumption implies that the elements within each rows of
\documentclass[12pt]{minimal}\usepackage{amsmath}\usepackage{wasysym}\usepackage{amsfonts}\usepackage{amssymb}\usepackage{amsbsy}\usepackage{mathrsfs}\usepackage{upgreek}\setlength{\oddsidemargin}{-69pt}\begin{document}$${\mathbf {N}}_1{\mathbf {P}}$$\end{document}
but with its columns reversed. Then, the monotonicity assumption implies that the elements within each rows of
\documentclass[12pt]{minimal}\usepackage{amsmath}\usepackage{wasysym}\usepackage{amsfonts}\usepackage{amssymb}\usepackage{amsbsy}\usepackage{mathrsfs}\usepackage{upgreek}\setlength{\oddsidemargin}{-69pt}\begin{document}$${\mathbf {N}}_1{\mathbf {P}}$$\end{document}
 are non-decreasing in k, and for
\documentclass[12pt]{minimal}\usepackage{amsmath}\usepackage{wasysym}\usepackage{amsfonts}\usepackage{amssymb}\usepackage{amsbsy}\usepackage{mathrsfs}\usepackage{upgreek}\setlength{\oddsidemargin}{-69pt}\begin{document}$${\mathbf {N}}_2{\mathbf {P}}$$\end{document}
are non-decreasing in k, and for
\documentclass[12pt]{minimal}\usepackage{amsmath}\usepackage{wasysym}\usepackage{amsfonts}\usepackage{amssymb}\usepackage{amsbsy}\usepackage{mathrsfs}\usepackage{upgreek}\setlength{\oddsidemargin}{-69pt}\begin{document}$${\mathbf {N}}_2{\mathbf {P}}$$\end{document}
 non-increasing in k. Hence, the assumptions proposed by Holland (Reference Holland1981) correspond to the restrictions impose on
\documentclass[12pt]{minimal}\usepackage{amsmath}\usepackage{wasysym}\usepackage{amsfonts}\usepackage{amssymb}\usepackage{amsbsy}\usepackage{mathrsfs}\usepackage{upgreek}\setlength{\oddsidemargin}{-69pt}\begin{document}$${\mathbf {P}}$$\end{document}
non-increasing in k. Hence, the assumptions proposed by Holland (Reference Holland1981) correspond to the restrictions impose on
\documentclass[12pt]{minimal}\usepackage{amsmath}\usepackage{wasysym}\usepackage{amsfonts}\usepackage{amssymb}\usepackage{amsbsy}\usepackage{mathrsfs}\usepackage{upgreek}\setlength{\oddsidemargin}{-69pt}\begin{document}$${\mathbf {P}}$$\end{document}
 by the matrices
\documentclass[12pt]{minimal}\usepackage{amsmath}\usepackage{wasysym}\usepackage{amsfonts}\usepackage{amssymb}\usepackage{amsbsy}\usepackage{mathrsfs}\usepackage{upgreek}\setlength{\oddsidemargin}{-69pt}\begin{document}$${\mathbf {M}}$$\end{document}
by the matrices
\documentclass[12pt]{minimal}\usepackage{amsmath}\usepackage{wasysym}\usepackage{amsfonts}\usepackage{amssymb}\usepackage{amsbsy}\usepackage{mathrsfs}\usepackage{upgreek}\setlength{\oddsidemargin}{-69pt}\begin{document}$${\mathbf {M}}$$\end{document}
 ,
\documentclass[12pt]{minimal}\usepackage{amsmath}\usepackage{wasysym}\usepackage{amsfonts}\usepackage{amssymb}\usepackage{amsbsy}\usepackage{mathrsfs}\usepackage{upgreek}\setlength{\oddsidemargin}{-69pt}\begin{document}$${\mathbf {N}}_1$$\end{document}
,
\documentclass[12pt]{minimal}\usepackage{amsmath}\usepackage{wasysym}\usepackage{amsfonts}\usepackage{amssymb}\usepackage{amsbsy}\usepackage{mathrsfs}\usepackage{upgreek}\setlength{\oddsidemargin}{-69pt}\begin{document}$${\mathbf {N}}_1$$\end{document}
 , and
\documentclass[12pt]{minimal}\usepackage{amsmath}\usepackage{wasysym}\usepackage{amsfonts}\usepackage{amssymb}\usepackage{amsbsy}\usepackage{mathrsfs}\usepackage{upgreek}\setlength{\oddsidemargin}{-69pt}\begin{document}$${\mathbf {N}}_2$$\end{document}
, and
\documentclass[12pt]{minimal}\usepackage{amsmath}\usepackage{wasysym}\usepackage{amsfonts}\usepackage{amssymb}\usepackage{amsbsy}\usepackage{mathrsfs}\usepackage{upgreek}\setlength{\oddsidemargin}{-69pt}\begin{document}$${\mathbf {N}}_2$$\end{document}
 . Using the Gibbs sampler (Sect. 2.3), a total of 2000 such matrices
\documentclass[12pt]{minimal}\usepackage{amsmath}\usepackage{wasysym}\usepackage{amsfonts}\usepackage{amssymb}\usepackage{amsbsy}\usepackage{mathrsfs}\usepackage{upgreek}\setlength{\oddsidemargin}{-69pt}\begin{document}$${\mathbf {P}}$$\end{document}
. Using the Gibbs sampler (Sect. 2.3), a total of 2000 such matrices
\documentclass[12pt]{minimal}\usepackage{amsmath}\usepackage{wasysym}\usepackage{amsfonts}\usepackage{amssymb}\usepackage{amsbsy}\usepackage{mathrsfs}\usepackage{upgreek}\setlength{\oddsidemargin}{-69pt}\begin{document}$${\mathbf {P}}$$\end{document}
 were simulated. Next, let
\documentclass[12pt]{minimal}\usepackage{amsmath}\usepackage{wasysym}\usepackage{amsfonts}\usepackage{amssymb}\usepackage{amsbsy}\usepackage{mathrsfs}\usepackage{upgreek}\setlength{\oddsidemargin}{-69pt}\begin{document}$${\mathbf {E}}=\mathbf {FP}$$\end{document}
were simulated. Next, let
\documentclass[12pt]{minimal}\usepackage{amsmath}\usepackage{wasysym}\usepackage{amsfonts}\usepackage{amssymb}\usepackage{amsbsy}\usepackage{mathrsfs}\usepackage{upgreek}\setlength{\oddsidemargin}{-69pt}\begin{document}$${\mathbf {E}}=\mathbf {FP}$$\end{document}
 , with element
\documentclass[12pt]{minimal}\usepackage{amsmath}\usepackage{wasysym}\usepackage{amsfonts}\usepackage{amssymb}\usepackage{amsbsy}\usepackage{mathrsfs}\usepackage{upgreek}\setlength{\oddsidemargin}{-69pt}\begin{document}$$e_{sk}=P(S=s-1|\Theta =k)$$\end{document}
, with element
\documentclass[12pt]{minimal}\usepackage{amsmath}\usepackage{wasysym}\usepackage{amsfonts}\usepackage{amssymb}\usepackage{amsbsy}\usepackage{mathrsfs}\usepackage{upgreek}\setlength{\oddsidemargin}{-69pt}\begin{document}$$e_{sk}=P(S=s-1|\Theta =k)$$\end{document}
 . Then, for each matrix
\documentclass[12pt]{minimal}\usepackage{amsmath}\usepackage{wasysym}\usepackage{amsfonts}\usepackage{amssymb}\usepackage{amsbsy}\usepackage{mathrsfs}\usepackage{upgreek}\setlength{\oddsidemargin}{-69pt}\begin{document}$${\mathbf {P}}$$\end{document}
. Then, for each matrix
\documentclass[12pt]{minimal}\usepackage{amsmath}\usepackage{wasysym}\usepackage{amsfonts}\usepackage{amssymb}\usepackage{amsbsy}\usepackage{mathrsfs}\usepackage{upgreek}\setlength{\oddsidemargin}{-69pt}\begin{document}$${\mathbf {P}}$$\end{document}
 the statistic
\documentclass[12pt]{minimal}\usepackage{amsmath}\usepackage{wasysym}\usepackage{amsfonts}\usepackage{amssymb}\usepackage{amsbsy}\usepackage{mathrsfs}\usepackage{upgreek}\setlength{\oddsidemargin}{-69pt}\begin{document}$$V_{\text{ MLR }}$$\end{document}
the statistic
\documentclass[12pt]{minimal}\usepackage{amsmath}\usepackage{wasysym}\usepackage{amsfonts}\usepackage{amssymb}\usepackage{amsbsy}\usepackage{mathrsfs}\usepackage{upgreek}\setlength{\oddsidemargin}{-69pt}\begin{document}$$V_{\text{ MLR }}$$\end{document}
 can be computed (as above), with
\documentclass[12pt]{minimal}\usepackage{amsmath}\usepackage{wasysym}\usepackage{amsfonts}\usepackage{amssymb}\usepackage{amsbsy}\usepackage{mathrsfs}\usepackage{upgreek}\setlength{\oddsidemargin}{-69pt}\begin{document}$$V_{\text{ MLR }}$$\end{document}
can be computed (as above), with
\documentclass[12pt]{minimal}\usepackage{amsmath}\usepackage{wasysym}\usepackage{amsfonts}\usepackage{amssymb}\usepackage{amsbsy}\usepackage{mathrsfs}\usepackage{upgreek}\setlength{\oddsidemargin}{-69pt}\begin{document}$$V_{\text{ MLR }}$$\end{document}
 expressing the size of the violation of the MLR property, as a result of relaxing the LI assumption.
3.4.2. Results
The results of the simulation yield the average
\documentclass[12pt]{minimal}\usepackage{amsmath}\usepackage{wasysym}\usepackage{amsfonts}\usepackage{amssymb}\usepackage{amsbsy}\usepackage{mathrsfs}\usepackage{upgreek}\setlength{\oddsidemargin}{-69pt}\begin{document}$${\overline{V}}_{\text{ MLR }}=6.404$$\end{document}
 (with the 1st and 3th quartile at 3.065 and 8.361, respectively). These violations of the MLR property are substantially higher than those found above due to the violations of the M assumption. Hence, the property of MLR is sensitive to violations of LI. Unfortunately, the assumption LI in our setup does not lend itself for an expression that can serve as a measure for quantifying the size of the violation of the LI assumption.
Evaluating the properties MM and CA (based on the previous analysis in Sect. 3.1), the results showed that property MM was satisfied for half or the cases, whereas CA was satisfied 37.5% of the time. Neither of the properties was found to be sensitive to the size of the violations
\documentclass[12pt]{minimal}\usepackage{amsmath}\usepackage{wasysym}\usepackage{amsfonts}\usepackage{amssymb}\usepackage{amsbsy}\usepackage{mathrsfs}\usepackage{upgreek}\setlength{\oddsidemargin}{-69pt}\begin{document}$$V_{\text{ MLR }}$$\end{document}
 .
.
4. Discussion
Observable properties were evaluated that are all implied by the MH model for binary response data. Any violation of a property discredits the MH model assumptions. The most restrictive of these properties is CA, whereby each of the other properties can be interpreted as an incomplete test of CA. The incomplete tests of CA are hierarchically related and differ with respect to the inequality restrictions that they impose on the observable response distribution. The least restrictive of the properties is NC, and it implies that all covariances between pairs of item variables are nonnegative. The NC property forms the basis of the scalability coefficients used in Mokken scale analysis. The other incomplete tests of CA take into consideration the higher-order moments contained in the trivariate and multivariate distributions of the item scores.
The practical assessment of property CA is limited by the large number of inequality restrictions it imposes. These large number of inequality restrictions not only limit the feasibility of a global test of CA (as for property A), but for local (diagnostic) tests also induce problems associated with multiple testing. In addition to the large number of inequality restrictions, the assessment of the MH model assumptions will inevitably need to deal with sparse observations. Particularly the property of
\documentclass[12pt]{minimal}\usepackage{amsmath}\usepackage{wasysym}\usepackage{amsfonts}\usepackage{amssymb}\usepackage{amsbsy}\usepackage{mathrsfs}\usepackage{upgreek}\setlength{\oddsidemargin}{-69pt}\begin{document}$$\hbox {MTP}_2$$\end{document}
 , which pertains to the joint distribution of individual response patterns, is sensitive to such sparse observations, and as a result, to sampling error. Due to the number of restrictions imposed by CA and the problem of sparseness of observations, the practical assessment of the MH model assumptions always relies on an incomplete test of CA.
4.1. Complexities of the Observable Properties
The computational burden associated with the large number of inequalities means that the observable properties could be studied only for small numbers of items. In a first series of small studies, we investigated the loss of information, when instead of CA an incomplete test of CA is used. For this purpose, the complexities of the incomplete tests were defined as their tendency to agree with a wide range of patters of data, with CA being the least and NC the most complex of the properties considered. For more than three items, the distinction between the complexities of CA and the incomplete tests of CA was found to be very large, and increased with increasing number of items. The exception to this rule was
\documentclass[12pt]{minimal}\usepackage{amsmath}\usepackage{wasysym}\usepackage{amsfonts}\usepackage{amssymb}\usepackage{amsbsy}\usepackage{mathrsfs}\usepackage{upgreek}\setlength{\oddsidemargin}{-69pt}\begin{document}$$\hbox {MTP}_2$$\end{document}
 , which agrees largely with CA. It may therefore be suggested that
\documentclass[12pt]{minimal}\usepackage{amsmath}\usepackage{wasysym}\usepackage{amsfonts}\usepackage{amssymb}\usepackage{amsbsy}\usepackage{mathrsfs}\usepackage{upgreek}\setlength{\oddsidemargin}{-69pt}\begin{document}$$\hbox {MTP}_2$$\end{document}
, which agrees largely with CA. It may therefore be suggested that
\documentclass[12pt]{minimal}\usepackage{amsmath}\usepackage{wasysym}\usepackage{amsfonts}\usepackage{amssymb}\usepackage{amsbsy}\usepackage{mathrsfs}\usepackage{upgreek}\setlength{\oddsidemargin}{-69pt}\begin{document}$$\hbox {MTP}_2$$\end{document}
 provides a practical alternative to CA for testing the MH model assumptions, which is associated with little loss of power.
Two remarks about the complexities of the properties are in order. First, the definition of complexity allowed for the loss of information to be studies, without relying on sample size, but this also means that we cannot infer from these results the exact extent to this loss of information translates to a loss of power when assessing the properties on real data. Second, psychological and educational tests contain items that are expected to relate to a common attribute, by design. Real response data will therefore generally agree more with the observable properties than random response patterns from a flat distribution. The complexities of the properties as presented here thus only provide a benchmark against which the relative agreement of different properties can be compared, when applied to real data. This is similar to the way the BIC penalizes the likelihood by the number of parameters. Here, the complexity, in terms of the number, also does not relate to real data.
4.2. On the Sensitivity to Model Violations
A second series of studies was performed to investigate the sensitivity of the observable properties to different violations of the MH model assumptions M, LI, and UD. Only the properties CA and
\documentclass[12pt]{minimal}\usepackage{amsmath}\usepackage{wasysym}\usepackage{amsfonts}\usepackage{amssymb}\usepackage{amsbsy}\usepackage{mathrsfs}\usepackage{upgreek}\setlength{\oddsidemargin}{-69pt}\begin{document}$$\hbox {MTP}_2$$\end{document}
 were found to be sensitive to violations of assumption M. However, these violations of M seem to have little impact on the MLR property for ordering respondents by means of their sum scores. The assumption of LI appears to be more relevant to the MLR property. Property CA was found to be sensitive to violations of LI (here, CA coincides with
\documentclass[12pt]{minimal}\usepackage{amsmath}\usepackage{wasysym}\usepackage{amsfonts}\usepackage{amssymb}\usepackage{amsbsy}\usepackage{mathrsfs}\usepackage{upgreek}\setlength{\oddsidemargin}{-69pt}\begin{document}$$\hbox {MTP}_2$$\end{document}
were found to be sensitive to violations of assumption M. However, these violations of M seem to have little impact on the MLR property for ordering respondents by means of their sum scores. The assumption of LI appears to be more relevant to the MLR property. Property CA was found to be sensitive to violations of LI (here, CA coincides with
\documentclass[12pt]{minimal}\usepackage{amsmath}\usepackage{wasysym}\usepackage{amsfonts}\usepackage{amssymb}\usepackage{amsbsy}\usepackage{mathrsfs}\usepackage{upgreek}\setlength{\oddsidemargin}{-69pt}\begin{document}$$\hbox {MTP}_2$$\end{document}
 ), and to a lesser degree also MM. Finally, a violation of UD does not imply that
\documentclass[12pt]{minimal}\usepackage{amsmath}\usepackage{wasysym}\usepackage{amsfonts}\usepackage{amssymb}\usepackage{amsbsy}\usepackage{mathrsfs}\usepackage{upgreek}\setlength{\oddsidemargin}{-69pt}\begin{document}$$\hbox {MTP}_2$$\end{document}
), and to a lesser degree also MM. Finally, a violation of UD does not imply that
\documentclass[12pt]{minimal}\usepackage{amsmath}\usepackage{wasysym}\usepackage{amsfonts}\usepackage{amssymb}\usepackage{amsbsy}\usepackage{mathrsfs}\usepackage{upgreek}\setlength{\oddsidemargin}{-69pt}\begin{document}$$\hbox {MTP}_2$$\end{document}
 is violated.
Besides the incomplete tests of CA considered, other observable properties have been proposed that were not considered. When assessing property MM in Mokken scale analysis, sparse observations are accounted for by joining adjacent rest scores into rest-score groups (Van der Ark, Reference Van der Ark2007). Assessing MM across these rest-score groups thus constitutes an incomplete test for MM. An incomplete test of CA can be similarly obtained by conditioning on the rest scores (Straat et al., Reference Straat, Van der Ark and Sijtsma2016), or some other ‘carefully selected’ sub-test score as suggested by Stout (Reference Stout2002). Further, Ellis and Junker (Reference Ellis and Junker1997) and Junker and Ellis (Reference Junker and Ellis1997) provide a characterization of the MH model, whereby the vector of item variables is taken to be embedded within an infinite sequence of item variables (cf. Junker, Reference Junker1991, Reference Junker1993; Stout, Reference Stout1987, Reference Stout1990). Within this framework, other the observable properties have been proposed, like vanishing conditional dependence and negative conditional covariance (De Gooijer & Yuan, Reference De Gooijer and Yuan2011; Junker, Reference Junker1993; Yuan & Clarke, Reference Yuan and Clarke2001).
4.3. Implications
The results of the studies presented show that CA is a difficult property to assess. Most of the incomplete tests of CA are associated with a substantial loss of information and seem not to be sensitive to specific violations of the MH model assumptions. However, it is also good to keep in mind that any violation of any of the properties considered is sufficient for discrediting the MH model. The challenge herein lies in combining the multitude of information obtained from the data to derive at a single conclusion about the significance of observed violations. This problem can be illustrated in Fig. 3, which shows the results of the log-odds ratios related to CA. Here, only 78 restrictions were considered, but it is not obvious from the results how to combine these into a single conclusion about the validity of the MH model assumptions. A global test may produce a single p-value for this example, but becomes infeasible for more items. Also, different tests might balance the odds on the left and right differently or overemphasize the extreme values. These issues, however, mostly relate to goodness of fit. This is the other aspect of model selection that we didn’t focus on.
The primary focus of this paper is complexity, which mostly concerned the inferences that we can make about CA, based on an incomplete test. It is about the extent to which the confirmation of an incomplete test of CA warrants the validity of CA or (by extension) the MH model assumptions. The results of our analysis have specific implications for the interpretation of results of automated item selections procedures in Mokken scale analysis (Brusco et al., Reference Brusco, Köhn and Steinley2015; Mokken, Reference Mokken1971; Molenaar & Sijtsma, Reference Molenaar and Sijtsma2000; Sijtsma & Molenaar, Reference Sijtsma and Molenaar2002; Straat et al., Reference Straat, Van der Ark and Sijtsma2013). As explained in Mokken et al. (Reference Mokken, Lewis and Sijtsma1986, p. 280), the selection of items based on requirement imposed on the scalability coefficients provides an operational definition of a scale that need not necessarily agree with the MH model. Beside the issue of sampling error, our results show that rules of thumb used for construction such scales are rather arbitrary (cf. Hemker et al., Reference Hemker, Sijtsma and Molenaar1995; Smits et al., Reference Smits, Timmerman and Meijer2012). In addition, in constructing these scales, the higher-order moments contained in the multivariate distributions of the item scores are ignored, which was shown to be associated with a substantial loss of information about the validity of the MH model assumptions. Hence, the scales produced by the automatic item selection procedure may not be very informative about the model underlying the scale and as such provide only an initial selection of items that require further analysis using more powerful tests for detecting violations of the model assumptions.
4.4. Conclusion
The MH model is a very general model, which assumptions are shared by many of the response models used in practice. The assessment of these assumptions thus has implications that stretch beyond just the use of the MH model. As mentioned by Molenaar (Reference Molenaar2004), the inferences from a model are contingent on the validity of the model assumptions. A global test of goodness of fit may reject a model, but this would tell us little about why this is the case or what the problem might be. More research is required about the extent to which the assumptions and the specifications of response models influence the type of inferences one wishes to make (Sinharay & Haberman, Reference Sinharay and Haberman2014; Crişan et al., Reference Crişan, Tendeiro and Meijer2017). For example, our results suggest that the MLR property is less dependent on the specification of the item response functions (cf. Van der Ark, Reference Van der Ark2005) than on the LI assumption. This is important for the applied researcher who may want to test the MH model, not because she cases so much about the model, but because it allows respondents to be ordered on a common scales and it implies testable properties that reassure her that the decisions and inferences she makes based on the sum scores are theoretically justified and empirically supported.
Funding
Open Access funding enabled and organized by Projekt DEAL.
Appendix
Assuming
\documentclass[12pt]{minimal}\usepackage{amsmath}\usepackage{wasysym}\usepackage{amsfonts}\usepackage{amssymb}\usepackage{amsbsy}\usepackage{mathrsfs}\usepackage{upgreek}\setlength{\oddsidemargin}{-69pt}\begin{document}$$\varvec{p}>\varvec{0}$$\end{document}
 , SPOD coincides with property A, in case of
\documentclass[12pt]{minimal}\usepackage{amsmath}\usepackage{wasysym}\usepackage{amsfonts}\usepackage{amssymb}\usepackage{amsbsy}\usepackage{mathrsfs}\usepackage{upgreek}\setlength{\oddsidemargin}{-69pt}\begin{document}$$J=3$$\end{document}
, SPOD coincides with property A, in case of
\documentclass[12pt]{minimal}\usepackage{amsmath}\usepackage{wasysym}\usepackage{amsfonts}\usepackage{amssymb}\usepackage{amsbsy}\usepackage{mathrsfs}\usepackage{upgreek}\setlength{\oddsidemargin}{-69pt}\begin{document}$$J=3$$\end{document}
 binary variables.
For any subset of two variables from
\documentclass[12pt]{minimal}\usepackage{amsmath}\usepackage{wasysym}\usepackage{amsfonts}\usepackage{amssymb}\usepackage{amsbsy}\usepackage{mathrsfs}\usepackage{upgreek}\setlength{\oddsidemargin}{-69pt}\begin{document}$$\varvec{X}=(X_1,X_2,X_3)$$\end{document}
 , SPOD implies that the covariance between the two variables is positive. This corresponds to the first three rows of the matrix in (2) for the three distinct subsets
\documentclass[12pt]{minimal}\usepackage{amsmath}\usepackage{wasysym}\usepackage{amsfonts}\usepackage{amssymb}\usepackage{amsbsy}\usepackage{mathrsfs}\usepackage{upgreek}\setlength{\oddsidemargin}{-69pt}\begin{document}$$\varvec{V}=(X_2,X_3)$$\end{document}
, SPOD implies that the covariance between the two variables is positive. This corresponds to the first three rows of the matrix in (2) for the three distinct subsets
\documentclass[12pt]{minimal}\usepackage{amsmath}\usepackage{wasysym}\usepackage{amsfonts}\usepackage{amssymb}\usepackage{amsbsy}\usepackage{mathrsfs}\usepackage{upgreek}\setlength{\oddsidemargin}{-69pt}\begin{document}$$\varvec{V}=(X_2,X_3)$$\end{document}
 ,
\documentclass[12pt]{minimal}\usepackage{amsmath}\usepackage{wasysym}\usepackage{amsfonts}\usepackage{amssymb}\usepackage{amsbsy}\usepackage{mathrsfs}\usepackage{upgreek}\setlength{\oddsidemargin}{-69pt}\begin{document}$$\varvec{V}=(X_1,X_3)$$\end{document}
,
\documentclass[12pt]{minimal}\usepackage{amsmath}\usepackage{wasysym}\usepackage{amsfonts}\usepackage{amssymb}\usepackage{amsbsy}\usepackage{mathrsfs}\usepackage{upgreek}\setlength{\oddsidemargin}{-69pt}\begin{document}$$\varvec{V}=(X_1,X_3)$$\end{document}
 , and
\documentclass[12pt]{minimal}\usepackage{amsmath}\usepackage{wasysym}\usepackage{amsfonts}\usepackage{amssymb}\usepackage{amsbsy}\usepackage{mathrsfs}\usepackage{upgreek}\setlength{\oddsidemargin}{-69pt}\begin{document}$$\varvec{V}=(X_1,X_3)$$\end{document}
, and
\documentclass[12pt]{minimal}\usepackage{amsmath}\usepackage{wasysym}\usepackage{amsfonts}\usepackage{amssymb}\usepackage{amsbsy}\usepackage{mathrsfs}\usepackage{upgreek}\setlength{\oddsidemargin}{-69pt}\begin{document}$$\varvec{V}=(X_1,X_3)$$\end{document}
 , respectively. The remainder of the proof consists of going through the process of exhaustively listing all restrictions imposed by SPOD, and expressing these in terms of the log-odds ratios. It can then be shown that the last six rows of the matrix in (2) match one to one with those obtained for property SPOD. As an example, consider the inequality in (5c), which reduces for
\documentclass[12pt]{minimal}\usepackage{amsmath}\usepackage{wasysym}\usepackage{amsfonts}\usepackage{amssymb}\usepackage{amsbsy}\usepackage{mathrsfs}\usepackage{upgreek}\setlength{\oddsidemargin}{-69pt}\begin{document}$$\varvec{Y}=(X_1,X_2)$$\end{document}
, respectively. The remainder of the proof consists of going through the process of exhaustively listing all restrictions imposed by SPOD, and expressing these in terms of the log-odds ratios. It can then be shown that the last six rows of the matrix in (2) match one to one with those obtained for property SPOD. As an example, consider the inequality in (5c), which reduces for
\documentclass[12pt]{minimal}\usepackage{amsmath}\usepackage{wasysym}\usepackage{amsfonts}\usepackage{amssymb}\usepackage{amsbsy}\usepackage{mathrsfs}\usepackage{upgreek}\setlength{\oddsidemargin}{-69pt}\begin{document}$$\varvec{Y}=(X_1,X_2)$$\end{document}
 and
\documentclass[12pt]{minimal}\usepackage{amsmath}\usepackage{wasysym}\usepackage{amsfonts}\usepackage{amssymb}\usepackage{amsbsy}\usepackage{mathrsfs}\usepackage{upgreek}\setlength{\oddsidemargin}{-69pt}\begin{document}$$\varvec{Z}=X_3$$\end{document}
and
\documentclass[12pt]{minimal}\usepackage{amsmath}\usepackage{wasysym}\usepackage{amsfonts}\usepackage{amssymb}\usepackage{amsbsy}\usepackage{mathrsfs}\usepackage{upgreek}\setlength{\oddsidemargin}{-69pt}\begin{document}$$\varvec{Z}=X_3$$\end{document}
 to
\documentclass[12pt]{minimal}\usepackage{amsmath}\usepackage{wasysym}\usepackage{amsfonts}\usepackage{amssymb}\usepackage{amsbsy}\usepackage{mathrsfs}\usepackage{upgreek}\setlength{\oddsidemargin}{-69pt}\begin{document}$$(p_7+p_8)(p_1+p_3+p_5+p_7)\ge p_7$$\end{document}
to
\documentclass[12pt]{minimal}\usepackage{amsmath}\usepackage{wasysym}\usepackage{amsfonts}\usepackage{amssymb}\usepackage{amsbsy}\usepackage{mathrsfs}\usepackage{upgreek}\setlength{\oddsidemargin}{-69pt}\begin{document}$$(p_7+p_8)(p_1+p_3+p_5+p_7)\ge p_7$$\end{document}
 and yields
\documentclass[12pt]{minimal}\usepackage{amsmath}\usepackage{wasysym}\usepackage{amsfonts}\usepackage{amssymb}\usepackage{amsbsy}\usepackage{mathrsfs}\usepackage{upgreek}\setlength{\oddsidemargin}{-69pt}\begin{document}$$\ln p_8-\ln (p_2+p_4+p_6)-\ln p_7+\ln (p_1+p_3+p_5)\ge 0$$\end{document}
and yields
\documentclass[12pt]{minimal}\usepackage{amsmath}\usepackage{wasysym}\usepackage{amsfonts}\usepackage{amssymb}\usepackage{amsbsy}\usepackage{mathrsfs}\usepackage{upgreek}\setlength{\oddsidemargin}{-69pt}\begin{document}$$\ln p_8-\ln (p_2+p_4+p_6)-\ln p_7+\ln (p_1+p_3+p_5)\ge 0$$\end{document}
 . The last inequality is obtained from (1) using the eighth row of the matrix in (2) for
\documentclass[12pt]{minimal}\usepackage{amsmath}\usepackage{wasysym}\usepackage{amsfonts}\usepackage{amssymb}\usepackage{amsbsy}\usepackage{mathrsfs}\usepackage{upgreek}\setlength{\oddsidemargin}{-69pt}\begin{document}$${\mathbf {M}}$$\end{document}
. The last inequality is obtained from (1) using the eighth row of the matrix in (2) for
\documentclass[12pt]{minimal}\usepackage{amsmath}\usepackage{wasysym}\usepackage{amsfonts}\usepackage{amssymb}\usepackage{amsbsy}\usepackage{mathrsfs}\usepackage{upgreek}\setlength{\oddsidemargin}{-69pt}\begin{document}$${\mathbf {M}}$$\end{document}
 . The remaining five inequalities can be obtained similarly.
Assuming
\documentclass[12pt]{minimal}\usepackage{amsmath}\usepackage{wasysym}\usepackage{amsfonts}\usepackage{amssymb}\usepackage{amsbsy}\usepackage{mathrsfs}\usepackage{upgreek}\setlength{\oddsidemargin}{-69pt}\begin{document}$$\varvec{p}>\varvec{0}$$\end{document}
 , MM and NC jointly imply the A, in case of
\documentclass[12pt]{minimal}\usepackage{amsmath}\usepackage{wasysym}\usepackage{amsfonts}\usepackage{amssymb}\usepackage{amsbsy}\usepackage{mathrsfs}\usepackage{upgreek}\setlength{\oddsidemargin}{-69pt}\begin{document}$$J=3$$\end{document}
, MM and NC jointly imply the A, in case of
\documentclass[12pt]{minimal}\usepackage{amsmath}\usepackage{wasysym}\usepackage{amsfonts}\usepackage{amssymb}\usepackage{amsbsy}\usepackage{mathrsfs}\usepackage{upgreek}\setlength{\oddsidemargin}{-69pt}\begin{document}$$J=3$$\end{document}
 binary variables.
For property A, matrix (2) contains in its first three rows the constraints imposed by NC. Further, the first two rows of the matrix in (3) correspond to the MM property for
\documentclass[12pt]{minimal}\usepackage{amsmath}\usepackage{wasysym}\usepackage{amsfonts}\usepackage{amssymb}\usepackage{amsbsy}\usepackage{mathrsfs}\usepackage{upgreek}\setlength{\oddsidemargin}{-69pt}\begin{document}$$i=1$$\end{document}
 , which implies both
\documentclass[12pt]{minimal}\usepackage{amsmath}\usepackage{wasysym}\usepackage{amsfonts}\usepackage{amssymb}\usepackage{amsbsy}\usepackage{mathrsfs}\usepackage{upgreek}\setlength{\oddsidemargin}{-69pt}\begin{document}$$P(X_1=0,S=0)P(X_1=1,S>0)\ge P(X_1=1,S=0)P(X_1=0,S>0)$$\end{document}
, which implies both
\documentclass[12pt]{minimal}\usepackage{amsmath}\usepackage{wasysym}\usepackage{amsfonts}\usepackage{amssymb}\usepackage{amsbsy}\usepackage{mathrsfs}\usepackage{upgreek}\setlength{\oddsidemargin}{-69pt}\begin{document}$$P(X_1=0,S=0)P(X_1=1,S>0)\ge P(X_1=1,S=0)P(X_1=0,S>0)$$\end{document}
 and
\documentclass[12pt]{minimal}\usepackage{amsmath}\usepackage{wasysym}\usepackage{amsfonts}\usepackage{amssymb}\usepackage{amsbsy}\usepackage{mathrsfs}\usepackage{upgreek}\setlength{\oddsidemargin}{-69pt}\begin{document}$$P(X_1=1,S=2)P(X_1=0,S<2)\ge P(X_1=0,S=2)P(X_1=1,S<2)$$\end{document}
and
\documentclass[12pt]{minimal}\usepackage{amsmath}\usepackage{wasysym}\usepackage{amsfonts}\usepackage{amssymb}\usepackage{amsbsy}\usepackage{mathrsfs}\usepackage{upgreek}\setlength{\oddsidemargin}{-69pt}\begin{document}$$P(X_1=1,S=2)P(X_1=0,S<2)\ge P(X_1=0,S=2)P(X_1=1,S<2)$$\end{document}
 . These last two inequalities correspond to the restrictions imposed by the fourth and fifth row of (2). Likewise, the remaining four restrictions in (3) imply the last four restrictions in (2).


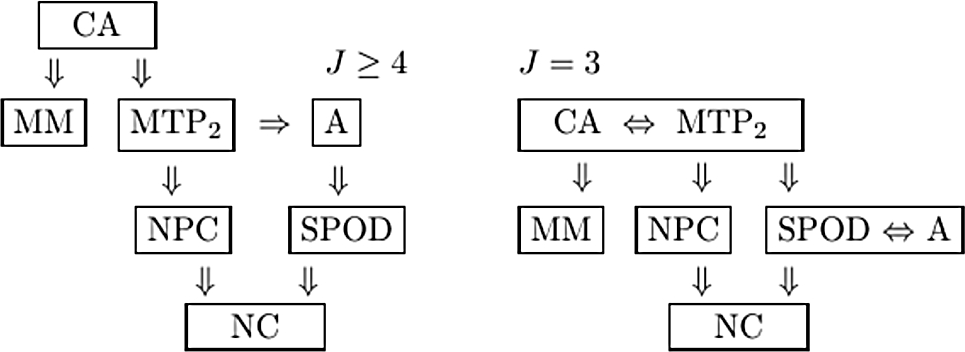
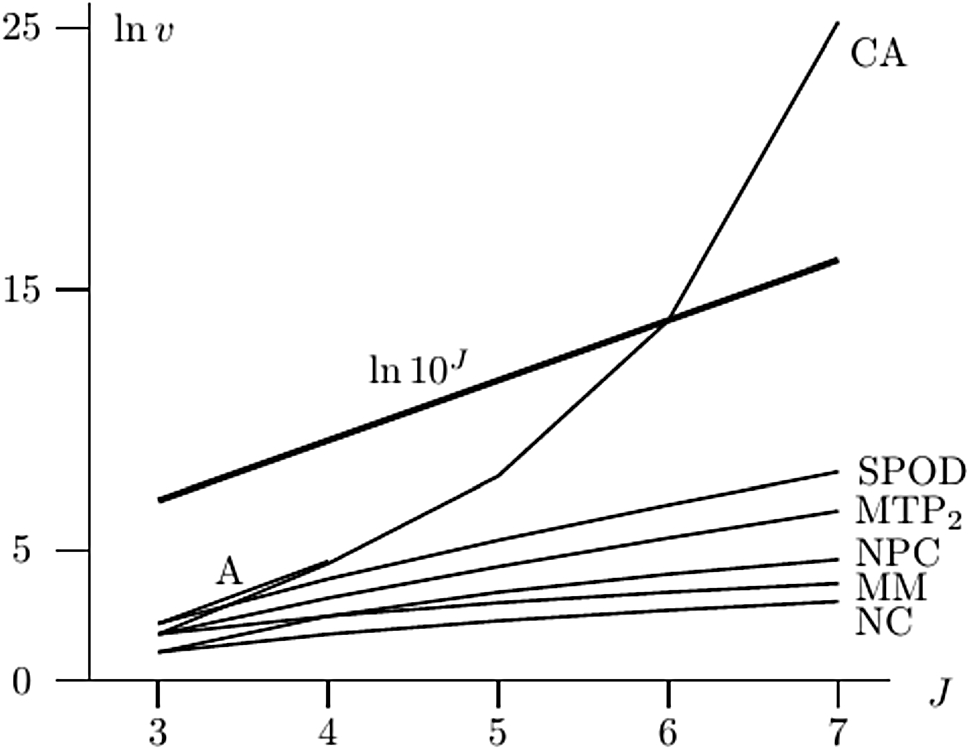
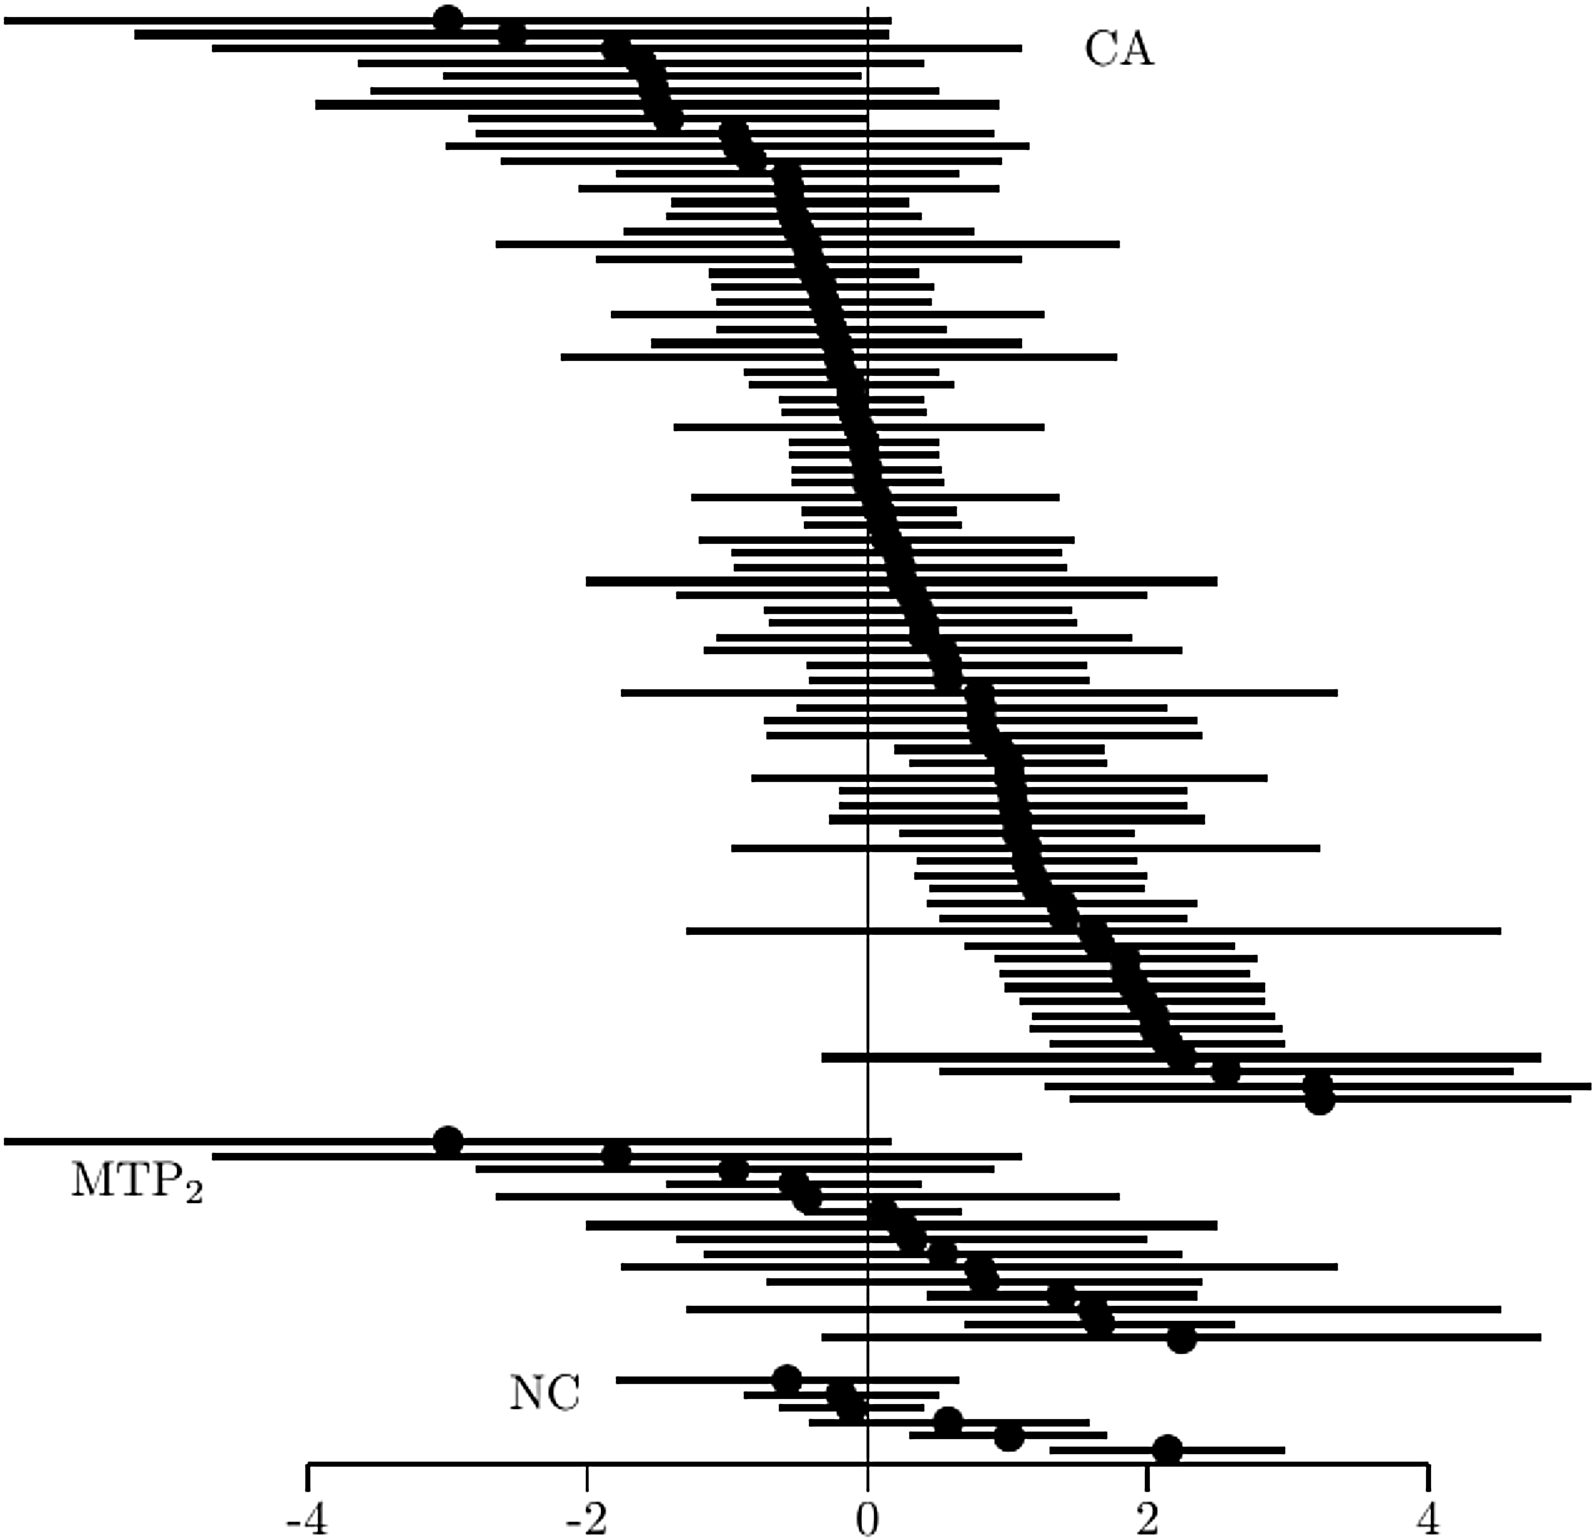

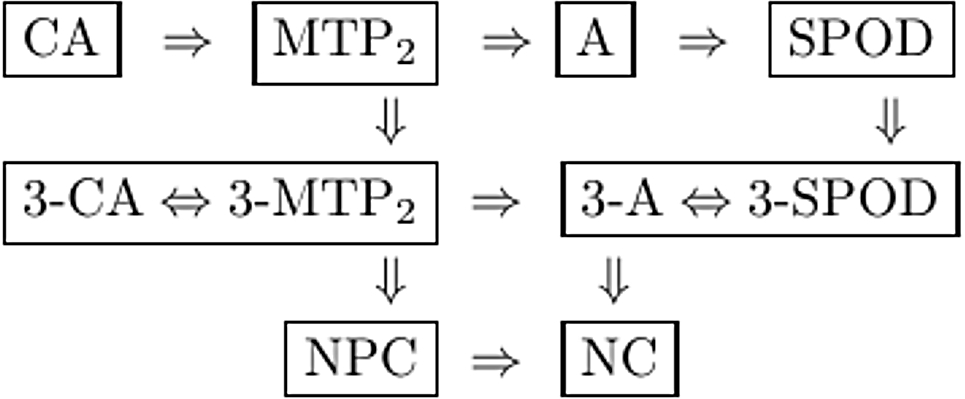

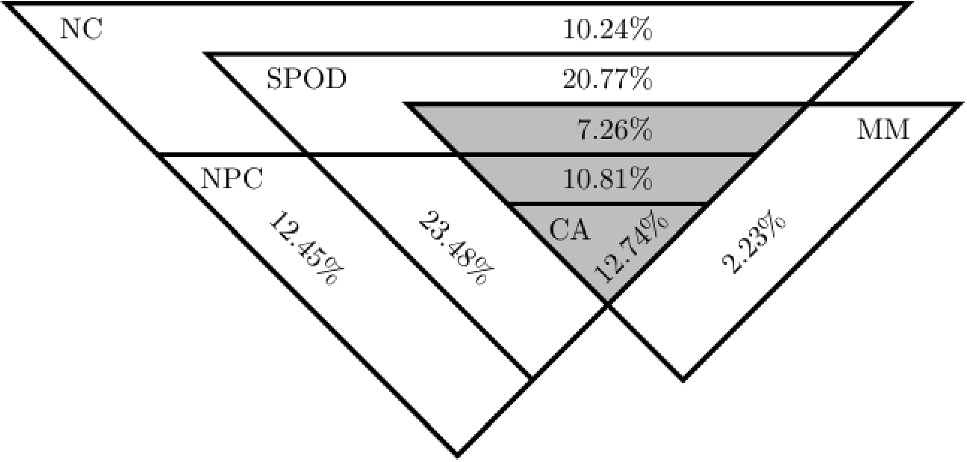

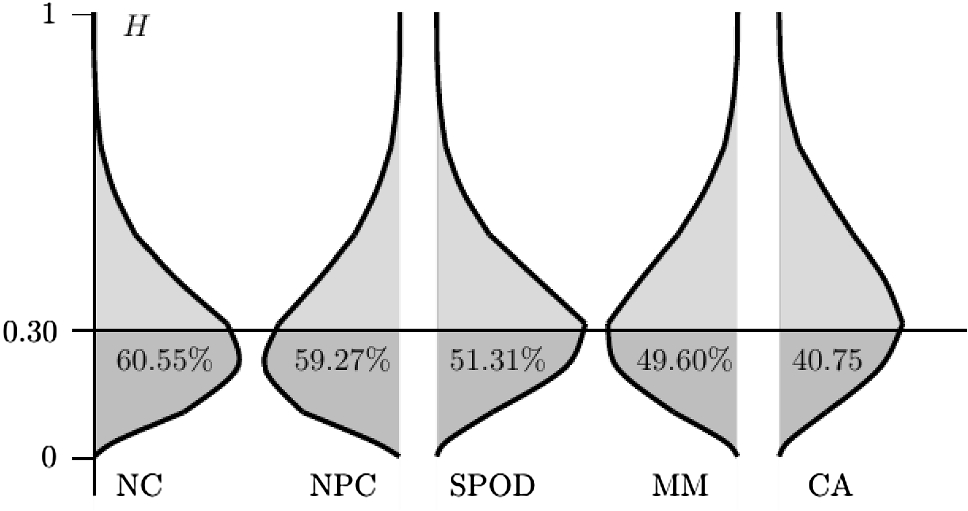


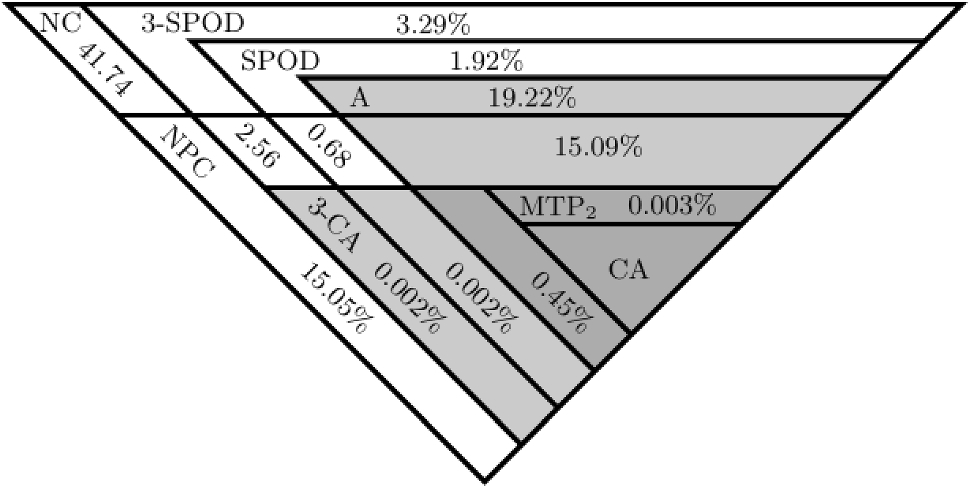
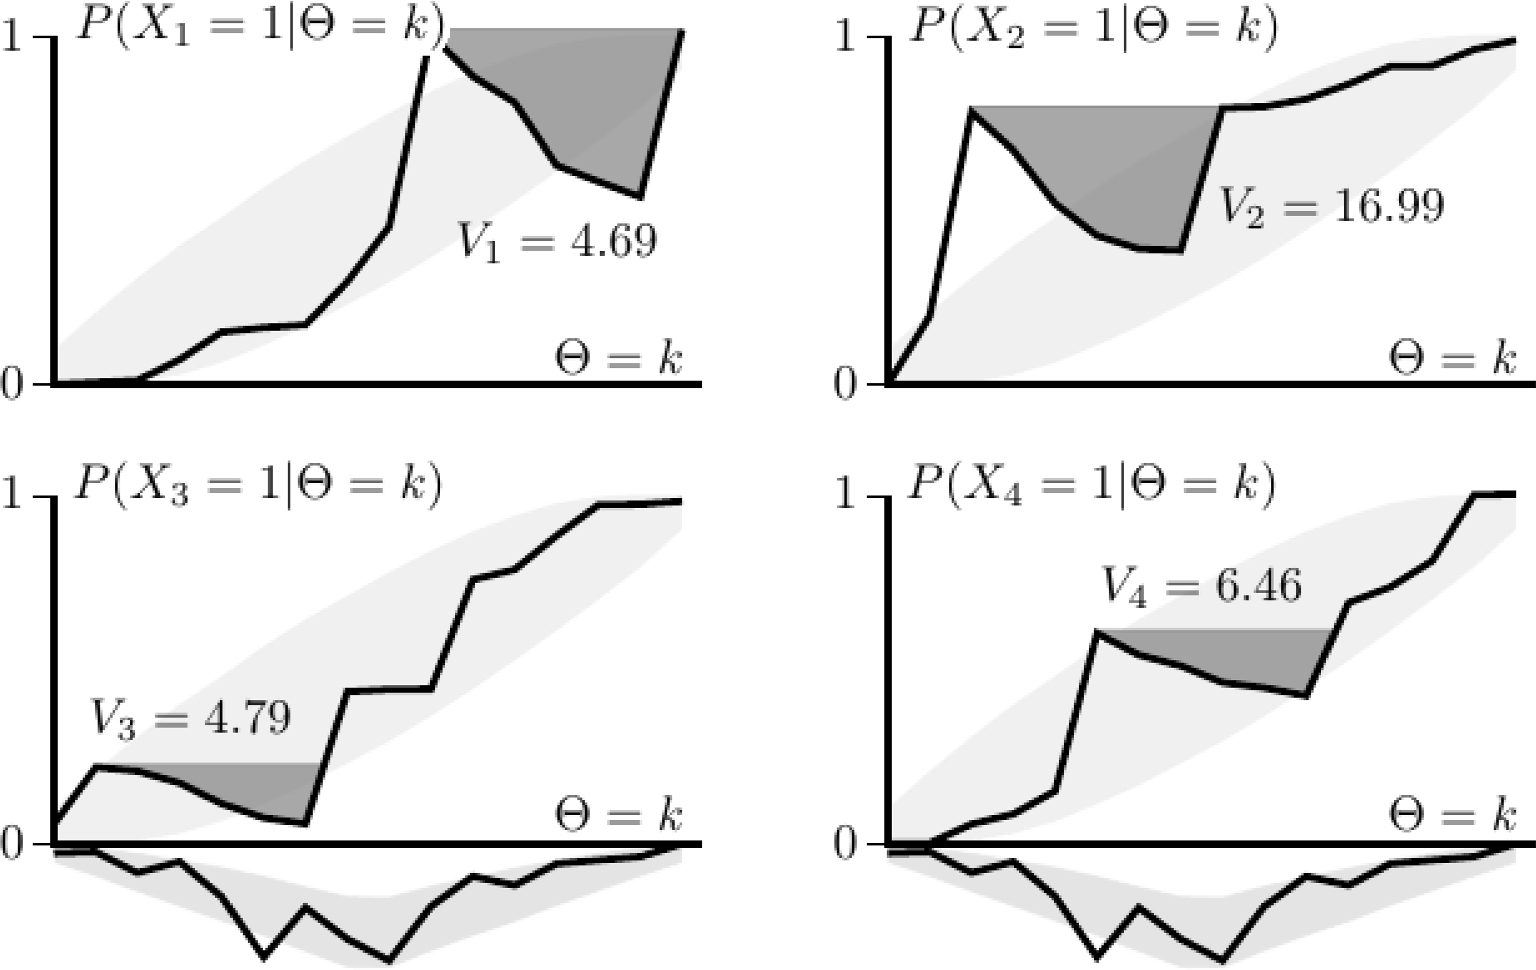


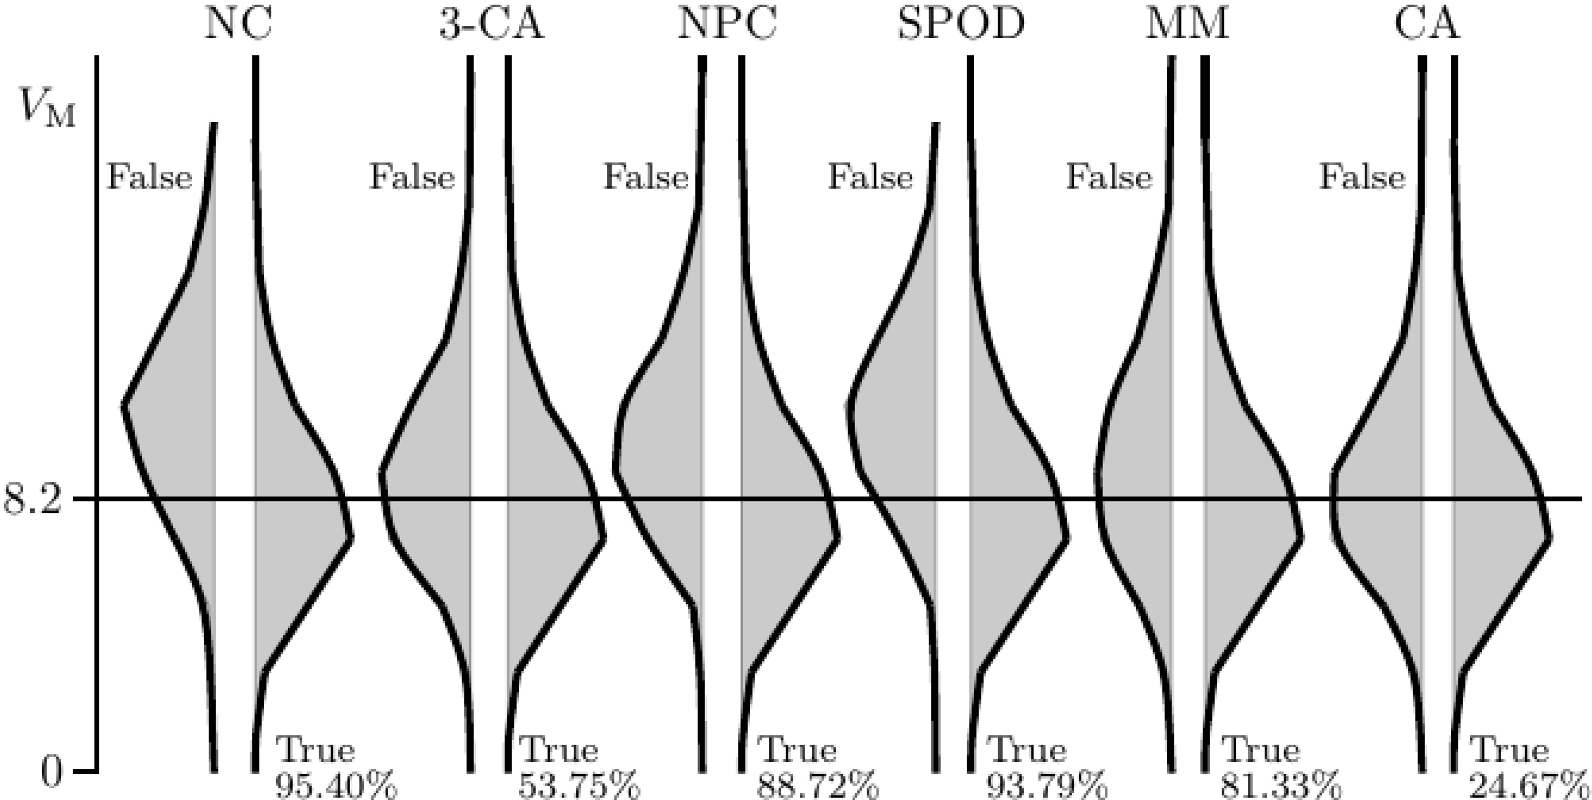


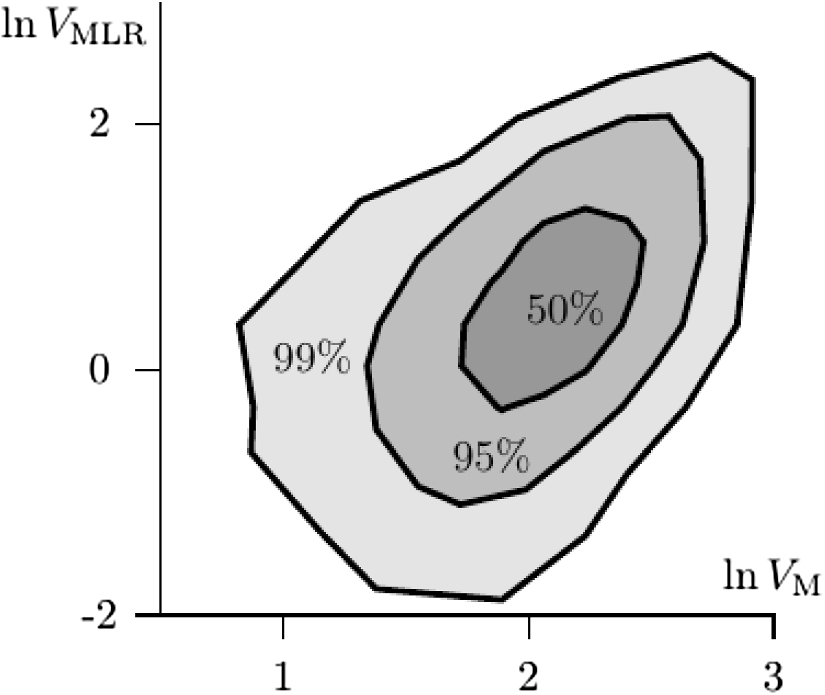

 Open access

