


1. Introduction
Intra-terrane shear zones (ITSZ) are crustal-scale localized zones of intense shearing that do not coincide with any terrane boundaries. Such zones may represent the sites of crustal thickening due to emplacement of large-scale sheet-like silicic magma (Colliston et al. Reference Colliston, Schoch and Cole2017; Mathee and Colliston, Reference Mathee and Colliston2018) or they might represent the zones of strain partitioning during convergent tectonics (Colliston et al. Reference Colliston, Praekelt and Schoch1991; van der Heyden, Reference van der Heyden1992; Chardon et al. Reference Chardon, Andronicos and Hollister1999). Several worldwide examples of ITSZs, for example from Bundelkhand Craton of India (Banerjee et al. Reference Banerjee, Maity, Sarkar and Acharya2022; Maity and Banerjee, Reference Maity and Banerjee2022), Aggeneys terrane of Bushmanland, South Africa adjacent to Kaapvaal Craton (Colliston and Schoch, Reference Colliston and Schoch2002), San Juan fault system at the Cascades Orogen, western USA (Bergh, Reference Bergh2002), strike-slip shear zone in central Alaska (Cole et al. Reference Cole, Ridgway, Layer and Drake1999), and Tabalah/Wadi Ta’al Tectonic Zone in the Asir Terrane of Arabian shield (Stoeser and Camp, Reference Stoeser and Camp1985), have been documented, but yet their tectonic implications remain debated.
Proterozoic high-grade terranes are characterized by contemporaneous high-grade metamorphism and emplacement of syn-kinematic voluminous granitoid plutons at the lower-to mid-crustal levels (Brown, Reference Brown1994; Sawyer et al. Reference Sawyer, Cesare and Brown2011; Brown, Reference Brown2013). Such plutons are commonly affected by anastomosing networks of ductile shear zones, which neither demarcate the terrane boundaries nor they are the pluton-country rock boundaries (e.g. Vanardois et al. Reference Vanardois, Trap, Roger, Melleton, Marquer, Paquette, Goncalves, Cagnard and Le Bayon2022; Zhang et al. Reference Zhang, Hou, Zhang and Tian2022). Multiple studies have already highlighted the connection between magma emplacement and regional deformation, specifically emphasizing the role of shear zone systems on granite emplacement (e.g. Brown, Reference Brown1994; Vigneresse, Reference Vigneresse1995; Brown and Solar, Reference Brown and Solar1998; Weinberg et al. Reference Weinberg, Sial and Mariano2004; Mamtani and Greiling, Reference Mamtani and Greiling2005; Valle Aguado et al. Reference Valle Aguado, Azevedo, Nolan, Medina, Costa, Corfu and Martínez Catalán2017; Zibra et al. Reference Zibra, White, Menegon, Dering and Gessner2018). Most of these studies focused on the architecture of pluton-wall rock boundaries, but the strain pattern within a pluton itself remains comparatively unexplored and poorly understood (de Saint Blanquat et al. Reference de Saint Blanquat, Horsman, Habert, Morgan, Vanderhaeghe, Law and Tikoff2011; Paterson et al. Reference Paterson, Ardill, Vernon and Žák2019; Nahas et al. Reference Nahas, Gonçalves, Gonçalves and Raposo2023).
The Chotanagpur Granite Gneiss Complex (CGGC) of the east-central Indian shield represents a Proterozoic mobile belt (e.g. Sanyal and Sengupta, Reference Sanyal and Sengupta2012) (Figure 1a). Voluminous granite resulted from the crustal anatexis during the Proterozoic high-grade metamorphism is the most dominant component of the CGGC. Granites in the south-eastern part of the CGGC were deformed by a regional-scale shear zone named as the North Purulia Shear Zone (NPSZ) (Figure 1c). Although petrological and/or geochemical characteristics of the rocks were constrained close to the NPSZ (e.g. Maji et al. Reference Maji, Goon, Bhattacharya, Mishra, Mahato and Bernhardt2008; Sanyal and Sengupta, Reference Sanyal and Sengupta2012; Mukherjee et al. Reference Mukherjee, Dey, Sanyal, Sengupta and Mukherjee2019 and references therein), no attempts have been made to address its tectonic evolution and significance within the CGGC. In this contribution, we present the structural aspects of the NPSZ and argue that it is an ITSZ, which formed concurrently with the emplacement of the granite. We further suggest that the evolution of NPSZ corresponds to the suturing of the North and South Indian cratonic blocks during the amalgamation of Rodinia supercontinent. In this study, we focus on three aspects: (i) the geometry of the NPSZ, (ii) nucleation of the NPSZ within non-sheared granite/granite gneiss during the Proterozoic active tectonics and (iii) if the Proterozoic crustal accretion drove the intra-terrane shearing. To resolve these issues, mapping, mesoscopic and microscopic analyses with kinematic vorticity and anisotropy of magnetic susceptibility (AMS) analysis were carried out.
(a) Disposition of the major Archaean cratonic blocks and Proterozoic orogenic belts in Peninsular India. BBG: Bhandara-Balaghat granulite; CGGC: Chotanagpur Granite Gneissic Complex; EGB: Eastern Ghats Belt; NSMB: North Singhbhum Mobile Belt; SPGC: Shillong Plateau Gneissic Complex; VS: Vindhyan Supergroup. Archaean cratons: AC: Aravalli Craton; BC: Bundelkhand Craton; BS: Bhandara; KR: Karnataka, SB: Singhbhum, NPSZ: North Purulia Shear Zone; SPSZ: South Purulia Shear Zone; SSZ: Singhbhum Shear Zone; GBF: Great Boundary Fault; ASZ: Achankovil Shear Zone; PCSZ: Palghat-Cauvery Shear Zone; CSZ: Chitradurga Shear Zone; LSZ: Lakhna Shear Zone; TSZ: Tan Shear Zone; CITZ: Central Indian Tectonic Zone (modified after Naganjaneyulu and Santosh, Reference Naganjaneyulu and Santosh2010). (b) Google Earth imagery showing the terrane features surrounding the study area. It is important to note the lack of discernible outcrops in and around the eastern part of NPSZ. (c) Simplified regional geological sketch of the CGGC showing spatial distribution of various lithotypes (modified after Archaryya, 2003; Goswami and Bhattacharyya, Reference Goswami and Bhattacharyya2014; Mukherjee et al. Reference Mukherjee, Dey, Sanyal, Sengupta and Mukherjee2019).

2. Geological setting and area of study
Covering an area of ∼100 000 km2 in the eastern Indian shield, the CGGC constitutes the eastern extension of the composite Satpura orogenic belt. It is bounded by the Monghyr-Saharsa Ridge Fault and South Purulia Shear Zone to the north and south, respectively (Bhattacharyya and Mukherjee, Reference Bhattacharyya and Mukherjee1987; Acharyya, Reference Acharyya2003). Based on the lithological characteristics, metamorphic history and geochronological data, Mukherjee et al. (Reference Mukherjee, Dey, Sanyal, Sengupta and Mukherjee2019) divided the CGGC into three ∼E–W trending domains from south to north (Figure 1c). Domain I consists of high-grade metamorphic rocks along with intrusive granite and anorthosite (Bhattacharyya and Mukherjee, Reference Bhattacharyya and Mukherjee1987; Maji et al. Reference Maji, Goon, Bhattacharya, Mishra, Mahato and Bernhardt2008); Domain II also known as the Bihar Mica Belt, which includes muscovite-biotite schist interbedded with micaceous quartzite, conglomerates, calc-silicate rocks and hornblende schist (Mahadevan, Reference Mahadevan2002; Mukherjee et al. Reference Mukherjee, Dey, Sanyal, Sengupta and Mukherjee2019); and Domain III dominantly comprises of supracrustal rocks such as quartzite and phyllite metamorphosed under low-grade conditions underlain by high-grade migmatitic quartzo-feldspathic gneisses (Chatterjee and Ghose, Reference Chatterjee and Ghose2011; Saikia et al. Reference Saikia, Gogoi, Kaulina, Lialina, Bayanova, Ahmad, Pant and Dasgupta2017; Mukherjee et al. Reference Mukherjee, Dey, Sanyal, Sengupta and Mukherjee2019). In general, Domain I is envisaged as the deeper and younger crustal section as compared to Domain II and Domain III (Mukherjee et al. Reference Mukherjee, Dey, Sanyal, Sengupta and Mukherjee2019). Domain I is split by Gondwana-boundary-fault-bounded Damodar Graben, which divides the Domain I into two sub-domains: Domain IA and IB to the south and north, respectively (Figure 1c) (Mukherjee et al. Reference Mukherjee, Dey, Sanyal, Sengupta and Mukherjee2019). The most striking linear feature of the Domain IA is the NPSZ, which is thought to be the eastern extension of the Tan Shear Zone (Figure 1a) of the CITZ (Mahadevan, Reference Mahadevan2002; Acharyya, Reference Acharyya2003). However, no lithological/geochronological discontinuity is recorded across the NPSZ.
Domain I of the CGGC mostly consists of variably deformed felsic orthogneisses that include porphyritic granite gneiss (commonly referred to as augen gneiss, due to the shape of feldspar phenocrysts/megacrysts), biotite-amphibole gneiss, amphibole-biotite gneiss, charnockitic gneiss and migmatitic gneiss. The felsic orthogneisses host enclaves of metapelitic gneisses, mafic granulite and calc-silicate gneiss, altogether referred to as enclave suites. In addition, local bodies of anorthosite and alkaline rocks are found as intrusions within the felsic orthogneisses (Sen, Reference Sen1956; Acharyya, Reference Acharyya2003; Chatterjee et al. Reference Chatterjee, Crowley and Ghose2008; Goswami and Bhattacharyya, Reference Goswami and Bhattacharyya2008; Maji et al. Reference Maji, Goon, Bhattacharya, Mishra, Mahato and Bernhardt2008; Chatterjee et al. Reference Chatterjee, Banerjee, Bhattacharya and Maji2010; Chatterjee and Ghose, Reference Chatterjee and Ghose2011; Karmakar et al. Reference Karmakar, Bose, Sarbadhikari and Das2011; Sanyal and Sengupta, Reference Sanyal and Sengupta2012; Chakrabarty et al. Reference Chakrabarty, Mitchell, Ren, Saha, Pal, Pruseth and Sen2016; Mukherjee et al. Reference Mukherjee, Dey, Sanyal, Ibanez-Mejia, Dutta and Sengupta2017; Das et al. Reference Das, Sanyal, Karmakar, Sengupta and Sengupta2019; Mukherjee et al. Reference Mukherjee, Dey, Sanyal, Sengupta and Mukherjee2019). The relationships amongst the different lithotypes of the felsic gneisses through Domain I of the CGGC, however, remain elusive. This is directly linked to the fact that the rock exposures are limited compared to the areal extent of Domain I. In the last decade, many attempts have been made to figure out the metamorphic and magmatic history of the CGGC with reference to the supercontinent cycle during the Proterozoic (e.g. Maji et al. Reference Maji, Goon, Bhattacharya, Mishra, Mahato and Bernhardt2008; Karmakar et al. Reference Karmakar, Bose, Sarbadhikari and Das2011; Goswami and Bhattacharyya, Reference Goswami and Bhattacharyya2014; Mukherjee et al. Reference Mukherjee, Dey, Sanyal and Sengupta2018
b; Das et al. Reference Das, Goswami, Basak and Bhattacharyya2020
a; Sequeira et al. Reference Sequeira, Bhattacharya and Bell2022; Basak et al. Reference Basak, Goswami, Gréau, Das and Bhattacharyya2025). There is an overall consensus that CGGC is affected by four major metamorphic events and the chronology and metamorphic conditions (pressure-temperature) (Acharyya, Reference Acharyya2003; Maji et al. Reference Maji, Goon, Bhattacharya, Mishra, Mahato and Bernhardt2008; Chatterjee and Ghose, Reference Chatterjee and Ghose2011; Sanyal and Sengupta, Reference Sanyal and Sengupta2012; Mukherjee et al. Reference Mukherjee, Dey, Sanyal, Sengupta and Mukherjee2019). The earliest metamorphic event (MI) occurred at ∼1.87 Ga in ultrahigh temperature (>900°C). Vestiges of this event are restricted within the enclave suites. Ultrahigh-temperature metamorphism was followed by intrusion of voluminous felsic magma, which subsequently metamorphosed (MII Stage) to produce migmatitic gneiss during ∼1.65–1.55 Ga in a temperature range between 700–800 $^\circ$
C at about 0.5–0.7 GPa pressure. In between ∼1.20–0.93 Ga, intrusions of anorthosite and porphyritic granite ensued by metamorphism at 650–700°C, and ∼0.65 GPa conditions, are designated as the third phase of metamorphism (MIII stage). The last phase of metamorphism (MIV stage) occurred during ∼0.87–0.78 Ga and is believed to be an infiltration-driven metamorphism under 600–700°C, and ∼0.7 GPa conditions preceded by the intrusion of mafic dykes (Maji et al. Reference Maji, Goon, Bhattacharya, Mishra, Mahato and Bernhardt2008; Karmakar et al. Reference Karmakar, Bose, Sarbadhikari and Das2011; Sanyal and Sengupta, Reference Sanyal and Sengupta2012; Mukherjee et al. Reference Mukherjee, Dey, Sanyal, Sengupta and Mukherjee2019). All the CGGC lithological units are deformed in nature. The number of deformation events was determined considering axial plane orientations of the enclaves contained in the felsic gneisses: while Maji et al. (Reference Maji, Goon, Bhattacharya, Mishra, Mahato and Bernhardt2008) envisaged three phases of deformation, Sanyal and Sengupta (Reference Sanyal and Sengupta2012) depicted six phases of deformation.
$^\circ$
C at about 0.5–0.7 GPa pressure. In between ∼1.20–0.93 Ga, intrusions of anorthosite and porphyritic granite ensued by metamorphism at 650–700°C, and ∼0.65 GPa conditions, are designated as the third phase of metamorphism (MIII stage). The last phase of metamorphism (MIV stage) occurred during ∼0.87–0.78 Ga and is believed to be an infiltration-driven metamorphism under 600–700°C, and ∼0.7 GPa conditions preceded by the intrusion of mafic dykes (Maji et al. Reference Maji, Goon, Bhattacharya, Mishra, Mahato and Bernhardt2008; Karmakar et al. Reference Karmakar, Bose, Sarbadhikari and Das2011; Sanyal and Sengupta, Reference Sanyal and Sengupta2012; Mukherjee et al. Reference Mukherjee, Dey, Sanyal, Sengupta and Mukherjee2019). All the CGGC lithological units are deformed in nature. The number of deformation events was determined considering axial plane orientations of the enclaves contained in the felsic gneisses: while Maji et al. (Reference Maji, Goon, Bhattacharya, Mishra, Mahato and Bernhardt2008) envisaged three phases of deformation, Sanyal and Sengupta (Reference Sanyal and Sengupta2012) depicted six phases of deformation.
The present work has been carried out in the eastern extent/segment of the NPSZ in the SE CGGC between Raghunathpur and Saltora towns, 42 km NE and 70 km ENE of Purulia town, respectively (Figure 2a). The study area is characterized by scattered exposures of variably deformed K-feldspar megacryst-bearing granite gneiss (henceforth megacrystic granite gneiss) containing enclaves of amphibolite and migmatitic gneiss. Previous petrological and geochronological studies in and around our study area showed that the lithotypes in the area of study have been achieved by predominated ∼1.2–0.9 Ga old MIII metamorphic event (e.g. Maji et al. Reference Maji, Goon, Bhattacharya, Mishra, Mahato and Bernhardt2008; Chatterjee et al. Reference Chatterjee, Banerjee, Bhattacharya and Maji2010; Rekha et al. Reference Rekha, Upadhyay, Bhattacharya, Kooijman, Goon, Mahato and Pant2011; Chakraborty et al. Reference Chakraborty, Ray, Chatterjee, Deb and Das2019; Basak et al. Reference Basak, Goswami, Gréau, Das and Bhattacharyya2025). At least three phases of deformation (D1, D2 and D3) were documented from our study area (Goswami and Bhattacharyya, Reference Goswami and Bhattacharyya2014). D1 deformation phase is exclusively preserved within the migmatitic and amphibolite enclaves. It produced migmatitic layering in migmatites and S1 foliation in amphibolites. S2 gneissic foliation in granite gneiss, tight to isoclinal folds of D1 migmatitic layers and S1 foliation in amphibolite enclaves mark the D2 deformation phase, while D3 shear zones affecting the S2 gneissic foliation within the NPSZ produced S3 mylonitic fabric (Goswami and Bhattacharyya, Reference Goswami and Bhattacharyya2014). Although the petrological and geochronological evolutions of the amphibolite and migmatite enclaves of the study area are well documented, there is a very little information available about the structural evolution of the host granite gneiss and the NPSZ (Mukherjee et al. Reference Mukherjee, Dey, Sanyal, Sengupta and Mukherjee2019 and references therein). Moreover, the anatomical features of the NPSZ remain largely unexplored and its relationship with the adjacent non-sheared gneisses (i.e. gneiss non-affected by D3 deformation event) also remains enigmatic. Therefore, the delineation of structural makeup of the NPSZ not only elaborates on the strain localization in granite but also provides new insights in connection to the granite emplacement and tectonics of the CGGC during the Proterozoic era.
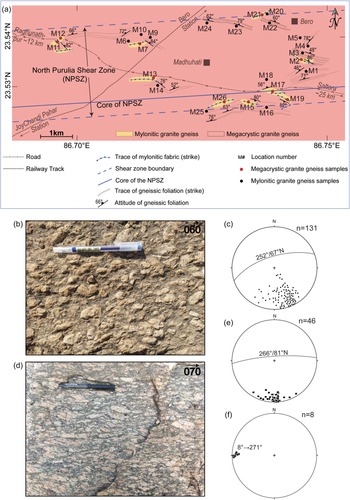
(a) Simplified geological sketch map of the study area. (b) Field photograph of megacrystic granite gneiss exhibiting gneissic foliation as defined by the alignment of feldspar megacrysts. Note that the megacrysts are variable in shape ranging from augen to euhedral shape. (c) Lower hemisphere equal angle projection of pole to the gneissic foliation in megacrystic granite gneiss with mean orientation 252°/67°N. (d) Field photograph of mylonitic granite gneiss with S–C fabric. (e) Lower hemisphere equal angle projection of pole to the mylonitic foliation with mean orientation 266°/81°N. (f) Lower hemisphere equal angle projection of stretching lineation with mean orientation 8°→271°.

3. Samples and methods
The present study adopts a multi-method approach to characterize the petro-structural features of non-sheared megacrystic granite gneiss and mylonitic granite gneiss samples from 26 outcrops (Figures 2–8). The orientation data of all identified field fabrics (e.g. non-sheared gneissic fabric, mylonitic fabric and stretching lineation) were measured for further structural analysis and correlation (Figures 2b–f). Oriented samples of megacrystic granite gneiss and mylonitic granite gneiss were collected orthogonal to the trend of the NPSZ for ‘AMS’ studies to identify planar and linear magnetic fabric, which helps in the determination of kinematic reference frame and subsequent preparation of thin sections for petrography and other microscopic investigations. The determination of kinematic reference frame was carried out following established protocol of Mamtani et al. (Reference Mamtani, Abhijith, Lahiri, Rana, Bhatt, Goswami and Renjith2017) (see Appendix 1 and Supplementary Fig. S1 for details).
Field photographs of mylonitic granite gneiss. Location numbers are indicated on the top left corners of the photographs (see Figure 2a). (a) Panoramic view of mylonitized granite with S3 mylonitic foliation within granite gneiss with S2 foliation. Presence of asymmetric feldspar porphyroclast along with the occurrence of asymmetric folds in the host granite gneiss depicts a sinistral shear sense; (b) S–C′ fabric and σ-type porphyroclast depicting sinistral sense of shear in mylonitic granite gneiss; (c) δ-type porphyroclast showing sinistral sense of shear; (d) sigmoidal S2 foliation deflected by S3 mylonitic foliation. Note that the shear plane has a high angle with the gneissic foliation; (e) sub-horizontal L3 mineral stretching lineation defined by elongated quartz crystals in mylonitic granite gneiss.

Q-A-P diagram of collected megacrystic granite gneiss and mylonitic granite gneiss samples. Modal percentage data are provided in Supplementary Table 1.

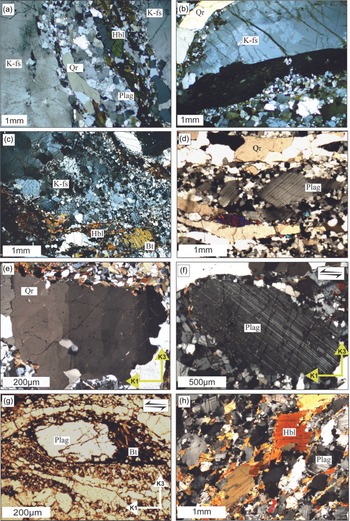
Photomicrographs showing (a) megacrystic granite gneiss (K-fs: K-feldspar; Qr: quartz; Hbl: hornblende; Plag: plagioclase); (b) weakly deformed, simple twinned K-feldspar megacryst (K-fs) and ribbon-shaped quartz (Qr) embedded within a partially recrystallized matrix highlight the S2 gneissic foliation; (c) mylonitic granite gneiss, where K-feldspar megacryst shows complete recrystallization (K-fs: K-feldspar; Hbl: hornblende; Bt: biotite); (d) S3 mylonitic foliation in mylonitic granite gneiss, where the elongated quartz ribbons (Qr) show recrystallization. Note that deformed partly recrystallized plagioclase feldspar (Plag) porphyroclasts are present within the recrystallized matrix in between quartz ribbons; (e) chessboard-patterned sub-grain formation in quartz (Qr) in mylonitic granite gneiss (K1 & K3: Long and short axis of AMS ellipsoid); (f) recrystallization mantled porphyroclast of plagioclase feldspar (Plag) in mylonitic granite gneiss (K1 & K3: Long and short axis of AMS ellipsoid); (g) asymmetric porphyroclast of plagioclase feldspar (Plag) mantled by recrystallized biotite (Bt) matrix (K1 & K3: Long and short axis of AMS ellipsoid); (h) amphibolite enclave, where preferential alignment of hornblende (Hbl) grains and elongated plagioclase grains (Plag) define the S1 foliation.

(a) Field photograph depicting the angular relationship between the mylonitic foliation and long axis of front-/back-rotated porphyroclasts; (b) hyperbolic net (Simpson and De Paor, Reference Simpson and De Paor1993; Reference Simpson and De Paor1997) plots of porphyroclasts of mylonitic granite gneiss; (c) calculated W k value is shown in kinematic vorticity number and percent simple shear relation diagram (after Forte and Bailey, Reference Forte and Bailey2007). (d) Rigid grain net (after Jessup et al. Reference Jessup, Law and Frassi2007; Xypolias et al. Reference Xypolias2010) plots of porphyroclasts of mylonitic granite gneiss.

Results of AMS analysis. (a & b) Lower hemisphere equal area projections of eigen vectors K1, K2 and K3 orientations of the AMS ellipsoid for analysed megacrystic granite gneiss and mylonitic granite gneiss across the NPSZ; (c) K m vs P j plots of all analysed samples; (d) P j vs T j plots of all analysed samples. Data presented in Table 1.

(a) Plot of mean aspect ratio of recrystallized quartz grains vs. distance from shear zone core; HW: hanging wall, FW: footwall; (b) triangular diagram showing relative dominance of mode of recrystallization estimated from recrystallized quartz grains; BLG: Bulging recrystallization, SGR: Sub-grain rotation recrystallization, GBM: grain boundary migration. (c) Micro-fracture density of megacrystic granite gneiss and mylonitic granite gneiss samples plotted as a function of distance from shear zone core. The plot shows an exponential rise in the micro-fracture density towards the core of the shear zone. (d) Megacrystic granite gneiss and mylonitic granite gneiss samples are plotted on a strain rate vs. temperature map; calculations are provided in Table 3.

A total number of 103 K-feldspar porphyroclasts from six outcrops of the mylonitic gneiss with ubiquitously developed stretching lineations were used for estimation of kinematic vorticity following the porphyroclast hyperbolic distribution (PHD) method (Simpson and De Paor, Reference Simpson and De Paor1993; Simpson and De Paor, Reference Simpson and De Paor1997) and the rigid grain net (RGN) method (Jessup et al. Reference Jessup, Law and Frassi2007; Xypolias, Reference Xypolias2010). The stretching lineation is rare in the study area, and thus, kinematic vorticity was estimated only from those mylonitic outcrops where it is ubiquitously developed and the XZ section can be defined unambiguously. Therefore, the reported Wk values represent the lineated, high-strain mylonitic exposures (six outcrops) and not all mapped outcrops. Since Xypolias and Kokkalas (Reference Xypolias, Kokkalas, Law, Searle and Godin2006) have argued that the PHD method overestimates the pure-shear component in absence of porphyroclasts with large aspect ratio, the kinematic vorticity number is also determined using the RGN method and compared with the results of the PHD method.
The petro-structural analyses of the samples were carried out from X–Z sections of the samples. The X–Z sections were identified with the aid of field foliation and stretching lineation. In case where stretching lineation is absent, we used the results of AMS analysis. Grain-scale features from 8 thin sections (2 of granite gneiss and 6 of mylonitized granite gneiss) were used to estimate flow stress and deformation temperature that prevailed during the nucleation of the NPSZ. Analyses of recrystallized quartz grain size, dominant dynamic recrystallization mechanism and the density of the micro-fractures across the NPSZ were utilized as proxies to estimate the approximate width of the dislocation zone representing the core of the NPSZ.
To estimate the relative strain rate variations across the shear zone and linking it with the associated estimated temperatures, fractal analyses were carried out from 8 thin sections (as mentioned above). The area-perimeter fractal dimensions (D) of the samples were carried out from recrystallized quartz grains. Areas (A) and perimeters (P) of >200 recrystallized quartz grains from each thin section were measured by using ImageJ software (Java-based image processing program). The grain diameter (d) of a circle having the equivalent area (A) as that of a quartz grain was calculated. Takahashi et al. (Reference Takahashi, Nagahama, Masuda and Fujimura1998) demonstrated that d and P of quartz have a relation P ∝ d D . P and d values of the quartz grains from a particular sample (thin section) were plotted and a least-square linear fit was obtained. The slope of the latter is the D for that sample, which follows the relationship of 1 ≤ D ≤ 2 since measurements were made from 2-dimensional images (Takahashi et al. Reference Takahashi, Nagahama, Masuda and Fujimura1998). It is, however, important to note that the procedure of strain rate calculation in natural rocks following Takahashi et al. (Reference Takahashi, Nagahama, Masuda and Fujimura1998) possibly overestimates the absolute value of strain rate (Mamtani and Greiling, Reference Mamtani, Greiling, Spalla, Marotta and Gosso2010). Therefore, in this study we gave weightage to the relative strain rate variations rather than the absolute strain rates.
4. Results
4.a. Mesoscale structures
The study area is predominantly occupied by megacrystic granite gneiss (Figure 2a), characterized by non-sheared to negligibly-sheared gneissic S2 foliation as defined by the parallel alignment of euhedral to augen-shaped K-feldspar megacrysts (Figure 2b). The gneissic foliation is commonly oriented along ENE–WSW direction with a mean orientation of 252°/67°N (Figure 2c).
The megacrystic gneiss is sheared along a ∼E–W trending D3 linear zone, which consists of multiple steeply dipping, sub-parallel to anastomosing discrete ductile shear zones (Figures 2a and 3a). Each shear zone is characterized by a S3 mylonitic foliation highlighted by S–C fabric and S–C′ fabric (Figures 2d and 3b), in which K-feldspar megacrysts are commonly sheared and turned into asymmetric σ-type sigmoidal porphyroclasts (Figure 3b). Locally, δ-type porphyroclasts are also developed (Figure 3c). The S3 mylonitic foliation is nearly sub-parallel to the S2 gneissic foliation with a mean orientation of 266°/81°N (Figure 2e). Locally, it is developed at a high angle to the gneissic foliation (Figure 3d). L3 stretching lineation associated with S3 mylonitic foliation is rare. It has an E–W trend and a sub-horizontal to shallow plunge mainly toward W (Figures 2f and 3e).
4.b. Mineralogy and microstructure
Both the megacrystic granite gneiss and mylonitic granite gneiss have a mineral association of K-feldspar + plagioclase feldspar + quartz + amphibole + biotite along with accessories such as allanite, apatite, titanite, zircon and opaque minerals. Despite a few samples of granodiorite gneiss, most of the megacrystic gneiss and mylonitic gneiss samples have granitic composition (Figure 4 and Supplementary Table 1 ). The amphibolite enclaves have a mineral association of amphibole + plagioclase feldspar + quartz + biotite ± titanite ± apatite, diagnostic of mid-to higher-amphibolite facies metamorphism.
The megacrystic granite gneiss exhibits pervasive S2 gneissic foliation as defined by the preferentially aligned framework of moderately deformed to partially recrystallized K-feldspar megacrysts and ribbon-shaped quartz (Figure 5a). The K-feldspar megacrysts typically exhibit simple twinning. Generally, the twin planes are aligned parallel to the S2 gneissic foliation (Figure 5b). Interstitial spaces between K-feldspar megacrysts and quartz ribbons are commonly filled up with amphibole, biotite and smaller-sized recrystallized plagioclase and quartz grains (Figures 5a–b).
Contrary to the megacrystic granite gneiss, the S3 mylonitic granite gneiss samples are strongly deformed and characterized by partially to completely recrystallized K-feldspar megacrysts (Figure 5c) wrapped by recrystallized asymmetric quartz ribbons (Figure 5d). Additionally, chessboard-patterned sub-grains in quartz (Figure 5e) and sigmoidal feldspar megacrysts with partial to complete recrystallization (Figures 5f and c) are also common. S3 foliation in the mylonitized granite gneiss locally wraps feldspar porphyroclasts (Figure 5g). It is also important to note that the mylonitic granite gneiss samples have more recrystallized quartz and K-feldspar as compared to the megacrystic granite gneiss (See Figure 5a vs. 5c). The kinematic indicators such as asymmetric feldspar porphyroclasts indicate a sinistral kinematics (e.g. Figures 5f–g), which confirms the observation made at the mesoscale (see Figure 2c).
The mafic amphibolite enclaves are characterized by S1 foliation defined by the strongly aligned grains of hornblende, biotite and variably deformed plagioclase crystals (Figure 5h).
4.c. Kinematic vorticity number
The angles between the long axes of the porphyroclasts to the C-planes of the mylonitic fabric (Φ) were measured on XZ planes at the outcrops, where positive and negative Φ values indicate forward-rotated and back-rotated grains, respectively (Figure 6a). For the PHD method, the front-and back-rotated porphyroclasts were plotted on a hyperbolic net (cf., De Paor, Reference de Paor1988) (Figure 6b). The cosine of this angle (Φ) yields the kinematic vorticity number (Bobyarchick, Reference Bobyarchick1986): $Wk = cos (\Phi)$
Here, the calculated Φ value is 38° resulting in a W k value of 0.788 (Figure 6b). In case of the RGN method (Jessup et al. Reference Jessup, Law and Frassi2007), the orientation of the rotated grains’ long axes with respect to the trace of the foliation or shear plane was plotted against the shape factor B of the grains. The shape factor was determined by the following equations (Passchier, Reference Passchier1987): $B=[(Mx)^2- (Mn)^2] / [(Mx)^2+ (Mn)^2]$
where $Mx$
represents the long axis of the grain and
$Mx$
represents the long axis of the grain and $Mn$
represents the short axis of the grain.
$Mn$
represents the short axis of the grain.
The plots of the back-and front-rotated porphyroclasts are shown in Figure 6c. The vertical lines corresponding to the positive and the negative hyperbolas delineate the critical value for the shape factor $\;B$
(e.g. Xypolias, Reference Xypolias2010). This value is essentially equivalent to the kinematic vorticity number W
m
. The estimated value of the kinematic vorticity number from the RGN for the back-rotated clasts is 0.85 and for the front-rotated clasts is 0.78 (Figure 6c).
$\;B$
(e.g. Xypolias, Reference Xypolias2010). This value is essentially equivalent to the kinematic vorticity number W
m
. The estimated value of the kinematic vorticity number from the RGN for the back-rotated clasts is 0.85 and for the front-rotated clasts is 0.78 (Figure 6c).
Both the RGN and PHD methods yield a comparable result, with kinematic vorticity numbers ranging from 0.78–0.85 and 0.79, respectively, signifying a sub-simple nature of progressive deformation in the NPSZ. It is, however, interesting to note that the low to moderate vorticity values obtained from 2-dimensional surfaces are commonly biased, and, therefore, a consideration of minimum systematic error of 0.2 is recommended (Iacopini et al. Reference Iacopini, Frassi, Carosi, Montomoli, Prior, Rutter and Tatham2011). Considering the error of 0.2, it could be asserted that the vorticity values could possibly lie in the range of 0.58–0.65.
4.d. AMS analysis
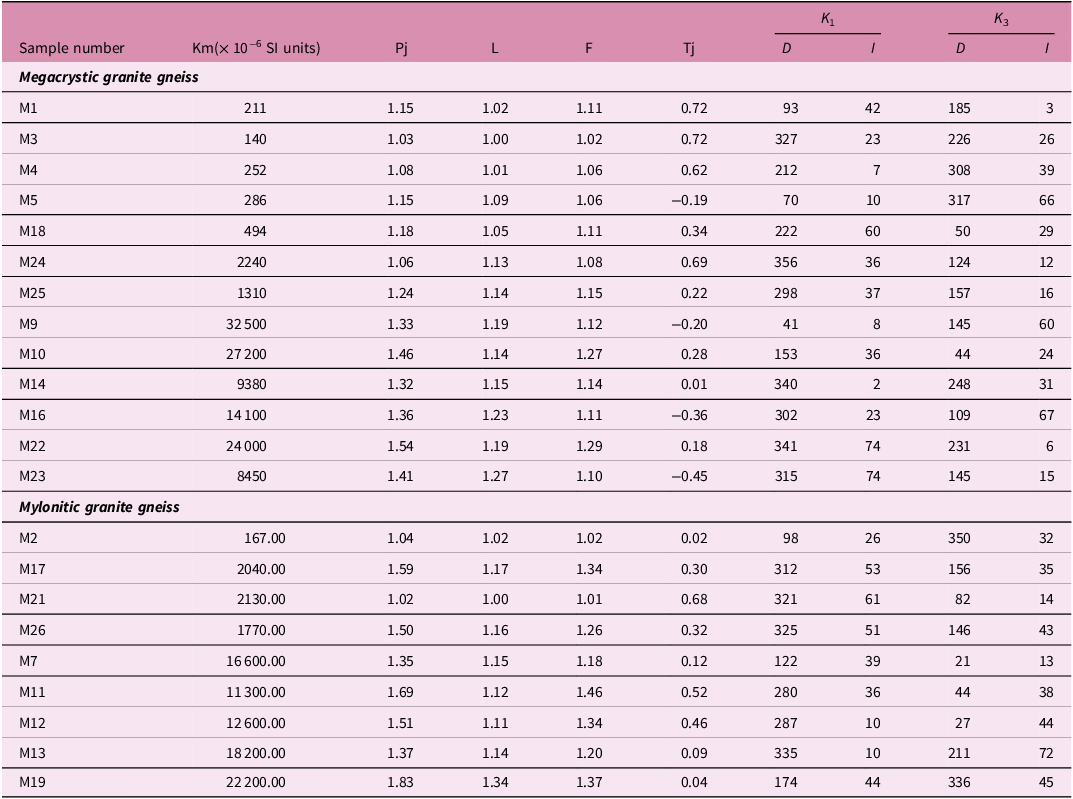
AMS of both granite gneiss and mylonitic gneiss across the NPSZ was measured from oriented samples to determine the mean susceptibility (Km), degree of magnetic anisotropy (Pj) and shape parameter (Tj). The mean susceptibility (Km) values of both megacrystic granite gneiss and mylonitic granite gneiss samples are strongly variable. In mylonitic gneiss, the Km values range from 167 to 22 200 µSI, whereas for megacrystic granite gneiss these range from 211 to 32 500 µSI (Table 1). The Pj values for granite gneiss and mylonitic gneiss vary from 1.03 to 1.54 and 1.02 to 1.83, respectively (Table 1). The AMS analysis revealed that the samples of both megacrystic granite gneiss and mylonitic granite gneiss have a scattered distribution of both magnetic foliation and lineation (Figures 7a, b). The calculated mean orientations with 95% confidence ellipses illustrating the uncertainties of the magnetic fabrics are also shown in Figures 7a and b. The large uncertainty bounds of the confidence ellipses indicate that both types of gneisses lack a consistent magnetic fabric and vary from sample to sample. The Km and Pj values for both granite gneiss and mylonitic granite gneiss show a strong positive correlation. However, the Pj values in relation to the Km values are notably higher in case of the mylonitic gneiss samples as compared to the granite gneiss samples (Figure 7c). It is also interesting to note that all the analysed samples of mylonitic gneiss here have a positive Tj value ranging from 0.02 to 0.68, while the granite gneiss samples record both positive and negative Tj values ranging from 0.72 to −0.45 (Table 1). The variation in the Tj values signifies a change in the shape of the AMS ellipsoid from only oblate in case of mylonitic gneiss samples to prolate & oblate in case of the megacrystic granite gneiss samples (Figure 7d).
Anisotropy of magnetic susceptibility (AMS) data of Granite gneiss and Mylonitic Granite gniess Granite. Km = Mean susceptibility; Pj = corrected degree of magnetic anisotropy; L= magnitude of lineation; F= magnitude of foliation; Tj = shape parameter. D and I are declination and inclination (in degrees), respectively, of the maximum (K1) and minimum (K3) principal axes of the AMS ellipsoid. Data for each site are the mean values obtained from analysis of multiple cores

4.e. Petro-structural analyses
4.e.1. Recrystallization mechanisms and aspect ratio of recrystallized quartz grains
Long and short axes of the recrystallized quartz grains were measured from the eight samples. Two samples are megacrystic granite gneiss (sample nos. M24 and M25), and six are mylonitic granite gneiss (sample nos. M2, M7, M12, M13, M17 and M26). The mean ratios of length to width of the recrystallized quartz grains vary from ∼1.1 to ∼1.8 and from ∼1.3 to ∼1.8 in mylonitic granite gneiss and granite gneiss, respectively, indicating that the shapes vary from equidimensional to elongated (Supplementary Table 2). The mean aspect ratios of both granite gneiss and mylonitic gneiss samples were plotted as a function of distance from the central part of the NPSZ. In both types of gneisses, the plot depicts a significant rise in the aspect ratios towards the central part of the shear zone (Figure 8a). The relative abundances of the recrystallization mechanisms in quartz were determined from the same eight samples and presented in Figure 8b. In both megacrystic granite gneiss and mylonitic granite gneiss, high-temperature grain boundary migration (GBM) recrystallization mechanism dominates towards the central part of the shear zone, while sub-grain rotation recrystallization (SGR) mechanism becomes prominent away from the shear zone (see Figure 8a for location of the sample and Figure 8b for mechanism of recrystallization).
4.e.2. Flow stress calculation from recrystallized quartz grains
The basis for a palaeo-piezometer, using the variation of dynamically recrystallized grain size of a wide variety of minerals with stress at steady state creep, was suggested by Twiss (Reference Twiss1977). Based on the theoretical assumptions and experimental results (Appendix 1), Twiss (Reference Twiss1977) proposed the following global piezometer: $\sigma = Bd^{-0.68}$
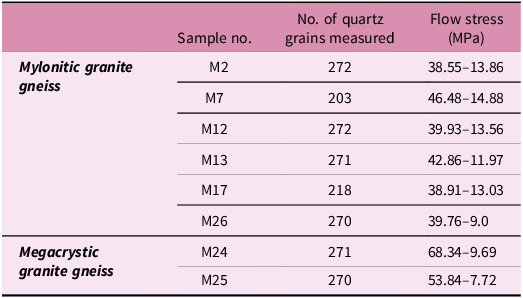
where σ is in MPa, d is in mm, and B is 5.5 (for quartz). Here, the flow stress for each sample was determined using Equation (3). The flow stress calculated from the recrystallized quartz grains in mylonitic granite ranges from ∼46 to12 MPa, whereas in granite gneisses it ranges from ∼8 to 68 MPa (Table 2). The calculations of the flow stresses from the diameters of the recrystallized quartz grains are presented in Supplementary Fig. S2 .
Results of calculated flow stress responsible for dynamic recrystallization of quartz grains in megacrystic granite gneiss and mylonitic granite gneiss samples across the NPSZ following Twiss (Reference Twiss1977)

4.e.3. Micro-fracture density as a function of distance from shear zone
The measured mean values for micro-fracture density (Supplementary Table 3) have been plotted as a function of distance (plotted on semi-log scale) from the central part of the shear zone (Figure 8c). The plot portrays an exponential decrease in the density of micro-fractures as we move away from the anticipated core of shear localization (Figure 8c).
4.f. Fractal analysis
4.f.1 Estimation of strain rate across the shear zone using fractal analysis
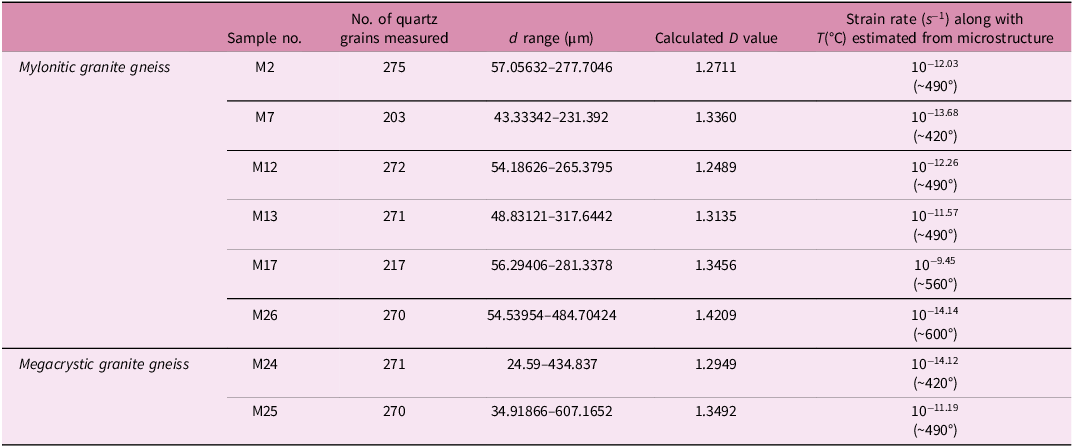
The results of the fractal analysis are given in Table 3 and Supplementary Fig. S3 . Strain rate calculations from the fractal dimension analysis show that, in case of mylonitic granite gneiss, the estimated strain rate ranges from ∼10−9.45 (sample M7) to ∼10−14.14 (sample M26), whereas in granite gneiss it ranges from ∼10−11.19 (sample M25) to ∼10−14.12 (sample M24).
Results of fractal analysis from recrystallized quartz grains following the method of Takahashi et al. (Reference Takahashi, Nagahama, Masuda and Fujimura1998) along with minimum temperature estimates from microstructures

4.e.2. Strain rate vs. temperature map
A deformation mechanism map (e.g. Frost and Ashby, Reference Frost and Ashby1982) is an effective way of representing the dominant mechanism responsible for deforming a material under a given set of conditions, which include field of stress, temperature, strain rate, etc. In the present work, the strain rate of samples as estimated from fractal analysis (Table 3) and their corresponding deformation temperatures ascertained from microstructures (Figures 5 and 8b) are plotted on the deformation mechanism map of Stipp et al. (Reference Stipp, StuÈnitz, Heilbronner and Schmid2002). Two calculated parameters, strain rate and temperature, have been used for the plot (Figure 8d). The plot exhibits a comparable trend of megacrystic granite gneiss and mylonitic granite samples (coloured circles) with respect to the natural examples as shown in cf. Figure 8 of Stipp et al. (Reference Stipp, StuÈnitz, Heilbronner and Schmid2002). From Figure 8d, it is ascertained that the deformation mechanisms responsible for the dynamic recrystallization of quartz in both types of gneisses occurred at a higher strain rate and a temperature range of ∼420–630°C under stress condition ≅ 100 MPa.
5. Discussion
5.a. Geometry and evolution of the NPSZ
The NPSZ represents an E–W trending, steeply dipping zone within megacrystic granite gneiss (Figure 2). It consists of multiple steeply dipping, sub-parallel to anastomosing discrete ductile shear zones with sinistral kinematics. Each of the shear zones is characterized by mylonitic S3 fabric, which developed over the S2 fabric of the megacrystic granite gneiss. The S3 mylonitic fabric is subsequently overprinted by a later set of extensional fractures (Figure 2a, d). The entire zone evolved in a sub-simple shear condition (Figure 6). Analyses of microstructural features indicate that the core of the NPSZ represents a high-strain zone compared to its distal part (Figure 8)
Microstructural observation shows that the mineralogical compositions of the granite gneiss and mylonitic gneiss are similar (Figure 4), but the shapes and sizes of the K-feldspar crystals are the prime attributes that differentiate the megacrystic granite gneiss from its mylonitized counterpart. Both S2 gneissic fabric and S3 mylonitic fabric are characterized by consistent shape preferred orientation (Figures 2b–e). In contrast, the magnetic foliations in both megacrystic granite gneiss and mylonitic granite gneiss show variable orientation (Figures 7a, b), which depicts a strong decoupling between the shape preferred fabric and AMS fabric. The decoupling suggests that the shape preferred fabric is controlled by the feldspar megacrysts, while the AMS fabric is controlled by the paramagnetic minerals such as amphibole, biotite, ilmenite in the interstitial spaces between the megacrysts. Although the magnetic foliation is variable in both types of gneisses, the mylonitic granite gneiss samples have higher Pj values as compared to the host megacrystic granite gneiss samples (Figure 7c). Anatomy of magnetic fabric in a rock is known to be controlled by combination of multiple factors such as mineral-physics properties, symmetry crystal, mineral abundances, crystal orientation-distribution, stress or strain, kinematic history and certain tectono-metamorphic processes like dynamic recrystallization, crystal plasticity, diffusion and neo-mineralization (Borradaile and Jackson, Reference Borradaile, Jackson, Martín-Hernández, Lüneburg, Aubourg and Jackson2004). In the present case, both host gneiss and mylonitic gneiss have common mineralogical composition (Figure 4 and Supplementary Table 1) and lack any evidence of metamorphic transformations, and, therefore, it could be regarded that strain-induced processes such as dynamic recrystallization was the chief controlling factor that enhanced the degree of magnetic anisotropy within the mylonitic granite gneiss compared to its surrounding granite gneiss. Microstructurally, the mylonitic gneiss has more recrystallized mass (e.g. Figures 5c and d) compared to its host counterpart, which indeed endorses the inevitable role of strain on the evolution of magnetic fabric. Furthermore, a strong contrast has been noted between the shape parameter (Tj) values of the mylonitic gneiss samples, which are restricted within a narrow range on the oblate field, and the host gneiss samples, which are dispersed over both oblate and prolate field (Figure 7d). Less oblateness and restricted range of the Tj values in the mylonitic gneiss samples suggests a strong strain-induced reorganization of the magnetic fabric.
Occurrence of elongated recrystallized quartz grains (mean aspect ratio > 1.5) and nearly equidimensional recrystallized quartz grains (mean aspect ratio < 1.5) in and off to the shear zone, respectively, advocate the high-strain localization along the NPSZ (Figure 8a). The elongation of the recrystallized quartz grains suggests dynamic recrystallization (Passchier and Trouw, Reference Passchier and Trouw2005), and the grains with higher aspect ratio indicate their involvement in the ongoing process of deformation after its formation (Banerjee and Matin, Reference Banerjee and Matin2013). The variable aspect ratio of the recrystallized quartz grains also suffices for the protracted period of recrystallization during deformation. It is also interesting to note that the flow stress values inferred from the recrystallized quartz grains are lower in the mylonitic gneiss than the megacrystic gneiss indicating a plastic strain-induced stress relaxation in the mylonitic gneiss within the NPSZ (Poirier, Reference Poirier1985).
The fractal analysis of recrystallized quartz grains reflects relatively high-strain rate at the core of the NPSZ relative to its distal part. It is important to note that the procedure of strain rate calculation in natural rocks following Takahashi et al. (Reference Takahashi, Nagahama, Masuda and Fujimura1998) possibly overestimates the absolute value of strain rate (Mamtani and Greiling, Reference Mamtani, Greiling, Spalla, Marotta and Gosso2010). Although some calculated strain rate values in the present study definitely exceed the reported natural strain rate of 10−14 to 10−12 s−1 (Passchier and Trouw, Reference Passchier and Trouw2005), recent accounts show that the maximum strain rate within viscous high-strain zones is in the range of 10−13 to 10−8 s−1 (Gueydan et al. Reference Gueydan, Mehl and Parra2005; Boutonnet et al. Reference Boutonnet, Leloup, Sassier, Gardien and Ricard2013; Viegas et al. Reference Viegas, Menegon and Archanjo2016). It is also estimated that if slip rates are 1–10 mm/yr for shear zones of width ranging from 1–1000m exhibited by mid-to lower-crustal mylonites, the strain rates may vary from 10−14 to 10−10 s−1 (Harris, Reference Harris2017; Fagereng and Biggs, Reference Fagereng and Biggs2019).
The microstructural investigations of both megacrystic gneiss and mylonitic granite gneiss suggest that both types experienced quasi-plastic deformation at high temperature where both quartz and feldspars deformed by dislocation creep-assisted recrystallization. However, the mylonitic gneiss in the NPSZ records much more intense intracrystalline deformation relative to the megacrystic gneiss (see Figure 5a vs. 5c). The quartz grains are recrystallized by either SGR or high-temperature GBM (Figure 8b), suggesting a minimum deformation temperature 400–500°C or even higher (Stipp et al. Reference Stipp, StuÈnitz, Heilbronner and Schmid2002). Such thermal conditions are supported by the presence of strain-free monomineralic quartz ribbons (e.g. Figure 5d) and chessboard extinctions in quartz grains (Figure 5f) (Wallis et al. Reference Wallis, Hansen, Britton and Wilkinson2019). Like quartz, feldspar crystals are also affected by intracrystalline deformation. Recovery structures such as sub-grain formation, recrystallization of both K-feldspar and plagioclase along with the formation of asymmetric ‘fish’-like structures (e.g. Figures 5d, g and h) in feldspar suggest a high-temperature deformation condition most likely above >500°C (Pryer, Reference Pryer1993; Passchier and Trouw, Reference Passchier and Trouw2005). All constituent minerals except biotite are fractured, which indicates that the brittle deformation took place in the waning stage of deformation at a temperature ∼300°C since quartz behaves in brittle manner below this temperature (Stipp et al. Reference Stipp, StuÈnitz, Heilbronner and Schmid2002).
5.b. Nucleation of the NPSZ
Nucleation of shear zones, particularly in isotropic rocks, like granite, is a long-lasting debate for the last few decades. One of the most effective models suggests that nucleation of ductile shear zone in granite requires precursor structures like fractures or dykes. Such precursor structures are the primary site for shear zone nucleation (Christiansen and Pollard, Reference Christiansen and Pollard1997; Mancktelow and Pennacchioni, Reference Mancktelow and Pennacchioni2005; Pennacchioni and Mancktelow, Reference Pennacchioni and Mancktelow2007; Goncalves et al. Reference Goncalves, Poilvet, Oliot, Trap and Marquer2016; Sarkar et al. Reference Sarkar, Banerjee, Maity and Srivastava2020).
In the study area, the megacrystic granite gneiss lacks any evidence of precursor fractures or dykes and, hence, precludes the possibility of nucleation along precursor brittle structures. However, the host gneiss contains a strong structural anisotropy in the form of gneissic foliation. The apparent parallelism of the gneissic foliation and the mylonitic foliation in the outcrops strongly suggests that both foliations developed under the same stress field.
In the granite gneiss parallelly aligned feldspar megacrysts containing simple twin (Figures 2b and 5a), which indicates crystallization from a magmatic environment (Vernon, Reference Vernon2000; Vernon and Paterson, Reference Vernon and Paterson2008). Although solid-state deformation significantly modified the grain boundaries of the megacrysts, the twin planes of the megacrysts remain parallel to the shape preferred orientation, which defines the gneissic foliation. Hence, it is reasonable to infer that the gneissic foliation resulted or at least initiated at the magmatic stage where the megacrysts aligned themselves along the magmatic flow direction (e.g. Vernon, Reference Vernon2000). We propose that the quartz and other smaller-sized crystal-rich domains in between the interstices of the megacrysts in the granite gneiss acted as the precursor to the shear zone nucleation. Mechanical behaviour of a polymineralic rock depends upon the relative strengths of the constituent minerals (Handy, Reference Handy1990). At any given temperature, quartz is much weaker compared to feldspar (Passchier and Trouw, Reference Passchier and Trouw2005), and hence, the quartz-rich domains between the megacrysts are the primary site of strain localization. The crystal plastic deformation followed the grain size reduction by dynamic recrystallization of the quartz-rich domains, aiding the incipient shear zone development (Montési and Hirth, Reference Montési and Hirth2003; Foley, Reference Foley2018). The system could be visualized as a non-slipping viscous matrix surrounding a monoclinic rigid clast (Mancktelow et al. Reference Mancktelow, Arbaret and Pennacchioni2002). Continuous deformation of the quartz-rich domains in anastomosing pattern is dictated by the initial disposition of the megacrysts (e.g. Figure 2b). The decoupling of deformation between the megacrysts and crystals of the interstitial spaces can be supported by the fact that the shape preferred fabric of the megacrysts and the AMS fabric hardly comply each other (see Figures 2c and e with Figures 7a and b). Continuous dynamic recrystallization along the interstitial spaces eventually caused strain hardening within the anastomosing shear zone networks. The strain hardening within the incipient shear zones ultimately transmitted the stress into the surrounding feldspar megacrysts and engulfed the megacrysts into the shear zone, which eventually widened the shear zone (Hobbs et al. Reference Hobbs, Mühlhaus and Ord1990).
5.c. Implication of NPSZ: late-Grenvillian magmatism and linkage to Rodinia supercontinent
The tectono-thermal events of the CGGC suggest that it evolved in a continent–continent collisional zone and represents a zone of amalgamation of north and south Indian cratonic blocks during the Neoproterozoic. The southern block is represented by the Singhbhum craton and North Singhbhum Mobile belt, while the northern block remains enigmatic since the northern side of the CGGC is hidden beneath recent alluvium. It is generally believed that the CGGC is thrusted over the NSMB with a southward vergence (Mahadevan, Reference Mahadevan2002; Mukherjee et al. Reference Mukherjee, Dey, Sanyal, Sengupta and Mukherjee2019).
Recently, a two-phase model of continent–continent collision with intermittent rifting has been suggested for the tectonic evolution of the mafic intrusive rocks in the Domain I of CGGC (Figure 1c), which witnessed two major orogenesis (D2 before 950 Ma and D3 after 920 Ma) separated by a period of lithospheric extension (Mukherjee et al. Reference Mukherjee, Dey, Ibanez-Mejia, Sanyal and Sengupta2018 a). More recently, from field relation of coronae-bearing mafic rocks in the Domain I of CGGC, Adak and Dutta (2021) opined that the mafic intrusion was prior to D3 but after D2 and is related to rifting, comparable to the 950–920 Ma event of Mukherjee et al. (Reference Mukherjee, Dey, Sanyal, Sengupta and Mukherjee2019). A tectono-thermal event is also suggested at ∼1.0 Ga in CGGC related to continent-continent collision between the North and the South Indian blocks (Goswami and Bhattacharyya, Reference Goswami and Bhattacharyya2008; Maji et al. Reference Maji, Goon, Bhattacharya, Mishra, Mahato and Bernhardt2008). Therefore, it is opined that the accretion of the continental blocks initiated at ∼1.0 Ga (Figures 9a–c), due to the gradual subduction of oceanic crust and closure of the basin between the Singhbhum Craton and the CGGC (e.g. Rekha et al. Reference Rekha, Upadhyay, Bhattacharya, Kooijman, Goon, Mahato and Pant2011). The mafic magma was generated in a post-collisional extension possibly because of delamination of subducting slab (e.g. Sylvester, Reference Sylvester1998). The underplating of such basic magma under the lower crust might have triggered partial melting of the mafic lower crust, forming a crustal-scale silicic magma (Figure 9d). Mingling between the basic magma and the silicic magma, followed by crystal fractionation of mafic minerals (hornblende) and accessory minerals like apatite and allanite, may have led to the formation of the megacryst-bearing granitoids of the present area. The mixing of mantle-generated basic magma and crustal magma and later fractional crystallization at lower crust produced the parental magma of granitoids representing the late-Grenvillian magmatic episode and is contemporaneous with the assembly of Rodinia (Figure 10). This interpretation agrees with general idea proposed very recently by several authors of considering the CGGC as part of a late-Grenvillian orogenic belt along which the North and South Indian Cratonic blocks amalgamated between 1.1 and 0.9 Ga (Duchesne et al. Reference Duchesne, Berza, Liegeois and Vander Auwera1998; Atherton and Ghani, Reference Atherton and Ghani2002; Jiang et al. Reference Jiang, Jiang, Ling, Zhou, Rui and Yang2002; Naganjaneyulu and Santosh, Reference Naganjaneyulu and Santosh2010; Das et al. Reference Das, Goswami and Bhattacharyya2020 b) leading to crustal thickening. The megacryst-bearing granite gneiss of the CGGC thus represents batholith emplaced along suture zones after the collisional assembly, similar to those in many other collisional orogenic sutures (Santosh et al. Reference Santosh, Maruyama and Sato2009). It is also envisaged that these events are plausibly related to the India–Antarctica amalgamation during the formation of Rodinia at ∼0.9 Ga as depicted in Figure 10 (Li et al. Reference Li, Bogdanova, Collins, Davidson, De Waele, Ernst, Fitzsimons, Fuck, Gladkochub and Jacobs2008). In the absence of geochronological data, the exact age of the intrusion and its subsequent metamorphism could not be established in the present study but considering the shoshonitic variety of granites in the vicinity of the study area, Goswami and Bhattacharyya (2014) also suggested the emplacement of the porphyritic granites in a collisional setting.
(a–c) Evolutionary model of the NPSZ in relation to the emplacement mechanism of the granite gneiss, now transformed into the mylonitic granite gneiss in the vicinity of the NPSZ during the amalgamation of North and South Indian Cratonic blocks (the sequence of events is adopted from Atherton and Ghani, Reference Atherton and Ghani2002). (d) 3-D structural model of the study area illustrating the structural relationships in the different crustal domains. The ∼NNE-SSW compressional event during ∼1000–950 Ma led to the nucleation of the NPSZ and modified the magmatic event associated with it. The ∼E–W trending mylonitic foliation in mylonitic granite gneiss along NPSZ and conspicuous development of shear planes on cross-sectional view in mylonitic granite gneiss is also depicted in the model.

Temporal stages of Rodinia supercontinent assembly at ∼1.0 Ga and ∼0.9 Ga (Li et al. Reference Li, Bogdanova, Collins, Davidson, De Waele, Ernst, Fitzsimons, Fuck, Gladkochub and Jacobs2008). Tectonostratigraphic correlations between Australia, Yangtze Craton, Cathaysia and Laurentia (Li et al. Reference Li, Bogdanova, Collins, Davidson, De Waele, Ernst, Fitzsimons, Fuck, Gladkochub and Jacobs2008). The Greater India is included in the existing framework from the present study with approximate timing of deformation events (as discussed in text).

6. Conclusions
The present study shows that intra-cratonic or ITSZs can be identified within cratonic regions by an integration of field observation, AMS studies and petro-structural analyses methods, and corroborated with the analysis of kinematic vorticity. The most significant conclusions are:
-
a. The NPSZ is a shear zone where deformation is partitioned into several steeply dipping discrete ductile sinistral shear zones characterized by a sub-simple shear component of deformation developed under flattening regime.
-
b. The discrete shear zones nucleated within the quartz-rich domains located between K-feldspar megacrysts in non-sheared granite gneiss.
-
c. The emplacement of the megacryst granite gneiss resulted from magmatic underplating related to the anatexis of mafic granulite at lower-crustal levels during the amalgamation of CGGC and Singhbhum Craton.
-
d. The NPSZ is an ITSZ in the CGGC concomitant to the granite emplacement and crustal thickening during the amalgamation of the North and South Indian blocks during 0.9–1.1 Ga and Late-Grenvillian magmatism at ∼0.9 Ga during the assembly of Rodinia supercontinent.
Supplementary material
The supplementary material for this article can be found at https://doi.org/10.1017/S0016756826100612
Acknowledgements
The authors acknowledge the infrastructural facilities provided by Banaras Hindu University and IIT Kharagpur for this study. SB acknowledges the DST-PURSE 5050 program for the AGICO made MFK2-FA Kappabridge instrument installed in the Laboratory for Analysis of Magnetic and Petrofabric (LAMP) in the Banaras Hindu University (BHU), Varanasi. SB would also like to thank Banaras Hindu University for providing Seed and Bridge grants under the Institute of Eminence program to the University (Development Scheme number 6031). We were benefitted from discussions with Prof. Abdul Matin and Prof. Bapi Goswami, University of Calcutta. Help extended by Mr. Sumit Guha during the fractal analysis is commendable. We also appreciate the effort and patience of Dr. Chiara Frassi and an anonymous reviewer, who have provided detailed reviews that helped us in enhancing the quality of the manuscript significantly. We would also like to thank Prof. Olivier Lacombe for editorial handling of this manuscript.
Author contribution
Sayandeep Banerjee: Conceptualization, Investigation, Methodology, Data curation, Formal analysis, Visualization, Writing – original draft and revisions, Fund acquisition, Goutam Sarkar: Conceptualization, Investigation, Methodology, Writing– original draft and revisions, Visualization, Validation, Manish Mamtani: Methodology, Visualization, Validation, Writing – editing.


 Open access