


Introduction
Subterranean environments are worldwide distributed and occur under diverse large-scale environmental conditions (Mammola and Leroy Reference Mammola and Leroy2018). This perspective supports the application of Hutchinson’s duality concept (Colwell and Rangel Reference Colwell and Rangel2009), wherein caves and their associated biota can be conceptualized as occupying a multidimensional environmentally space (see Colwell and Rangel Reference Colwell and Rangel2009; Coelho et al. Reference Coelho, Barreto, Rangel, Diniz-Filho, Wüest, Bach, Skeels, Mcfadden, Roberts, Pellissier, Zimmermann and Graham2023; Graham et al. Reference Graham, Araujo, Barreto, Dambros, Diniz-Filho, Zimmermann, Rangel and Coelho2025). Consequently, similar environmental conditions may occur in geographically distant caves, whereas spatially nearby caves may differ in their environmental conditions. Under the dual framework, it becomes possible to identify geographic regions that present unique combinations of large-scale environmental conditions in which both caves and their subterranean biodiversity remain unexplored or insufficiently studied.
Brazil contains the largest extension of karst landscapes in South America (Auler Reference Auler and Gunn2004), offering vast potential for cave occurrence (CECAV 2025a), a wide diversity of climatic conditions (Sparovek et al. Reference Sparovek, De Jong Van Lier and Dourado Neto2007), and abundant primary resources within subterranean environments. Nevertheless, a large proportion of Brazilian caves remain undiscovered, unmapped, or insufficiently sampled in terms of biodiversity (Ficetola et al. Reference Ficetola, Canedoli and Stoch2019; Zampaulo and Simões Reference Zampaulo and Prous2022). Estimates suggest that the approximately 30,000 officially registered caves (CECAV 2025b) may represent less than 10% of the total number of caves potentially present (Jansen et al. Reference Jansen, Cavalcanti and Lamblém2012; Cruz and Piló Reference Cruz and Piló2019). The current spatial distribution of known caves is strongly influenced by socioeconomic factors and accessibility constraints, with most known caves concentrated near urban centres and mining regions (Castro-Souza et al. Reference Castro-Souza, Bosco and Sobral-Souza2024). Although the potential for new caves search is exceptionally high (Zampaulo and Prous Reference Zampaulo and Prous2022), these sampling biases have limited progress in both scientific understanding and the conservation of subterranean biodiversity, its associated ecosystem services, and human well-being.
Addressing this imbalance requires the development of strategies that redirect and maximize sampling efforts towards sites characterized by environmental conditions distinct from those already investigated, thereby promoting a more representative and comprehensive assessment of subterranean diversity. However, no previous prioritization framework for subterranean sampling in Brazil has explicitly incorporated the environmental multidimensionality underlying cave biota and sampling prioritization. This gap likely stems from the persistent tendency of most studies to treat caves as isolated systems and to focus primarily on local-scale analyses, rather than adopting large-scale, integrative approaches capable of capturing environmental variability across regions. Because environmental heterogeneity influences species composition (Faith and Walker Reference Faith and Walker1996), and regions with distinct environmental and geographical characteristics tend to harbour unique ecological communities (Hortal and Lobo Reference Hortal and Lobo2005; Nuñez-Penichet et al. Reference Nuñez-Penichet, Cobos, Soberón, Gueta, Barve, Barve, Navarro-Sigüenza and Peterson2022), integrating these dimensions is essential for advancing our understanding of how cave environments are distributed across broad environmental and geographical gradients.
In this context, we aim to: (i) identify regions in Brazil where caves occur under distinct environmental and geographical conditions through large-scale site-selection modelling; (ii) determine which of these regions lack recorded caves in their surroundings, thereby recommending priority areas for new cave prospecting; and (iii) identify caves located near these priority regions where subterranean biodiversity can be surveyed, contributing to a more comprehensive understanding of biodiversity patterns across varying environmental and geographical contexts. It is important to emphasize that the proposed approach primarily targets non-troglobitic species, since the distribution of troglobitic taxa (i.e., organisms strictly confined to subterranean habitats, such as caves and groundwater systems) (Sket Reference Sket2008) is predominantly shaped by historical and evolutionary processes that were not incorporated into the models.
Materials and methods
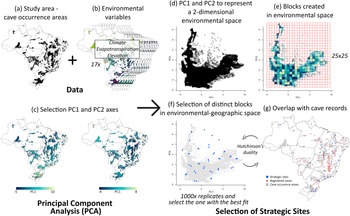
Based on the premises of Hutchinsonian duality (Figure 1), we used polygons representing Cave Occurrence Areas in Brazil (CECAV 2025a), reprojected to the EPSG:4326 coordinate reference system, to delineate the study area in geographic space. These polygons correspond to lithological units with potential for hosting natural subterranean environments, including rock shelters, underground cavities, and shallow subterranean habitats (Figure 2a).
Geographic and environmental representation of cave occurrence areas in Brazil combined with an illustrative (hypothetical) distribution of registered caves, based on Hutchinson’s duality. (A and B) Caves that are geographically distant from one another may occupy the same position in environmental space, just as caves that are relatively close may occupy distinct positions within that space. (C and D) Hutchinson’s duality can assist in identifying, both geographically and environmentally, cave occurrence areas that remain unstudied and that exhibit unique environmental conditions (e.g., areas outside the blue polygon).

Workflow for selection of strategic site for cave prospecting and subterranean biodiversity surveys. (a) We defined our study area based on the boundaries of the occurrence areas of Brazilian caves; (b) we represented the environmental conditions of this area using different environmental variables (i.e., climate, evapotranspiration, and elevation); (c) we performed a principal component analysis (PCA) with the selected environmental variables; (d) we used the first two PCA axes to represent the two-dimensional environmental space of subterranean regions; (e) we divided the two-dimensional environmental space into 25 × 25 blocks; (f) we selected distinct blocks in both environmental and geographical space through 1,000 replicates to identify the best model; (g) we projected our model onto the geographical space and overlaid it with the records of catalogued caves in Brazil.

To characterize the range of climatic conditions within the study area, we extracted raster-based bioclimatic variables at a spatial resolution of 2.5 arc minutes (∼4.5 × 4.5 km) for the current climatic scenario. The selected variables included the following: (i) Bioclimatic variables – To represent local climatic conditions, we selected 15 of the 19 bioclimatic variables available in the WorldClim 2.1 database (Fick and Hijmans Reference Fick and Hijmans2017). Variables derived from combined temperature and precipitation metrics (e.g., BIO8 – Mean Temperature of the Wettest Quarter; BIO9 – Mean Temperature of the Driest Quarter; BIO18 – Precipitation of the Warmest Quarter; BIO19 – Precipitation of the Coldest Quarter) were excluded to avoid the generation of spatial mathematical artifacts, as noted by Escobar et al. (Reference Escobar, Lira-Noriega, Medina-Vogel and Peterson2014) and Nuñez-Penichet et al. (Reference Nuñez-Penichet, Cobos, Soberón, Gueta, Barve, Barve, Navarro-Sigüenza and Peterson2022). (ii) Evapotranspiration – We included the annual potential evapotranspiration variable from the ENVIREM database (Title and Bemmels Reference Title and Bemmels2018) as a proxy for local primary productivity. (iii) Elevation – Elevation data derived from the Shuttle Radar Topography Mission (SRTM), also available through the WorldClim 2.1 database (Fick and Hijmans Reference Fick and Hijmans2017), were incorporated to represent altitudinal variation across the study area. All environmental layers were then clipped to the boundaries of cave-occurrence polygons in Brazil to ensure spatial congruence with the study area (Figure 2b).
We applied the Environment–Geography (EG) site selection model proposed by Nuñez-Penichet et al. (Reference Nuñez-Penichet, Cobos, Soberón, Gueta, Barve, Barve, Navarro-Sigüenza and Peterson2022) to identify cave occurrence areas characterized by distinct geographic and environmental conditions. Initially, a principal component analysis (PCA) was performed using the selected environmental variables (Figure 2c). The first two principal components (PC1 and PC2) were retained to represent the main gradients of environmental variation across Brazilian cave occurrence areas in a two-dimensional environmental space (Figure 2d). This environmental space was subsequently partitioned into 25 × 25 grid cells, each representing a unique environmental interval (Coelho et al. Reference Coelho, Barreto, Rangel, Diniz-Filho, Wüest, Bach, Skeels, Mcfadden, Roberts, Pellissier, Zimmermann and Graham2023; Nuñez-Penichet et al. Reference Nuñez-Penichet, Cobos, Soberón, Gueta, Barve, Barve, Navarro-Sigüenza and Peterson2022) (Figure 2e). A random sampling procedure was then employed to select distinct grid cells within this space. For each selected cell, we examined the geographic distribution of all corresponding points to determine whether they formed one or more geographically distinct clusters. To assess this, we calculated pairwise geographical distances among a random subset of points within each cell and applied a unimodality test (Hartigan Reference Hartigan1985) to evaluate whether the distance distribution followed a unimodal or multimodal pattern, thus indicating single or multiple geographically distinct groups (see Nuñez-Penichet et al. Reference Nuñez-Penichet, Cobos, Soberón, Gueta, Barve, Barve, Navarro-Sigüenza and Peterson2022).
For grid cells exhibiting unimodal geographic distance patterns, we assumed that the points were spatially clustered and selected the point closest to the environmental centroid of the respective cell. In contrast, for multimodal patterns (indicating the presence of distinct geographic clusters), we selected one point from each of the two largest clusters, each located near the environmental centroid of the corresponding cell (see Nuñez-Penichet et al. Reference Nuñez-Penichet, Cobos, Soberón, Gueta, Barve, Barve, Navarro-Sigüenza and Peterson2022).
This analytical procedure was repeated 1,000 times, with random selection of grid cells from the environmental space in each iteration. The final selection was based on the replicate exhibiting the Maximum Median Geographical Distance (MMGD) among selected grid cells within the environmental space (see Nuñez-Penichet et al. Reference Nuñez-Penichet, Cobos, Soberón, Gueta, Barve, Barve, Navarro-Sigüenza and Peterson2022) (Figure 2f). The optimal site-selection model (i.e., MMGD configuration) was then projected onto both environmental and geographic spaces and overlaid with the known distribution of caves in Brazil. To examine the representativeness of the selected sites, we assessed the distribution of recorded caves within the environmental space, considering only those located within the boundaries of officially recognized cave occurrence areas (∼25,000 caves), as reported in the National Registry of Speleological Information (CANIE) (CECAV 2025b) (Figure 2g).
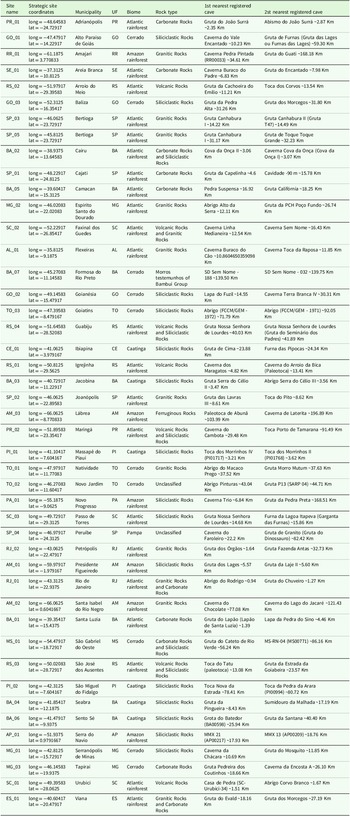
We further calculated the distance between each selected site and its two nearest recorded caves, using the filtered CANIE dataset (Table 1). Caves located within 8 km of a selected site were classified as nearby, consistent with the macroecological scale of our analyses (∼4.5 × 4.5 km grid cells). This threshold also reflects a practical approximation for assessing cave accessibility and sampling feasibility. Distances (in kilometres) between selected sites and nearby caves were subsequently represented graphically across Brazilian biomes and states.
Geographic information of the selected strategic sites and the distances (km) to the two nearest caves, according to data from the National Registry of Speleological Information (CANIE)

All analyses were performed in R (R Core Team 2024). The site-selection models integrating environmental and geographic dimensions were implemented using the biosurvey: Tools for Biological Survey Planning package (Nuñez-Penichet et al. Reference Nuñez-Penichet, Cobos, Soberón, Gueta, Barve, Barve, Navarro-Sigüenza and Peterson2022). Distance calculations between selected sites and known caves were conducted with the geosphere: Spherical Trigonometry package (Hijmans Reference Hijmans2022). Final maps were produced and edited using QGIS 3.38 (Free 2024) and Inkscape (Inkscape Team 2024).
Results
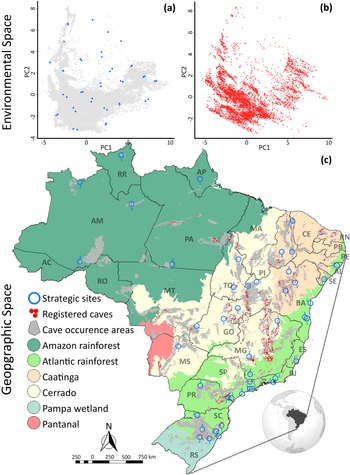
The first two axes of the PCA (PC1 and PC2) accounted for 73.6% of the total environmental variances, considering climatic, evapotranspiration, and elevation variables (see Supplementary Table 1 for variable loadings). When comparing the environmental space occupied by Brazilian cave occurrence areas with the distribution of known caves, it becomes evident that many environments with high potential to host caves remain unexplored (Figure 3a and 3b). Partitioning this environmental space into discrete units resulted in 353 distinct environmental blocks across the study area, from which the strategic site-selection model integrating both environmental and geographic dimensions identified 45 unique sites distributed across five Brazilian biomes and 19 states (Figure 3c).
Distribution of strategic sites for cave prospecting and/or subterranean biodiversity surveys within Brazil’s environmental and geographic space of cave occurrence areas. (a) Distribution of strategic sites in the environmental space (blue points). (b) Distribution of known caves in the environmental space (red points). (c) Distribution of strategic sites in the combined environmental–geographic space. The numbers associated with the sites indicate their relative proximity to other caves within the same state; however, this ranking does not necessarily imply the presence of nearby caves (see legend alongside the map and Table 1 for full details).

The highest concentration of priority sampling sites occurred in the Atlantic rainforest, 22 sites (48.89%), followed by the Cerrado, with 10 sites (22.22%). The Caatinga and Amazon rainforest each contained six sites (13.33%), whereas the Pampa included only a single site (2.22%) (Figure 3c). Considering the proximity of known caves to the selected sites, the Atlantic rainforest exhibited the highest proportion of priority sites within 8 km of known caves (39.1%). The Amazon rainforest and Caatinga showed intermediate proportions, each with 33.3% of sites near known caves, highlighting substantial gaps in subterranean sampling across some regions. In contrast, none of the sites located in the Cerrado were situated within 8 km of registered caves, highlighting the limited existing knowledge in this biome. For the Pampa, the single site selected by the model also lacked nearby registered caves. Finally, no sites were selected within the Pantanal biome (Figure 4).
Distribution of distances (km) [log 10] to the two nearest caves of each selected strategic site across different biomes of Brazil.

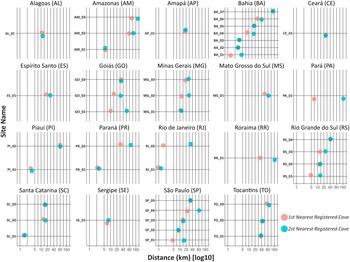
The Brazilian states with the highest number of sites identified by the model were Bahia (7), São Paulo (5), and Rio Grande do Sul (4), followed by Amazonas (3), Goiás (3), Minas Gerais (3), Santa Catarina (3), and Tocantins (3). Intermediate numbers of sites were recorded in Piauí (2), Paraná (2), and Rio de Janeiro (2), while Alagoas (1), Amapá (1), Ceará (1), Espírito Santo (1), Mato Grosso do Sul (1), Pará (1), Roraima (1), and Sergipe (1) contained only one selected site each. No sites were identified in Acre, Mato Grosso, Paraíba, Pernambuco, Rio Grande do Norte, or Rondônia (Figure 3c). Regarding the proximity of catalogued caves, only Rio de Janeiro had caves within 8 km of all its selected sites. In Bahia, three of the seven sites had nearby caves, whereas in São Paulo (1/5), Rio Grande do Sul (1/4), Santa Catarina (1/3), Piauí (1/2), Paraná (1/2), and Amazonas (1/3), only one site per state fell within this distance threshold. The single sites in Pará and Sergipe were also located near known caves. Conversely, in Goiás (3/3), Minas Gerais (3/3), Tocantins (3/3), Alagoas (1/1), Amapá (1/1), Ceará (1/1), Espírito Santo (1/1), Mato Grosso do Sul (1/1), and Roraima (1/1), all selected sites were situated more than 8 km from any registered cave (Figure 5).
Distribution of distances (km) [log 10] to the two nearest caves of each selected strategic site across different states of Brazil.

Discussion
Our selection model to sampling priority caves integrates large-scale environmental and geographical conditions, a novel approach that identified several sites with limited knowledge regarding cave distribution, particularly within the Cerrado, Amazon rainforest, and Caatinga. Even in areas where caves are known to occur and that exhibit broad environmental representativeness, such as the Atlantic rainforest, less than half of the sites identified by the model have documented caves. These findings highlight, for the first time, that when large-scale environmental and geographic heterogeneity is considered, knowledge of cave distribution in Brazil remains limited. Such gaps are likely to extend to, and strongly shape, the subterranean biodiversity currently documented, thereby constraining comprehensive assessments of Brazil’s subterranean biota.
Sampling biases and their consequences for speleological sampling
Brazilian environmental legislation mandates cave prospecting, cataloguing, and fauna documentation for activities that may impact subterranean environments (Cruz and Piló Reference Cruz and Piló2019; Sion Reference Sion and Sánchez-Bravo2022; CECAV 2025b). While this requirement has contributed to mapping cave distribution across the country (CECAV 2025b), it has also produced a strong sampling bias, with cave records concentrated near mining areas and urban centres (Castro-Souza et al. Reference Castro-Souza, Bosco and Sobral-Souza2024). Our findings show that this uneven pattern of sampling is not only geographic but also environmental: known caves occupy only a narrow subset of the multidimensional environmental space available to subterranean ecosystems in Brazil. This discrepancy carries profound implications. Subterranean communities, particularly the non-troglobitic assemblages targeted in our study, possibly respond strongly to broad-scale environmental and geographic gradients. As a result, under-sampled environmental regions are likely to harbour ecological communities that remain undocumented, reinforcing the notion of an “overlooked majority” of subterranean biodiversity that is yet to be described or even detected.
Priority regions for cave prospecting and biodiversity inventories
The regions highlighted by the EG model represent strategic areas where cave prospecting and faunal surveys should be prioritized. In the Cerrado, Amazon rainforest, and Caatinga, most selected sites lack known caves within 8 km, suggesting that these regions remain largely unexplored despite exhibiting broad environmental distinctiveness. Even in states where caves are known to occur, such as São Paulo, Rio Grande do Sul, Santa Catarina, Piauí, Paraná, and Amazonas, only a single site per state showed caves within accessible distance. This emphasizes the need to expand prospecting beyond historically surveyed karst areas, particularly into lithologies traditionally considered marginal but now recognized as important for shelter-bearing subterranean habitats (e.g., sandstone, volcanic, and granitic outcrops).
Sites with known caves (i.e., AM_02, BA_01, BA_02, BA_03, PA_01, PI_01, PR_01, RJ_01, RJ_02, RS_01, SC_01, SE_01, and SP_01) should be prioritized for biological surveys, as many may harbour undescribed fauna, but their existing biodiversity data remain unavailable or unpublished due to licensing restrictions (Table 1). These caves represent low-hanging fruit where the discovery of new records is highly probable. In recent years, research on Brazilian cave heritage has advanced significantly, supported by funding programs for speleological groups and research institutions across the country. Notable initiatives include the Terms of Commitment for Speleological Compensation, the Speleological Project Management System, and the National Action Plan for the Conservation of Brazilian Cave Heritage (see: https://www.gov.br/icmbio/pt-br/assuntos/centros-de-pesquisa/cavernas).
The urgent need for accessible and standardized subterranean biodiversity data
According to Brazilian environmental legislation, biodiversity data generated through subterranean inventories conducted in licensing processes must be publicly accessible (Brazil 1981; Brazil 2003). However, in practice, accessing these data is extremely difficult, as the lack of an integrated and publicly accessible database on Brazilian subterranean biodiversity remains one of the major obstacles to research and conservation efforts. In this study, this limitation prevented the integration of biological data into our model, unlike the approach used by Nuñez-Penichet et al. (Reference Nuñez-Penichet, Cobos, Soberón, Gueta, Barve, Barve, Navarro-Sigüenza and Peterson2022). Although licensing and environmental agencies require that biodiversity data from impact assessments and cave studies be deposited in scientific collections and research institutions, there is neither a standardized digital format requirement (e.g., Darwin Core) nor an obligation to make these data publicly available through the primary governmental agency responsible for cave conservation in Brazil, the National Center for Research and Conservation of Caves (CECAV). Furthermore, many specimens documented within caves may not have been taxonomically identified by specialists due to the shortage of taxonomists and the lack of oversight regarding the taxonomic accuracy of identifications conducted in Brazilian environmental impact assessments. This combination of limited taxonomic resolution, poor data standardization, and restricted accessibility severely constrains access to primary biodiversity records, thereby impeding large-scale ecological analyses and the formulation of robust, evidence-based conservation strategies for subterranean ecosystems.
Final considerations
Overall, our findings offer critical insights for maximizing the identification of speleological sites in environmentally and geographically unexplored regions through a probabilistic approach. This methodology could also be applied to specific lithologies or areas with limited cave coverage, ensuring randomness and independence in site selection for future studies. Furthermore, we emphasize the urgent need for a public database documenting primary biodiversity record from Brazilian caves, similar to the existing National Registry of Speleological Information (CECAV 2025b). In the absence of transparent data integration and open access, independent research groups and environmental licensing teams are likely to repeatedly survey the same geographical and environmental contexts, thereby constraining the spatial, environmental, and taxonomic breadth of scientific knowledge and undermining effective conservation planning.
Supplementary material
The supplementary material for this article can be found at https://doi.org/10.1017/S0266467426100534.
Data availability statement
The data that support the findings of this study are available from the “Centro Nacional de Pesquisa e Conservação de Cavernas” (CECAV) at https://www.gov.br/icmbio/pt-br/assuntos/centros-de-pesquisa/cavernas.
Acknowledgements
We are grateful to the Laboratory of Macroecology and Biodiversity Conservation (MacrEco) at Federal University of Mato Grosso (UFMT) and Center of studies on Subterranean Biology (CEBS) at Federal University of Lavras (UFLA). RACS is funded by CAPES (grant PIPD 88887.107568/2025-00). R.L.F. acknowledges the support of the National Council for Scientific and Technological Development (CNPq; Grant No. 302925/2022–8), and M.S.S. acknowledges support from CNPq (Grant No. 303434/2025). We thank CECAV and IABS for the financial support – TCCE 1/2022 N° 031/2024 (TCCE ICMBio/VALE III: Speleological Compensation).
Author contributions
RACS conceived the study with input from all authors. All authors contributed to the investigation. RACS curated the data and performed the formal analyses. RACS, RLF, and TSS developed the visualizations. RACS and TSS wrote the original draft. RLF, MSS, GL, and AK reviewed and edited the manuscript. All authors read, discussed the results, and approved the final version of the manuscript.
Competing interests
The authors of this manuscript have no conflicts of interest to declare.