


Introduction
Glaciological work carried out by the Scottish East Greenland Expedition in the summer of 1958 included observations on the movement of the Sefstrøms Gletscher. It was originally hoped to return and make further observations the following summer, but this did not prove possible. However, it is felt that the results of the single season’s work are worth recording.
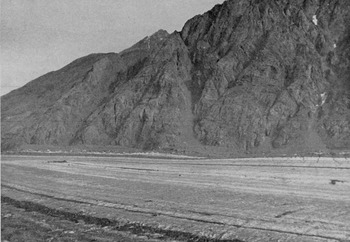
The Sefstrøms Gletscher is situated in Scoresby Land, north-east Greenland, and the approximate position of its terminus is lat. 72° 08′ N., long. 25° 25′ W. It is a valley glacier some 25 km. long, flowing in a north-westerly direction from an elevation of some 1,700 m. down to sea-level in Alpefjord. It is not fed from an ice cap, but it receives two large tributary glaciers, one from each side, about a third of the way along its course; it has about ten smaller tributaries. Approximately 2 km. from its terminus it unites with another glacier of comparable size (Gullygletscher). The termini of the two glaciers project into the fjord and are apparently grounded. The glacier is presumed to be of sub-polar type in Ahlmann’s classification,Reference Ahlmann 1 because melt-water streams were observed to discharge through tunnels in the ice and did not appear to descend to the rock bed. The firn line is at about 1,200 m. Figures 1 and 2 are views of the glacier and Figures 3 is a sketch map, showing the region about 5 km. from the terminus where measurements were made.
View looking up the Sefstrøms Gletscher from the upper observation station

View across the Sefstrøms Gletscher from the upper observation station, showing the lower part of the area of observation
Sketch map showing the relative position of the area of observation

Methods
Markers consisted of 6 ft. (1 .83 m.) bamboos set in holes drilled in the glacier surface and redrilled as necessary. The base of each bamboo froze into its hole. Eighteen markers were used, arranged in a pattern of longitudinal and transverse lines as shown in Figure 4. For convenience, longitudinal and transverse lines will be referred to subsequently as “Columns” and “Rows” respectively. Two markers in the lowest row (Row 4) were omitted because they were only visible from one of the three observation stations. Data for marker 35 proved to be less accurate than those from the other markers and so they were excluded from the analysis.
Plan of the area of observation showing the positions and altitudes of observation stations and markers on 3 August 1958. Underlined numbers are distances between markers

The position of each marker was determined by triangulation from three survey stations located a short distance from the edge of the glacier. Two stations were on bedrock but the third had to be placed on the crest of an old moraine. However, the observations do not suggest any instability at this station. The relative positions of the survey stations were determined by triangulation from the ends of a base line measured on the surface of the glacier.
Observations were made on 3, 10, 17, 24, and 29 August 1958. Both horizontal and vertical movement was measured, except on the last occasion, when time did not permit measurement of vertical angles.
The triangulation computations indicate that the maximum error in the determination of the position of any marker on any day was ±7.5 cm. Angles were measured to the tops of the markers and, while care was taken to straighten each marker before the start of observations, they may not have been truly vertical in all cases. A further ±5.0 cm. has been added to the maximum error to allow for this. The maximum error in determination of horizontal position is thus ±12.5 cm. but in most cases the error is less. It is certainly less for the column of markers nearest the observation stations (Column 1). Movement here was smaller in magnitude and more varied in direction than elsewhere, so that greater accuracy is desirable for this column.
A calculation based on the separate height measurements of each marker from each station gives a figure of ±4.5 cm. for the standard error of the height of each on each day. The maximum error can be taken as ±10.0 cm.
Results
Horizontal movement. Table I lists the weekly horizontal movement of each marker. Results for the last period have been multiplied by 1.4 to make them comparable with the others. Movement never deviated appreciably from the direct down-glacier direction, except for the markers in Column I. These were situated in a region of wide crevasses near the edge of the glacier and their erratic movement probably only reflects peculiarities of the region immediately surrounding each.
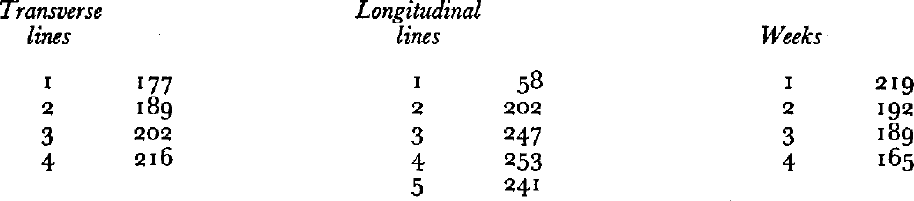
Horizontal Movement (in cm.)

The general trends of movement can be seen from the mean values given in Table II. Slight adjustments have been made to the means for Row 4 and Columns 4 and 5 to allow for the fact that these means are based on fewer markers than the others. The mean velocity in the centre line of the glacier over the four weeks was 35 cm./day.
Mean Horizontal Movement (in cm.)
As regards variation in velocity along a transverse profile, each row shows the same trend. Results for the four rows have been averaged in drawing the velocity profile in Figure 5. It has been assumed that the glacier was not slipping past the side walls. Unfortunately it proved impossible to find a site suitable for making measurements to check this, but such slip has not been observed in a polar glacier. The most conspicuous features of the profile are the very rapid increase in velocity across the marginal zones, and the presence of a central zone, some 400 m. wide, in which the velocity is approximately constant. It is noteworthy that the gradient of velocity in the marginal zone is greater on the north-east side of the glacier than on the south-west side. The reason for this is uncertain but it may be a case of separate ice streams moving with different velocities, as was observed by Battle.Reference Battle 2 The markers in Columns 4 and 5 were separated by a medial moraine.
Horizontal velocities at points on a transverse profile

As regards velocity change along a longitudinal profile, there is an increase from Row 1 to Row 4. Expressed in terms of longitudinal strain rates along the centre line, the mean values for the four week period are approximately zero between markers 13 and 23,0.026/yr. between 23 and 33, and 0.037/yr. between 33 and 43. The standard error of these values is estimated to be ±0.005. The glacier is thus in a state of extending flow in this area, as is also indicated by the presence of transverse crevasses between Rows 2 and 4.
Variation with time. The results show a decrease in velocity as the season advanced. A statistical test was performed on the mean values in Table II to confirm that this represents a genuine effect and not a mere chance fluctuation. The test showed that movement in the first week was significantly greater than in any other, that movement in the last week was significantly less, and that there was no significant difference between the movements in the second and third weeks. Movements of individual markers show the same general trend, although there are discrepancies in certain cases. For example, markers in Row 4 moved farther in the last week than in the others. A similar, but very much more marked, trend was noted by BattleReference Battle 2 on the Frøya Gletscher in north-east Greenland. His observations, also made in August, showed a decrease of velocity from 17 to 1 cm./day over a period of five days. The present data give mean velocities in the centre of the glacier of 45 cm./day in the first week and 28 cm./day in the fourth week. The reason for this decrease in velocity is not clear and deserves further investigation. In a temperate glacier it might be explained by a decrease in the amount of slip on the bed, as a result of a decrease in the amount of melt water. But surface melt water does not penetrate to the bed of a polar type glacier.
Vertical movement. The amount of vertical movement in one week is of the same order as the accuracy of the measurements. Only total movement over the three weeks is therefore considered. (As was mentioned previously, vertical angles were not measured on the last day of observations.) Results are given in Table III, in which the “vertical component” is the measured change in elevation of the top of each marker. The “surface component” is the vertical component of the amount of rise or fall of the ice surface which would take place due to ice motion, if there were no ablation. The “surface component” is obtained by subtracting from the “vertical component” the product of the horizontal movement during the three weeks and the tangent of the angle of slope of the surface. (A slope downhill in the direction of glacier motion is taken as negative.) The surface component could not be calculated for the markers in Column 1, because the irregularity of the glacier surface there made it impossible to measure the slope.
Vertical Movement (in cm.)

The results show that the direction of ice flow is upwards relative to the surface, as is expected in the ablation area. The surface component decreases, though still remaining positive, with distance down the glacier. This means that the direction of flow becomes more nearly parallel to the surface. It also appears that the velocity vector is more steeply inclined to the surface near the edge of the glacier than in the centre. This compensates for the greater loss of ice by ablation near the glacier margins.
These vertical movement results must be treated with reserve because of the difficulties of accurately measuring both the small height changes involved and the surface slope.
Ice thickness. Nye Reference Nye 3 has shown that, subject to certain assumptions, the ice thickness at any point should be proportional to the maximum surface slope there. The constant of proportionality depends on the yield stress and the density. If one applies Nye’s formula in this case with yield stress of 1.0 bar, density 0.90 g./cm.3, and the measured surface slope, one obtains 240 m. as an estimate of the ice thickness at marker 23.
Ablation measurements. Ablation rates were determined by weekly measurements of the height of each marker above the ice surface. Results show the expected trend. The mean ablation decreased from 24 cm. in the first week to 4 cm. in the fourth. During this period the hours of daylight decreased from 24 to about 16. Ablation rates were significantly greater at the margins, where the ice was dirty, than in the centre, and were significantly greater in the lower part of the region than in the upper.
Acknowledgements
I am most grateful to Drs. J. W. Glen, H. Lister and A. L. Washburn for helpful criticism of the draft of this paper, to the Royal Geographical Society for the loan of a theodolite, and to my employers, the Defence Research Board of Canada, for giving me leave to go to Greenland. The Mount Everest Foundation gave a generous grant to the expedition. I should also like to thank various members of the party for assistance in the field.



