


Introduction
General
In Belgium, sediment from the early Oligocene Boom Member of the Rupel Formation has been extracted from quarries for the brick industry since the 19th century. Research into the possibilities of storing radioactive waste in the Boom clay started in Belgium, where from 1980 to 1987 an underground research laboratory was built near the town of Mol, not far from the Dutch border. This facility expanded later and, based on the extensive studies that their southern neighbours had carried out, Dutch interest increased. Dutch radioactive waste is temporarily stored in special above-ground self-cooling sheds near Middelburg in Zeeland but is planned to be permanently stored in a deep underground storage facility. In January 2018, the central Dutch government, Electricity Production Company South Netherlands and the Central Organization for Radioactive Waste presented the results of a seven-year study into the final disposal of waste. The Boom clay is considered to be one of the possibly suitable lithostratigraphic units for such disposal.
One of the recommendations of the Dutch Boom Member study of Vis et al. (Reference Vis, Verweij and Koenen2016) was to apply biostratigraphic age control and up-to-date stratigraphic well interpretation in order to improve understanding of the depositional history of the unit in the Netherlands. It also recommended facilitating the establishment of a cross-border lithostratigraphic framework for the Rupelian. The present study attempts to partly address this recommendation for the southern North Sea Basin.
Stratigraphic insights into the Cenozoic successions of the southern Netherlands (provinces of Brabant and Limburg) and northern Belgium have been further developed in recent years following several H3O projects (Deckers et al., Reference Deckers, Vernes, Dabekaussen, Den Dulk, Doornenbal, Dusar, Matthijs, Menkovic, Reindersma, Walstra, Westerhoff and Witmans2014; Vernes et al., Reference Vernes, Deckers, Bakker, Bogemans, De Ceukelaire, Doornenbal, den Dulk, Dusar, Van Haren, Heyvaert, Kiden, Kruisselbrink, Lanckacker, Menkovic, Meyvis, Munsterman, Reindersma, ten Veen, van de Ven, Walstra and Witmans2018; Vernes et al., Reference Vernes, Deckers, Walstra, Kruisselbrink, Menkovic, Bogemans, De Ceukelaire, Dirix, Dusar, Hummelman, Maes, Meyvis, Munsterman, Reindersma, Rombaut, Van Baelen, Van de Ven, Van Haren and Welkenhuysen2023). These H3O projects are executed by TNO – Geological Survey of the Netherlands, the Flemish Institute for Technical Research (VITO, Belgium) and the Geological Survey of Belgium (RINS, Belgium). The main aim of these projects has been to establish cross-border harmonization of hydrological/geological units through mapping and the construction of hydrogeological models. Since 2022 a new H3O project has been started on the Peel High-Venlo Graben in the southeastern Netherlands, which includes the palynological results of the Mill borehole, partly used in this study.
This study
During the middle to late Rupelian, depositional environments in the southern North Sea Basin evolved from open marine to shallow marine (Fig. 1). The clay-dominated middle Rupelian sediments thereby became more sand-rich towards the late Rupelian. In the southeastern Netherlands (for location see Fig. 2), this facies transition is reflected in the subdivision of the (middle to late) Rupelian Rupel Formation into a Boom Member and a Steensel Member (Fig. 3). The Boom Member comprises mainly clay, but becomes siltier towards the top where it transitions into the superjacent Steensel Member. The latter comprises an alternation of clays and silty clays with thin sand layers, passing towards the top into fine-grained, glauconite-rich sands (Vis et al., Reference Vis, Verweij and Koenen2016; TNO-GDN, 2023). The age of the Steensel Member has not been studied in detail, and the current age estimates are based mainly on correlations with Belgian equivalents. In Belgium, the equivalents of the Boom and Steensel members are the Boom and Eigenbilzen formations (Fig. 3). Biostratigraphic and radiometric analyses of the Boom and Eigenbilzen formations in the Mol-ON and Weelde boreholes in northernmost Belgium (for location see Fig. 2) indicated a middle to late and latest Rupelian age, respectively (Van Simaeys et al., Reference Van Simaeys, Munsterman and Brinkhuis2004; De Man et al., Reference De Man, Van Simaeys, Vandenberghe, Harris and Wampler2010). Towards the south, closer to the palaeo-shoreline, the upper part of the Boom Formation (Putte and Boeretang members) becomes sandier and is therefore considered to form part of the Eigenbilzen Formation (Vandenberghe et al., Reference Vandenberghe, Hager, van den Bosch, Verstraelen, Leroi, Steurbaut, Prüfert and Laga2001; Vandenberghe & Wouters, Reference Vandenberghe and Wouters2023; Fig. 3), which thus thickens at the expense of the upper part of the Boom Formation. This lateral sedimentary facies transition is based only on borehole log correlations, as the Eigenbilzen Formation is not dated in the south where the unit is formally defined. However, the log correlation could be further strengthened by biostratigraphic analyses north and south of the sedimentary facies transition zone.
Palaeogeographic reconstruction of the Oligocene North Sea Basin with indication of the North Sea Basin (after Laenen, Reference Laenen1998, Vandenberghe & Mertens, Reference Vandenberghe and Mertens2013 and Vandenberghe et al., Reference Vandenberghe, Harris, Wampler, Houthuys, Louwye, Adriaens, Vos, Lanckacker, Matthijs, Deckers, Verhaegen, Laga, Westerhoff and Munsterman2014).

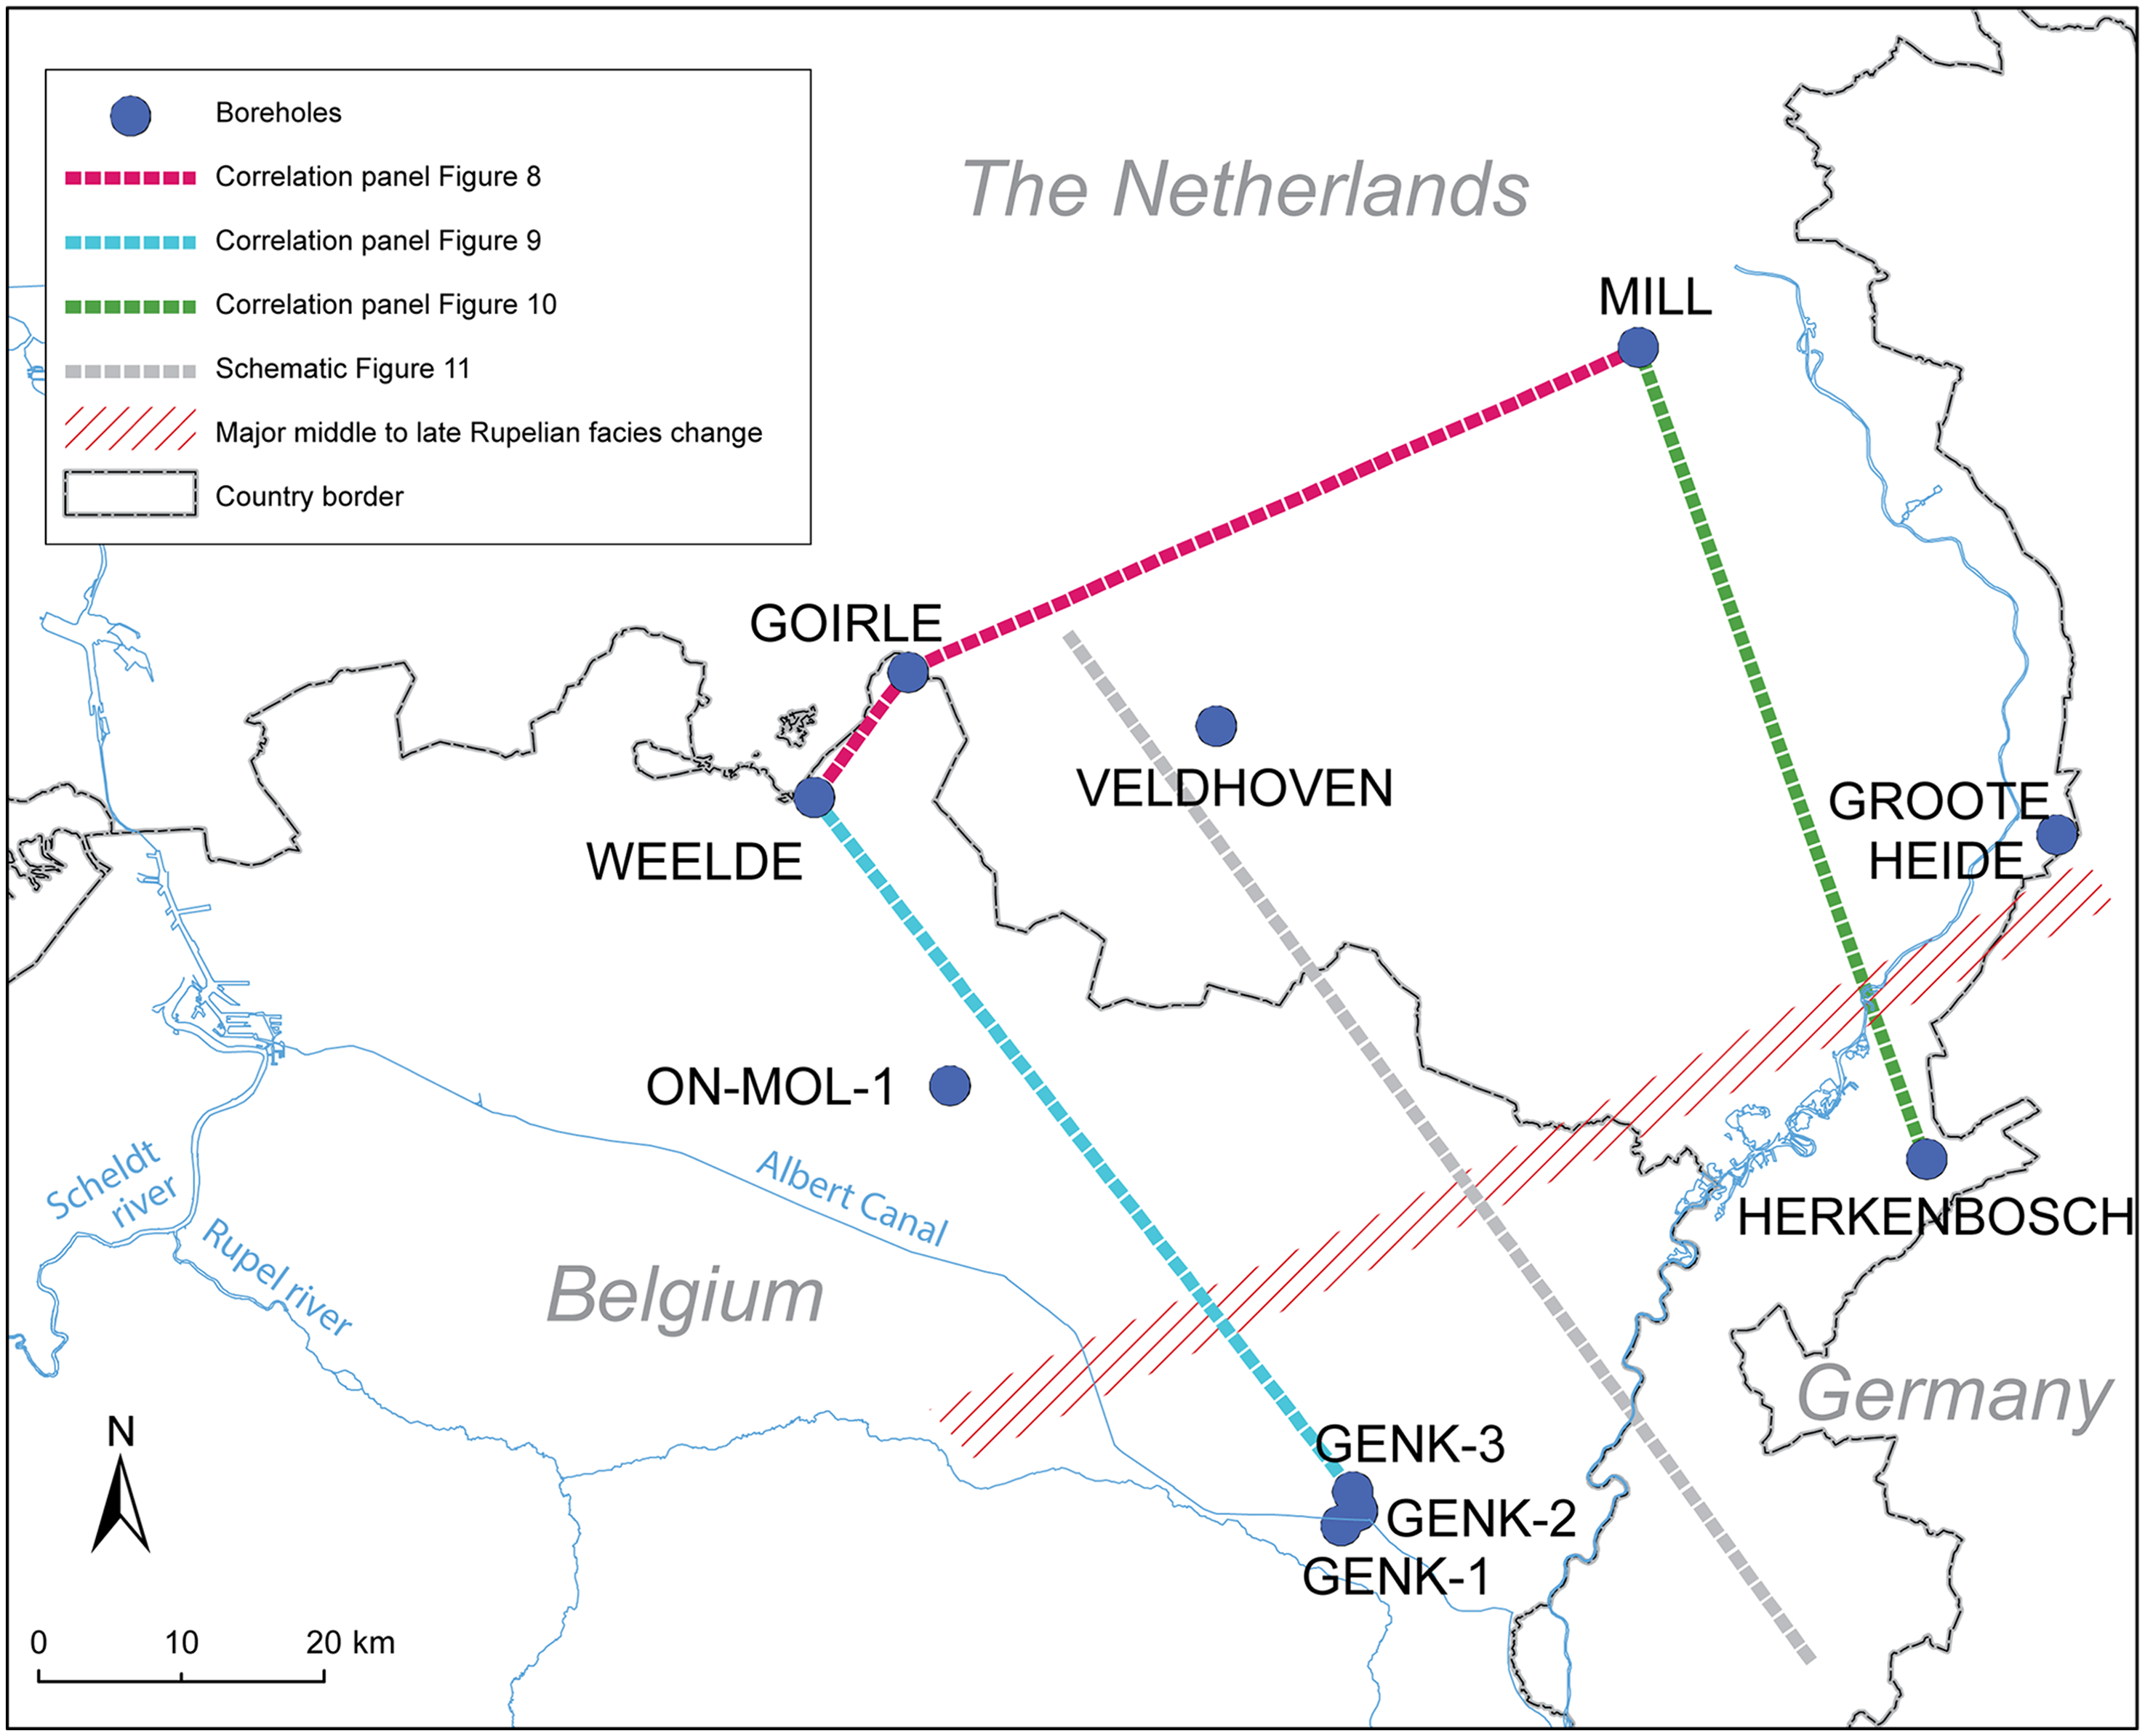
Overview on the study area showing the borehole locations and the correlation panels of Figs. 8, 9 and 10. The estimated location of the middle to late Rupelian facies transition from predominantly clay/silt in the north to sands in the south is indicated by a red zone and is based on an extrapolation from the geological model of northern Belgium (Deckers et al., Reference Deckers, De Koninck, Bos, Broothaers, Dirix, Hambsch, Lagrou, Lanckacker, Matthijs, Rombaut, Van Baelen and Van Haren2019) towards the Netherlands. The facies transition is considered a zone of at least several kilometers width with interfingering facies.
Correlation table between the Dutch and Belgian Rupelian lithostratigraphic units in the northwest (boreholes Mill, Goirle and Weelde) and southeast (boreholes Genk and Herkenbosch) of the study area (Location on Fig. 2).

It is the purpose of this study to establish the biostratigraphic ages of the Steensel Member in the southeastern Netherlands as well as of the Eigenbilzen Formation in northeastern Belgium near its type area. For this purpose, biostratigraphic analyses using dinoflagellate cysts were performed on borehole samples from the southeastern Netherlands and northeastern Belgium, thus providing new insights into cross-border stratigraphic correlations as well as contributing to the middle to latest Rupelian palaeogeography in the southern North Sea Basin.
Middle to late Rupelian stratigraphic background
Dutch lithostratigraphy
The Rupel Formation was deposited throughout the Netherlands and contains subunits that are formally described and defined by TNO-GDN (2023). It consists of a main central, clayey/silty body, comprising the Boom Member and sandier units belonging to the Berg and Steensel members at the base and top, respectively (Fig. 3). The Berg Member consists of greenish grey, fine-grained sand, occasionally with a gravel bed at its base. It is interpreted to represent the transgressive base of the Rupel Formation. The Berg Member was defined by NAM & RGD (1980). However, Van Adrichem Boogaert & Kouwe (Reference Van Adrichem Boogaert and Kouwe1993-1997) introduced the Vessem Member to accommodate the predominantly sandy sediments in the lower part of the Rupel Formation, including the transgressive Berg unit and several coarsening upwards units that developed locally below the main transgressive surface. On 8 June 2020, the revised Stratigraphic Nomenclature of the Netherlands is published online as the up-to-date source for stratigraphic information from the Dutch subsurface (https://www.dinoloket.nl/stratigrafische-nomenclator). Here the Berg Member is reinstated. Furthermore, the Belgian Nomenclator is partly followed for the underlying successions, including the Ruisbroek, Watervliet and Bassevelde members (comprising the Dutch Tongeren Formation).
The Boom Member (BM) can be subdivided into three subunits, which are easiest to identify using a combination of gamma-ray and grain-size data (Vis et al., Reference Vis, Verweij and Koenen2016). The lower subunit shows a fining-upward trend of silty clays (BM-L; 32–31.6 Ma), the middle subunit is the finest grained (BM-M; 31.6 and 29.2 Ma), comprising clays, and the upper unit shows a coarsening-upward trend (BM-U; 29.2 and 28.6 Ma), becoming siltier towards the top where it transitions into the Steensel Member. The Steensel Member consists of an alternation of clays and silty clays with thin sand beds, grading upwards into fine-grained sands with a high glauconite content. Except for in the SE-Netherlands, the Steensel Member is absent. The holostratotype of the Rupel Formation and its Berg, Boom and Steensel members is the Veldhoven-01 well in the southeastern Netherlands (for location see Fig. 2). This well has spontaneous potential and resistivity logs, but unfortunately has no gamma-ray log. The Rupelian succession of this well was not biostratigraphically analysed.
Locally in middle South-Limburg, the lower part of the Boom Member passes laterally into the sandy (marine) Waterval and clayey (lagoonal) Kleine-Spouwen members. No type section has formally been ascribed to the latter members and definition of both lithostratigraphic units refers to their Belgian counterparts. The Boom Member in the north and Kleine-Spouwen Member in the south conformably overly the Berg Member. In the southern Netherlands, the Rupel Formation is generally overlain by fine glauconitic sands and clays of the Chattian to Burdigalian Veldhoven Formation.
Belgian lithostratigraphy
The Belgian Boom and Eigenbilzen formations and their respective subunits are described and defined by Vandenberghe & Wouters (Reference Vandenberghe and Wouters2023). The Boom Formation consists of grey silty clay or clayey silt. The siltiest horizons contain glauconite pellets. Macroscopic fossil content is limited. The formation was deposited in an open shelf sea at an approximate depth of about 100 m for the most clay-enriched parts, although the water depth fluctuated by several tens of metres due to eustatic variations during sedimentation. The type area is situated along the Rupel River between Rumst and Boom (Rupel Cuesta) and along the Scheldt river between Temse and Antwerpen, where the unit was and still is exploited for its clay products (Fig. 2 for location). The Boom Formation is subdivided into four members, from base to top the Belsele-Waas, Terhagen, Putte and Boeretang members (Fig. 3). Using geophysical logs and cored boreholes, the internal subdivisions in the Boom Formation at layer scale and at member level can be readily correlated within Belgium and into the neighbouring parts of the Netherlands and Germany (Vandenberghe et al., Reference Vandenberghe, Hager, van den Bosch, Verstraelen, Leroi, Steurbaut, Prüfert and Laga2001; Vandenberghe et al., Reference Vandenberghe, De Craen and Wouters2014). Biostratigraphic and radiometric analyses on samples of the Boom Formation at the Mol-ON and Weelde boreholes by Van Simaeys et al. (Reference Van Simaeys, Munsterman and Brinkhuis2004) and De Man et al., (Reference De Man, Van Simaeys, Vandenberghe, Harris and Wampler2010; for location of boreholes see Fig. 2) indicated a middle to late Rupelian age (dinocyst biozones NSO3-5a).
To the southeast the superjacent Eigenbilzen Formation consists of grey to grey-green clayey fine sand and silt containing some glauconite pellets, especially towards the top. It contains bioturbations but no macroscopic fossils. No permanent outcrops occur of the Eigenbilzen Formation, and it is seldom exposed. The Eigenbilzen Formation has been, however, well studied in boreholes in the subsurface of the area covered by map sheet 25 around Hasselt, Belgium (Matthijs, Reference Matthijs1999), where a consistent threefold subdivision could be demonstrated and characterized by typical resistivity and gamma-ray signatures. These subdivisions, labelled A, B and C, have also been identified in borehole logs from outside the Hasselt map sheet area (Vandenberghe et al., Reference Vandenberghe, Hager, van den Bosch, Verstraelen, Leroi, Steurbaut, Prüfert and Laga2001). In the type area of the Eigenbilzen Formation, its age has thus far not been established.
North of the Eigenbilzen Formation type area and in the contiguous offshore areas of the North Sea Basin, units A and B grade laterally into clay and silt that is included in the Putte Member of the Boom Formation and unit C into the silty Boeretang Member (Vandenberghe & Wouters, Reference Vandenberghe and Wouters2023). Only the top section of unit D continues to be distinctly present in northernmost Belgium (Fig. 3). In the Mol-ON and Weelde boreholes in the latter area, biostratigraphic and radiometric analyses on samples of the Eigenbilzen Formation by Van Simaeys et al. (Reference Van Simaeys, Munsterman and Brinkhuis2004) and De Man et al. (Reference De Man, Van Simaeys, Vandenberghe, Harris and Wampler2010) indicated a latest Rupelian age (dinocyst biozone NSO5a).
Material and methods
Biostratigraphic analyses
Biostratigraphic analyses were performed during this study on samples of the Herkenbosch and Mill boreholes in the Netherlands and on two boreholes in the Genk area of Belgium. In the section below, these boreholes and the samples are discussed in more detail. For the preparation of the samples, standard palynological techniques, including HCL and HF digestion, 15 µm sieving and no oxidation, were applied. The slides were mounted in glycerine jelly. Dinocyst taxonomy is according to that cited in Fensome et al. (Reference Fensome, Williams and MacRae2019). Dinocyst morphology follows the plates provided in Heilmann-Clausen and Van Simaeys (Reference Heilmann-Clausen and Van Simaeys2005), Sliwinska (Reference Sliwinska2019), Stover and Hardenbol (Reference Stover and Hardenbol1994), and Van Simaeys et al., (Reference Van Simaeys, Munsterman and Brinkhuis2004). One microscope slide per sample was counted until at least 200 palynomorphs (spores, pollen and dinoflagellate cysts) were identified. The remaining parts of the slides were scanned for rare taxa. Miscellaneous fossils (like Pediastrum and Botryococcus) were also counted, but were kept outside the total sum of 200 specimens. Palynological interpretation is based on key references concerning the palynostratigraphy of the late Palaeogene to early Neogene from the North Sea region such as: Bujak & Mudge (Reference Bujak and Mudge1994), Dybkjær & Piasecki (Reference Dybkjær and Piasecki2010), Köthe (Reference Köthe2003), Louwye (Reference Louwye2005), Louwye et al. (Reference Louwye, Deckers, Verhaegen, Adriaens and Vandenberghe2020), Munsterman & Brinkhuis (Reference Munsterman and Brinkhuis2004), Munsterman et al. (Reference Munsterman, ten Veen, Menkovic, Deckers, Witmans, Verhaegen, Kerstholt-Boegehold, van de Ven and Busschers2019), Powell (Reference Powell1992) and Van Simaeys et al. (Reference Van Simaeys, Munsterman and Brinkhuis2004). The Oligocene dinoflagellate cyst (dinocyst) zonation is based on Van Simaeys et al. (Reference Van Simaeys, Munsterman and Brinkhuis2004) and for the Miocene the zonation of Munsterman & Brinkhuis (Reference Munsterman and Brinkhuis2004) is used, recalibrated to the Geological Time Scale of Ogg et al. (Reference Ogg, Ogg and Gradstein2016) in Munsterman et al. (Reference Munsterman, ten Veen, Menkovic, Deckers, Witmans, Verhaegen, Kerstholt-Boegehold, van de Ven and Busschers2019).
-
Herkenbosch borehole (NL)
Borehole Herkenbosch (code: B58G0192) is located in the southeasternmost Netherlands (for location see Fig. 2). According to the map shown in TNO-GDN (2023), it is located within the geographic distribution of the Steensel Member. Gamma-ray and resistivity logs allow for the interpretation of the Rupelian Berg, Boom and Steensel members of the Rupel Formation and of the superjacent Veldhoven Formation (Fig. 4). Munsterman (Reference Munsterman1998) performed dinoflagellate cyst analyses on samples from the upper Oligocene to middle Miocene succession. The results of his biostratigraphic analyses of the Miocene from this borehole are shown and discussed in Munsterman and Deckers (Reference Munsterman and Deckers2022). The results of the biostratigraphic analyses of the lower Oligocene samples of this borehole are presented here in an updated version of dinoflagellate cyst zonation based on Munsterman et al. (Reference Munsterman, ten Veen, Menkovic, Deckers, Witmans, Verhaegen, Kerstholt-Boegehold, van de Ven and Busschers2019).
-
Mill borehole (NL)
The log-signature, sample depths, litho- and biostratigraphy of the Herkenbosch borehole. For location, see Fig. 2.

The Mill borehole (code: B46C0478) is located in the southeastern Netherlands also (for location see Fig. 1). It is located just north of the geographic extent of the Steensel Member according to the map shown in TNO-GDN (2023). The Mill borehole has gamma-ray and resistivity logs and these allow for the interpretation of the Rupel Formation and its members (Fig. 5). The Rupelian and superjacent strata of this borehole were recently biostratigraphically analysed by Munsterman (Reference Munsterman2022). Samples were taken every 20 m for the Rupelian and every 10 m for the superjacent Chattian and Miocene.
-
Genk-1 and Genk-2 boreholes (B)
The log-signature, sample depths, litho- and biostratigraphy of the Mill borehole. For location, see Fig. 2.

The Genk area is located in northeastern Belgium (for location see Fig. 2). It lies 10 km to the northwest of the type area of the Eigenbilzen Formation. Since it is hardly described in outcrops, the Eigenbilzen Formation is best known from boreholes, from which the greatest detail was extracted by Matthijs (Reference Matthijs1999) and Vandenberghe et al. (Reference Vandenberghe, Hager, van den Bosch, Verstraelen, Leroi, Steurbaut, Prüfert and Laga2001). Unfortunately, most boreholes with logs have insufficient sample quality for biostratigraphic analyses. In the southern Genk area, however, there is a logged borehole (GSB 078w0371; DOV kb26d78w-B397), in which the upper part of the Boom Formation and the Eigenbilzen Formation were cored. We will refer to this borehole as Genk-1. Based on logs, the subdivisions of the Boom and Eigenbilzen formations could be established (Fig. 6). Cores of this borehole covering the upper part of the Boom Formation and the lower five metres of the Eigenbilzen Formation are preserved in the archive of the Geological Survey of Belgium. For the purpose of this study, five samples were examined, three in the Boom Formation and two in the Eigenbilzen Formation.
The log-signature, sample depths, litho- and biostratigraphy of the Genk-1 borehole. For location, see Fig. 2.

Close to this relatively deep cored borehole plenty of other, shallower boreholes were drilled in the 1920s and 1930s in connection with the digging of the Albert Canal. Many are shown in the profile along the Albert Canal of Halet (Reference Halet1936), and samples of these boreholes are still preserved at the archive of the Geological Survey of Belgium. From one of these boreholes, S195 in Halet (Reference Halet1936; GSB 078w0275; DOV kb26d78w-B285), which is located near the Sledderlo Lock (for location see Fig. 2), two samples were taken from the Eigenbilzen Formation (Fig. 7). For this study, we will refer to this borehole as Genk-2.
The sample depths, litho- and biostratigraphy of the Genk-2 borehole For location, see Fig. 2.

The two Genk boreholes are located 1.4 km from each other in the southern Genk municipality. Based on regional geological models, the Eigenbilzen Formation is about 25–30 m thick in this area (Deckers et al., Reference Deckers, De Koninck, Bos, Broothaers, Dirix, Hambsch, Lagrou, Lanckacker, Matthijs, Rombaut, Van Baelen and Van Haren2019). The samples of this study cover the lowermost 5 m (two samples of Genk-1) and uppermost 6 m (two samples of Genk-2) of the formation in this area.
Well-log correlations
Together with other important boreholes the abovementioned boreholes were correlated with each other using gamma-ray and resistivity logs. They are shown in panels Figs. 8, 9 and 10. New and existing biostratigraphic age information made available for these boreholes is also shown in the panels. From north to south, the boreholes are:
-
The northernmost borehole Mill is discussed in the previous section.
-
Southwest of the Mill borehole, but still in the southern Netherlands, the Goirle borehole is located (for location see Fig. 2). Gamma-ray and resistivity logs allowed correlation with other Dutch boreholes further to the east, see Munsterman et al., (Reference Munsterman, ten Veen, Menkovic, Deckers, Witmans, Verhaegen, Kerstholt-Boegehold, van de Ven and Busschers2019; Fig. 8). The latter authors biostratigraphically analysed samples from the Goirle borehole using dinoflagellate cysts. Although they did not mention the Dutch Steensel Member of the Rupel Formation, they did indicate the presumed stratigraphic position of the Belgian Eigenbilzen Formation based on correlations with the Weelde borehole.
-
One of the key boreholes for analyses of the Boom and Eigenbilzen formations in northern Belgium has been the Weelde borehole (for location see Fig. 2). This borehole is cored and has logs throughout the interval. It was interpreted and correlated with other boreholes in the region by Vandenberghe et al. (Reference Vandenberghe, Hager, van den Bosch, Verstraelen, Leroi, Steurbaut, Prüfert and Laga2001). Van Simaeys et al. (Reference Van Simaeys, Munsterman and Brinkhuis2004) and Munsterman & Deckers (Reference Munsterman and Deckers2020) performed dinocyst analyses on samples. On the correlation panel of Fig. 8, we show the dinocyst biozones and lithostratigraphy that Van Simaeys et al. (Reference Van Simaeys, Munsterman and Brinkhuis2004) and Vandenberghe and Wouters (Reference Vandenberghe and Wouters2023), respectively, established for this borehole.
-
The cored Genk-1 borehole in the southern Genk municipality (GSB 078w0371; DOV kb26d78w-B397; for location see Fig. 2) was biostratigraphically analysed in this study. It has gamma-ray and resistivity log data for the uppermost Boom Formation and lowermost Eigenbilzen Formation, but higher in the Eigenbilzen Formation the resistivity log ends, while the gamma-ray logging was performed through the casing and is therefore less suitable for correlations. Since the log pattern of this borehole is insufficient for representation of the entire Boom and Eigenbilzen formations, borehole Genk-1 was correlated with a borehole further north (in the Genk municipality GSB 078w0362; DOV kb26d78w-B386) that does have complete logs for the Boom and Eigenbilzen formations (Fig. 9). For this study, we refer to this latter borehole as Genk-3. The correlation between boreholes Genk-1 and Genk-3 is shown in Fig. 9. Since it covers the entire Boom and Eigenbilzen formations, Genk-3 allows for better correlations with the other boreholes (Fig. 9). Based on its log signature, the Berg, Kleine-Spouwen and Kerniel members of the Bilzen Formation were identified below the Boom Formation. To illustrate the facies changes within the Rupelian, the Genk boreholes were correlated with borehole Weelde (Fig. 9).
-
The southeasternmost datapoint is borehole Herkenbosch. As this borehole is located closer to the palaeo shoreline than most other Dutch boreholes, the Rupelian units are sandier. Indeed, grain-size analyses of the Rupelian in this borehole are much coarser than in boreholes Mill and Goirle, as illustrated by Vis et al. (Reference Vis, Verweij and Koenen2016). The coarse intervals are situated in the lower and upper parts of the Rupel Formation. In the lower part, they correspond to the sandy Waterval and Berg members, separated by the clayey Kleine-Spouwen Member, while in the upper part they correspond to the sandy Steensel Member. To illustrate the facies changes within the Rupelian, we created the correlation panel from boreholes Mill to Herkenbosch (Fig. 10), which includes the granulometric analyses by Vis et al. (Reference Vis, Verweij and Koenen2016).
Correlation panel between the palynologically analyzed boreholes Mill, Goirle and Weelde covering the Rupel Formation (NL) and Boom and Eigenbilzen formations (BE) as well as their members. For this study, the panel was horizontally aligned (flattened) at the base of the Steensel Member or Eigenbilzen Formation. Borehole Mill was biostratigraphically analyzed based on dinocyst species by this study, see Fig. 5. The biostratigraphic interpretations of the Goirle borehole have been modified after Munsterman et al. (Reference Munsterman, ten Veen, Menkovic, Deckers, Witmans, Verhaegen, Kerstholt-Boegehold, van de Ven and Busschers2019), while those of the Boom and Eigenbilzen formations of the Weelde borehole are based on Van Simaeys et al. (Reference Van Simaeys, Munsterman and Brinkhuis2004). The lithostratigraphic interpretation of the latter is based on Vandenberghe & Wouters (2023). For the upper part of the Veldhoven Formation and the Berchem Formation in the Weelde borehole, the litho- and biostratigraphic interpretations are indicated by an * as they are taken from Munsterman and Deckers (2020). For location of this panel, see Fig. 2. GR = Gamma-ray log; LN = Long normal resistivity log; SN = Short normal resistivity log.

Correlation panel between Belgian boreholes Weelde, Genk-1, -2 and -3. For this study, the panel was horizontally aligned (flattened) at the stratigraphic level of the base of the Putte Member of the Boom Formation. Boreholes Genk-1 and -2 were biostratigraphically analysed based on dinocyst species by this study, see Figs. 6 and 7. Borehole Genk-3 was used for correlations with other boreholes in this figure. Borehole Genk-2 has no log data, but the contact between the Bolderberg and Eigenbilzen formations within this borehole was put at the same level as that in borehole Genk-3. For data on borehole Weelde, see caption of Fig. 8. For location of this panel, see Fig. 2. GR = Gamma-ray log; LN = Long normal resistivity log; SN = Short normal resistivity log.

Correlation panel between boreholes Mill and Herkenbosch. For this study, the panel was horizontally aligned (flattened) at the stratigraphic level of the top of the Rupel Formation. Boreholes Mill and Herkenbosch were biostratigraphically analyzed based on dinocyst species by this study, see Figs. 3 and 4. For location of this panel, see Fig. 2. GR = Gamma-ray log; SN = Short normal resistivity log.

Biostratigraphic age assessments
Age assessments of the Herkenbosch borehole (Fig. 4)
Samples from this borehole relevant for this study were taken from the Rupel and Veldhoven formations. The palynological associations are generally rich in palynomorphs (marine dinoflagellate cysts, spores and pollen). In the majority of the microfloral slides, marine dinocysts are the most common category, occasionally being dominated by a single genus. For example, at sample interval 175–190 m, Dapsilidinium (>40 % of the total dinocyst sum) occur in abundant numbers indicating an increasingly restricted marine influence, compared to underlying marine conditions. At sample interval 187–190 m, the share of continental palynomorphs (spores and pollen) is higher than the marine part, including the dinocysts. Reworking is absent or rarely present.
An overview of the palynological interpretation of Herkenbosch borehole (B58G0192) is shown in Table 1.
Overview age assessment of Herkenbosch borehole (B58G0192)

The dating is based on:
*1 Last occurrence data (LOD’s) of Areoligera semicirculata at 121.75 m, Deflandrea phosphoritica at 141.75 m and Wetzeliella symmetrica (Van Simaeys et al, Reference Van Simaeys, Munsterman and Brinkhuis2004) at 141.75 m.
*2 Last occurrence datum (LOD) of Rhombodinium draco (Van Simaeys et al, Reference Van Simaeys, Munsterman and Brinkhuis2004) at 148.75 m.
*3 LOD’s of Achilleodinium biformoides and Enneadocysta pectiniformis (Stover & Hardenbol, Reference Stover and Hardenbol1994; Van Simaeys et al, Reference Van Simaeys, Munsterman and Brinkhuis2004) both at 181.25 m.
*4 First occurrence datum (FOD) of Chiropteridium spp. at 248.25 m. Chiropteridium galea (Van Simaeys et al., Reference Van Simaeys, Munsterman and Brinkhuis2004) has an FOD at 220.75 m.
*5 FOD of Wetzeliella gochtii (Van Simaeys et al., Reference Van Simaeys, Munsterman and Brinkhuis2004) at 260.25 m. Because the genus Chiropteridium is missing, the age interval is slightly broadened.
Age assessments of the Mill borehole (Fig. 5)
Samples from this borehole relevant to this study were taken from the Tongeren, Rupel and Veldhoven formations. Generally, marine dinocysts dominate the microflora. Most numerous among the sporomorphs are bisaccate pollen (gymnosperms: all seed plants except angiosperms). Non-bisaccate sporomorphs occur rarely. Bisaccate pollen has a high buoyancy in both air and water and can be transported over large distances from their source (often somewhat higher and drier grounds). Reworking is absent or is only limited.
An overview of the palynological interpretation of Mill borehole (B46C0478) is shown in Table 2.
Overview age assessment of Mill borehole (B46C0478)

The dating is based on:
*1 LOD’s of Areoligera semicirculata, Wetzeliella symmetrica, Glaphyrocysta cf. semicirculata and Deflandrea phosphoritica at 140–141 m and the LODs of Deflandrea heterophlycta and Wetzeliella gochtii at 150–151 m.
*2 LOD of Gerdiocysta conopeum at 160–161 m and the LODs of Achilleodinium biformoides and Membranophoridium intermedium (Stover and Hardenbol, Reference Stover and Hardenbol1994) at 180–181 m.
*3 Acme of the genus Homotryblium. Van Simaeys et al. (Reference Van Simaeys, Munsterman and Brinkhuis2004) record an acme of the genus Homotryblium around the NSO5a/NSO4b boundary. The genus is represented by more than 70% of the total sum of dinoflagellate cysts.
*4 LOD of Enneadocysta pectiniformis.
*5 LOD’s of Phthanoperidinium filigranum and Phthanoperidinium comatum (Van Simaeys et al, Reference Van Simaeys, Munsterman and Brinkhuis2004) at 259–260 m and furthermore the FOD of Chiropteridium galea at 280–281 m.
*6 Superposition and the FOD of Wetzeliela gochtii at 313–314 m.
*7 LOD of Eatonicysta ursulae (Bujak & Mudge, Reference Bujak and Mudge1994) at 332–333 m. Additional chronostratigraphic important dinocysts are: Cerodinium depressum, Diphyes pseudoficusoides, Melitasphaeridium pseudorecurvatum, Rottnestia borussica and Wetzeliella articulata (Bujak & Mudge, Reference Bujak and Mudge1994).
Age assessments of the Genk-1 borehole (Fig. 6)
-
Genk-1
The five samples taken from this borehole were from the upper part of the Boom Formation (three samples) and the basal part of the Eigenbilzen Formation (two samples). An overview of the palynological interpretation of borehole Genk-1 (078W0371) is shown in Table 3.
Overview age assessment of Genk-1 borehole (078W0371)

The dating is based on:
*1 LOD’s of Phthanoperidinium filigranum and Phthanoperidinium comatum at 38.25 m and the FOD of Chiropteridium galea at 52.25 m.
Age assessments of the Genk-2 borehole (Fig. 7)
The two samples taken from this borehole are from the uppermost part of the Eigenbilzen Formation. An overview of the palynological interpretation of borehole Genk-2 (078W0275) is shown in Table 4
Overview age assessment of Genk-2 borehole (078W0275)

The dating is based on:
*1 LOD of Achilleodinium biformoides and the FOD’s of Distatodinium biffii and Saturnodinium pansum (Van Simaeys et al., Reference Van Simaeys, Munsterman and Brinkhuis2004). The presence of Membranophoridium connectum and Membranophoridium intermedium fits with the dating (Stover and Hardenbol, Reference Stover and Hardenbol1994).
*2 A similar assemblage is noted in sample 20–20.30 m, but without Distatodinium biffii, enabling a slightly larger chronostratigraphic range of biozones NSO4b–NSO5a. Enneadocysta pectiniformis (LOD in NSO4a) is absent.
Correlations and discussion
Based mainly on gamma-ray and resistivity logs, a correlation of the Rupel Formation was carried out for the Goirle and Mill boreholes in the southeastern Netherlands. Based on the resistivity logs only, the Boom and Steensel members could also be identified (Fig. 8): The first shows overall low resistivity values, while the latter shows upwards increasing resistivity values, corresponding to an increase in grain size. Palynological analyses of the Goirle and Mill boreholes show that the interpreted Boom Member holds the NSO3 to NSO5a biozones and that the Steensel Member holds the NSO5a dinocyst biozone (Fig. 8). This is the most detailed age estimate yet for the Steensel Member near its stratotype section at the Veldhoven borehole (for location see Fig. 2).
The biostratigraphic ages and log signatures of the Rupel Formation and its members in the Dutch boreholes perfectly match those of the correlative Belgian Boom and Eigenbilzen formations in the Belgian Weelde borehole as established by Van Simaeys et al., (Reference Van Simaeys, Munsterman and Brinkhuis2004; Fig. 8). The Dutch Boom Member correlates with the Belgian Boom Formation and the Dutch Steensel Member correlates with the Belgian Eigenbilzen Formation, confirming previous correlations made during cross-border geological mapping in the region (c.f. Deckers et al., Reference Deckers, Vernes, Dabekaussen, Den Dulk, Doornenbal, Dusar, Matthijs, Menkovic, Reindersma, Walstra, Westerhoff and Witmans2014; Vernes et al., Reference Vernes, Deckers, Bakker, Bogemans, De Ceukelaire, Doornenbal, den Dulk, Dusar, Van Haren, Heyvaert, Kiden, Kruisselbrink, Lanckacker, Menkovic, Meyvis, Munsterman, Reindersma, ten Veen, van de Ven, Walstra and Witmans2018). In Belgium, the Boom Formation is further subdivided into the Belsele-Waas, Terhagen, Putte and Boeretang members. The characteristic log signatures of these members in the Weelde borehole as established by Vandenberghe et al. (Reference Vandenberghe, Hager, van den Bosch, Verstraelen, Leroi, Steurbaut, Prüfert and Laga2001) could also be identified in the Dutch Goirle and Mill boreholes, where they furthermore belong to similar biozones (Fig. 8).
In the relatively northern areas of the Mill, Goirle and Weelde boreholes, the Boom and Steensel members and their Belgian equivalents are >100 m and 20–30 m thick, respectively. Our log correlations of Figs. 9 and 10 show the reversal of these thickness ratios in a southerly direction in the Genk area and the Herkenbosch boreholes: the Boom Member (NL)/Formation (B) is only about 25 m thick, while the Steensel Member (NL)/Eigenbilzen Formation (B) is about 65 m thick. Based on log correlations, Vandenberghe et al. (Reference Vandenberghe, Hager, van den Bosch, Verstraelen, Leroi, Steurbaut, Prüfert and Laga2001) and Vandenberghe & Wouters (Reference Vandenberghe and Wouters2023) state that this change in thickness trend is caused by a lateral facies change, as the Putte and Boeretang Members of the Boom Formation become sandier, they become incorporated in the Eigenbilzen Formation in the south. The biostratigraphic analyses carried out in this study confirm this hypothesis as they show that the lower part of the Eigenbilzen Formation is situated in the NSO3 biozone in the Genk-1 borehole in the south, whereas the same biozone is assigned to the Putte and Boeretang members of the Boom Formation in borehole Weelde further to the north (Fig. 9). Also, in the Netherlands, the Steensel Member lies in biozone NSO3 in borehole Herkenbosch in the southeast, although it is still part of the Boom Member in borehole Mill further to the north (Fig. 10). These new insights are compiled in the chronostratigraphic chart of Fig. 11.
Chrono, -bio and lithostratigraphic chart of the Rupelian – Chattian across the southeastern Netherlands and northeastern Belgium. From left to right, the depositional environment becomes progressively more proximal to the coastline. The boreholes mentioned in the top row are indicated on Fig. 2. The facies transition from the Boeretang and Putte members into the Eigenbilzen Formation is indicated by a red line, corresponding to the red zone on Fig. 2. The range chart of the dinocysts and calcareous nannoplankton are taken from Van Simaeys et al. (Reference Van Simaeys, Munsterman and Brinkhuis2004).

The lower part of the Eigenbilzen Formation or unit A of Vandenberghe et al. (Reference Vandenberghe, Hager, van den Bosch, Verstraelen, Leroi, Steurbaut, Prüfert and Laga2001), which lies in the NSO3 biozone in the Genk-1 borehole, is still very clayey as shown by the relatively low resistivity and high gamma-ray values (Fig. 9). The overlying parts of the Eigenbilzen Formation or units or B to D in Vandenberghe et al. (Reference Vandenberghe, Hager, van den Bosch, Verstraelen, Leroi, Steurbaut, Prüfert and Laga2001) are much sandier as indicated by higher resistivity and lower gamma-ray values. Indeed, the analyses of borehole Herkenbosch show a very strong upwards increase in grain size within the Steensel Member (d50 from 20 up to >100 µm; Fig. 10). Consequently, in the south, the Steensel Member becomes much more difficult to distinguish from the superjacent Veldhoven Formation, Voort Member.
The facies transition from predominantly clayey/silty facies in the north (thick Boom Member (NL)/Formation (B)) to predominantly sandy in the south (thick Steensel Member (NL)/Eigenbilzen Formation (B)) was modelled for the subsurface of the Roer Valley Graben by Deckers et al. (Reference Deckers, Vernes, Dabekaussen, Den Dulk, Doornenbal, Dusar, Matthijs, Menkovic, Reindersma, Walstra, Westerhoff and Witmans2014) and in Flanders by Deckers et al. (Reference Deckers, De Koninck, Bos, Broothaers, Dirix, Hambsch, Lagrou, Lanckacker, Matthijs, Rombaut, Van Baelen and Van Haren2019). Deckers et al. (Reference Deckers, Vernes, Dabekaussen, Den Dulk, Doornenbal, Dusar, Matthijs, Menkovic, Reindersma, Walstra, Westerhoff and Witmans2014) could only use the limited set of boreholes that were available in the Roer Valley Graben and modelled the facies transition therein as gradual or taking place across a large distance. Based on the larger set of borehole logs that are available in the neighbouring Campine Block, Deckers et al. (Reference Deckers, De Koninck, Bos, Broothaers, Dirix, Hambsch, Lagrou, Lanckacker, Matthijs, Rombaut, Van Baelen and Van Haren2019) modelled the facies transition to be much sharper, along a roughly WSW-ENE trending zone (see red zone on Fig. 2). Although it is represented as a zone for modelling purposes, in reality it represents a zone several kilometres wide of interfingering sedimentary facies. This zone runs probably sub-parallel to the contemporaneous shoreline further to the southeast. South of this WSW-ENE zone, most of the sand fraction was captured, whereas to the north of this zone, mainly the silt and clay fraction remain. If we extend this WSW-ENE zone from Flanders in the west towards the Netherlands in the east, the Herkenbosch borehole can be seen to lie to its south (sandy facies), while the nearby Groote Heide borehole lies just to its north (clayey/silty facies; red zone on Fig. 2). The middle and upper Rupelian section of the Groote Heide borehole is indeed entirely described as clay, strongly contrasting with the (restricted-) marine sand in the Herkenbosch borehole (see also section 4.1). The results of this study area are therefore in agreement with the facies transitional trend as established by Deckers et al. (Reference Deckers, De Koninck, Bos, Broothaers, Dirix, Hambsch, Lagrou, Lanckacker, Matthijs, Rombaut, Van Baelen and Van Haren2019) in Belgium, and they extend it further towards the east into the Netherlands.
Conclusions
For this study, several boreholes in the Netherlands and Belgium, most of which have log data, were subjected to palynological analyses for the Rupelian interval. The log data were used to identify and correlate the different Dutch and Belgian lithostratigraphic units within the interval. Our log correlations indicate that the clayey Boom Member is much thicker than the superjacent sandy Steensel Member (100 vs 20 m) in the Mill and Goirle boreholes in the southern Netherlands. Our palynological analyses of the same boreholes indicate that the Boom and Steensel members belong to the middle to late Rupelian (biozones NSO3-NSO5a) and late Rupelian (biozone NSO5a), respectively. The results correlate well with the Belgian lateral equivalent stratigraphic units of the Boom and Eigenbilzen formations, respectively, as established by previous work in the borehole Weelde in northernmost Belgium.
Previous log correlation studies have shown that the Boom Formation becomes sandier towards the southeast, whereby its upper part transitions into the Eigenbilzen Formation. This study includes the first palynological evidence to support the hypothesis that the sandy Eigenbilzen Formation (B) and Steensel Member (NL) become older towards the southeast. In this paper, the age of the Eigenbilzen Formationis interpreted as middle Rupelian (NSO3-NSO4 biozones) in a cored borehole in Genk, about 10 km northwest of its formal type area. Further east in the Dutch Herkenbosch borehole, similar ages were assessed in the Dutch equivalent Boom Member (biozone NSO3) and Steensel Member (biozones NSO3-NSO5a). The results of this study fit with regional subsurface models that show that the facies transition from predominantly clayey Rupelian in the north to sandy Rupelian in the southeast occurs along a WSW-ENE oriented zone, which probably ran parallel to the palaeo-shoreline.
Acknowledgements
Special thanks goes to Nico Janssen (TNO) and Malcolm Jones (ex-PLS – UK) for the palynological sample preparation. Marleen De Ceukelaire (GSB, Brussels) is acknowledged for her help making the Genk borehole samples available for study. Katleen van Baelen (VITO) is very gratefully recognized for her excellent work on the figures. Harry Doust (VU-A’dam) is highly appreciated for improving (the English in) the final manuscript. Furthermore the authors also want to express their gratitude to Stuart Archer (University of Glasgow) and Stefaan van Simaeys (ExxonMobil, Houston) for their constructive review, improving the manuscript. Rick Donselaar (Delft University of Technology) is acknowledged for his assistance as an associate editor of the Netherlands Journal of Geosciences.


 Open access