


Introduction
A common study design in prehospital and disaster medicine involves comparing the proportion of participants experiencing an outcome between two groups. In this context, the outcome is binary. Here, a binary outcome refers to an outcome that has only two possible states, such as alive or dead, intubated or not intubated, hospitalized or not hospitalized, or willing or unwilling to perform cardiopulmonary resuscitation (CPR).
This may occur in randomized studies. For example, researchers may randomize patients with severe pandemic influenza to one of two biologic therapies and compare 30-day mortality between the groups. Such designs also occur in observational research. For instance, investigators may compare the occurrence of diarrheal illness between two geographic regions following a natural disaster.
Although these study designs are common, the reporting of the results remains controversial. Authors often face difficulty in choosing the correct way to report the effect. It can be difficult to choose between absolute risk differences, relative risks (RR), and odds ratios (OR). This editorial outlines the preferred reporting style of Prehospital and Disaster Medicine (PDM), which emphasizes the reporting of absolute risk differences and explains the rationale for this approach. As with all reporting standards adopted by the journal, the primary objective is to maximize clarity and interpretability for our readers.
An Example: CPR and Video Training
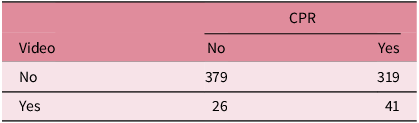
Imagine a small hypothetical study at a university in which investigators are attempting to evaluate the effect of CPR video training on students’ willingness to perform CPR if needed. Among 67 students who received video CPR training, 41 stated that they would be willing to perform CPR if needed. Conversely, among a control group of 698 students, 319 stated that they would be willing to perform CPR.
Results for this type of study are often summarized in a 2 × 2 contingency table (Table 1)
Willingness to Provide CPR

Reporting the Absolute Difference
The PDM preferred guideline is to report the effect as the absolute difference between the groups. The absolute risk difference is calculated by subtracting the proportion of participants experiencing the outcome in one group from the proportion experiencing the outcome in the comparison group. For example, if 61.2% of participants in the intervention group and 45.7% of participants in the control group experience the outcome, the absolute risk difference is 15.5 percentage points. This measure represents the absolute change in outcome frequency attributable to the intervention. For primary outcomes, this should be reported with a 95% confidence interval for the difference and a P-value.
The statistical significance of differences in proportions may be assessed using several equivalent methods, including the Pearson chi-square test and the two-sample test of proportions. For a 2 × 2 contingency table, these approaches test the same null hypothesis and generally produce identical P-values. Because the two-sample test of proportions directly estimates the absolute risk difference and its confidence interval, it aligns naturally with PDM reporting style. In R (R Foundation for Statistical Computing; Vienna, Austria), this analysis is commonly performed using the prop.test() function, whereas in Python (Python Software Foundation; Wilmington, Delaware USA), it can be performed using the proportions_ztest() and confint_proportions_2indep() functions from the statsmodels package.
For example, in the methods section, it would be reasonable to write:
For the primary outcome, the difference in proportions between groups was analyzed using the two-sample test of proportions. Results are reported as the absolute risk difference with its corresponding 95% confidence interval and two-sided P-value. Analyses were performed in R using the prop.test() function. Statistical significance was defined a priori as a two-sided P-value less than 0.05.
The results could then be written as:
In the video intervention group, 41 of 67 students were willing to perform CPR (61.2%). In the control group, 319 of 698 students were willing to perform CPR (45.7%). The absolute difference between groups was 15.5 percentage points (95% CI, 3.2 to 27.7; P = 0.015).
When reporting absolute differences, it is mandatory that the confidence interval be centered around the difference between the groups. A common mistake is for authors to report a confidence interval for each group separately and fail to give a confidence interval for the difference. For instance, 61.2% (95% CI, 49.2% to 72.0%) versus 45.7% (95% CI, 42.0% to 49.4%). While confidence intervals for individual groups may be informative, they do not provide a confidence interval for the difference between groups and should not replace direct reporting of the treatment effect.
Reporting Relative Risk
Relative risk is calculated by dividing the proportion of participants experiencing the outcome in one group by the proportion experiencing the outcome in the comparison group. For example, if 61.2% of participants in the intervention group and 45.7% of participants in the control group experience the outcome, the RR is 1.34. This measure represents the proportional change in outcome frequency associated with the intervention.
PDM guidelines allow reporting of the RR at the author’s discretion. In some cases, particularly epidemiological study, it may add additional clarity.
In many cases, it does not. Consistent with the statistical reporting principles emphasized by journals such the New England Journal of Medicine (NEJM), PDM prefers that absolute event counts or rates be reported before RR. 1 If reported, RR should include a 95% confidence interval. Since the difference between groups has already been established as statistically significant in the assessment of absolute risk difference, an additional P value should not be reported.
For example:
In the video intervention group, 41 of 67 students were willing to perform CPR (61.2%). In the control group, 319 of 698 students were willing to perform CPR (45.7%). The absolute difference between groups was 15.5 percentage points (95% CI, 3.2 to 27.7; P = 0.015). The relative risk of performing CPR in the video intervention group was 1.34 (95% CI, 1.09 to 1.65).
Odds Ratio
The OR is calculated by dividing the odds of an outcome occurring in one group by the odds of the outcome occurring in the comparison group. For example, if 41 of 67 participants in the intervention group and 319 of 698 participants in the control group would perform CPR, the OR is (41/26)/(319/379) = 1.87. This measure represents the relative difference in odds between groups. Of note, it is not the same as the RR.
The OR enjoys a unique statistical property in that its calculation is symmetric. Changing the 2 × 2 contingency table by swapping rows, swapping columns, redefining the exposure, or redefining the outcome preserves the magnitude of the association even if the OR itself becomes inverted (1/OR). This symmetry is not maintained for absolute risk or RR.
While the symmetry leads to interesting mathematical properties, a major limitation of ORs is that they are often less intuitive than absolute risks or RR. Readers more naturally interpret health outcomes in terms of probabilities rather than odds, and studies have repeatedly demonstrated that ORs are frequently misinterpreted as RRs. Reference George, Stead and Ganti2–Reference Davies, Crombie and Tavakoli4 This can lead to substantial over-estimation of effect size when outcomes are common.
In line with other journals, such as the NEJM, PDM generally discourages the use of OR when absolute risk differences and RR can be directly calculated. 1
Getting Risk Ratios Wrong: Rare Outcomes
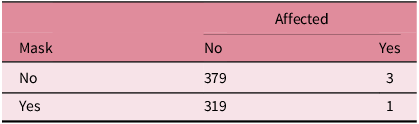
Unfortunately, reporting RR without accompanying absolute differences can sometimes be misleading. This is particularly true if the outcome is rare. For example, consider a hypothetical study in which researchers compared the risk of developing symptoms during a cruise ship respiratory virus outbreak between passengers who routinely wore a mask and those who did not. Among the 320 passengers who reported routinely wearing a mask, one developed symptoms of the outbreak. Conversely, among the 382 passengers who reported not wearing a mask, three developed symptoms (Table 2).
Passengers Affected by Symptoms of Respiratory Outbreak

The RR of developing symptoms of the outbreak when wearing a mask is 0.40, which would suggest a relatively strong effect of masking. However, when reported in PDM style:
In the masking group, 1 of 320 passengers developed symptoms of the outbreak (0.30%). In the control group, 3 of 382 passengers developed symptoms (0.78%). The absolute difference between groups was 0.47 percentage points (95% CI, - 1.5 to 0.78; P = 0.40).
This suggests that passengers not wearing a mask have about an 8/1,000 chance of developing symptoms, while wearing a mask can reduce this to about 3/1,000.
Getting Odds Ratios Wrong: Common Outcomes
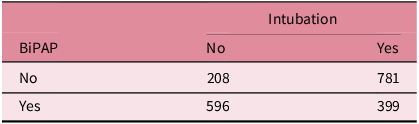
It is a well-known principle that OR provides a reasonable approximation of RR when the incidence of an outcome is rare. Conversely, when the incidence of an outcome is not rare, OR can be substantially misleading. For example, consider a hypothetical study examining the need for endotracheal intubation within 30 days among patients with severe respiratory distress transported in a two-tier ambulance system during a severe respiratory virus pandemic. Some ambulances had access to BiPAP and others did not. Of the 995 patients transported by ambulances equipped with BiPAP, 399 required intubation within 30 days. Conversely, among the 989 patients transported by ambulances without access to BiPAP, 781 required intubation within 30 days (Table 3).
Requirement for Intubation after Ambulance Transport

The calculated OR for requiring intubation when patients were given BiPap is 0.18, which would suggest an extremely strong effect of BiPAP. In fact, a practitioner may intuitively believe that this means that patients are only about one-fifth as likely to need intubation if they are given BiPAP. Reference Persoskie and Ferrer3 However, the actual incidence of intubation in this group is 79.0% for patients in the control group and 40.1% in the BiPAP group. This is an absolute difference of 39.0% and a RR of 0.50.
While all measures suggest an effect of BiPAP, the OR here is clearly much different from the RR. Many readers will tend to over-estimate the effect if only OR is reported.
When Odds Ratios are Unavoidable
While OR can occasionally be misleading, there are situations in which their use is necessary. In case-control studies, absolute risks and RR cannot generally be estimated because the underlying incidence of disease is not observed. Interpretation in this case must therefore rely on OR. In addition, logistic regression is based on the logit function, which is the logarithm of the odds.
Other study designs and statistical methods may similarly require the use of OR. In such circumstances, PDM requires authors to explicitly justify the use of OR in the methods section. Authors should also acknowledge in the limitations section that interpretation of the findings is based on OR and that these measures may be susceptible to misinterpretation, particularly when outcomes are common.
Is this Causality?
An important caveat when interpreting studies that report absolute risk differences, RR, or OR is that these measures do not, by themselves, establish causality. In randomized experiments, it is often reasonable to conclude that differences between the groups are due to the treatment effect provided randomization was successful and important sources of bias were minimized. However, in observational studies, associations may reflect correlation rather than a true causal relationship. Authors should therefore exercise considerable caution when attributing causality to observed associations and should ensure that their conclusions remain consistent with the limitations of the study design.
Conclusions
Prehospital and Disaster Medicine serves a diverse international readership. As such, the journal emphasizes clarity in statistical reporting to ensure that the significance of study findings can be readily understood by all readers. For studies in which the primary outcome is a difference in proportions between two groups, PDM prioritizes the absolute risk difference as the principal measure of effect, accompanied by a 95% confidence interval and P-value. Relative risks may be reported as secondary analyses at the authors’ discretion. Odds ratios should generally be avoided except in case-control studies, logistic regression, or when required by the selected statistical method.
Supplementary Materials
R code for the hypothetical examples in this editorial is available as supplementary material.
To view supplementary material for this article, please visit https://doi.org/10.1017/S1049023X26108954
Author Contributions
JMF is responsible for all content.
Competing Interests
JMF is the CEO and founder of STAT59 and the Editor-in-Chief of Prehospital and Disaster Medicine.
Use of AI Technology
ChatGPT Version 5 (OpenAI; San Francisco, California USA) was used for assistance with writing; however, the author remains responsible for all content.