

1. Introduction
One of the most contentious questions since the beginning of Russia’s war against Ukraine has been whether Ukraine should be open to negotiations with Russia to end the war, or whether it should seek victory by military means (Charap and Radchenko, Reference Charap and Radchenko2024). Supporters of negotiations highlight the need to avoid further escalation and minimize casualties (Reuters, 2022), whereas opponents suggest that Russia is not serious about negotiating and will use any talks to improve its military positions and restart its aggression (Sasse, Reference Sasse2022). In Davos, Switzerland in January 2024, Ukrainian President Volodymyr Zelensky released his 10-point peace plan including the removal of all Russian soldiers from Ukrainian territory, and credible investigation of Russian war crimes—both nonstarters for Russia (Keaten, Reference Keaten2024). The question of negotiations has also led to divisions within NATO: Since assuming office in 2025, President Trump and his administration have clashed with NATO allies over support for Ukraine and contours of a hypothetical peace deal, and pressured Ukraine to negotiate with Russia (Reuters, 2025).
This raises important questions: would Ukraine and the Ukrainian people support a negotiated peace settlement, and how does exposure to violence and the course of the war shape these attitudes? What kind of settlements would a public living through the violence of a foreign invasion be willing to accept? How does exposure to violence and displacement influence these attitudes? These questions are not just specific to the war in Ukraine, but relevant to many other contexts of conflicts and lie at the core of the study of war.
There are divergent findings on the effect of war on the public’s willingness to give concessions for peace. On the one hand, much of the strategic bargaining literature suggests that belligerents use military force to inflict pain and extract concessions from their opponents (Schelling, Reference Schelling1966; Smith and Stam, Reference Smith and Stam2004). This approach implies that the continuation of hostilities and exposure of larger segments of the Ukrainian population to violence might lead them to be more supportive of concessions to Russia in order to avoid further violence. Indeed, some empirical studies from the civil war context find that civilians who were exposed to violence are more willing to compromise with the perpetrators (Tellez, Reference Tellez2019; Hazlett, Reference Hazlett2020).
An alternative view suggests that while there are certain topics or issues on which individuals will engage in cost-benefit reasoning (“negotiables”), there are also others considered as “red lines.” Compromising over these is viewed as selling out the in-group, even in the face of violence (Ginges et al., Reference Ginges, Atran, Medin and Shikaki2007). Indeed, other empirical studies find that experiencing violence not only fails to increase support for concessions but may also harden attitudes and increase willingness to vote for hawkish parties (Canetti-Nisim et al., Reference Canetti-Nisim, Halperin, Sharvit and Hobfoll2009; Hersh, Reference Hersh2013; Getmansky and Zeitzoff, Reference Getmansky and Zeitzoff2014; Hirsch-Hoefler et al., Reference Hirsch-Hoefler, Canetti, Rapaport and Hobfoll2016; Canetti, Reference Canetti2017; Kupatadze and Zeitzoff, Reference Kupatadze and Zeitzoff2021). A particularly important distinction that few have explored is that protracted exposure—not just short-term exposure—may harden individuals against peace as a way of coping with the distress from the conflict (Hirsch-Hoefler et al., Reference Hirsch-Hoefler, Canetti, Rapaport and Hobfoll2016; Canetti, Reference Canetti2017).
Building on this alternative view, we argue that exposure to violence has different effects on public attitudes toward negotiations in the short term versus the long term. In the short term, exposure to violence makes individuals somewhat more supportive of concessions on several issues among them those considered to be red lines (e.g., independence of Luhansk People’s Republic [LNR]/Donetsk People’s Republic [DNR]).
However, as the war drags on, individuals become less willing to concede including on issues they were initially somewhat more inclined to compromise on at the beginning of the conflict (e.g., LNR/DNR referendum). We discuss several possible explanations for this change. In particular, we show that individuals who report having family and friends killed are becoming less supportive of an agreement. In addition, we discuss how individual optimism about the course of war is linked to lower support for an agreement. To the extent that some individuals become more optimistic as the war continues, this can also explain some of the decline in support for an agreement and entrenchment on some of the core issues.
To test our theory, we examine the Ukrainian public opinion in the context of the 2022 Russian invasion of Ukraine for two primary reasons. First, Ukrainians are currently living through one of the largest and most intense conflicts in Europe since the end of World War II. Second, this conflict provides an important opportunity to take an innovative sampling and survey experimental approach. Specifically, we employ both online Internet panels and mobile phone sampling frames, each comprising approximately 2,000 and 3,000 respondents, respectively, and incorporate both self-reported and observational exposure to violence. To understand the short- and long-term effects of exposure to violence, we conduct our survey in three waves: the first two are administered in July of 2022, two weeks apart, followed by a third wave conducted ten months after the initial surveys in May of 2023.
This innovative approach offers several advantages. First, combining mobile phone survey and online panels enables us to pose identical questions to different respondent groups, including those who fled Ukraine during the war. This helps reduce sample selection bias, ensuring we capture diverse perspectives on negotiation issues compared to those who remained. Second, by triangulating self-reported measures of violence exposure with observational data, we enhance confidence in the validity of our findings. Last, fielding multiple survey waves allows us to explore how changes in exposure to violence during war influence views on negotiations.
We use online panel and nationally representative telephone surveys to measure how individuals’ exposure to violence affects their willingness to compromise. However, since our theory suggests that this willingness is also a function of the specific issues at stake, we need to understand which issues people consider as “negotiables” versus “red lines.” To do that, we conducted a “poison pill” survey experiment, a method commonly used to investigate the effects of priming on behavior (Bargh et al., Reference Bargh, Chen and Burrows1996). In this experiment, survey respondents were presented with a hypothetical peace agreement with Russia. We examine several components of a possible political agreement, including the territorial dimensions such as the status of different regions of Donbas and the Crimea, the political aspects of Ukraine’s future relationship with the EU, the future status of Ukraine’s President, and general attitudes toward peace and Russia. Randomly included within this hypothetical peace agreement was a “poison pill”: a specific issue Ukrainians needed to compromise on (e.g., Zelensky has to step down as leader of Ukraine) for the proposed peace agreement to be signed and end the war.
Our findings confirm that the public tends to perceive certain issues as red lines while considering others negotiable. Specifically, Ukrainians are willing to entertain the idea of allowing the separatist regions in Donbas to vote on their status regarding Russia or Ukraine. However, recognizing Crimea as part of Russia and pledging not to join the EU are viewed as non-starters for negotiations.
Our second key finding reveals that exposure to violence has varying effects on public attitudes toward negotiations in the short term versus the long term. In the short term, exposure to violence does not harden Ukrainians’ attitudes. In fact, among those exposed to gunfire, forced into bomb shelters, or witnessed injuries from the conflict, it can increase openness to negotiations with Russia on several issues (e.g., LNR/DNR independence, reduction of Ukraine’s army size, and not joining the EU). However, over the long term, overall support for a negotiated solution declines, especially among individuals who report having lost friends or family members. We also discuss how optimism about Ukraine’s ability to resist Russian advances can reduce support for a negotiated settlement. Therefore, alongside exposure to violence, beliefs about the future course of the war—whether optimistic or pessimistic—can play a crucial role in shaping the public’s support for a negotiated agreement.
We make two main contributions. Substantively, we provide the first evidence of how the course of war and ongoing exposure to wartime violence shapes the development of “red lines” among the population, thereby advancing the literature on conflict resolution. Specifically, our research contributes to understanding when parties in conflict decide to negotiate rather than continue fighting (Slantchev, Reference Slantchev2003; Fearon, Reference Fearon2007; Leventoğlu and Slantchev, Reference Leventoğlu and Slantchev2007; Goemans and Fey, Reference Goemans and Fey2009; Powell, Reference Powell2012).
Our work also relates to recent studies that examine public attitudes in Ukraine toward negotiation (Bartusevičius et al., Reference Bartusevičius, Van Leeuwen, Mazepus, Laustsen and Forø Tollefsen2023; Dill et al., Reference Dill, Howlett and Müller-Crepon2024). However, our study significantly expands on these previous studies. First, we examine negotiation preferences concerning a wider range of critical political issues (e.g., demands for Zelensky’s resignation, the downsizing of the Ukrainian army or the official language policies in Ukraine). Second, instead of only looking at attitudes at discrete points in time, we employ repeated measurements over a longer time horizon. This approach enables us to capture substantial shifts in attitudes and exposure to violence as the conflict evolves.
Methodologically, we demonstrate high correlations between individuals’ self-reported exposure to violence and media-reported violence. These findings suggest that common survey concerns such as survivorship bias and recall bias may be less significant when studying conflict-affected populations during rather than after the conflict. These results validate prior research suggesting that real-time sampling during conflict yields more precise insights into how violence shapes attitudes and behaviors. Additionally, our findings suggest that observational micro-level data may be a viable alternative for measuring exposure to violence when other survey methods are impractical due to cost or safety concerns.
2. Public support for settlement in political conflicts
There are two competing theories on how violence influences the public support for settlement in political conflict. One group of scholars argues that exposure to violence hardens the public’s willingness to compromise. For instance, studies of terrorism in the U.S. and Israel have found that exposure to violence increases hardline attitudes, and opposition to compromise (Hersh, Reference Hersh2013; Getmansky and Zeitzoff, Reference Getmansky and Zeitzoff2014). Many of these studies argue that exposure to violence or terrorism, primes stress, anger, or anxiety, and that these in turn foment more hawkish security attitudes as a way of managing the emotions and stress from victimization (Hirsch-Hoefler et al., Reference Hirsch-Hoefler, Canetti, Rapaport and Hobfoll2016; Kupatadze and Zeitzoff, Reference Kupatadze and Zeitzoff2021). Additional research suggests a more nuanced perspective. It finds that civilians who become victims are less likely to support a counterinsurgency effort after being victimized (Lyall, Reference Lyall2009). Fabbe et al. (Reference Fabbe, Hazlett and Sinmazdemir2024) show that victimization can turn civilians against all sides in conflict without becoming politically indifferent. Moreover, civilians may assign blame differently depending on the identities of the victim and the perpetrator (Condra and Shapiro, Reference Condra and Shapiro2012; Lyall et al., Reference Lyall, Blair and Imai2013).
Another group of scholars finds that people exposed to even extreme wartime violence may be open to negotiation. Kreiman and Masullo (Reference Kreiman and Masullo2020) shows that in the context of the 2016 Colombian peace referendum between the Colombian government and the Revolutionary Armed Forces of Colombia (FARC), individuals victimized by the FARC were more likely to support the agreement, viewing this agreement as a means to enhance their own security. Hazlett (Reference Hazlett2020) connects this to the idea of war weariness, and uses evidence from the War in Darfur to show that some civilians who get victimized—rather than being hardened—are war weary, and favor peace and compromise.
Scholars suggest that measurement issues might explain the mixed findings in previous literature. The first issue concerns the failure to differentiate between values or points that the public will not compromise on (i.e., red lines or sacred values) and points that they are willing to negotiate over (i.e., negotiables). Research from psychology and international relations suggests that moral values play an important role in shaping attitudes toward peace and security (Kertzer et al., Reference Kertzer, Powers, Rathbun and Iyer2014). In particular, certain values, beliefs, or positions are believed to be sacred (Tetlock, Reference Tetlock2003; Atran and Axelrod, Reference Atran and Axelrod2008). Unlike negotiable beliefs, sacred values are viewed through a deontological lens and are seen as moral imperatives rather than bargaining chips (Ginges et al., Reference Ginges, Atran, Medin and Shikaki2007; Ginges, Reference Ginges2019).
The second issue is that measuring public opinion during conflict poses challenges. Most previous studies linking conflict exposure and victimization occur after the conflicts have ended (Bauer et al., Reference Bauer, Blattman, Chytilová, Henrich, Miguel and Mitts2016). This timing can introduce various biases into estimates. For example, population composition may change post-conflict due to movements or fatalities (survivorship bias). Additionally, respondents may inaccurately recall past events (recall bias). Even in surveys conducted during conflicts, the mode of sampling and contact can favor individuals with varying degrees of conflict exposure, potentially biasing the results (sampling bias) (Johnson et al., Reference Johnson, Spagat, Gourley, Onnela and Reinert2008; Jewell et al., Reference Jewell, Spagat and Jewell2018).
3. Dynamics of negotiation preferences in conflict contexts
Our theory on the effects of exposure to violence posits that exposure to violence influences public attitudes toward negotiations differently in the short term compared to the long term. This variation hinges not merely on willingness to negotiate but on the specific issues individuals are willing to bargain over.
Our theory is grounded in two key points. First, we distinguish between a general willingness to negotiate and the specific stance individuals take on different negotiation points. Simply being in favor of negotiation does not imply a uniform willingness to adopt more conciliatory positions across all issues. In other words, individuals may support negotiation in principle, but may still strongly oppose some of the concessions. For example, individuals may support peace talks as a means to end hostilities but may strongly oppose concessions on territorial sovereignty or fundamental political rights. Thus, their willingness to negotiate does not translate into agreement on all aspects of the negotiation agenda. We therefore expect individuals to vary with respect to their support for concessions across different issues (Hypothesis 1).
H1 (Variation in Support for Concessions Hypothesis): H1A: People will have principled views on support for negotiating in general. H1B: But even among those who support negotiation in principle, there will be rank-ordering of concessions—with certain concessions being more or less acceptable.
The second part of our theory concerns the distinction between sacred values—red lines that individuals are unwilling to negotiate over—and negotiable points where flexibility is possible (Ginges et al., Reference Ginges, Atran, Medin and Shikaki2007). Individuals hold principled views on peace settlements, which include a rank ordering of provisions they find acceptable versus unacceptable. For instance, sovereignty over certain territories or core national identity might be considered sacred values, non-negotiable under any circumstances (Dill et al., Reference Dill, Howlett and Müller-Crepon2024). Conversely, issues like economic reparations, border adjustments, or resource-sharing agreements may be negotiable, where individuals might be more willing to compromise based on strategic or pragmatic considerations. This hierarchical ranking reflects a nuanced approach to negotiation dynamics, where different elements of a peace agreement carry varying degrees of importance and resistance to compromise.
We argue that in the short term, exposure to violence tends to make individuals more supportive of concessions (Hypothesis 2).Footnote 1 The direct experience of conflict profoundly impacts individuals by heightening their sense of vulnerability and urgency for peace. Witnessing the devastating effects of conflict on communities fosters a strong desire to alleviate suffering and restore stability quickly. Moreover, the practical realities of living in a conflict zone—such as disruptions to daily life, economic hardships, and loss of livelihoods—often drive people to seek pragmatic solutions through negotiation. These experiences will lead individuals to prioritize negotiations and compromise on certain issues in exchange for immediate relief and the prospect of rebuilding shattered lives.
H2 (Short-term Concession Effect of Violence Exposure Hypothesis): Exposure to violence is more likely to increase public support for concessions.
As conflicts persist over time, individuals often become more steadfast in their positions on issues they might have been more willing to negotiate earlier in the conflict (Hypothesis 3). Prolonged exposure to violence and hardship can reinforce individuals’ commitment to their initial stances as they endure the cumulative impact of conflict on their lives and communities. Moreover, as the conflict deepens, issues that were initially considered up for negotiations may become increasingly intertwined with core values, identity, or survival, making compromise appear more difficult or less desirable. In the context of the Syrian civil war, for instance, control over strategic cities like Aleppo was initially on the table for potential ceasefires or peace talks. However, as the conflict prolonged and various factions entrenched their positions, control over Aleppo became symbolically and strategically significant, intertwined with broader geopolitical and sectarian interests, making compromise increasingly difficult and less desirable (Scherling, Reference Scherling2021). Furthermore, prolonged conflict can breed mistrust and resentment, further solidifying opposing positions and reducing the willingness to engage in concessions.
H3 (Long-term Entrenchment Effect of Violence Exposure Hypothesis): Prolonged exposure to violence tends to harden public attitudes over time, reducing willingness to make concessions on previously reconcilable matters.
4. 2022 Russian invasion of Ukraine
The large-scale Russian invasion of Ukraine is one of the most important geopolitical events in recent years. It precipitated Europe’s largest refugee crisis since World War II, displacing over one-quarter of Ukraine’s population—15.8 million people—of whom about 6.5 million have become refugees by fleeing the country (United Nations High Commissioner for Refugees, 2024). In addition to the fierce fighting between Ukraine and Russia, the conflict has also served as a proxy battle involving major powers—the U.S. and European Union opposing Russia, with China playing a secondary role.
Peace negotiations between Ukraine and Russia have been ongoing throughout the conflict (Charap and Radchenko, Reference Charap and Radchenko2024). While there has been considerable debate about potential terms for a negotiated settlement, less attention has been paid to the parameters that Ukrainians themselves would find acceptable. Any peace deal negotiated by Ukraine would likely need to be ratified via a public referendum, and Ukrainian politicians are cognizant of not agreeing to an unpopular settlement. For instance, President Zelensky has emphasized the need for any compromises with Russia to be subject to a referendum (Wood, Reference Wood2022). Against the backdrop of intense combat and reports of atrocities and war crimes allegedly committed by Russian forces against Ukrainians in occupied towns like Irpin and Bucha, understanding how exposure to wartime violence influences Ukrainian public opinion toward any peace settlement is both crucial and timely.
We begin by providing a brief overview of the events in Ukraine from Russia’s invasion on February 24, 2022, through to May 1, 2023, which marks the beginning of our survey’s last wave. We next discuss the types of violence experienced by Ukrainians as a result of these events and their attitudes toward Russia in general, as well as their preferences regarding a peace settlement prior to May 1, 2023.
4.1. Conflict background
On February 24, 2022, the Russian forces started their invasion of Ukraine by land, sea, and air. Russian troops moved across the Ukrainian border from the north advancing on the Ukrainian capital of Kyiv, the northeast advancing on the Ukraine’s second largest city of Kharkiv, and the east from the occupied territories of Donbas; they also landed in the southern city port of Odesa and fanned out from the Crimea into the directions of Kherson and Mariupol hoping to establish a land bridge between the Crimea and Donbas (Dijkstra et al., Reference Dijkstra, Cavelty, Jenne and Reykers2022). To support ground operations, the Kremlin also used its air power to bombard Ukrainian cities and towns, primarily aiming at military and critical infrastructure objects all over Ukraine but sometimes hitting residential neighborhoods in densely populated urban areas (Wetzel, Reference Wetzel2022). As a result of the violence, after 100 days of the conflict, nearly 7 million Ukrainians had fled the country (United Nations High Commissioner for Refugees, 2022b).
Vladimir Putin hoped to overthrow the Ukrainian government in a matter of a few days. But Russian forces met significant resistance and had to pull back after a few weeks of fighting. When retreating, the Russian forces were credibly implicated in atrocities and war crimes against Ukrainian civilians (Gall and Berehulak, Reference Gall and Berehulak2022). Air, missile, and artillery strikes of civilian areas also intensified.Footnote 2 Splitting its troops across many different fronts, Russian progress ground to a halt in April. As a result, the Kremlin changed its strategy and redeployed its troops to concentrate on a narrower target—Donbas. Seizing eastern Ukraine became Russia’s new main objective in the war (Gibbons-Neff, Reference Gibbons-Neff2022). Despite that, the Kremlin continued bombing major Ukrainian cities and towns from the Belarusian airspace, the warships in the Black Sea, and the aircraft flying over the Caspian Sea, hitting civilian infrastructure and residential neighborhoods (Santora Mark, Reference Mark2022).
In late August 2022, Ukraine launched a counteroffensive against Russian forces in the south, breaching Russia’s initial defense line near Kherson. By early September, Ukrainian forces had made substantial territorial gains, reclaiming parts of Kharkiv oblast and advancing toward Luhansk. However, by mid-November of 2022, Ukrainian forces encountered their second stalemate, which persisted until April 2023. As of May 2023, Russia maintained control over approximately eighteen percent of Ukrainian territory, primarily in the east and southeast of Ukraine (Daalder, Reference Daalder2023).
4.2. Exposure to violence as a result of war
The summary of the events above suggests that there is a significant variation in the exposure to violence among civilians. This ranges from individuals who have only experienced violence through media accounts to those who have been direct victims of torture, rape, and other forms of violence (United Nations High Commissioner for Refugees, 2022a). In the western regions of Ukraine, civilians did not witness on-the-ground combat directly; some of them fell victim to aerial bombardment that destroyed their homes and claimed lives of their loved ones. In contrast, many citizens of the northeastern, eastern, and southern Ukraine, where the most intense fighting occurred, either fled these areas or endured severe acts of violence (Kortava, Reference Kortava2022). Two cities, Irpin and Bucha, gained particular notoriety as sites of massacres committed by invading Russian soldiers. These incidents included the execution of civilians, cases of rape, and torture during Russia’s brief occupation of these two localities just outside of Kyiv (Bezpiatchuk, Reference Bezpiatchuk2022). Witnesses and investigators discovered mass graves containing several hundred Ukrainian civilians, bearing evidence of torture and abuse (Kullab, Reference Kullab2024).
4.3. Public preferences regarding a peace settlement
To understand whether and how this exposure to violence influences the Ukrainian public toward any potential peace settlement with Russia, we first need to understand which factors drove foreign policy preferences among Ukrainians prior to the conflict start and during the earlier stages of war taking place in Donbas (2014 and 2021). Research shows that older Ukrainians (Onuch and Arkwright, Reference Onuch and Arkwright2021), those who did not participate in the Revolution of Dignity (Euromaidan) (Pop-Eleches et al., Reference Pop-Eleches, Robertson and Rosenfeld2022), and those who benefited from an economic relationship with Russia (Beesley, Reference Beesley2020) were more likely to prefer a warm relationship with Russia than with the EU countries. The War in Donbas further shaped these preferences. Rozenas and Zhukov (Reference Rozenas and Zhukov2019) show that Ukrainian citizens who lived in the territories controlled by the Russian separatists were more hesitant to express anti-Russian views due to the fear of retribution than those citizens who did not live in these territories. Additionally, citizens in Donetsk and Luhansk regions weighted the tactics employed by both Ukrainian government and separatists forces, with disapproval of civilian targeting varying based on attitudes toward the Ukrainian government (Lupu and Wallace, Reference Lupu and Wallace2023).
The ongoing regional war, crises, and the subsequent full-scale Russian invasion further shaped public opinion in Ukraine. In the three years leading up to the invasion, there was a gradual decline in positive attitudes toward Russia. By May 2022, only two percent of the Ukrainians held a positive attitude toward Russia, mostly those residing in the East (Kyiv International Institute of Sociology, 2022).
Research shows that war experiences shored up civic identities and not ethno-linguistic or ethno-national identities among the Ukrainian public. Increasingly, citizens identify with the Ukrainian state and not with Ukrainian ethnicity and language while also aligning more with pro-democratic and pro-European positions (Onuch, Reference Onuch2022). In particular, the 2021-2022 survey results show that the Russian invasion of Ukraine resulted in greater support of joining the EU (+ 16%) and NATO (+ 5%) among Ukrainians (Howlett and Müller-Crepon., Reference Howlett and Müller-Crepon2022). Regarding opinions on ending the conflict, there has been a growing reluctance to make concessions to Russia in exchange for peace. For instance, in May 2022, eighty-two percent of survey respondents expressed opposition to any territorial concessions. Even among the residents in the East and South who have experienced significant fighting, the majority of respondents are against giving up any territories (Ilko Kucheriv Democratic Initiatives Foundation, 2022). By May 2023, a survey carried out by the National Democratic Institute (NDI) found that since the start of war support among Ukrainians joining NATO had surged from 65 to 85 percent, while belief in Russia’s willingness to negotiate in good faith declined sharply from 59 to 33 percent (National Democratic Initiatives, 2023).
5. Research design
To test how violence exposure affects wartime attitudes in Ukraine, we fielded survey experiments using combined mobile phone and online sampling frames. While mobile phone coverage is high in Ukraine, conflict-related service interruptions and displacement can miss certain populations (Collier and Talmazan, Reference Collier and Talmazan2022). Online panels (although they allow to track how shifts in exposure to violence affect attitudes) skew younger, more educated, and urban demographics. Combining phone surveys with online panels allows to minimize coverage bias.
Our study was conducted over three waves. The first two waves in July 2022—with a two-week interval between them—were used to gauge how short-term changes in violence affect attitudes. In Wave 1, we utilized both phone and online samples. In Wave 2, we used an online sample since it allowed us to recontact the respondents at a high rate and reduce attrition. In Wave 3 in May 2023, we fielded a phone survey to study the long-term effects of conflict.Footnote 3
5.1. Wave 1 (July 1–July 12, 2022), mobile phone and online panel
The mobile phone sampling involved 3,016 respondents from areas under Ukrainian control (see Figure 1) and was carried out by the Kyiv International Institute of Sociology (KIIS), one of the most respected survey firms in Ukraine.Footnote 4 The online panel (see Figure 2) was fielded between 1 and 7 July, 2022 via the Kantar online survey panel and had 1,729 respondents.Footnote 5
Telephone wave 1 map.

Online panel map.

The Wave 1 mobile phone and online surveys used identical questions. Following questions on basic demographics and political attitudes, we asked respondents about their general willingness to negotiate with Russia. We then asked about their principles and attitudes toward negotiations with Russia through a set of questions, such as whether Ukraine should do whatever it takes to stop the violence, whether it needs to be strategically smart, or whether Russia cannot be trusted (Negotiating Principles). Following this, we asked respondents how much they would support or oppose the following components of any deal (Peace Components):
(1) Ukraine agreeing to not join NATO
(2) Western countries like the U.K. and U.S. providing military security guarantees to protect Ukraine military in the event of future conflicts
(3) Russian language can be used as an official language in Ukraine where a majority of the population wants it
(4) Crimea recognized as part of Russia
(5) DNR and LNR recognized as independent states within all of the Donetsk and Luhansk oblasts
(6) Shrinking the size and strength of the Ukrainian military
(7) Letting people in the DNR and LNR zones decide in a vote whether they want to stay in Ukraine or join Russia
(8) Ukraine renounces joining the European Union
(9) Zelensky stepping down as president
We then presented respondents with our “poison pill” survey experiment about a hypothetical peace agreement with Russia. “Suppose the following peace agreement is agreed to with Russia: 1) Halt of all violence; 2) Russia removes its military to pre-war lines (pre-February 24, 2022); and 3) Russia recognizes that Ukraine is a legitimate, independent country.” But within this hypothetical peace agreement, we randomly included one “poison pill” component (Poison Pill). “Now suppose a similar peace agreement is agreed to with Russia” and then we randomly presented respondents with one of the four poison pills shown below:
(1) But Zelensky has to step down as leader of Ukraine
(2) But Ukraine has to recognize Crimea as part of Russia
(3) But Ukraine has to let people in the LNR/DNR vote on whether they want to stay part of Ukraine or join Russia
(4) But Ukraine has to renounce ever joining the European Union
We then measured support for the hypothetical peace agreements.
Finally, at the end of the survey, we also measured exposure to violence in several ways. We asked respondents how often they had experienced the following: 1) heard shelling, 2) heard bomb sirens, 3) heard gunfire, 4) been scared to leave the house, 5) had to go in a bomb shelter, and 6) seen people wounded or injured from the violence both in the past week and since the war began on February 24, 2022.Footnote 6
5.2. Wave 2 (July 15–July 22, 2022), online panel
Our Wave 2 online survey was conducted via Kantar’s online panel with 1,729 individuals who had participated in the Wave 1 online panel. To measure any longitudinal shifts in attitudes and exposure to violence, we asked the following questions from Wave 1: respondents’ willingness to negotiate with Russia, individuals’ principles and attitudes about negotiating with Russia (Negotiating Principles), and their support for different possible components of a hypothetical peace deal (Peace Components).
To measure exposure to violence between the two waves, we also asked respondents to answer those same exposure to violence questions as in Wave 1 but asked how often they experienced them in the past two weeks.
5.3. Wave 3 (May 26–June 5, 2023)
Our last survey was fielded by KIIS via telephone, using a similar sampling procedure to the Wave 1 phone survey (see sampled oblasts in Figure 3).
Telephone wave 3 map.

This survey focused on support for a possible peace agreement and the Poison Pill experiment, as well as questions on exposure to violence.
Table 1 shows which relevant variables are included in which survey wave. Ideally, utilizing all samples and questions across different waves would be optimal. However, due to the substantial costs involved in conducting surveys and survey experiments in conflict settings, we have chosen to include only essential variables in each wave. This approach enables us to effectively address our research questions while managing resources responsibly.
Comparison of survey waves

The overview of the data and descriptive statistics are in the Online Appendix.
6. Findings
In this section, we present our main findings. First, we look at the poison pill experiment to see how territorial issues, domestic political arrangements, and the prospect of joining the EU constitute red lines, and preclude individuals from supporting a peace agreement (H1). We also examine positions on negotiating principles and peace components. We then analyze how short- and long-term violence (H2 and H3, respectively) shape individuals’ willingness to negotiate and compromise.
6.1. Which red lines cannot be crossed
In this subsection, we report the results of the “poison pill” experiment. Figure 4 shows the distribution of means and 95% confidence intervals over three survey samples across two survey waves (Wave 1 and Wave 3). The baseline (pre-treatment) support for an agreement with Russia is around 60% support in the first online and telephone waves in June 2022, and about 50% support in the third wave in May 2023. This baseline support is relatively low possibly for two reasons: First, some respondents may have opposed Russia withdrawing only to February 24, 2022 lines while maintaining control of Donbas and Crimea. Second, respondents who consider 2014 the war’s start may have found the “pre-war” phrasing problematic. Other surveys report higher support (80%) for peace agreements restoring Ukraine’s pre-2014 territory, including Donbas and Crimea (National Democratic Initiatives, 2023). Support for the agreement drops in all treatment groups relative to the baseline suggesting that the items we include as poison pills indeed receive lower support.Footnote 7 We return to the question of long-term effects of war toward the end of this article.
Experimental primes influence public support for settlements.

Next, we examine the poison pills on support for an agreement focusing on percentage change from the baseline as shown in Figure 5. The poison pills vary in their effect on baseline support in line with H1. LNR/DNR vote has the least negative effect on support especially in the 2022 samples, whereas the other poison pills lead to a larger drop in support for an agreement, especially the recognition of Crimea as part of Russia and a Ukrainian pledge not to join the EU.Footnote 8
Percentage change in support for an agreement relative to the baseline.

This variation suggests that some issues constitute a stronger red line than others because fewer respondents are willing to compromise on them in order to reach a deal. In particular, at the beginning of the war, we identify LNR/DNR vote as a negotiable, i.e., a relatively weak red line. In contrast, the other poisonous pills constitute stronger red lines during the first two survey waves.Footnote 9 We interpret these findings as evidence that Ukrainians are strongly opposed to any concessions that would directly constrain Ukraine’s political trajectory—whether by ceding territory to Russia (e.g., Crimea) or foreclosing the prospect of joining the European Union.
Moving on to the 2023 experiment (Wave 3), we find that the effect of LNR/DNR vote is now more negative, and it leads to a greater decline in support in terms of percentage change from the baseline. This suggests that as the war drags on, respondents harden their attitudes, especially on issues that they were more likely to compromise on at the beginning of the war. Zelensky’s resignation on the other hand, while still a poison pill, now has a smaller effect on support than before. Other poison pills have a similar effect on change relative to baseline as before.
6.2. Short-term effects of exposure to violence on attitudes
How does exposure to violence affect attitudes toward principles of negotiation and components of peace in the short term (H2)? To answer this question, we use data from the two waves of our online panel.
Given the significant correlation between self-reported violence exposure and negotiation/peace responses (see Online Appendix), we use principal component analysis (PCA) to reduce dimensionality and identify underlying patterns (Abdi and Williams, Reference Abdi and Williams2010). We create principal components for violence, negotiation principles, and peace components. Using online panel data, we explore how changes in violence exposure between survey waves affect preferences toward negotiation and peace components.
Panel (a) in Figure 6 shows that PC of violence exposure has a positive but not statistically significant effect of .066 on willingness to negotiate with Russia (95% CI [-.012; .145], 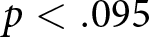 $p \lt .095$), corresponding to a 6.6 percentage point increase. The only significant effect of violence exposure PC is on respondents’ views of whether negotiating with Russia is strategically smart for Ukraine.
First-difference estimates of relationship between violence exposure and attitudes, online panel. (a) Negotiating principles. (b) Peace terms.

Panel (b) in Figure 6 reveals that PC of violence exposure has a positive effect of .100 on willingness to consider peace components (95% CI [.056; .145],  $p \lt 0.000$), corresponding to a 10 percentage point increase. Specifically, violence exposure PC significantly increases support for DNR/LNR independence, reducing Ukraine’s army size, and rejecting EU membership. Effects on other components are not significant.
These results are in line with our Hypothesis 2: The short-term effect of exposure to violence increases support for concessions only on some of the issues, and these issues are red lines rather than negotiables. According to the poison pill experiment, Ukraine not joining the EU has low public support. The mean level of public support for DNR/LNR being recognized as independent states and reducing the size of the Ukrainian army are also low and hence should be considered as red lines as well (see Figure A-4b in the Online Appendix).
Our findings suggest that violence exposure somewhat increases willingness to consider certain peace components, particularly recognizing DNR/LNR independence, reducing Ukraine’s army, and forgoing EU membership. Are these results geographically clustered or prevalent nationwide? We find no evidence of clustering. Appendix Figures A-11 and A-12 demonstrate that results are consistent across oblasts and robust to jackknife resampling (removing one region at a time).
Which types of violence drive the significant PC effects? Figures 7 and 8 present these results. Seeing wounded significantly affects all four attitudes. Hearing gunfire also increases support for three peace components: recognizing DNR/LNR independence (Figure 7(b)), reducing Ukraine’s army (Figure 8(a)), and rejecting EU membership (Figure 8(b)). These findings demonstrate that different types of violence have varying effects on negotiation willingness, consistent with earlier research (Brett, Reference Brett2007).
First-difference estimates of relationship between violence exposure and attitudes, online panel. (a) Strategic to keep negotiating. (b) Independent DNR/LNR.

First-difference estimates of relationship between violence exposure and attitudes, online panel. (a) Reduce UKR army size. (b) UKR reject joining EU.

6.3. What shifts attitudes toward negotiations in the long-term?
A key question is whether these findings align with long-term sentiment toward peace negotiations. Figure 4 reveals that by May 2023, Ukrainians became less willing to compromise with Russia—support for an agreement declined by about 10 percentage points compared to the 2022 telephone survey.
There are two possible explanations. First, has exposure to violence hardened Ukrainians’ attitudes, decreasing their willingness to settle (Hypothesis 3)? To test this explanation, we examine several measures of violence exposure (Figure 9). If exposure reduces support for an agreement, we would expect to see a negative correlation between measures of exposure and baseline support for an agreement. This is what we see when we measure exposure to violence using the number of people a respondent knows who were killed: Respondents who report knowing above median of the reported number are about 5.6 percentage points less likely to support an agreement with Russia than those who report knowing less than the median number of those reported by other respondents. We do not see a correlation between support for an agreement and exposure to violence measured as self-reported exposure to gunfire and the number of injured people that the respondent knows.Footnote 10
Exposure to violence and level of support for an agreement (May 2023 survey).

A second explanation for the decline in agreement support relates to the timing of our follow-up survey. May 2023 marked the height of optimism about Ukraine’s counter-offensive. Ukraine had withstood much of the Russian invasion and was preparing for a spring and early-summer counter-offensive. Ukrainian troops were training and maneuvering, while the military struck Russian logistics and ammunition depots.Footnote 11 Ukrainians may thus have been particularly optimistic about the war’s trajectory and less willing to support a negotiated settlement at that time.
But throughout the summer and fall of 2023, the much-hyped Ukrainian counteroffensive ground to a halt. Russian air strikes continued to pound Kyiv and other major population centers, and Ukrainian troops faced dug-in Russian defenses.Footnote 12 Data from a KIIS survey revealed that in May 2023, during the peak of optimism about the offensive, only 33% of Ukrainians supported negotiating with Russia. However, by November 2023, that figure had risen to 42%.Footnote 13 This trend extends beyond negotiations: Support for making territorial concessions for peace with Russia had nearly doubled from 10% in May 2023 to 19% in December.Footnote 14
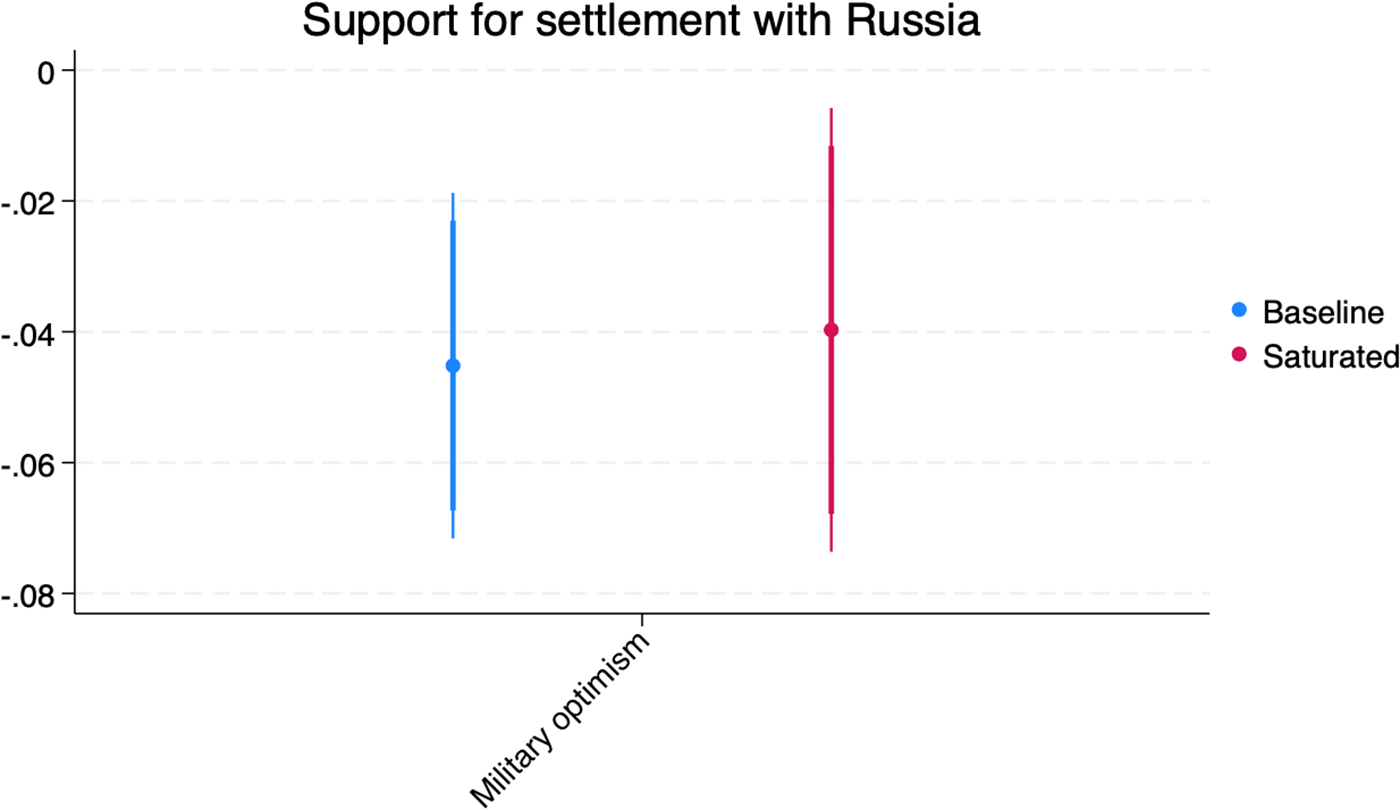
While we cannot directly compare the effects of optimism or pessimism about the war’s course versus exposure to violence on determining support for negotiations in 2023, we can examine whether optimism about Ukraine’s military strength is correlated with lower support for negotiating a deal with Russia based on 2022 surveys. To this end, we use a question repeated in the first online and the first telephone surveys, conducted in July 2022, about the extent to which different factors contributed to Ukraine’s military success on a scale from 0 to 10 (see Figure A-8 in the Online Appendix). We focus on two factors: “Ukrainian soldiers” and “Russian army low quality.” We use the difference between the two answers as a measure of military optimism. We regress the baseline support for an agreement with Russia on a binary indicator of whether a respondent is above the median of the military optimism measure. Figure 10 shows that individuals who are above the median military optimism are less willing to support an agreement with Russia. This is consistent with the argument that support for a negotiated solution is a function of individual assessment of the chances of prevailing militarily (Charap and Radchenko, Reference Charap and Radchenko2024).
Military optimism and support for an agreement.

In sum, our findings suggest that both long-term exposure to violence and military optimism can decrease public support for a diplomatic solution. However, further research is necessary to fully untangle the separate influences of these two factors.
7. Conclusion
How does wartime violence influence support for different possible peace settlements? To answer this question, we conducted a series of surveys and survey experiments in Ukraine in July 2022 and in May 2023. Using a survey experiment, we show that Ukrainians display flexibility on certain issues while viewing others as non-negotiable “red lines.” For example, respondents are open to allowing the separatist regions in Donbas to vote on their status regarding Russia or Ukraine. In contrast, recognizing the Crimea as part of Russia or agreeing to never join the EU are widely considered red lines and unacceptable for negotiation.
Our findings also distinguish between short-term and long-term effects of violence exposure. Through a panel survey, we observed that short-term exposure to violence initially made Ukrainians somewhat more inclined toward negotiating with Russia. However, in a follow-up survey conducted ten months later, we found that Ukrainian attitudes toward any peace settlement with Russia had hardened. We suggest that this shift was influenced by both prolonged exposure to violence, which solidified negative attitudes, and fluctuating optimism about Ukraine’s military prospects.
Our research demonstrates that the Ukrainian public maintains principled attitudes regarding negotiations while also revealing the significant impact of short-term and long-term exposure to violence on shifting public opinion. This first evidence of how the progression of conflict and ongoing exposure to war shapes the development of unyielding preferences among the population has three important implications for the literature on public opinion, war, and resolve.
First and foremost, we highlight the importance of distinguishing between “negotiables” and “red lines” in response to exposure to violence. Treating all issues uniformly under a broad willingness-to-negotiate framework can potentially yield misleading conclusions. Therefore, we believe that studies of public opinion in other cases of conflict should first aim to clarify which issues are considered as red lines and which are considered as negotiables by the public. Our results also imply that all else being equal, the longer a conflict lasts, the harder it becomes to end it due to a hardening of public attitudes as a result of long-term exposure to violence. This provides a potential explanation for the intractability of some conflicts, such as the Israel-Palestine conflict or the long duration of some other conflicts, such as the conflict between Colombia and FARC rebels. At the same time, our theory and findings suggest that even in long-lasting conflicts, short-term spikes in violence may provide a window of opportunity for the resolution of the conflict due to a short-term softening of public attitudes.
Second, we underscore the significance of studying real-time public opinion dynamics alongside the evolution of the conflict. Analyzing public sentiment at isolated moments may overlook crucial shifts in attitudes and perceptions over time. Last, high correlations between individuals’ self-reported exposure to violence and media-reported violence suggest that issues like survivorship bias and recall bias may be less pronounced when studying conflict-affected populations during rather than after the conflict. This indicates that real-time sampling during conflict provides more accurate insights into how violence influences attitudes and behaviors. Furthermore, these results suggest that using observational micro-level data is a viable alternative for measuring public exposure to violence when other methods are impractical due to cost or safety concerns.
Our results also suggest several considerations for policymakers engaged in conflict resolution. Understanding the delineations between negotiable and non-negotiable issues among the public is pivotal for crafting effective diplomatic strategies. Moreover, recognizing the varied impact of violence exposure on public sentiment over time highlights the need for nuanced approaches that adapt to evolving attitudes and perceptions amidst ongoing conflict. By acknowledging these dynamics, policymakers can better align negotiation efforts with the prevailing sentiments and priorities of the conflict-affected population, ultimately fostering conditions conducive to lasting peace and stability.
Supplementary material
The supplementary material for this article can be found at https://doi.org/10.1017/psrm.2025.10073. To obtain replication material for this article, https://doi.org/10.7910/DVN/W1FT6T.
Funding statement
This research was funded by NSF Award 2226883. The NSF did not play any role in the design, execution, analysis, and interpretation of data, or writing of the study.
Competing interests declaration
The authors have no competing interests to declare.
Data availability statement
The replication materials including the dataset needed to replicate the results will be made available upon publication on the journal’s website as part of the supplementary material.
Ethical statement
Our surveys all received approval via American University’s IRB 2022-316 in 2022. Please see Section 6 in the online appendix for additional information on ethics.




 Open access

