


1. Introduction
Over the past decade, numerous design frameworks for circular economy (CE) implementation have been proposed and widely cited in literature. These include Reference Moreno, de los Rios, Rowe and CharnleyMoreno et al.’s (2016) conceptual framework for circular design, Reference Bocken, de Pauw, Bakker and van der GrintenBocken et al.’s (2016) product design and business model strategies, Reference Potting, Hekkert, Worrell and HanemaaijerPotting et al.’s (2017) 9R framework and the Ellen MacArthur foundation’s (2015) ReSOLVE framework. Despite this theoretical progress, the implementation of these frameworks in industry practice remains limited. The nature and severity of the barriers to implementation may vary significantly across different organizational contexts. Design producers (companies that design and produce their own products) face distinct challenges compared to design consultancies that develop products for clients. Design producers must navigate internal organizational structures, make long-term investments in circular business models, and manage complex supply chains, while design consultancies primarily encounter client-side barriers related to economic concerns and market demands. Similarly, small and medium-sized enterprises (SMEs) operate under different constraints than large corporations. SMEs possess limited financial resources and reduced influence over suppliers, making them more vulnerable to supply chain disruptions, while large companies have greater capacity for systematic design methodologies but may face challenges in coordinating circular initiatives across siloed departments.
Recent regulatory developments, particularly the Ecodesign for Sustainable Products Regulation (ESPR, Regulation (EU) 2024/1781) and the Corporate Sustainability Reporting Directive (CSRD, Directive (EU) 2022/2464), are promoting CE implementation. These regulations require substantial organizational resources for compliance and may differentially impact companies based on their size and structure. Understanding how these contextual differences influence CE adoption is essential for developing targeted strategies to advance implementation across the design sector. Yet, existing research has largely overlooked these distinctions, treating the design industry as a relatively homogeneous entity despite its considerable organizational diversity and the evolving regulatory environment in which it operates.
1.1. Existing research on circular economy barriers
Reference Kirchherr, Piscicelli, Bour, Kostense-Smit, Muller, Huibrechtse-Truijens and HekkertKirchherr et al. (2018) conducted an extensive study encompassing 208 survey respondents and 47 interviews to examine barriers to CE adoption. Their findings identified cultural barriers as the predominant challenge, including insufficient consumer demand, risk-averse company leadership, and inadequate regulatory frameworks. While their study included SMEs, it did not examine them specifically, nor did it investigate design consultancies.
Reference Diaz, Schöggl, Reyes and BaumgartnerDiaz et al. (2021) interviewed 15 product developers and sustainability experts from both SMEs and design consultancies. Their research explored the implementation of R-strategies and evaluation criteria in design work, indicating that organizational culture presents a significant barrier and requires closer integration with the product development process. However, their analysis did not differentiate between company types.
Reference Ruiz de Azua Lahidalga, Mendiburu-Valor, Justel and MendozaRuiz de Azua Lahidalga et al. (2025) investigated the power electronics sector through interviews with nine industry stakeholders. They identified critical gaps, including the failure to consider end-of-life implications during the design process and the lack of sustainable material alternatives. Their study did not focus on SMEs or design consultancies.
Reference Dokter, Thuvander and RaheDokter, Thuvander, and Rahe (2021) examined how design practitioners implement CE concepts, interviewing 12 professionals from architecture and industrial design. Although their sample included design consultancies, they concentrated on differences between architectural and industrial design practices rather than distinguishing between design consultancies and design producers or comparing company sizes. Their findings highlighted regulations and policies as barriers, reverse logistics as a challenge, and client hesitancy to embrace CE approaches due to financial risks and perceived cost increases.
Reference Bendixen, Jensen, Schmidt and LaursenBendixen et al. (2022) investigated barriers faced by design consultancies when creating long-lasting products through observation and interviews across three case studies. They identified value chain complexity, cost considerations, and long-term vision misalignment with clients as major obstacles. However, their research was limited to a single small design consultancy within the furniture industry and excluded design producers.
Reference Deviatkin, Rousu, Ghoreishi, Naji Nassajfar, Horttanainen and LeminenDeviatkin et al. (2022) analyzed CE strategy implementation in Finnish electronics companies, including six design producers but no design consultancies. Their findings revealed that companies primarily focused on reducing energy and material consumption in their products and could enhance circularity through increased emphasis on recycling. While their sample included both large companies and SMEs, they did not conduct comparative analysis based on company size.
Reference Rizos, Behrens, van der Gaast, Hofman, Ioannou, Kafyeke, Flamos, Rinaldi, Papadelis, Hirschnitz-Garbers and TopiRizos et al. (2016) specifically targeted SMEs and their implementation of CE business models, excluding large design producers and design consultancies. Using data from a literature review and case studies from the GreenEcoNet web platform, they identified major barriers including insufficient consumer demand, limited financial resources, and scarcity of sustainable materials.
1.2. Research gap and objectives
To the authors’ knowledge, no studies have specifically investigated differences in CE implementation between design consultancies and design producers, nor between SMEs and larger companies. Furthermore, several previously cited studies predate the introduction of ESPR and CSRD, both of which now require substantial company resources for compliance.
Against this background, this paper investigates what barriers and opportunities exist for implementing CE practices in small and large design producers and design consultancies today. The research employs semi-structured interviews with six Sweden-based companies, three design producers and three design consultancies, to examine where circular ambitions encounter obstacles, what enables progress, and which trade-offs designers face. The analysis utilizes an inductive coding scheme to systematically examine barriers and enablers.
This paper makes three distinct contributions to understanding CE implementation in the design sector. First, it investigates differences and similarities in challenges described by design producers and design consultancies, providing both internal and external perspectives on CE implementation. This contrasting approach offers a more complete understanding of where barriers exist. Second, it compares challenges faced by small and large design producers. SMEs represent a substantial portion of economic activity and environmental impact but possess fewer resources for regulatory compliance and CE strategy implementation. Despite this significance, CE adoption in SMEs remains under researched. Third, the paper provides an empirically grounded examination of current design practices and challenges following the introduction of ESPR and CSRD, offering insights into the evolving regulatory landscape.
2. Methodology
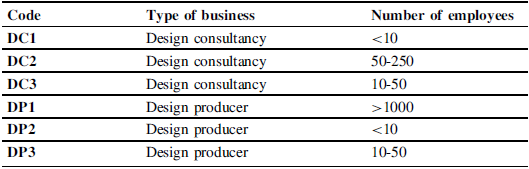
The interviews were conducted from April to June in 2025 with six companies in Sweden (see Table 1 for details). The companies were selected based on the criteria that they should have a sustainability strategy, and that they should be actively working on developing sustainable products within the electronics sector. Three of the companies developed their own products, and three were design consultancies. This enabled an inside and outside perspective on the design process and organization.
The interview questions were open-ended focusing on the companies’ long-term strategy and how it is implemented in their organization, critical aspects and challenges in designing for circularity and circular business models, and their relationship to their sub-suppliers.
The interviews were conducted in Swedish or English, in person or online, depending on what suited the participants best. The audio recordings from the interviews were transcribed using the online transcription tool TurboScribe (TurboScribe, n.d.), with manual corrections done afterwards. Each transcript was divided into paragraphs and coded. Based on an initial screening of the transcribed material, a preliminary coding scheme was set up, consisting of five main categories. To ensure validity of the coding scheme, the transcribed material was reviewed by both authors of this paper and the coding scheme was refined and clarified. The following main codes were identified.
-
1. Design Methods: Design choices, design processes, design for assembly/disassembly, product specifications, material selection as a design decision
-
2. Economic, Legal and Market: Financial, business model, legal, and market-related factors that affect the adoption of circular practices
-
3. Internal Organization: Structural issues, leadership, resources allocation, role definition, cross-functional coordination, organizational culture/resistance. If it’s about what people know or need to learn, code as Knowledge & Data. If it’s about organizational structure, mandate, or leadership, code as Internal Organization.
-
4. Knowledge and Data: This category focuses on challenges related to the understanding and data needed to enable circular design. Also includes ways of collecting data like Life Cycle Assessment (LCA) and Digital Product Passports (DPPs)
-
5. Value Chain: Supplier relationships, production capabilities/limitations of external partners, material availability from suppliers, logistics, scale/volume requirements
To evaluate the inter-rater reliability of the coding scheme, Krippendorff’s Alpha (Reference KrippendorffKrippendorff, 2019) was calculated on 10% of the complete data (67 samples). Each author independently coded the samples, and the results were input into the online tool K-Alpha Calculator (Reference Marzi, Balzano and MarchioriMarzi et al., 2024). The calculated value for Krippendorff’s Alpha was 0.846, which indicates a satisfactory level (>0.8) of inter-coder reliability (Reference KrippendorffKrippendorff, 2019).
The transcribed interviews were coded using the qualitative analysis software NVivo 15 (Lumivero, n.d.), which was also used for calculating the frequency of the codes. Each interview was also classified based on the type of company (design consultancy or design producer) and the size of the company (small with less than or equal to 50 employees, or large with more than 50 employees). The text associated with each code was also reviewed qualitatively by each author and used to contextualize the results.
Organizations interviewed

3. Results and discussion
Based on the coded transcripts, the analysis was done first on an organizational level, as described in Section 3.1, and on a thematic level, as described in Sections 3.2–3.6.
3.1. Comparison between different types of organizations
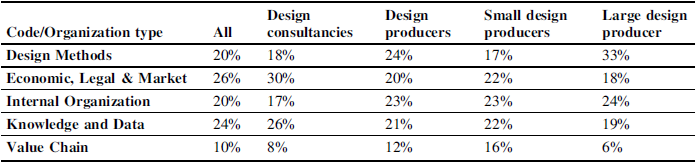
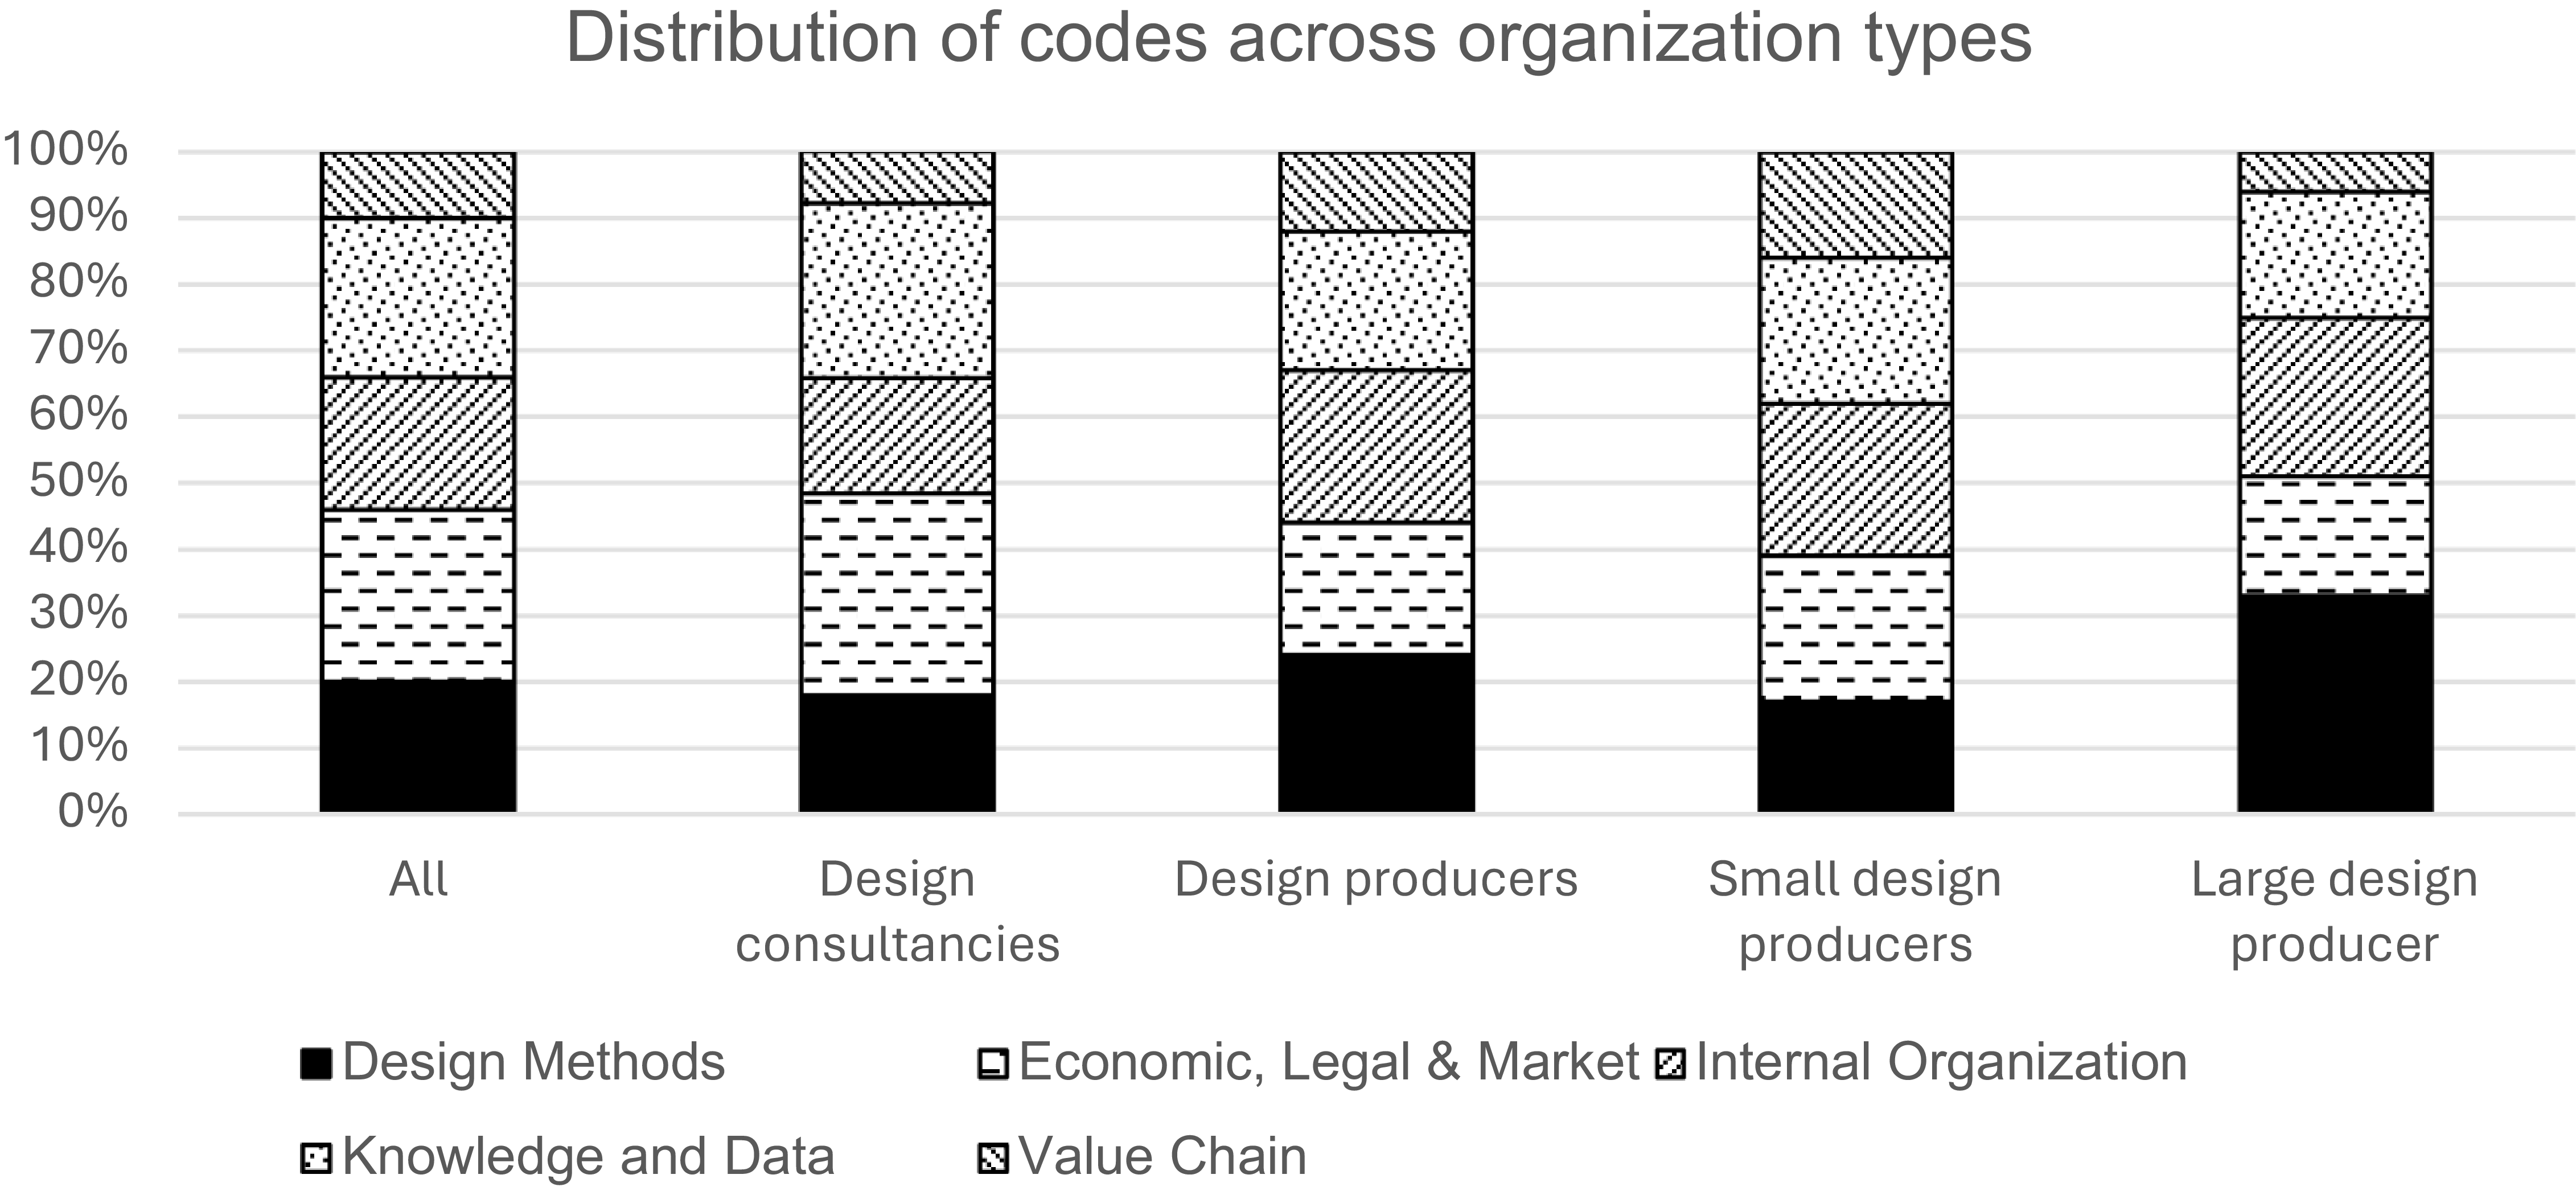
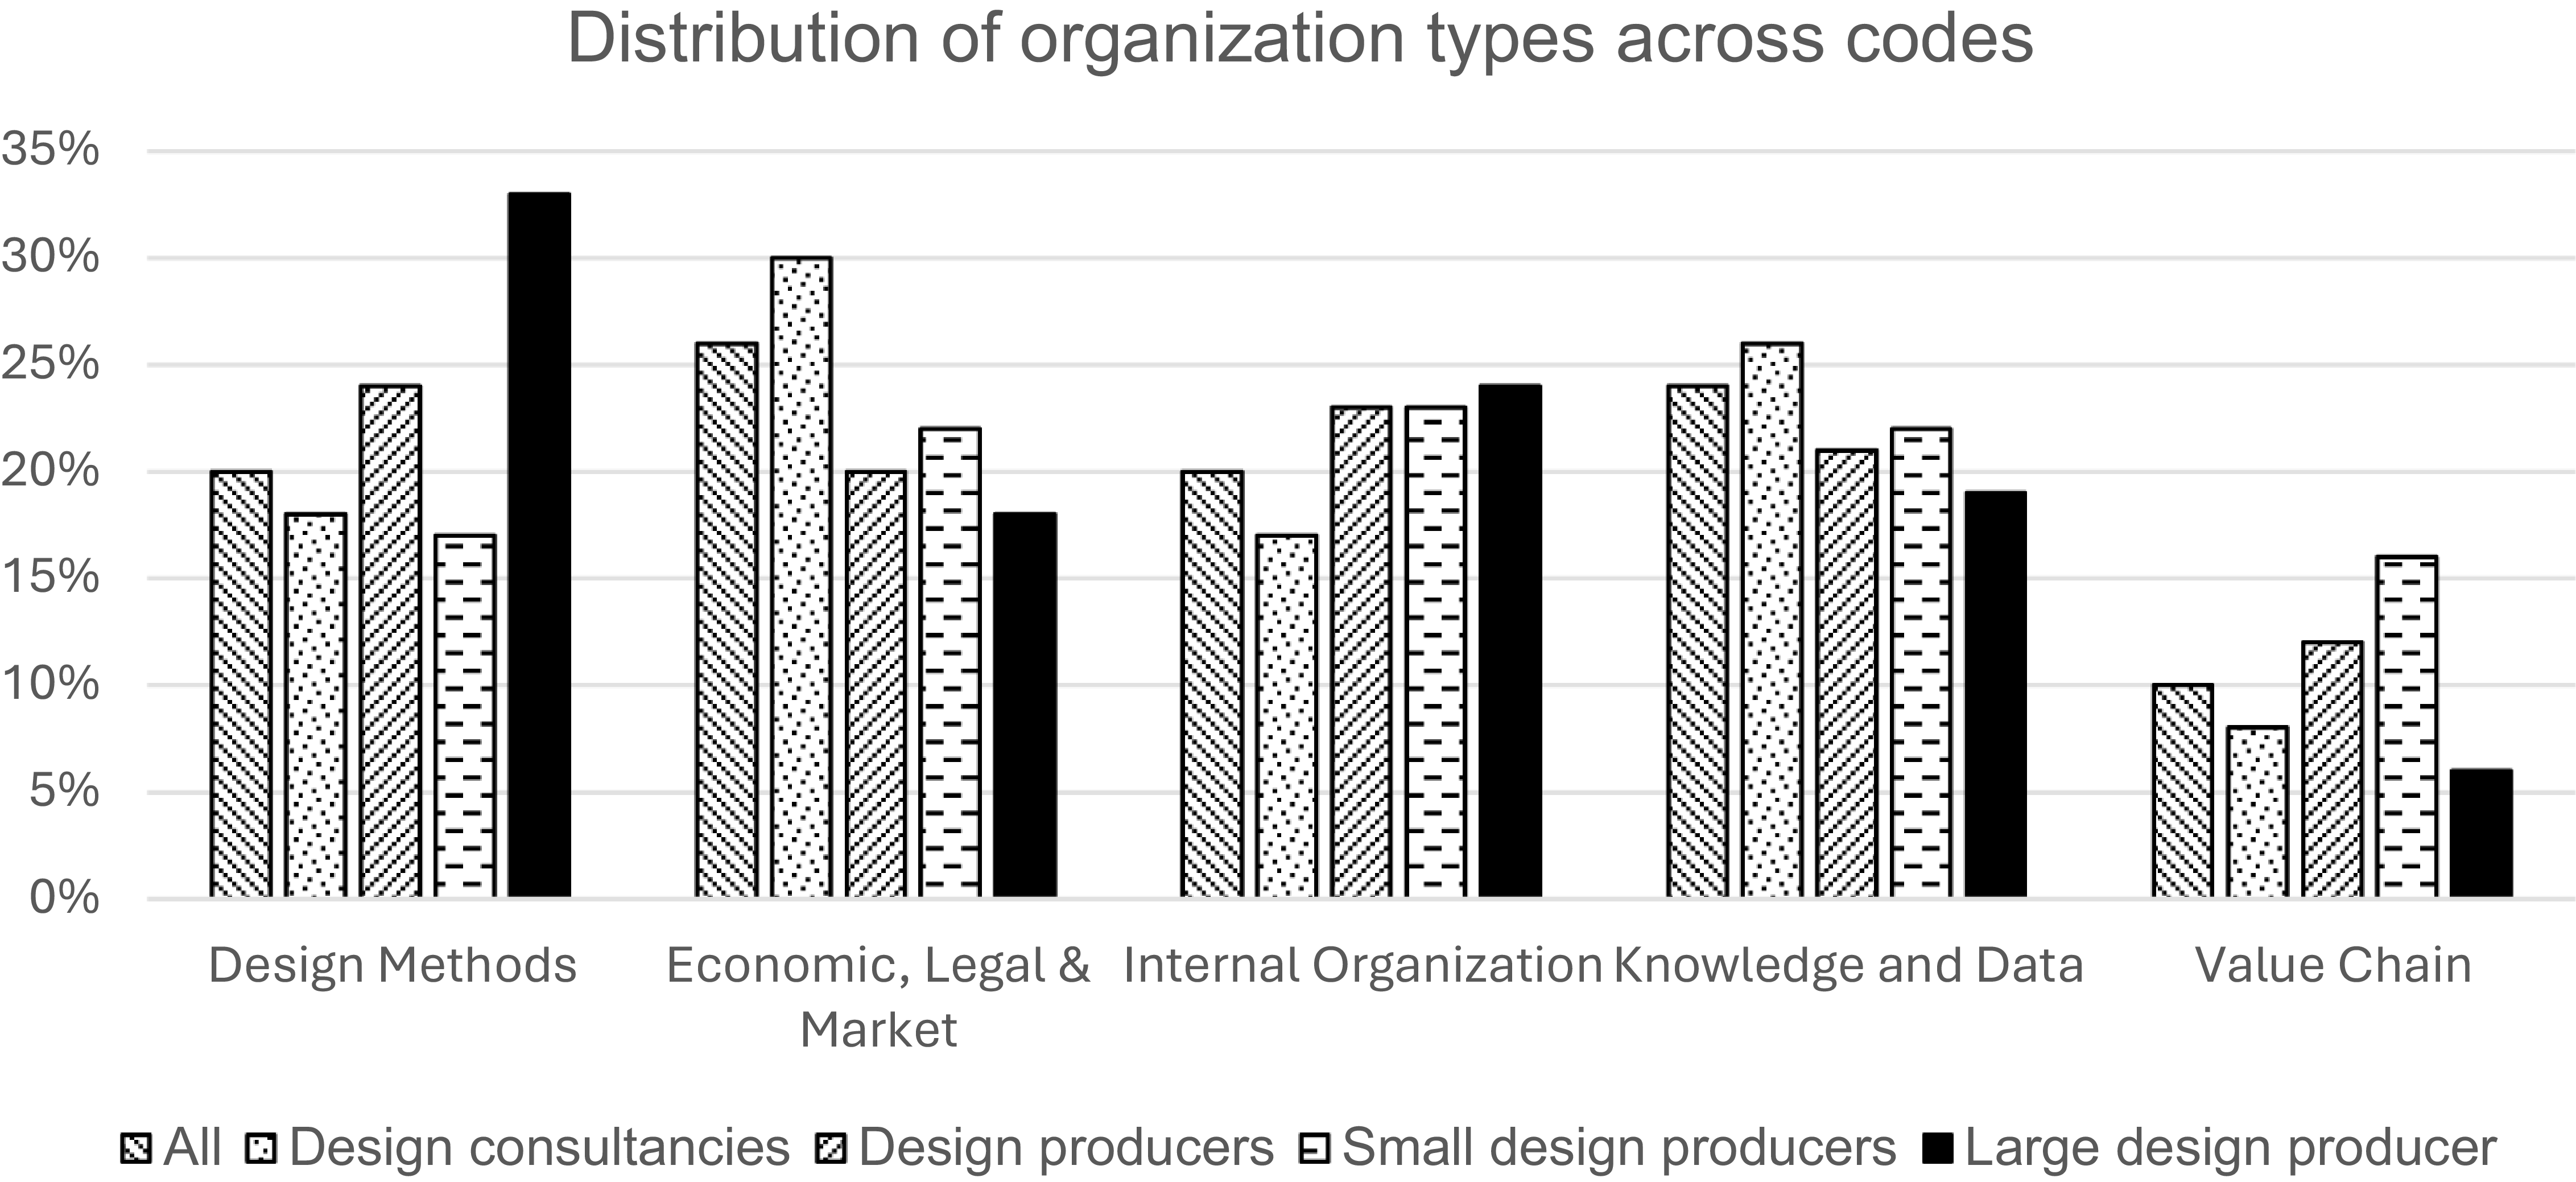
Based on the data presented in Table 2, Figure 1, and Figure 2, some conclusions regarding the differences between the categories can be drawn.
Overall, the most discussed topic is Economic Legal & Market, closely followed by Knowledge and Data. The least discussed topic is the Value Chain.
Comparing small design producers to large design producers, the results show that the small design producers bring up the value chain more than twice as often as the large design producer (16% vs. 6% of the codes). The large design producer brings up design aspects almost twice as often as the small design producers (33% vs. 17% of the codes). The most consistently discussed topic is the Internal Organization (23-24% of the codes), indicating that this is an issue both for large and small design producers.
Comparing design consultancies to design producers, the results show that the design consultancies discuss the economic, legal and market aspects more often than the design producers (30% vs. 20% of the codes). The design producers instead discuss design aspects more than the design consultancies (24% vs. 18% of the codes). The design consultancies discuss knowledge and data more than the producers (26% vs. 21% of the codes). The design producers discuss the internal organization more than the design consultancies (23% vs 17%)
Frequency of codes across organization types

Distribution of codes across organization types

Distribution of organization types across codes

3.2. Internal organization
The most mentioned barrier to the implementation of a circular strategy among the interviews is siloed thinking and a lack of coordination between departments regarding circularity (5.7% frequency and mentioned by all except DC1). As DC3 describes it, many of their client companies have a sustainability manager quite high up in the management hierarchy, but they either lack authority to make decisions or do not have a coordinating role and may not have a product development background. DP1 shares this view, and states that the sustainability manager has often mainly been a regulatory role, tasked with ensuring that the products meet legal requirements. However, they have not been integrated into the product development teams, and they do not have a focus on circular solutions. DC3, DP1 and DP3 agree that this leads circular initiatives to being quite isolated to individuals or small teams, whereas larger decisions regarding the supply chain, marketing, sales or business models remain difficult to influence.
Instead of being driven by top management, all companies interviewed mention that change tends to be driven mainly by individual enthusiasts that take it upon themselves to convince management to implement more circular solutions, often driven by sustainability rather than business reasons.
3.2.1. Support from company owners and upper management
The interviews show that a key factor for implementing circular business models is support from leadership (4.3% frequency and fourth most coded subcode and mentioned by all interviewed companies except DC1). When company leadership promotes circularity, profitability is not necessarily the main driver, but rather the ethical considerations of the company and their outward image toward their customers (DC3, DP2 and DP3). Two of the design consultancies (DC2 and DC3), however, stated that this has become less of a priority for the big brands in recent years.
3.2.2. Internal strategies
All of the interviewed companies have internal overarching strategies for sustainability, often linked to CSRD or ISO 14001, however, the level of implementation differed. DP1 and DP2 did not have a long-term actionable plan or vision on the R&D level, even if they were actively trying to develop more sustainable products.
3.3. Economic, legal and market
The perceived cost of offering a circular solution is the second most mentioned barrier in the interviews (4.5% frequency) as a reason for why company leadership is reluctant to adopt more circular solutions. Another barrier is the short timelines associated with traditional linear business operations (2.2% frequency). With a linear business model, profit is expected once the product has been shipped, whereas circular business models like Product-as-a-Service (PaaS) or take-back programs have longer horizons before they become profitable. Moreover, the companies are all heavily invested in a linear business model that they have been optimizing for many years with complex supply chains and there is a large inertia in making changes. One of the design consultants, DC3, who have worked for several larger companies notes that they have instead opted to isolate the circular initiatives into separate start-up companies. All the design consultants find it difficult to convince company leadership to consider other business models while the current remains highly successful. This is also connected to the lack of circular literacy among leadership (see Section 3.4.2).
All except DC1 mention a lack of demand for circular solutions from the customers as a barrier (4.1% frequency and the fifth most common subcode). This varies depending on the market, with DC2, DC3, DP1, and DP2 indicating that marketing sustainable solutions in the US market is more difficult than in the EU. This creates barriers for companies with a presence in both markets. DC2 states that they have never had a project where sustainability or circular business models have been the main priority.
DC2 and DC3 highlight the importance of working with the marketing and sales departments to make circular offers attractive to the customers. Traditional sales arguments aligned with a linear business model need to be adjusted from just focusing on performance, quality and price, to focus more on lifecycle benefits and ethical considerations. DC3 mentions that they have a lot of internal competences regarding marketing and overall company strategy for circular business models, but that being a design consultancy, their clients rarely come to them with management-related projects. Instead, they go to management consultancies, even though they often lack the capabilities to link management to product development, materials and production, which can be crucial for understanding which strategies are suitable for the company.
3.3.1. Legislation and procurement
Public procurement and legislation are frequently mentioned as enablers and incentives for moving to more circular solutions (4.3% frequency and the third most common subcode). At the same time, there are some uncertainties associated with coming legislation that make it difficult for businesses to fully invest in changes. According to DP3, new legislation is also a challenge when working with a complex network of suppliers, often overseas, who might have different priorities and timeframes compared to the product developing company. This is also related to the perceived lack of influence over the supply chain expressed by the small product producing companies, as discussed in Section 3.5.
3.4. Knowledge and data
Within the larger design producer, DP1, the interview showed that the knowledge and skill level among the designers is good, and that there is strong motivation among individuals to promote circular solutions. The situation in the smaller companies (DP2 and DP3) is more varied, and according to one of the design consultants, DC3, they must spend more time educating the engineers regarding circular systems when working with SMEs. DC2 and DP3 mention that R&D teams engage in knowledge building activities like workshops, lectures and attending conferences, especially regarding new materials. Even so, DP1 and DC2 state that uncertainty regarding new materials and their performance, availability, and risks of recycled and bio-based options holds adoption back.
3.4.1. Standardized data and metrics
All interviews bring up the lack of standardized data and metrics as a barrier (4.1% frequency and the sixth most common subcode). The siloed nature and lack of coordination, as discussed in Section 3.2, can be seen as a symptom of not having clearly defined metrics regarding circularity integrated into all parts of the organization, as mentioned by DC3. The purchasing and logistics departments may focus mainly on cost and time, while the product development teams may already focus more on sustainability metrics like CO2 emissions or product lifespan. Sustainability reporting is brought up in three of the interviews (DC2, DC3 and DP3), but they are focused on the organization as a whole, rather than on individual products, which makes it a blunt tool on the product level.
In terms of missing data, it’s mainly two types of data that is requested: user data (3.2% frequency) and material/part data (2.8% frequency). Many of the products that the interviewed companies work with have a complex network of suppliers that produce parts for the main products. All of the companies state that it is challenging to get the suppliers to provide detailed data on, for instance, electronic components. Half of the interviewees (DC1, DC2 and DP2) state that more research into gathering data on actual impact of different materials, processes, business models need to be undertaken and made available in a standardized way that is useful for product developers and decisions makers.
All interviews also bring up the need to better understand the user willingness to participate in a circular offering. DC2 states that they frequently use trend reports and surveys to gauge the willingness of the market to for instance extend the life of products by repair. On the other hand, DC2 also states that there is a lack of user studies being carried out by the companies to ensure that the users are willing and able to, for instance, replace batteries or do minor repairs. They also state that there is a lack of data on how the customers may respond to product performance being reduced by adopting a more circular design if, for instance, the thickness of a phone is increased to facilitate easy battery replacement.
3.4.2. Circular literacy among management
Another barrier that is brought up by all of the design consultants is the lack of circular literacy among upper management (2.9% frequency). According to DC1 and DC3, the consultants often need to educate managers to make them realize that it makes sense from a business point of view to investigate circular solutions. However, as DC3 mentions, a design consultancy is not often in the position to drive change within an organization. DC1 and DP2 state that they seek out opportunities to hold lectures about circularity and the work they are doing. This is not only a promotional strategy but also a way to educate their current or potential customers about circularity.
3.4.3. Digital product passports
A tool that is brought up in three of the interviews (DC1, DC3 and DP1) as a potential enabler are DPPs. A lot of hope is put on DPPs to help solve the earlier mentioned lack of data on user behavior and material streams, but most of the companies have only started experimenting with them, so it remains to be seen how useful they will be in practice. It should be noted that currently, the implementation of DPPs is mainly focused on providing data to consumers and downstream parts of the supply chain, while feedback to the design producer is not prioritized.
3.4.4. Life cycle assessment
The most frequently mentioned source of data is LCA (3.8% frequency and mentioned by DC2, DC3, DP1 and DP2). However, most interviewees agree that it is not especially useful in the concept development phase as it is too slow and expensive to conduct comprehensive LCAs. Instead, it is used to benchmark a few of the products in the portfolio to get a baseline from which they can work and used for compliance and reporting after the product is ready for production. Two of the interviewees (DC3, DP1) request tools for faster LCA estimates that can be used for screening concepts.
Regarding emissions reporting, there is some skepticism among the interviewees (DC2, DP2) regarding the usefulness of these to drive the circular transition and development work forward. As they state, it is impossible to measure everything and include every single factor in the system you are analyzing. Moreover, methods differ between companies and one company states that it’s too easy for competitors to greenwash or climate compensate without making any actual improvement on their products.
3.5. Value chain
As can be seen from the results in Table 2, small product producing companies mention the value chain more than twice as often as the large design producer (16% vs 6%), especially in terms of the limitations of partners and suppliers and a feeling how low control over the value chain.
The smaller companies interviewed (DP2 and DP3) feel that they are too small to put pressure on their suppliers by themselves. While DP3 has organized themselves into larger clusters to help put pressure on the suppliers for social and to some extent environmental sustainability (such as amfori (n.d.) and Position Green (n.d.)), they feel there is still a need for more coordination between companies.
Another complexity brought up by DC3 is how to choose the right suppliers when considering a future circular transition. While two suppliers may look identical on paper today, one supplier might be much better suited to transitioning to, for instance, renewable energy, than the other. Another question is how well the suppliers can be clustered together to reduce transportation, and to what extent industrial symbiosis can be created over time.
At the other end of the value chain are the retailers. DP1and DP3 discuss these as both an enabler and a barrier to circular business models like PaaS and take-back programs. DP1 states that they have spent a considerable amount of time building a retail network, but the retailers may not be interested in adopting a new business model. At the same time, DP1 is reluctant to start retailing directly to the customers, with fears of losing their existing retail partners.
DP3 states that they would have to partner with another company that has already provided take-back systems or refurb programs to streamline the process of handling customer data and reverse logistics.
3.6. Design methods
All the companies interviewed agree that they have the circular design methods they need for the most part. In many cases (DP1, DC2 and DC3) they have based their internal tools on external ones and have adapted them to their internal process or need, with a focus on high-level general aspects that can easily be used by the engineers. Among the various design methods mentioned in the interviews, the most common is design for longer lifespan (five interviews), design for disassembly (four interviews), design for repair (three interviews) and design for PaaS (three interviews).
3.6.1. Pilot projects
Pilot projects are mentioned in three interviews (DP1, DP3, DC3) as potential enablers for showing leadership the feasibility of circular solutions. However, DC3 warns that pilot projects can come with a risk of failing if they are not given enough time or if the marketing has failed to create a demand among the customers for a more circular solution. DC3 states that pilot projects may be too small to really enable the company to pilot a circular business model, for instance. In these cases, a failed pilot may make initiating new circular projects difficult.
3.7. Comparison to other results in literature
While previous studies in literature have highlighted the user perspective as important to include in the design process (Reference Selvefors, Rexfelt, Renström and StrömbergSelvefors et al. 2019, Reference Wastling, Charnley and MorenoWastling et al. 2018, Reference Lofthouse and PrendevilleLofthous & Prendeville, 2018), previous studies with design practitioners have not shown this to be a major concern in the design process (Reference Dokter, Thuvander and RaheDokter, Thuvander & Rahe, 2021). Our results indicate that design practices have changed within the companies interviewed. All the interviewees highlighted the importance of including the user perspective in the design process, and the need for better user understanding enabled through, for instance, DPPs.
DPPs have been highlighted in literature as enablers for CE to facilitate repurposing and recycling materials (Reference Diaz, Schöggl, Reyes and BaumgartnerDiaz et al., 2021, Reference Ruiz de Azua Lahidalga, Mendiburu-Valor, Justel and MendozaRuiz de Azua Lahidalga et al., 2025) and design for disassembly (Reference Dokter, Thuvander and RaheDokter, Thuvander & Rahe, 2021). However, their role in understanding user behavior has not been as explored among design practitioners, and it remains unclear how feeding user data back to the product producing companies would work in practice.
Studies on the implementation of design strategies for CE have found that most focus on narrowing and slowing the loops (Reference Ruiz de Azua Lahidalga, Mendiburu-Valor, Justel and MendozaRuiz de Azua Lahidalga et al., 2025, Reference Deviatkin, Rousu, Ghoreishi, Naji Nassajfar, Horttanainen and LeminenDeviatkin et al., 2022). Product development efforts are focused on minimizing material and energy consumption in the use-phase of the product and extending the lifetime of the product, while few companies focus on closing the loops (Reference Ruiz de Azua Lahidalga, Mendiburu-Valor, Justel and MendozaRuiz de Azua Lahidalga et al., 2025). This is in contrast to the academic focus on closing the loops through waste management and recycling (Reference Merli, Preziosi and AcamporaMerli et al., 2018, Reference Köpman and MajavaKöpman & Majava, 2024). Our results indicate that the focus of the interviewed design practitioners has somewhat shifted, with design for disassembly, and repair, as well as recycling and recycled materials being discussed frequently in the interviews.
4. Conclusions
The aim of this paper has been to explore differences in CE implementation between design consultancies and design producers and between small and large design producers through an empirically grounded examination of current design practices and challenges.
The findings reveal significant differences in how organizational type and size influence CE implementation priorities. Small design producers discuss value chain challenges more than twice as often as their larger counterparts, reflecting their limited influence over suppliers and greater vulnerability to supply chain disruptions. Conversely, the large design producer emphasizes design aspects nearly twice as frequently as small producers, likely due to greater resources for systematic design methodologies. Between organizational types, design consultancies focus more heavily on economic, legal, and market considerations, while design producers give greater attention to design aspects. These differences underscore the need for tailored approaches to CE adoption that account for organizational context.
Across all interviewed companies, organizational barriers emerge as the most significant challenge. Siloed thinking and inadequate cross-departmental coordination regarding circularity represent the most frequently mentioned barriers to circular strategy implementation. Related to this, all companies report that circular initiatives are typically driven by individual enthusiasts who must convince management of the importance of more circular solutions, rather than being strategically integrated in organizational structures. Leadership support emerges as a critical enabler for implementing circular business models yet remains inconsistently present across the organizations studied.
Economic and regulatory factors play dual roles as both barriers and enablers. The perceived cost of circular solutions constitutes the second most mentioned barrier, with companies expressing concern about short-term profitability impacts and hesitance to disrupt established linear business models. However, public procurement and legislation are frequently cited as important enablers and incentives for advancing circular solutions, suggesting that regulatory frameworks can help overcome economic resistance.
Compared to previous studies, this research reveals two notable shifts in design practice. First, practitioners demonstrate increased focus on understanding user behavior, with DPPs being identified as a potential enabler for gathering behavioral data. This represents an evolution in how practitioners approach the human dimension of design for circularity. Second, the results indicate a shift in where development efforts concentrate, with design practitioners more frequently discussing strategies for closing material loops through design for disassembly, repair, and recycling, rather than solely focusing on narrowing and slowing loops through efficiency improvements and lifetime extension.
4.1. Future recommendations
The findings point to several areas requiring additional research and support. SMEs need more resources and collaborative frameworks. These frameworks could help SMEs coordinate with other actors to gain enough financial pressure to incentivize overseas suppliers to adapt CE practices, even if not mandated by current regulations. For large design producers, better methodologies for incentivizing and road mapping internal organizational change are needed to enable sustainability managers to secure upper management support and break down departmental silos. Further research is also needed on the practical implementation of DPPs or similar digital records for gathering user behavior data, as well as on effective strategies for shifting from pilot projects to scaled circular business model implementation. From a regulatory perspective, a standardized pathway for companies to get access to user data would enable more informed design decisions.
4.2. Research limitations
The results in this paper are based on six interviews conducted with Swedish companies with a sustainability strategy within the electronics industry. As such, the conclusions might not be valid for other regions or sectors. A more in-depth study with companies from different regions could reveal how differences in local regulation, innovation ecosystems and consumer attitudes affect the perceived opportunities and barriers to CE implementation.
Acknowledgement
This research was supported by the Swedish Energy Agency (project number P2024-00773).

 Open access

