


1. Introduction
Increasing concerns about health, environmental, and social issues caused by inappropriate pesticide use led to the introduction of the EU Framework Directive 2009/128/EE (EUFD), intended to promote the adoption of integrated pest management (IPM). However, the complexity of IPM, the crop- and area-based nature of these practices, and their diverse nature made the standardization of IPM impossible (Peshin, Vasanthakumar, and Kalra, Reference Peshin, Vasanthakumar, Kalra, Peshin and Dhawan2009; Barzman et al., Reference Barzman, Bàrberi, Birch, Boonekamp, Dachbrodt-Saaydeh, Graf and Lamichhane2015; Lefebvre, Langrell, and Gomez-y-Paloma, Reference Lefebvre, Langrell and Gomez-y-Paloma2015). The many IPM options make it hard for farmers to choose the IPM strategy that matches their circumstances and goals. Moreover, uncertainty about the effectiveness of alternative IPM strategies in particular circumstances means that the choice of strategy is risky, which may discourage some risk-averse farmers from adopting IPM. In this paper, we compare conventional and IPM cropping systems for risk-averse Norwegian farmers, accounting for a plausible range of risk aversion.
Benefit–cost analysis has been favored in most economic evaluations of IPM practices in Europe. Bale, Van Lenteren, and Bigler (Reference Bale, Van Lenteren and Bigler2008) concluded that, on the basis of benefit–cost ratios, biological control is highly preferred over chemical control. Subsequently, Boussemart Leleu and Ojo (Reference Boussemart, Leleu and Ojo2016) compared the use of pesticides with available pesticide substitutes and concluded that agriculture practices with fewer pesticides are more profitable. However, those studies mainly focused on one or few IPM practices, rather on whole cropping systems, so the interaction effects of different IPM practices within one cropping system were not fully considered. Vasileiadis et al. (Reference Vasileiadis, Moonen, Sattin, Otto, Pons, Kudsk and Pelzer2013) used a decision model that was both hierarchical and qualitative to evaluate and compare the economic and environmental sustainability of maize-based IPM cropping systems across four European regions. Their conclusion was that innovative IPM systems applied in the four regions were more environmentally sustainable than the current rotational systems and were equally as economically sustainableFootnote 1 as the current systems. Mouron et al. (Reference Mouron, Heijne, Naef, Strassemeyer, Hayer, Avilla and Alaphilippe2012) evaluated apple farming systems, comparing results from five European regions, and found that, in some of the tested regions, the increased cost of using IPM was fully compensated for by higher yields. However, the last mentioned two analyses were largely based on qualitative judgments by experts. The quantitative data used were limited to just a few growing seasons, insufficient to represent the risk of adverse economic outcomes.
In addition to the limitations of previous studies, noted above, decision-makers’ risk preferences have seldom been taken into account in IPM-based analyses. Pannell (Reference Pannell1991) and Marra, Pannell, and Ghadim (Reference Marra, Pannell and Ghadim2003) argued that, for a better understanding and explanation of agricultural technology adoption, it is important to include farmers’ attitudes to risk. Many authors have studied the effect of farmers’ risk attitudes on technology adoption, for example, Feder (Reference Feder1980), Chavas and Holt (Reference Chavas and Holt1996), Koundouri et al. (Reference Koundouri, Laukkanen, Myyrä and Nauges2009), and Gandorfer, Pannell, and Meyer-Aurich (Reference Gandorfer, Pannell and Meyer-Aurich2011). Cochran, Robison, and Lodwick (Reference Cochran, Robison and Lodwick1985) evaluated strategies (including IPM) in apple production and accounted for risk aversion by using stochastic efficiency analysis. Greene et al. (Reference Greene, Kramer, Norton, Rajotte and McPherson1985) also used stochastic efficiency analysis to analyze alternative pest management strategies in soybean production in Virginia. In a similar vein, in this paper, we seek to account for risk and risk aversion in the choice between IPM and conventional cropping systems in Norway.
2. Aims
Our aim is to evaluate the risk efficiency of IPM-based Norwegian cropping systems. The particular climatic conditions and landscape traits in Norway differ from those in other European states, so that evaluations of IPM conducted in other parts of Europe are not applicable to the Norwegian case, where crops have a short growing season and the majority of farms are small. Moreover, agriculture in Norway is supported by the government in different ways, and generally more substantially, than in other European countries.
Our evaluation of the risk efficiency of IPM-based cropping systems in Norway is intended to support decision-making by Norwegian farmers, policy makers, and other stakeholders. While our results are specific to Norway, aspects of our methods may be of relevance to other such studies in other countries. Based on our knowledge, by looking at effect of farmers’ risk preferences in a whole-farm perspective, our study is a more complete analysis of IPM than most earlier IPM studies.
3. Methods
We were fortunate to have access to relevant quantitative empirical data. Our analysis is based on 10 years of experimental field-level data from a field experiment in southeastern Norway. Using these data, we applied recent prices to outputs and updated costs and subsidies to recent levels to derive, via a stochastic simulation model, distributions of net farm income for each of conventional and IPM cropping. Finally, we evaluated the risk efficiency of the assessed distributions using stochastic efficiency analysis, with various assumptions about the risk attitudes of target farmers.
In the next section, we provide information about the 10-year field experiment. Next, we describe our stochastic net income model and its variables, including the updating of prices and costs. We then report on the stochastic efficiency analyses we conducted and the paper concludes with a discussion of the results and conclusions.
3.1. Experimental data and cropping systems
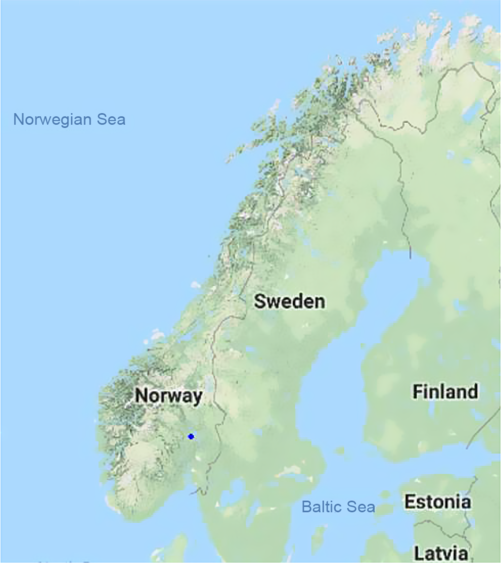
For this study, we used data from the long-term cropping systems experiment by Norwegian Institute of Bioeconomy Research (NIBIO) at Apelsvoll (Eltun, Reference Eltun1994). Apelsvoll is located in the southeast of Norway (see Figure 1), a farming region dominated by cereal and ley production. The location is moderately representative of other cereal-farming areas of Norway.
The experiment was established in 1989 on a 3.2 ha field with tile-drained plots, comprising 12 blocks (30 m by 60 m) separated by 7.5 m wide grass border zones. The climate in this area is humid continental, with annual average precipitation of 600 mm, and an average temperature of 12°C in the growing seasons, which normally lasts from May to September (Korsaeth, Reference Korsaeth2012). The soil on the experimental site is mainly loam and silty sand, classified as an Endostagnic Cambisol (Riley and Eltun, Reference Riley and Eltun1994).
Six cropping systems, each with two replicates, were established on the 12 blocks using a randomized complete block design. The systems included both cash crop production (cereals and potatoes) and mixed dairy production (both arable and fodder crops). When designing and operating the systems, efforts were made to make them representative of real farms in the region, and this concept has been followed during later changes to the management of the systems. Data from the three cash crop systems, covering the period 1991–1999, have been used previously for economic risk assessment (Lien et al., Reference Lien, Flaten, Korsaeth, Schumann, Richardson, Eltun and Hardaker2006; Lien, Hardaker, and Flaten, Reference Lien, Hardaker and Flaten2007a). However, IPM regulation and practices in Norway became more developed after 2000. These new practices and regulations were applied to the IPM-level cropping system in the experiment from 2001. We therefore decided to use data from the experiment for the period 2001–2010 to reflect current IPM practices.
Our rationale for using data from the cropping system experiment instead of using data from real farms is that farm practices change more or less continuously over time with new technology, changed regulation, etc., which makes it hard to find sufficient and reliable long-term data for analysis. By contrast, using data from the experiment, it is possible to compare effects of management on the same soil and under the same weather conditions, thereby reducing “noise”, which might otherwise compromise the analysis.
IPM generally requires the combination of carefully considered pesticide use and nonchemical strategies, such as crop rotation and cultivation (Benbrook, Reference Benbrook1996). We decided to compare two cropping systems from the experiment, one being the conventional cropping system that includes few IPM practices and the other being a system where IPM practices have been largely and consistently implemented over the 10 years study period. In Table 1, we have summarized the characteristics of the conventional and the IPM cropping systems.
Characteristics of conventional and IPM cropping systems
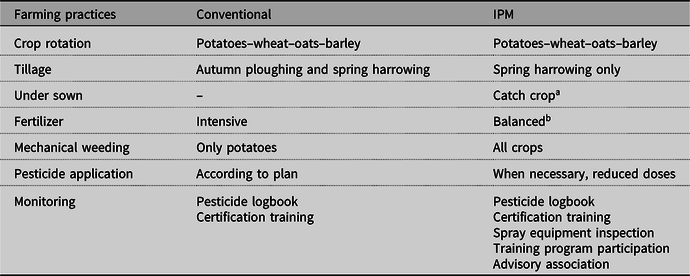
a A catch crop of ryegrass (perennial ryegrass following barley and wheat; Italian ryegrass following oats) was grown after the cereals to reduce weed development in autumn and to reduce the risk of nutrient leaching and runoff during late autumn and winter. Included in the short gap between the two main crops.
b Fertilizer application in spring was based on measurement of soil mineral N content and expert recommendation. For the cereals, split application of fertilizer was performed with about 75% given at sowing, and the rest applied at growth stage (GS) 37, with amounts depending on sensor measurements of plant N status at time of split fertilization.
Catch crops of ryegrass were included in the rotation for IPM, in which perennial ryegrass followed barley and wheat, whereas Italian ryegrass followed oats. The catch crops were sown only a few days after the cereals, at the time of the first weed harrowing, and ideally should not grow much in the presence of the cereal cover crops, to minimizing competition. However, these grasses grow quickly after the cereals are harvested in the autumn, until the temperature becomes too low for growth. In this period, the catch crops take up nutrients from the soil, in particular nitrates, which are otherwise exposed to losses via leaching and runoff during late autumn and winter. Moreover, the catch crops are also effective competitors with weeds for water, nutrients, and light, thus limiting weed growth during autumn.
Tillage in IPM was performed in spring only. This enabled the use of catch crops, but also had the advantage of reducing tillage-related erosion and nutrient losses during late autumn and winter; problems commonly enhanced by autumn ploughing (e.g. Korsaeth, Henriksen, and Bakken, Reference Korsaeth, Henriksen and Bakken2002).
The total fertilizer applications for IPM were about 4–10% less than those applied in the conventional system. Another difference between the two fertilizer regimes was that, for IPM, the fertilizer rates were adjusted to season-based growth conditions, which meant better synchronization between applied nutrients and the plant requirements.
Similarly, the use of pesticides for IPM was based on the assessed requirements, whereas a predefined scheme was followed for the conventional cropping treatments. The IPM scheme included the use of herbicides, fungicides, and insecticides for each crop of the rotation. In IPM, herbicides were used for cereals only when weed harrowing (performed either before seed emergence of the cereals or at growth stage 13–14) could not be performed owing to too wet conditions. On these occasions (occurring roughly every 4–5 years), rates of herbicides used corresponded to about 50% of a full dose (according to the specific product recommendation of the herbicide used). For potatoes, herbicides were used every year in IPM, with herbicide rates reduced to about 50% of a full dose. The potatoes under IPM were also treated with fungicides, whereas fungicide treatment of the cereals was performed only when there was a risk of diseases, as judged by weather conditions, field observations, and regional recommendations. A similar approach was used to regulate the use of insecticides for all crops.
3.2. Stochastic income model
The two cropping systems can be ranked in terms of risk efficiency by comparing the probability distributions of the incomes generated (Mahoney et al., Reference Mahoney, Olson, Porter, Huggins, Perillo and Crookston2004; Smith, Clapperton, and Blackshaw, Reference Smith, Clapperton and Blackshaw2004; Lien et al., Reference Lien, Flaten, Korsaeth, Schumann, Richardson, Eltun and Hardaker2006). We first built a model to calculate annual net farm incomes for each of 10 states corresponding to the 10 years of experimental results (Figure 2). The 10 discrete states where treated as equi-probable. For the two cropping systems, we used the averages of the two replicates. We assumed that both cropping systems have an area of 32 ha, approximating the average size of cropping farms in the area. We assumed the 32 ha to be distributed equally among four crops, representing a crop rotation with 8 ha of each crop grown annually.
Map of Norway showing location of the experiment (the blue dot).
Net income model description.
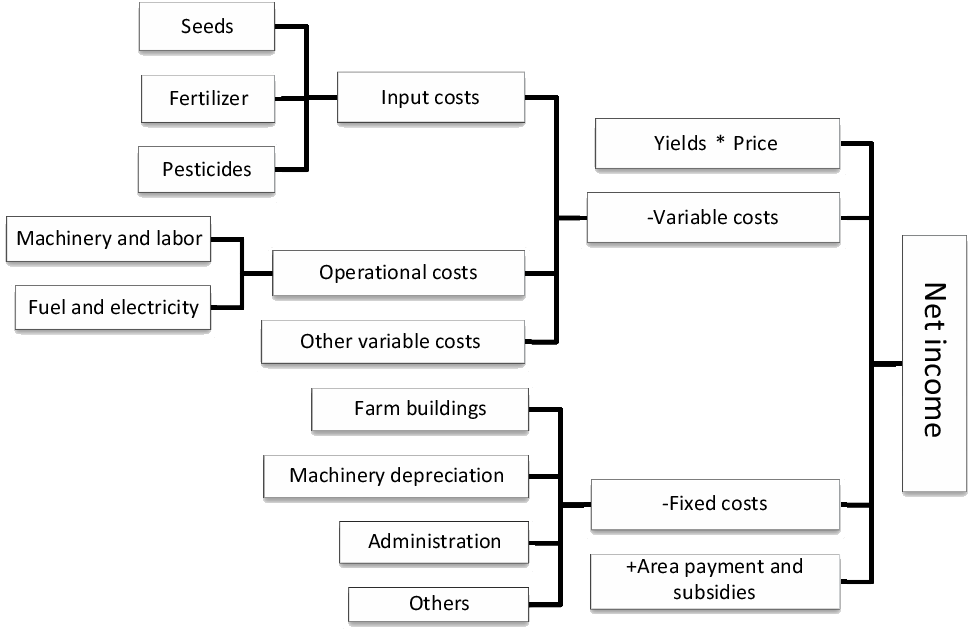
The mathematical form of the annual net farm income model is
 $${\widetilde{NI}_n = \sum\nolimits _{in}^{kn}S_{in}\left( \widetilde{Y}_{in}*\widetilde{P}_{in} - VC_{in} + AP_{in} + Sub_{jin} \right) - FC_n}$$
where ${\widetilde{NI}_n}$ is the stochastic net farm income of year n.
i…k stands for crops in rotation. Crops included are wheat, barley, oats, and potatoes.
- ${S_{in}}$ is the area for each crop i in year n in ha, assuming one-fourth of the cropped area is occupied by each of the four crops every year.
- ${\widetilde{Y}_{in}}$ is the stochastic yield per ha of crop i in year n in kg/ha.
- ${\widetilde{P}_{in}}$ is the stochastic/deterministic sale price per kg for crop i in year n.
- ${VC_{in}}$ is the deterministic variable costs per ha for crop i in year n.
- ${FC_n}$ is the deterministic fixed costs per farm in year n.
- ${AP_{in}}$ is the deterministic area payment (regional subsidy) per ha for crop i in year n.
- ${Sub_{jin}}$ is the deterministic subsidy j per ha for crop i in year n.


3.3. Description of variables for the stochastic income model
3.3.1. Yields
Farmers face the challenge of uncertain yields due to damage from bad weather, pest invasion (Lu, Teasdale, and Huang, Reference Lu, Teasdale and Huang2003), or crop diseases. The 2001–2010 empirical data collected from the previously described two cropping systems (Table 2) were used to represent the 10 equally likely states of nature for yields, reflecting the range of growing conditions affecting the trial plots. We assume that these 10 states are a good representation of the riskiness of farm yields.
Historical yieldsa of conventional and IPM cropping systems (kg/ha) and historical prices adjusted to 2018 level for wheat and potatoes (NOK/kg) (NOK = Norwegian kroner, USD 1.00 ∼ NOK 9.00)
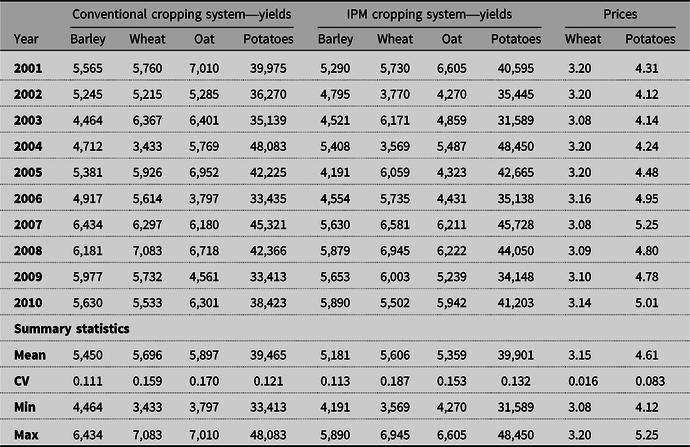
a Yields for cereals contain 15% moisture. Yields of all crops are yields of produce of saleable standard.
3.3.2. Prices
In Norway, policies are in place to protect farmers from low prices by a range of measures, including production quotas, import tariffs, and subsidy payments. These support measures are negotiated annually between the two farmers’ unions and the government (Knutsen, Reference Knutsen2006). Target prices are set for most commodities in the agricultural agreement. Thus, prices for most crops are reasonably assured, as for barley and oats. However, for some crops, such as for wheat and potatoes, quality variation and/or market conditions affect prices received.
Based on the protein percentage and “falling number” (indicating the amount of sprout damage), wheat is categorized as suitable for either human consumption or for animal feed. Wheat for human consumption attracts a higher price. Within each category, wheat price increases as the protein percentage of the product increases (Strand Unikorn, 2015). Therefore, wheat price is treated as stochastic, so that the price per state is determined in part by variation in the general price level between years and in part by the observed quality differences from year to year, as observed in the field trial. The wheat prices in Table 2 and used in the analysis are adjusted for inflation (2018 level, based on CPI).
Potato prices are market-determined, with large variation due to supply differences, so we treated potato prices as stochastic. Because past price variations have been wider than observed in the experiment, we collected the 2001–2010 annual average price information for potatoes from the Norwegian agricultural price reporting office (NIBIO, 2015) and adjusted for inflation (2018 level, based on CPI). We then used the adjusted data to represent the distribution of potato prices for the different states (Table 2).
Based on the discussion above, prices for barley and oats are assumed to be deterministic, fixed at the prices farmers got in 2018, that is, NOK 2.61/kg and NOK 2.38/kg for barley and oats, respectively (NIBIO, 2018).
3.3.3. Costs
For inputs such as seeds, fertilizers, and pesticides, quantities were taken from the average application rates recorded in the experiment, while prices were assumed to be deterministic at the 2018 price level (Table 3). Operating costs, including operating machinery, labor, and post-harvesting operations costs, were collected from the Norwegian Handbook for Agricultural Operation Planning (NIBIO, 2018), which reported the current machine contracting rates. Fixed costs, measured in NOK, were assumed to be equal to the average fixed costs for a typical Norwegian farm that has a size of approximately 32 ha and were based on data from Statistics Norway and the 2014 report of the Norwegian farm accountancy survey (NIBIO, 2014), adjusted to 2018 price level (based on the CPI).
A summary of costs, area payments, and other subsidies (NOK/ha) in 2018 price level
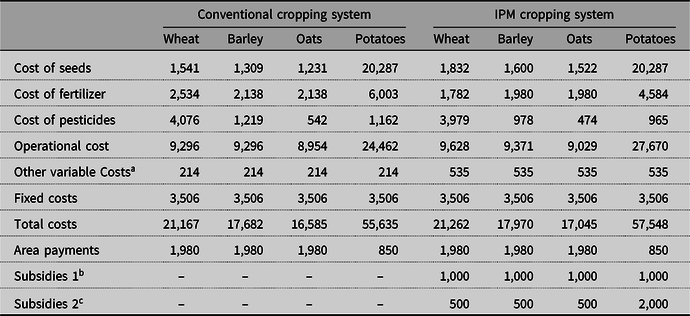
a Cost related to implementing IPM principles and regulations, that is, participating in training and advisory groups, pest monitoring.
b Subsidies for not ploughing in autumn.
c Subsidies for mechanical weeding and reduced pesticides usage.
Crop area payments in Norway are crop- and region-based. (What are called “area payments” are not paid by farmers, rather they are subsidies paid to the farmers.) The planted crops, landscape characteristics, soil quality, and the size of the farm determine the amount of area payment each farmer receives. In consideration of environmental impacts and soil runoff, tillage in spring rather than in autumn is recommended and is subsidized by the government, especially for farmland having a steep slope and lying close to water courses. Region-specific subsidies in Norway have been given to farmers where mechanical weeding and reduced pesticides have been applied. The regional subsidies are decided by the regional government and may vary from place to place. In our net income model, we included the subsidy payments based on the 2018 subsidy policies and the Oppland regional subsidy scheme (Fylkesmannen, 2018).
3.4. Stochastic simulation model
Since yields and wheat and potatoes prices were assumed stochastic, we specified a multivariate stochastic simulation model, where we used a copula to account for stochastic dependencyFootnote 2. Copulas allow joining together of separate marginal distributions of the individual stochastic variables, accounting for the stochastic dependency between these distributions (Hardaker et al., Reference Hardaker, Lien, Anderson and Huirne2015, pp. 64–78). Copulas allow for more flexibility in stochastic dependency compared to, for example, the multivariate normal distribution specification.
We chose to specify yields as empirical probability distributions, assuming continuous distributions, by interpolating between the specified points of the distribution, that is, piecewise linear distributions that closely reflected the experimental observations (see Table 2). An empirical yield probability distribution will “let the data speak” and in that way better reflect the observed data than applying some standard distribution such the normal distribution. We specified wheat and potatoes prices as PERT distributions. A PERT distribution is an assumed continuous probability distribution, defined by the minimum, most likely, and maximum values (Hardaker et al., Reference Hardaker, Lien, Anderson and Huirne2015, pp. 46–48). PERT stands for Program Evaluation and Review Technique, in which applications PERT distributions are commonly used. In specifying the wheat price PERT distribution we used a minimum price of NOK 2.75/kg, which is below the observed minimum wheat price from the experiment (NOK 3.08/kg, Table 2). This was done since NOK 2.75/kg is the price if the wheat is categorized suitable for animal feed only, not for human consumption. Although never observed in the long-term cropping system experiment, such an outcome is clearly possible in the event of unfavorable seasonal conditions.
The stochastic dependencies between the six distributions (yields of wheat, barley, oats, potatoes, and prices of wheat and potatoes), of the conventional and the IPM cropping systems respectively, were modeled with the Clayton copula. The Clayton copula belongs to the class of asymmetric copulas and exhibits positive lower tail dependency. It is fitted using the rank-order correlation measure called Kendall's tau (Hardaker et al., Reference Hardaker, Lien, Anderson and Huirne2015, pp. 68–71), which is a distribution-free correlation measure. Allowing for lower tail dependency can be regarded as a good property for our study, and for farm systems in general, since bad seasons can bring both low yields and bad quality of the output, affecting prices, while in good seasons the yields and prices are typically more variable.
The simulation model used was programmed in Excel and simulated using the Excel add-in Simetar© (Richardson, Schumann, and Feldman, Reference Richardson, Schumann and Feldman2008). In the simulation, Latin hypercube sampling was used with 10 000 iterations to estimate the performance variables for each of the two cropping systems.Footnote 3
The stochastic distributions derived above were combined with the deterministic barley and oats prices, and the deterministic costs and subsidy information described above were finally put into equation (1) to derive distributions of net farm income for the two systems as cumulative distribution functions (CDFs).
We also simulated net farm income for the IPM without regional subsidies, to be able to assess the role of these subsidies in promoting uptake of IPM by risk-averse farmers.
3.5. Stochastic efficiency analysis
We cannot directly compare the risk efficiency of the two distributions of net farm income, with and without IPM, because farmers’ attitudes to risk will vary. We therefore opted to compare the alternatives using stochastic dominance criteria that depend on particular assumptions about the nature of decision-makers’ preferences for risky income outcomes.
First-order stochastic dominance (FSD) requires only that decision-makers prefer more income to less. Then, distribution  ${A}$ is first-order stochastically dominant over B if and only if ${F_A}\left( x \right) \le {F_B}\left( x \right)$ for all x, where ${F_A}\left( x \right)$ and ${F_B}\left( x \right)$ are CDFs of two alternatives. Graphically, FSD means that F A(x) lies nowhere to the left of F B(x).
If FSD is not found, second-order stochastic dominance (SSD) may allow ranking of the alternatives if decision-makers prefer more income to less and are strictly not risk preferring. Then distribution A is second-order stochastically dominant over  ${B}$ if and only if for all x, with strict inequality at some x, ${\int_{-\infty}^x [{F_B}\left( t \right) - {F_A}\left( t \right)]dt \ge 0}$ (Hardaker et al., Reference Hardaker, Lien, Anderson and Huirne2015). Graphically, SSD involves comparing the areas between CDFs that cross. Only the option that lies to the right of the other at the minimum level of x is a candidate to dominate.
In some cases, FSD and SSD may not discriminate effectively between alternatives, in the sense that there are too many choices in the efficient set. While there are other more discriminating forms of dominance that can be tried, Hardaker et al. (Reference Hardaker, Richardson, Lien and Schumann2004) proposed an approach named stochastic efficiency with respect to a function (SERF) to compare the risk efficiency of different alternatives (Grove, Nel, and Maluleke, Reference Grove, Nel and Maluleke2006; Lien, Hardaker, and Flaten, Reference Lien, Hardaker and Flaten2007a; Lien et al., Reference Lien, Størdal, Hardaker and Asheim2007b; Pendell et al., Reference Pendell, Williams, Boyles, Rice and Nelson2007; Watkins, Hill, and Anders, Reference Watkins, Hill and Anders2008; Archer and Reicosky, Reference Archer and Reicosky2009; Grove and Oosthuizen, Reference Grove and Oosthuizen2010; William et al., Reference Williams, Llewelyn, Pendell, Schlegel and Dumler2010; Fathelrahman et al., Reference Fathelrahman, Ascough, Hoag, Malone, Heilman, Wiles and Kanwar2011). The SERF approach requires assumptions to be made about the form of the risk-averse utility function for the performance measure (income in our case) and about the range of degrees of risk aversion likely to include all or most decision-makers. SERF orders a set of alternatives in terms of certainty equivalents (CEs), that is, the net incomes for sure that the decision-makers would each be just willing to exchange for the uncertain income, given their individual attitudes to risk.
For each risky alternative and for a chosen form of the utility function, the utility of the probability distribution of income can be defined, for a given degree of risk aversion as:
 $${U\left( {x,\;r\left( x \right)} \right) = {\int} U\left( {x,r\left( x \right)} \right)dF\left( x \right) = \sum\nolimits_{i = 1}^m {\rm{U}}\left( {{x_i},r\left( x \right)} \right)P\left( {{x_i}} \right),\ {r_L}\left( x \right) \le r\left( x \right) \le {r_U}\left( x \right)}$$
where  ${r\left( x \right)}$ is the absolute risk aversion function of a decision-maker and lies between the lower bound ${r_L}\left( x \right)$ and the upper bound rU(x), and x in our case is ${\widetilde{NI}}$ in equation (1). The second term in the equation stands for the continuous case and is converted to its discrete approximation in the third term for computational purposes. The net income for each alternative can then be converted to its corresponding utility for selected values of the risk aversion function. ${P\left( {{x_i}} \right)}$ is the associated probability for each state (year), applied to calculate expected utility as the weighted average of the utilities.
Partial ordering of alternatives by utility values is the same as partial ordering by CEs (Hardaker et al., Reference Hardaker, Richardson, Lien and Schumann2004; Lien et al., Reference Lien, Hardaker and Flaten2007b). For ease of interpretation, the expected utility values were converted to CEs by taking the inverse of the utility function:
 $$CE\left( {x,r\left( x \right)} \right) = {U^{ - 1}}\left( {x,r\left( x \right)} \right)$$
The SERF approach is dependent on setting a plausible range for the degree or risk aversion of the decision-makers under consideration. Risk aversion can be assumed to derive from the diminishing marginal utility of wealth (w) as wealth increases, typically measured by the relative risk aversion function r r(w). Anderson and Dillion (Reference Anderson and Dillon1992) proposed a categorization of degree of risk aversion based on the relative risk aversion for wealth, r r(w) from 0.5 (hardly risk averse) to 4.0 (extremely risk averse). We chose in our study the negative exponential function with constant absolute risk aversion as the utility function in terms of income to derive expected utility values, which were then converted to CEs for a range of degrees of risk aversion. Using the identity r a(w) = r r(w)/w and assuming that absolute risk aversion with respect to wealth, r a(w) is approximately constant for an additive change in w, we can say that r a(x) = r a(w) (Hardaker et al., Reference Hardaker, Lien, Anderson and Huirne2015, pp. 96–98). Since the outcomes in this analysis are in terms of income, not wealth, we can therefore write r a(x) = r r(w)/w. Then the relevant range of r a(x) for our purposes depends on both the above range in r r(w) and the level of wealth, w across client farmers, leading to the specification of the range of r a(x).
Finally, since maximizing CE is equivalent to maximizing expected utility, when comparing alternatives, only those cropping systems having the highest (or equal highest) CEs for a chosen range of absolute risk aversion are risk efficient.
4. Results
In this study, the results below are based on empirical (for yields) and PERT (for prices) distributions and the Clayton copula in the simulation model. The intention with the paper was not to test different model specifications and copulas. However, as robustness check, we also tested for several alternative specifications. We tested for empirical distributions for both yields and prices in combination with Clayton copula, we tested for both normal distributed yields and prices in combination with Clayton copula, and we tested for normal copula. All these model specifications gave consistent results with our original specification, implying that our results are robust for model specification errors.Footnote 4
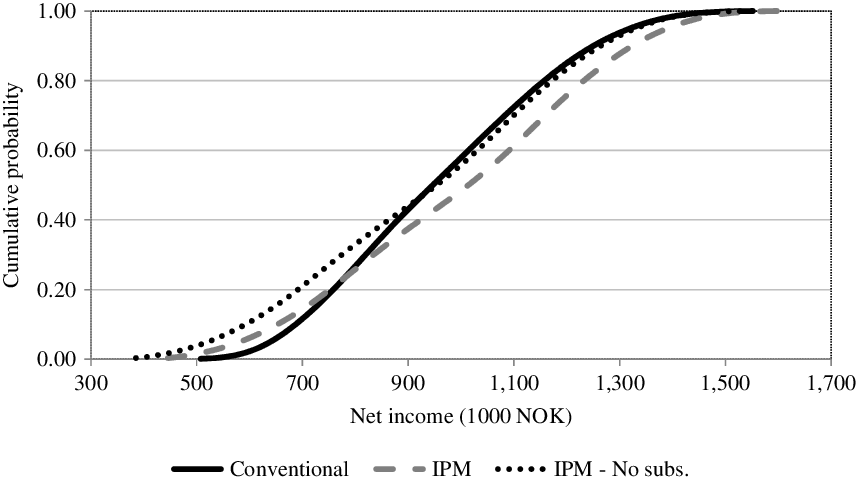
In terms of first-degree stochastic dominance, we can see from Figure 3, that the CDFs of the IPM and conventional cropping systems cross each other, so that neither dominates the other in the FSD sense. The same applies for the conventional and IPM when the current regional subsidies are taken away. It is clear from the figure that IPM with subsidies first degree dominates IPM with no subsidies. Since the minimum of IPM without subsides is less than the minimum for the conventional cropping system, IPM without subsidies cannot dominate conventional cropping systems, but in this case conventional cropping systems dominate IPM without subsidies in the SSD sense. However, the SSD analyses of the conventional and IPM (with subsidies) cropping systems were inconclusive, so we moved on to SERF.
CDFs of annual net farm income at 2018 price levels. “No subs” means regional subsidies are not included.
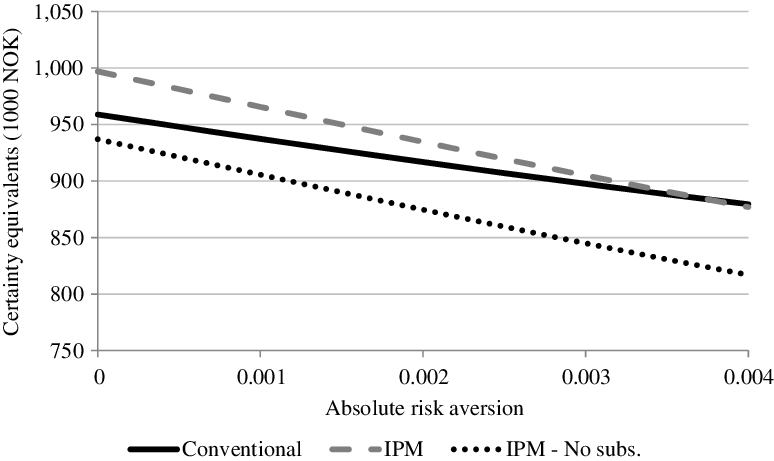
The SERF approach described earlier (Section 3.5) was used to further compare the risk efficiency of conventional and IPM (with and without regional subsidies). We evaluated the range of relative risk aversion with respect to wealth, r r(w), between 0.5 and 4. The typical level of a farmer's wealth, w, is assumed to be NOK 1 067 (in thousands of Kroner), the average wealth level of Norwegian farmers (NIBIO, 2014). Thus, we obtained the absolute risk aversion coefficients with respect to income with a lower bound 0.0005 (hardly risk averse) and a higher bound of 0.004 (extremely risk-averse). In the SERF graph below (Figure 4), we included a risk aversion coefficient of 0 (i.e. risk-neutral), for completeness, even though we suspect that no Norwegian crop farmers would be totally indifferent to risk.
CEs in NOK of the conventional cropping system and the IPM cropping system with and without subsidies under different levels of risk aversion. The CEs are calculated based on the probability distributions in Figure 3. “No subs” represents the case under which regional subsidies are not included.
As mentioned earlier, the results in this study are based on an assumed farm size of 32 ha. As a sensitivity check, we repeated the analysis assuming farm sizes of both half the original farm size (16 ha) and double of the original farm size (64 ha). In the case of the half farm size (double the farm size), we assumed half (double) of the original fixed cost and half (double) of the original assumed level of wealth. We found no significant changes in the results in terms of the ranking of the strategies for different levels of risk aversion.
5. Summary and conclusions
A main finding of this study is that, when the regional subsidies are included in IPM cropping systems, for farmers who are risk-indifferent to moderately risk averse, the conventional system is perceived as less preferred than IPM. This result is consistent with the finding by Greene et al. (Reference Greene, Kramer, Norton, Rajotte and McPherson1985) for IPM strategies in soybean production in Virginia. At very high levels of risk aversion, the conventional and IPM systems are equally preferred. Such extreme risk-averse farmers might prefer to continue with conventional farming practices, regarding IPM-level practices as too risky. Unsurprisingly, our results indicate that IPM cropping system without the regional subsidies are less preferred than both conventional cropping and IPM with subsidies. Based on the authors’ knowledge, no earlier study has investigated the effects of subsidy level on the ranking of the cropping system strategies (including IPM). The finding emphasizes the importance of those subsidies if encouraging IPM is a policy objective because of the benefits to human health and the environment. Lavik et al. (Reference Lavik, Hardaker, Lien and Berge2020) used a multi-attribute approach to support decisions by Norwegian crop farmers considering adapting IPM and found that the ranking of IPM strategies depended on the relative weighting of the economic risk, risk of human health, and risk of the environment. Lowering the risk to health and the environment costs farmers money. Some economists argue that interference in markets can only be justified if there is market failure, for example, the existence of externalities. Public health costs and environmental damage are externalities from pesticide use, implying that market intervention may be justified. There is discussion about increasing the number and kinds of available public instruments to accelerate the adoption of IPM strategies in such forms as targeted subsidies and improved advisory services. Our results support the proposition that, if the government wants all farmers to adopt to IPM practices, current regional subsides are about adequate. An increase in the subsidy would, at best, only influence very risk-averse farmers to adopt IPM practices. However, the benefits of IPM adaptation on human health and the environment should be better disseminated to the farmers (Lavik et al., Reference Lavik, Hardaker, Lien and Berge2020).
Subsides apart, another way by which IPM might be promoted would be to make benefits of adoption less risky for farmers, perhaps by better monitoring and earlier identification of pest and disease attacks, or perhaps by plant breeding to find cultivars that do better under IPM (Marra, Pannell, and Ghadim, Reference Marra, Pannell and Ghadim2003; Lefebvre, Langrell, and Gomez-y-Paloma, Reference Lefebvre, Langrell and Gomez-y-Paloma2015).
Clearly, our findings above are specific to the particular data we had, and hence only to farms with conditions similar to those at the experimental site, and we should be careful not to draw too broad general implications from our findings. However, where suitable data can be made available relevant to other locations, our method could be applied to such data. In fact, the model can be extrapolated to related situations, for example, by scaling up or down the relative yields to match a particular case, and/or by adjusting costs and prices.
Acknowledgement
This work was supported by The Research Council of Norway through the SMARTCROP project (project number 244526/E50). We thank two anonymous referees for valuable comments and suggestions on an earlier version of this article.


 Open access