

Introduction
Glaciological, physicochemical and mechanical studies of snow, firn and ice increasingly require structural characterization of the different porous media involved. Stereology and image analysis have helped studies of structure and morphology to evolve from descriptive and qualitative observations to more objective, quantitative and systematic characterizations. The difficulty of obtaining numerous quality data is illustrated in a recent report by Reference Shabtaie and BentleyShabtaie and Bentley (1994) in which information obtained “manually" by Reference FuchsFuchs (1959) is still used to describe the structure of firn. To describe the structural change of this porous médium with density, a large number of images must be obtained and must show the crystals, their boundaries and the pore network. The majority of studies requiring structural analysis cannot be satisfied by a uniquely descriptive image of porosity morphologies; the contacts between crystals must also be taken into account. For example, it is across these contacts that the stresses are transmitted through the material, grain growth is directly linked to the grain-boundary area and most physical phenomena in polycrystals must take into account the effects of grain boundaries.
The technique used by Reference FuchsFuchs (1959) and more recently by Reference AlleyAlley (1987, Reference Alley1988), which requires an image taken in transmitted light to characterize grain structure and another in reflected light lo characterize pore structure, is difficult to implement. Using reconstructed images by Reference FuchsFuchs (1959) or Reference AlleyAlley (1987, Reference Alley1988) and thin-section photographs by Reference GowGow (1975, Reference Gow1987) as a reference, we have developed a one-step photographic technique to observe the pore structure and grain boundaries. This technique can be used quickly in the field, as it requires neither impregnation (except for very low-cohesion samples) nor the preparation of thin sections. Furthermore, the resulting photograph represents the actual two-dimensional structure of the section (stereologic analysis) and includes a sufficient number of grains to be statistically representative of the studied medium.
In glaciology, the most widely used technique for obtaining two-dimensional images is based on the observation of thin sections in plain polarized transmitted light and between crossed polarizers (Reference Bader, Haefeli, Bucher, Neher, Eckel and ThamsBader and others, 1939; Reference KinositaKinosita and Wakahama, 1959; Reference GowGow, 1969, Reference Gow1975). Because of differences in orientation, the ice crystals in the thin sections show different colours due to double refraction when placed between crossed polarizers. This observation technique can be used to characterize crystal size, orientation and shape. However, it does not allow quantitatively accurate visualization of pores and the image is not truly two-dimensional information on the media. The image obtained in trans-milled light is built up from information taken across the whole thickness of the section. This is a major problem, if the stereological results are to be used to assign parameters to the material structure for modelling (Reference UnderwoodUnderwood, 1970; Reference KryKry, 1975; Reference Coster and ChermantCoster and Chermant, 1989). Most models assume that the initial image is purely two-dimensional and that it comes from a random section of the medium under investigation. Also, this technique, simple and quick to use for ice, becomes more difficult to use for snow and firn. In the case of low-cohesion snow, it is necessary to strengthen the structure by filling the pores with a supercooled liquid and freezing it at a low temperature before thinning down the section (Reference KinositaKinosita and Wakahama, 1959; Reference GowGow, 1969; Reference NaritaNarita, 1969, Reference Narita1971; Reference AlleyAlley, 1980; Reference PerlaPerla 1982; Reference GoodGood, 1983). Apart from the problem that impregnation can change the structure of the medium and that the material used may not spread uniformly through the pores (Reference PerlaPerla, 1982), the technique is long and complicated. Even so, impregnation is the only technique that can be used to analyse the structure of low-density samples (less than 0.4-0.5 Mg m−3. But this technique cannot be used with samples without cohesion between grains (or aggregates of grains). So, for these samples (density lower than ~0.2 Mg m−3), the whole structure cannot be directly analysed. The most interesting way to study the upper part of the snow cover is to collect grains (or aggregates of grains), to store them in liquid iso-octane to stop all meta-morphism and to analyse the shape and size of grains by optical microscopy (Reference BrunBrun and Pahaut, 1991).
Another technique often used is observation in annular reflected light (Reference KryKry, 1975; Reference PerlaPerla, 1982; Reference GoodGood, 1983). This method is used on impregnated samples and allows visualization of the pore structure. The contrast between ice and pores is improved by dyeing the ice or the impregnating liquids. The image obtained represents the truly two-dimensional surface and shows the ice and pore phases but not the grain boundaries.
To summarize, if we wished to obtain all the information, two techniques would have to be used: thin-section observations in transmitted light only for grain boundaries and impregnated thick-section observations in annular reflected light for void shapes.
Some authors (Reference AlleyAlley 1987, Reference Alley1988; Reference FuchsFuchs, 1959; Reference Narita, Maeno and NakawoNarita and others, 1978) have used both of these techniques successively on the same sample and then superimposed the two images. In this way, they have been able to obtain all of the information on the grains and pore structures. The use of both techniques is more comprehensive but also more difficult to implement. The use of annular light necessitates the use of impregnated samples, leading to the problems mentioned above. In fact, due to the high energy at the grain boundary, it is possible to enhance the contrast of these boundaries by ’’etching" the ice surface by dissolving or subliming the surface (Reference GowGow, 1987).
A method of preparing etched-section images of ice (from close-off density to 0.9 Mg in −3) has recently been described by Nashida (1996). This method is based on observations in reflected light of ice surfaces rubbed with alcohol.
The same idea of preferential etching of the crystal boundaries was used to develop our technicques. By etching only using sublimation, we are not obliged to attack directly the sample surface either chemically or mechanically, Moreover, our soft etching enables us to work with a low-density sample of firn (up to 0.5 Mg m -3 Contrast is also obtained by observing the etched surface by using the coaxial episcopy technique instead of annular light.
To extract the structural parameters from the primary pictures, specific image-processing tools were developed. This last stage of the characterization of the structure enables us to obtain binary images. Utilizing these binary images, many structural parameters can be calculated to provide data for different studies: modelling of firn densification (Reference Arnaud, Lipenkov, Barnola, Gay and duvalArnaud and others, 1998) and pore closure, grain growth and interactions with densification processes, and the evolution of structural parameters with climatic conditions.
Coaxial Episcopy
The coaxial episcopy technique has long been used in metallurgy. The technique uses reflected light to observe relief on flat, reflecting surfaces. The samples are polished and then generally subjected to chemical etching to highlight the differences in composition, phase and orientation of the crystals. The differences in contrast are caused by differences in the amount of reflected light received by the lens. These differences are related either to different levels of light absorption or, as in our case, to the different orientations of the illuminated surfaces (Fig. 1).
Using this principle, we cut sections of about 1 cm in thickness from the firn cores. These sections are then carefully polished using a microtome. The samples were attached to glass slides for microtoming with very little water displayed on the slides. This stage cannot modify the structure of the sample surface, because we work with thick samples and there is not sufficient water to percolate through the pores to the surface.
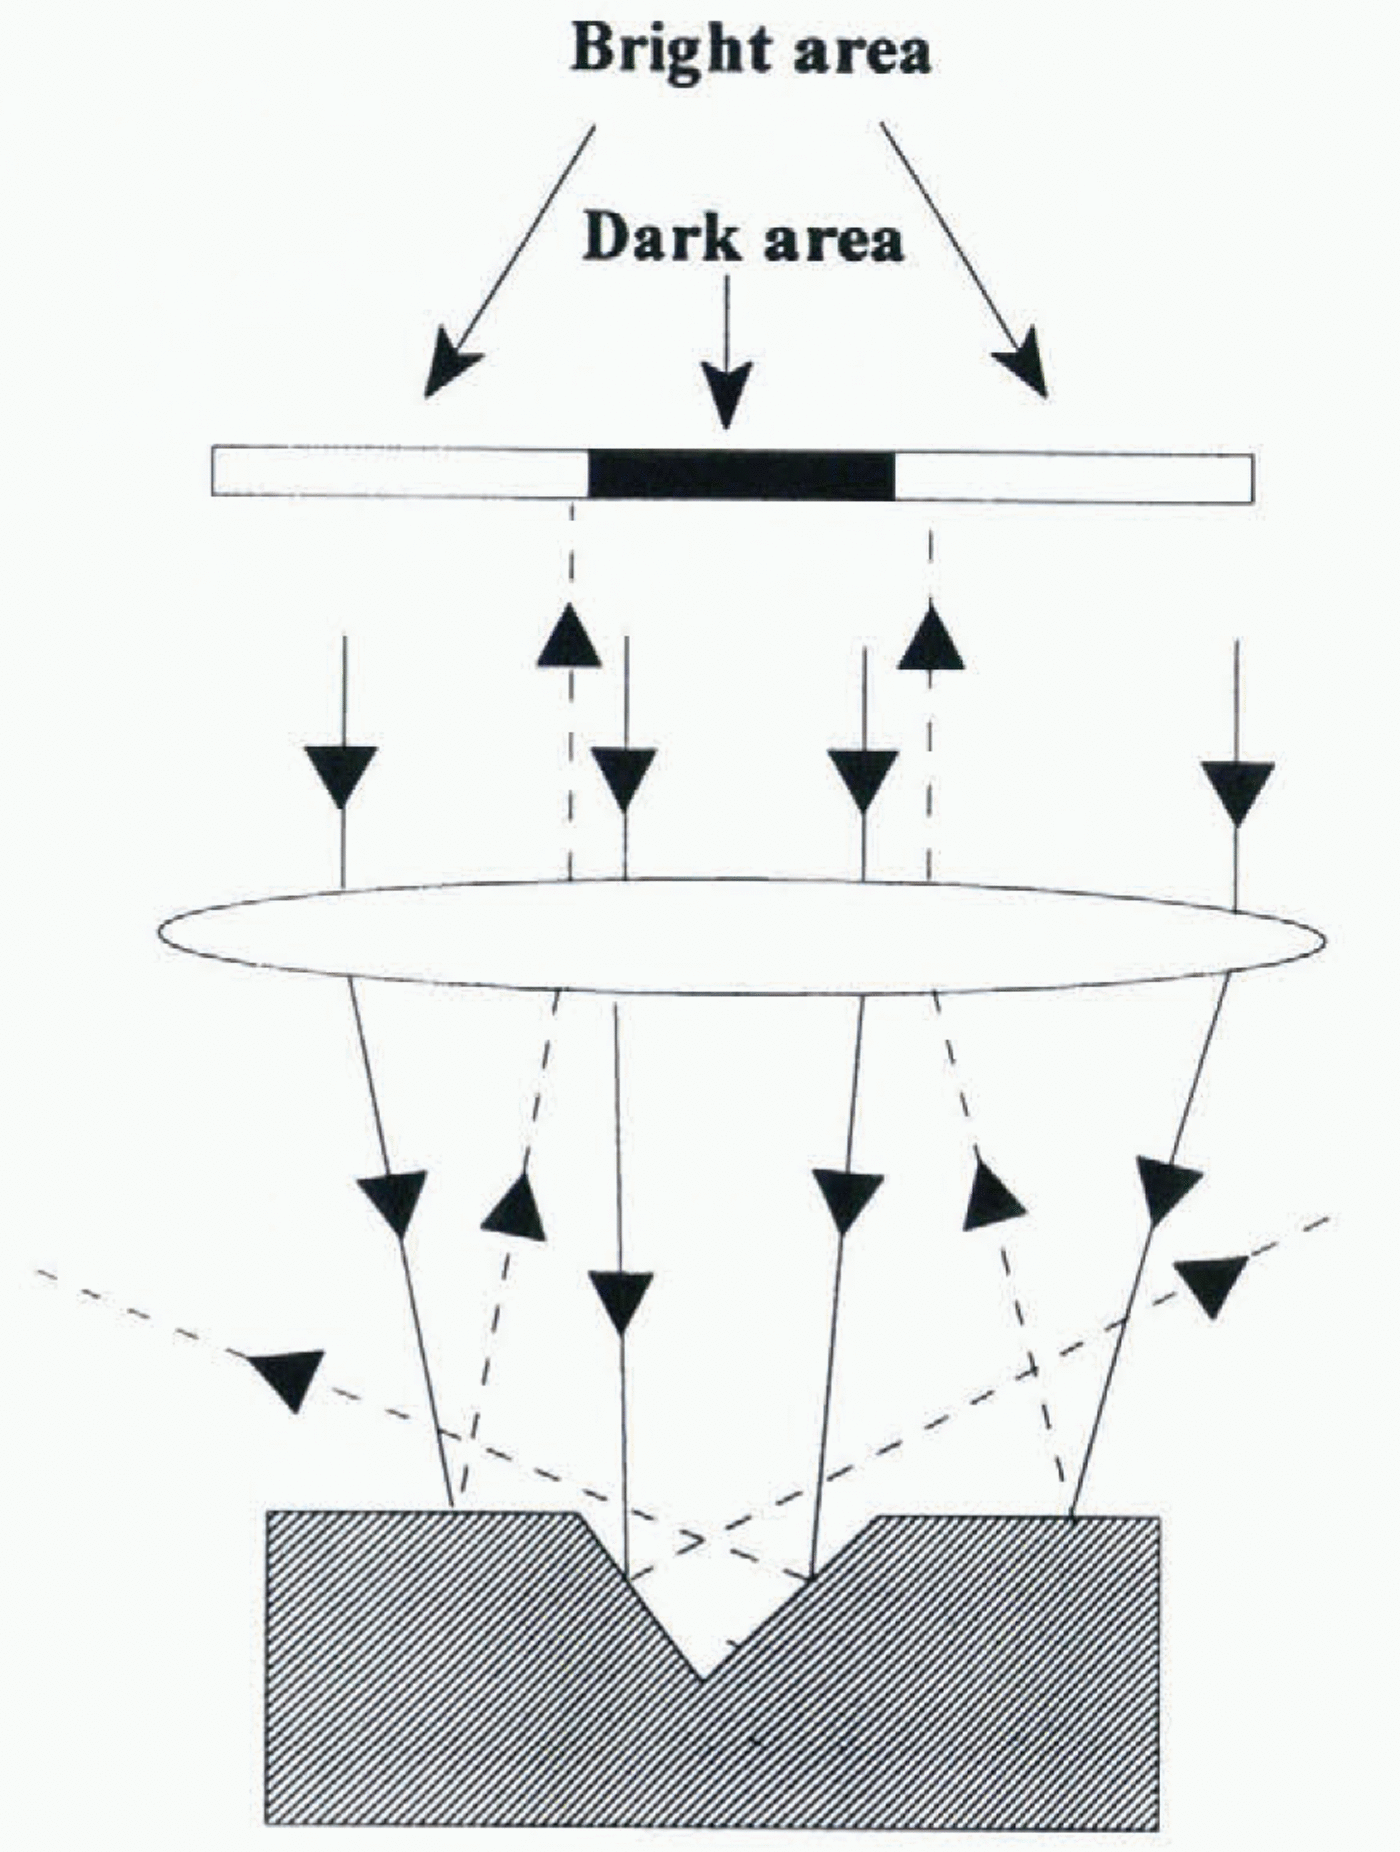
At this stage, the ice and pores can be clearly observed in reflected light using a Leica MZ8 binocular microscope fitted with coaxial episcopic light (Fig. 2). The observed contrast is caused by differences in reflection between the “polished" flat areas (ice) and the concave areas (pores). The parallel straight lines are left by the blade of the microtome. The large number of these striations is not specific to out-blade, but it is due to the sensitivity of our observation technique (coaxial episcopy) which enhances relief of the surface.
Unlike the annular light technique, the coaxial episcopy technique does not require the sample to be impregnated. The density must be higher than 0.4 Mg m-3. Below this limit, the grains are pulled out during sample microtoming. This limit is much less critical than that for transmitted-light techniques which require thinning of the sections to a thickness in the order of only a few grains.
The main limitation of the coaxial episcopy technique is the small observation area. The maximum area is linked to the area of uniform light, which is 10 x 7 mm2. To compensate for this problem, we have taken several adjacent photographs to build a sufficiently large observational area (40 x 40 mm2 or more). This area contains a sufficient number of grains to be statistically representative of the studied medium.
Sample Sublimation
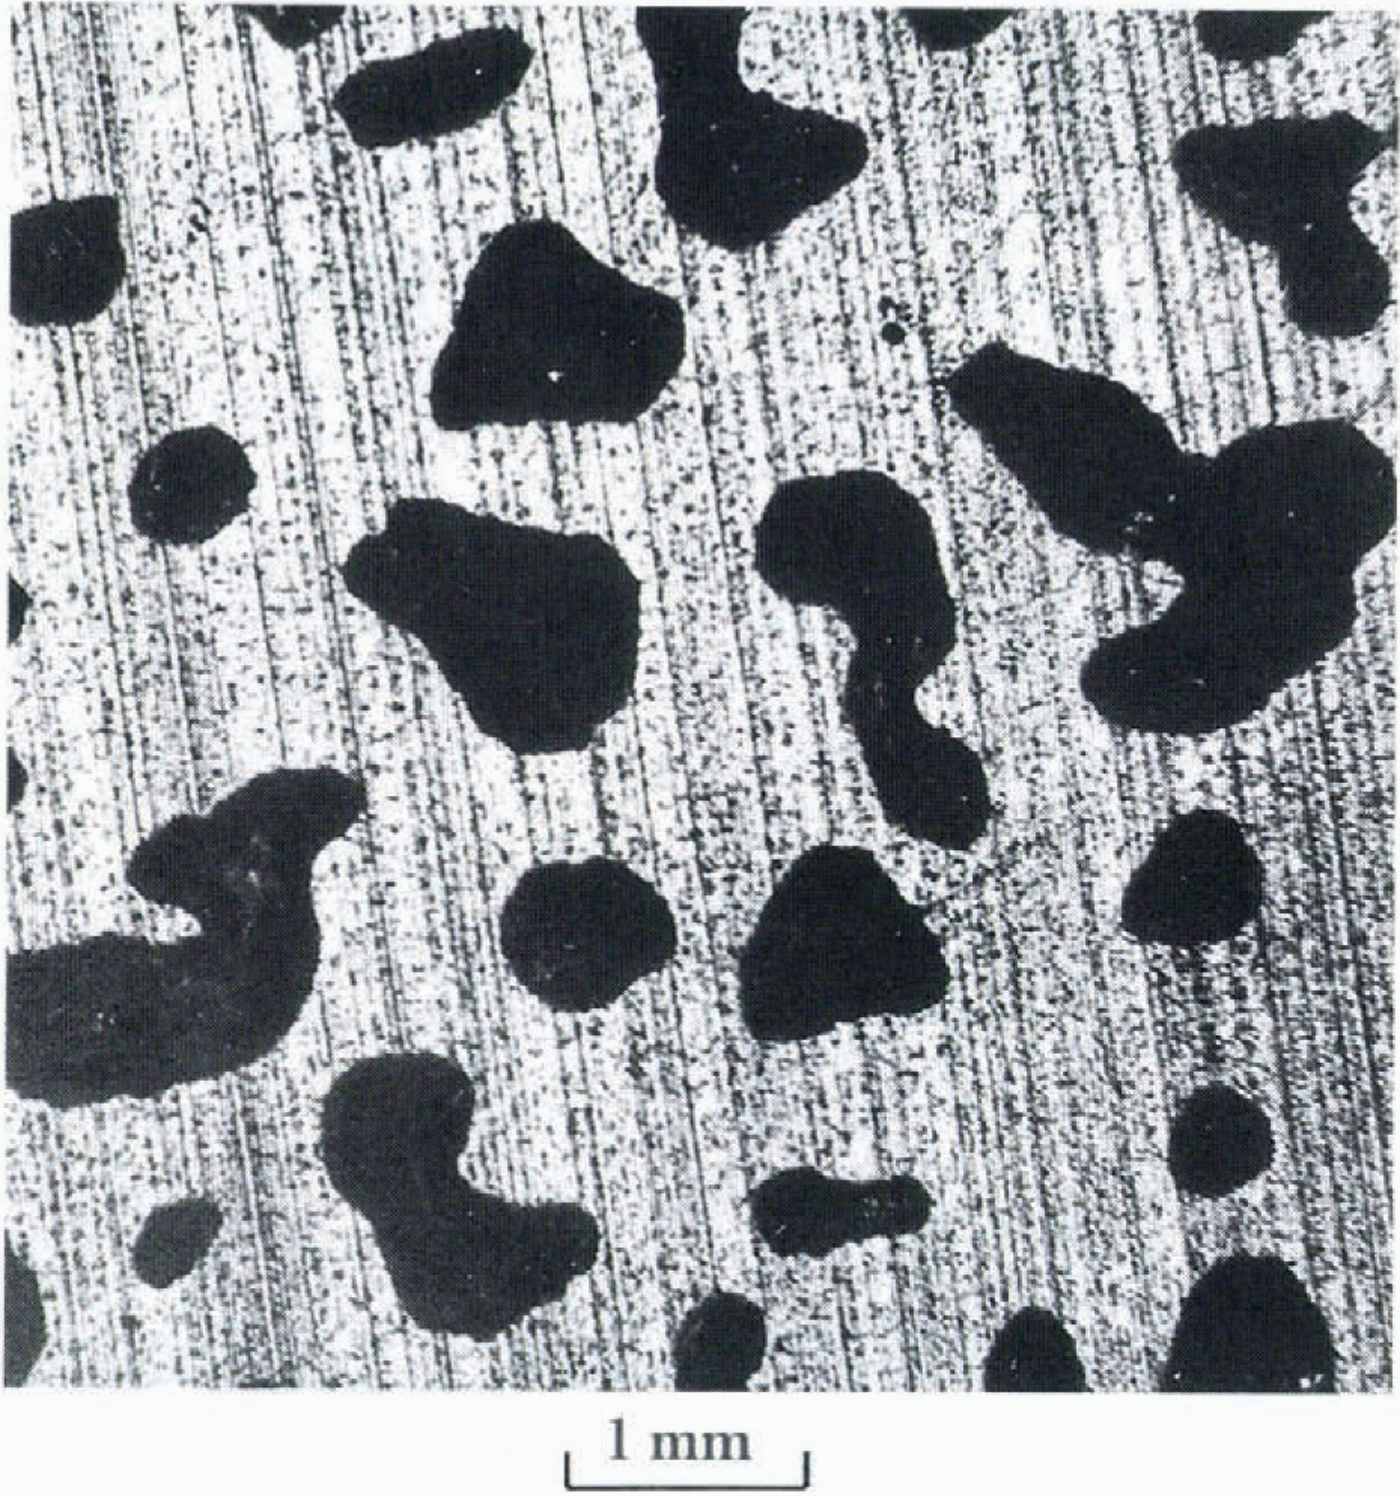
In a similar way to surface etching in metallurgy, the sublimation of sections of ice or firn allows one to examine grain boundaries (Reference GowGow, 1975, Reference Gow1987; Reference Nishida and NaritaNishida and Narita, 1996).The sublimation takes place preferentially on the highly disordered zones of the polycrystal. The grain boundaries will appear as grooves. As shown in Figure 3, the grooves appear as black lines in coaxial episcopy (the contrast is of the same origin as for the pores). By adjusting the pressure and temperature conditions during sublimation, the grain boundaries can be made to appear without altering the pore data (size and shape).
The optimal sublimation conditions are difficult to fore-see and tuning is required before each new set of measurements. For example, the photographs presented in this paper were obtained in the field after sublimation of samples placed in a plastic sheath at a temperature T = -12°C and atmospheric pressure (635 mbar for Vostok Station) for 12 hours. Better control of the surface-sublimation phenomena would greatly improve our method but this will require a better understanding of the phenomena. Our objective is to be able to calculate sublimation time as a function of pressure and temperature, so that grain boundaries can be etched without altering the size and the shape of the ice phase.
Firn is the best medium for this observational technique; no impregnation is required, work is carried out on thick sections and the pores and crystals are observed with one camera shot. For ice analysis, this technique saves time by working with thick sections polished only on one Face and provides an image of the truly two-dimensional surface.
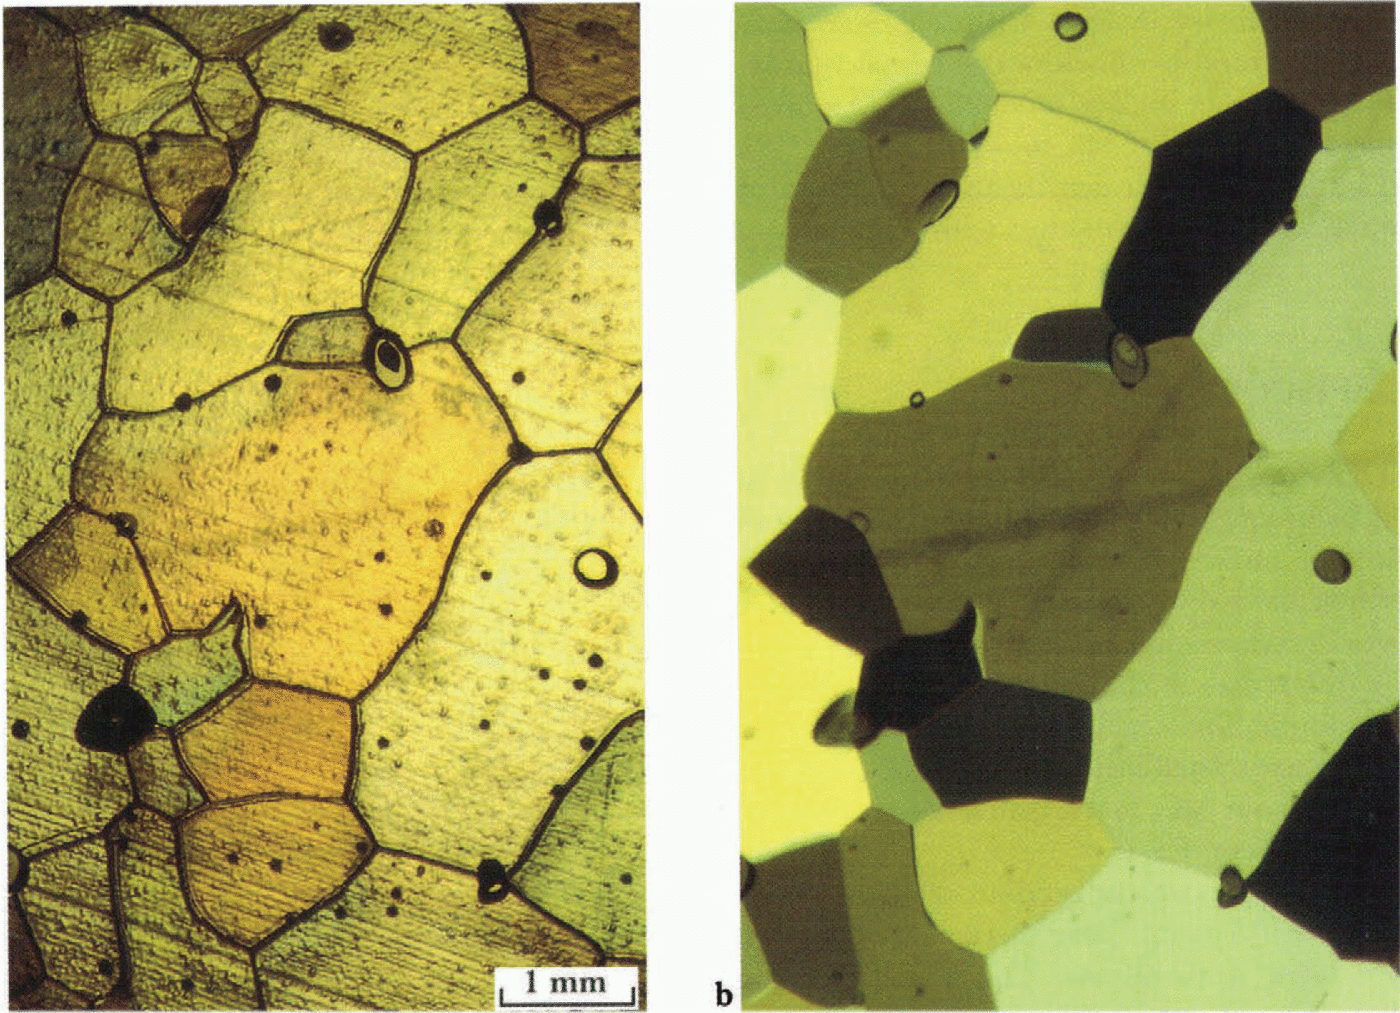
It is also possible to use this technique using thin sections. A test was therefore conducted to compare the image obtained with our technique to that obtained by the classic transmitted-light technique (fig. 4a and b), thereby checking that sublimation does not alter the information concerning the size and shape of grains.
Examples of sublimed samples observed by coaxial episcopy
This technique has actually been tested in the laboratory and in the field, on non-impregnated samples of firn and ice, over a range of densities from 0.5 to 0.91 Mg m−3. A set of measurements was made at Vostok (East Antarctica) during the winter of 1995-96. It was possible to record, in the field, images of samples during drilling of a 250 m drill-core (Bh7) and also from two other cores stored at Vostok but originating from the Mirny—Vostok traverse at points located 105 and 200 km from Mirny.
In 1 month, we were able to use our technique on 40 levels of the Vostok core (Bh7) between 7 and 250 m (between 0.5 and 0.91 Mg m−3), on 17 levels of the Km 105 core between 5 and 100 m and on 17 levels of the Km 200 core over the same depth range.
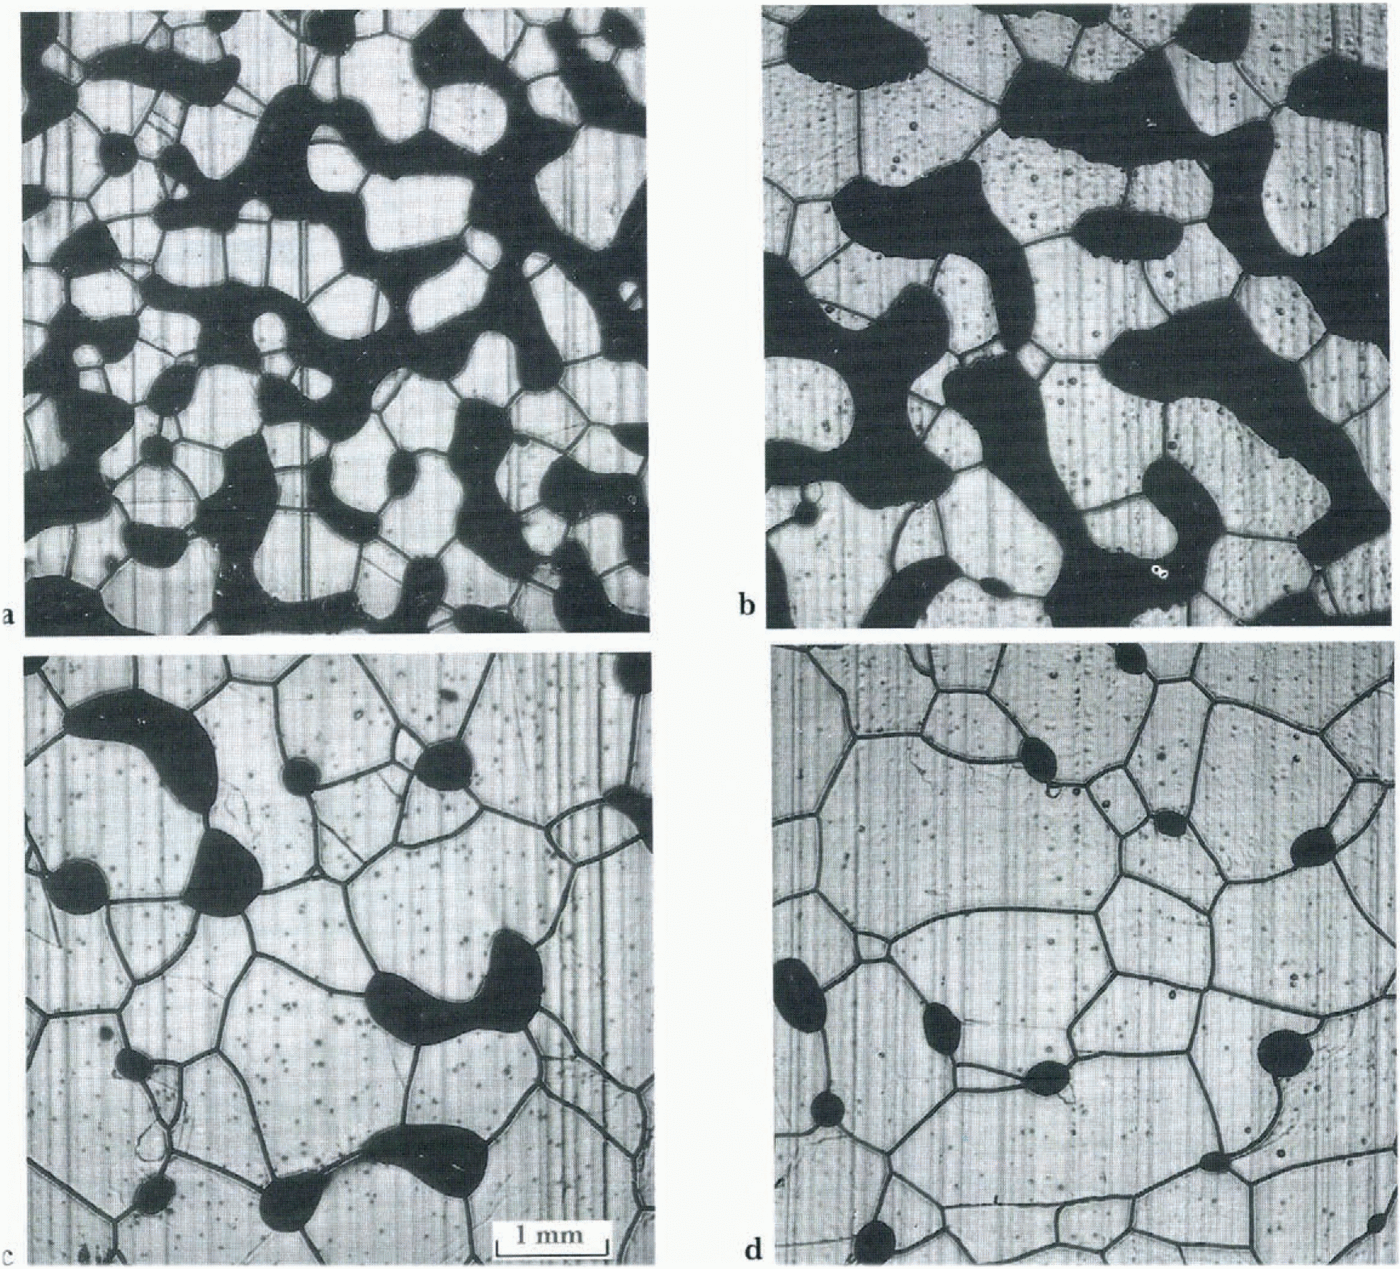
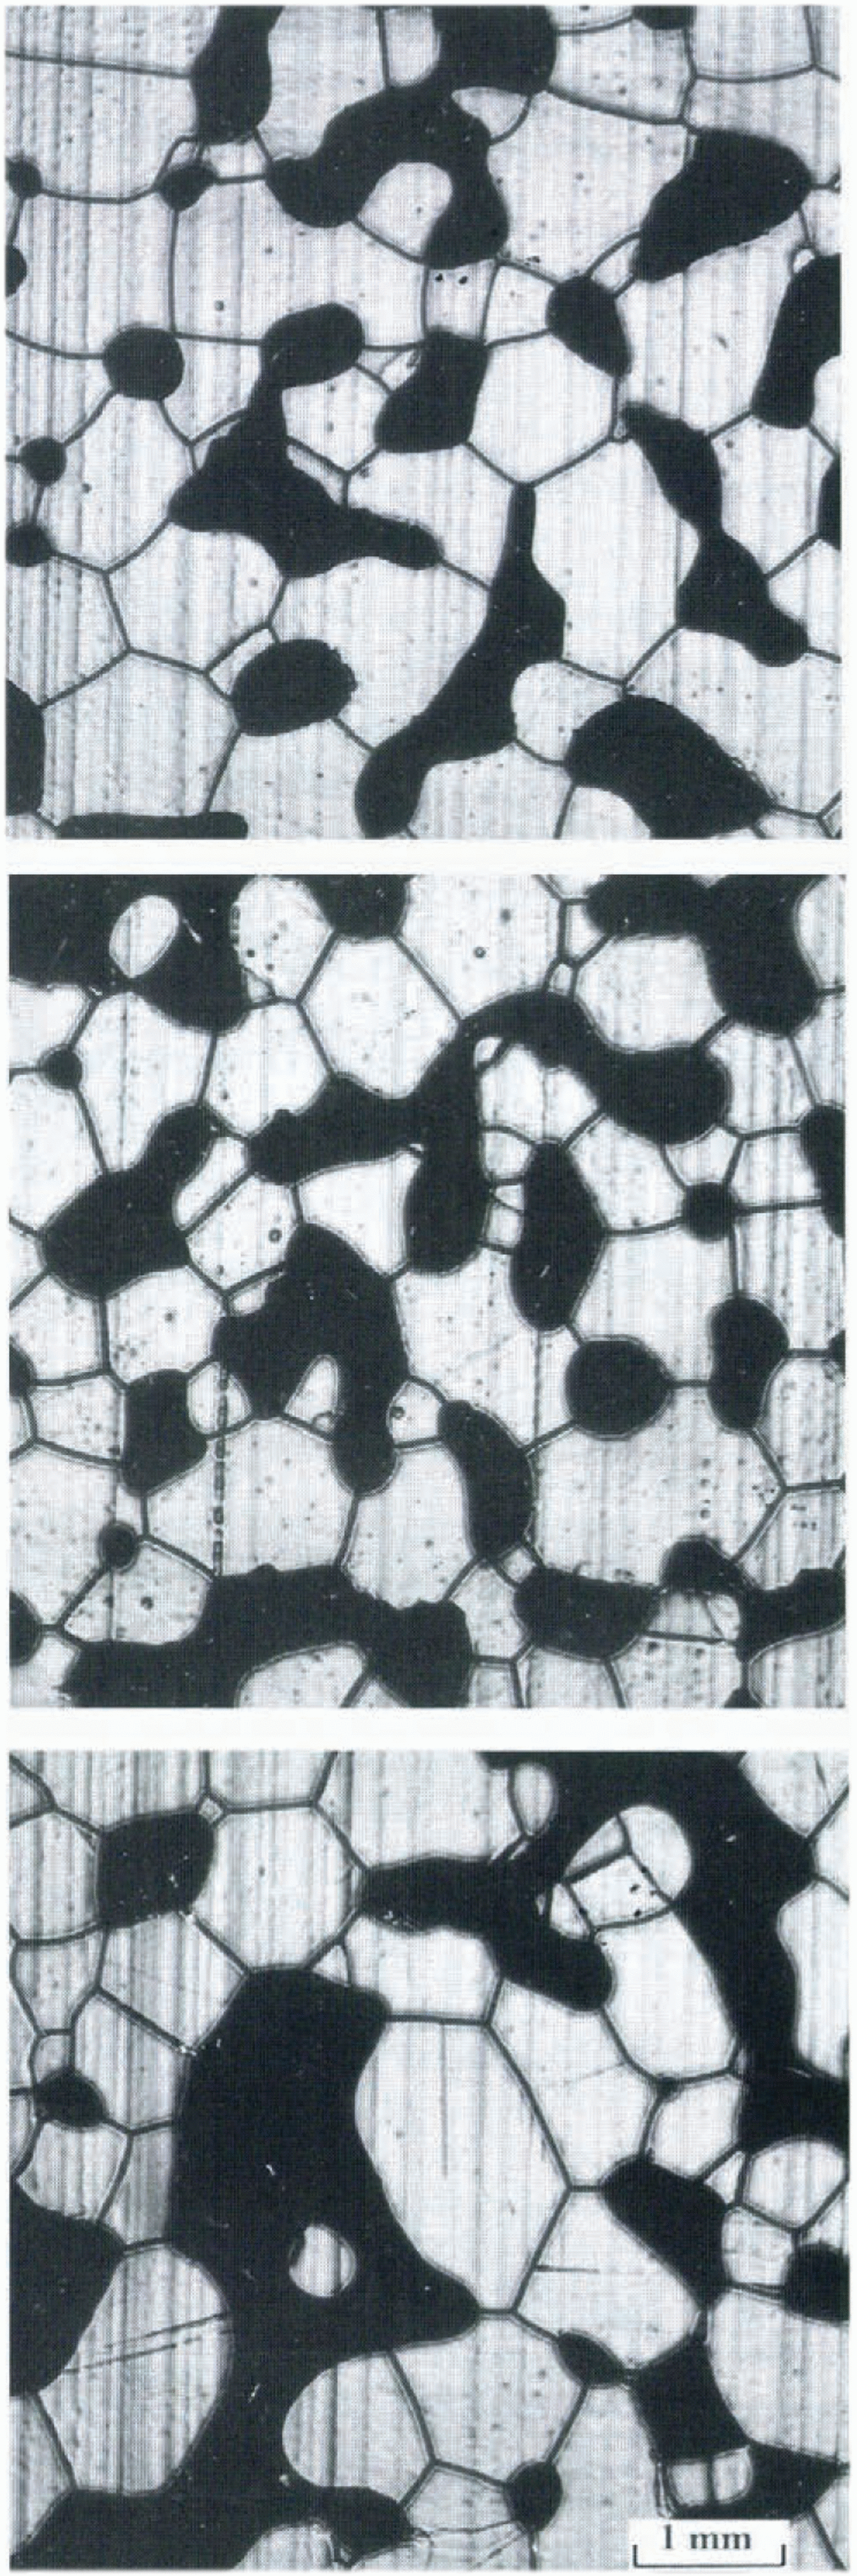
As examples, the structural evolution of firn as a function of density (or depth) at Km 105 is given in Figure 3 and firn images from the three studied sites (Vostok, Km 105 and Km 200) are compared at the same density in Figure 5. The photographs in both figures 3 and 5 represent only half the size of one negative area.
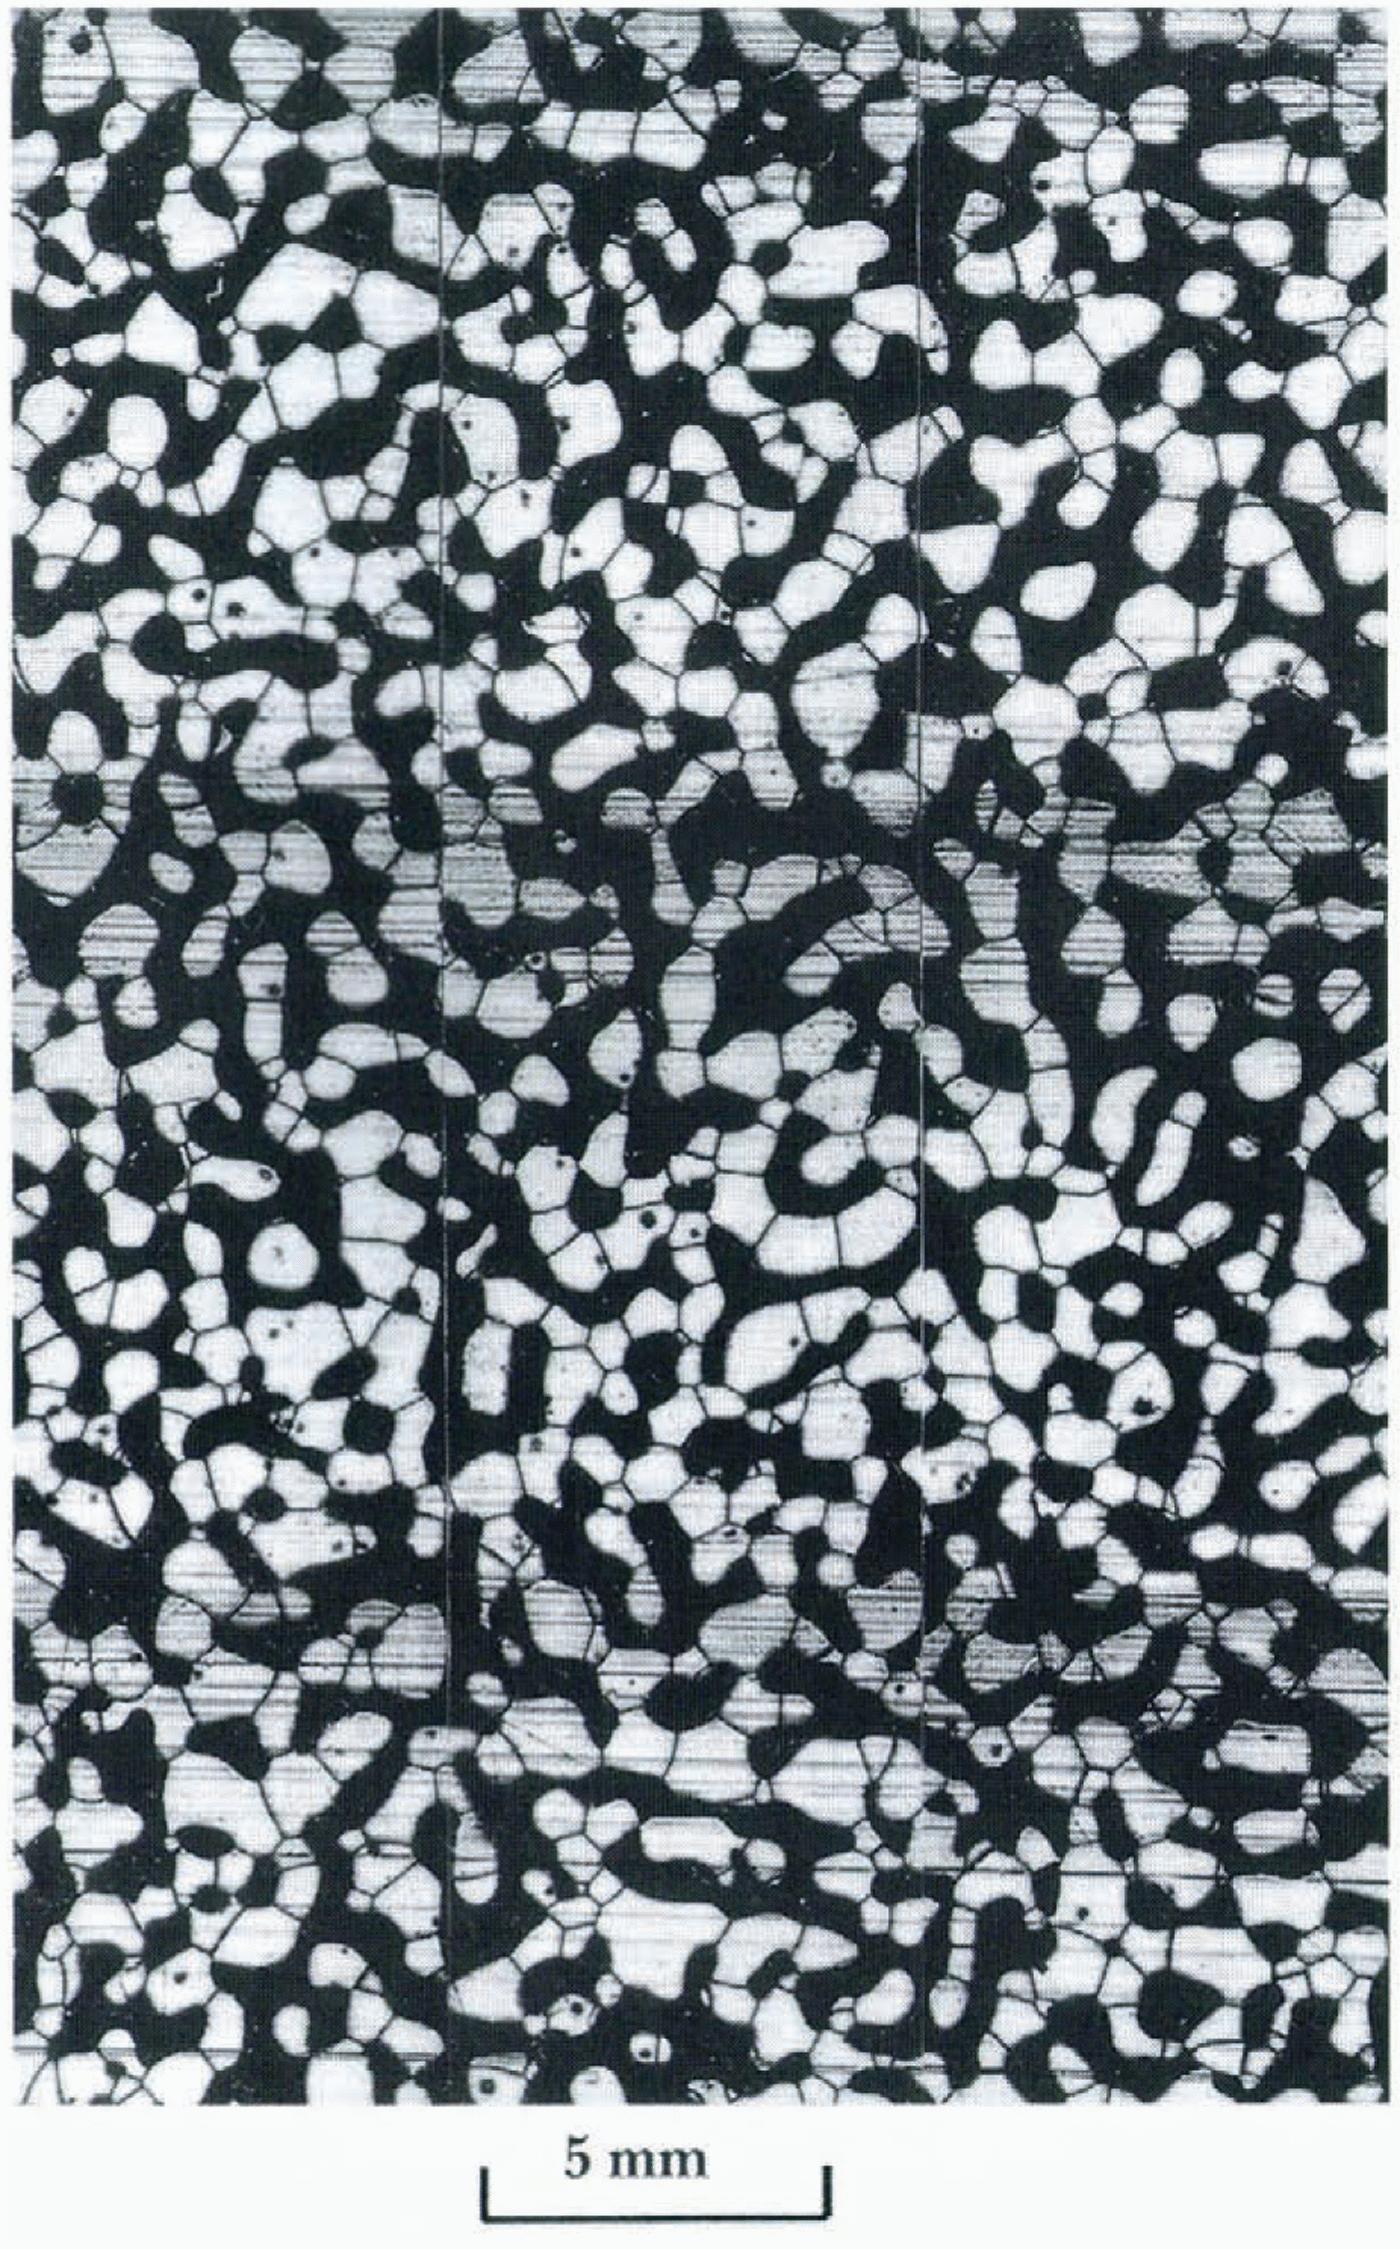
By using many adjacent images (nine—25 photographs per level), a sufficiently large image is obtained for each of the density levels (e.g. Fig. 6). These images are statistically representative of our two-dimensional medium, providing the basic data required for the systematic analysis of the evolution of firn by image processing. In this study, we have chosen to emphasize the real quality of untreated photographs before all numerical treatment, but we should also like to describe briefly the main stages of image-processing used to obtain clean binary images.
Image Processing
The initial negatives obtained at Vostok were digitized with a video camera and transferred to a personal computer (fig. 7a). Then, the gray-level images were cleaned and converted into a binary image using tools developed on the IPS (Image Processing System) on the Linux system.
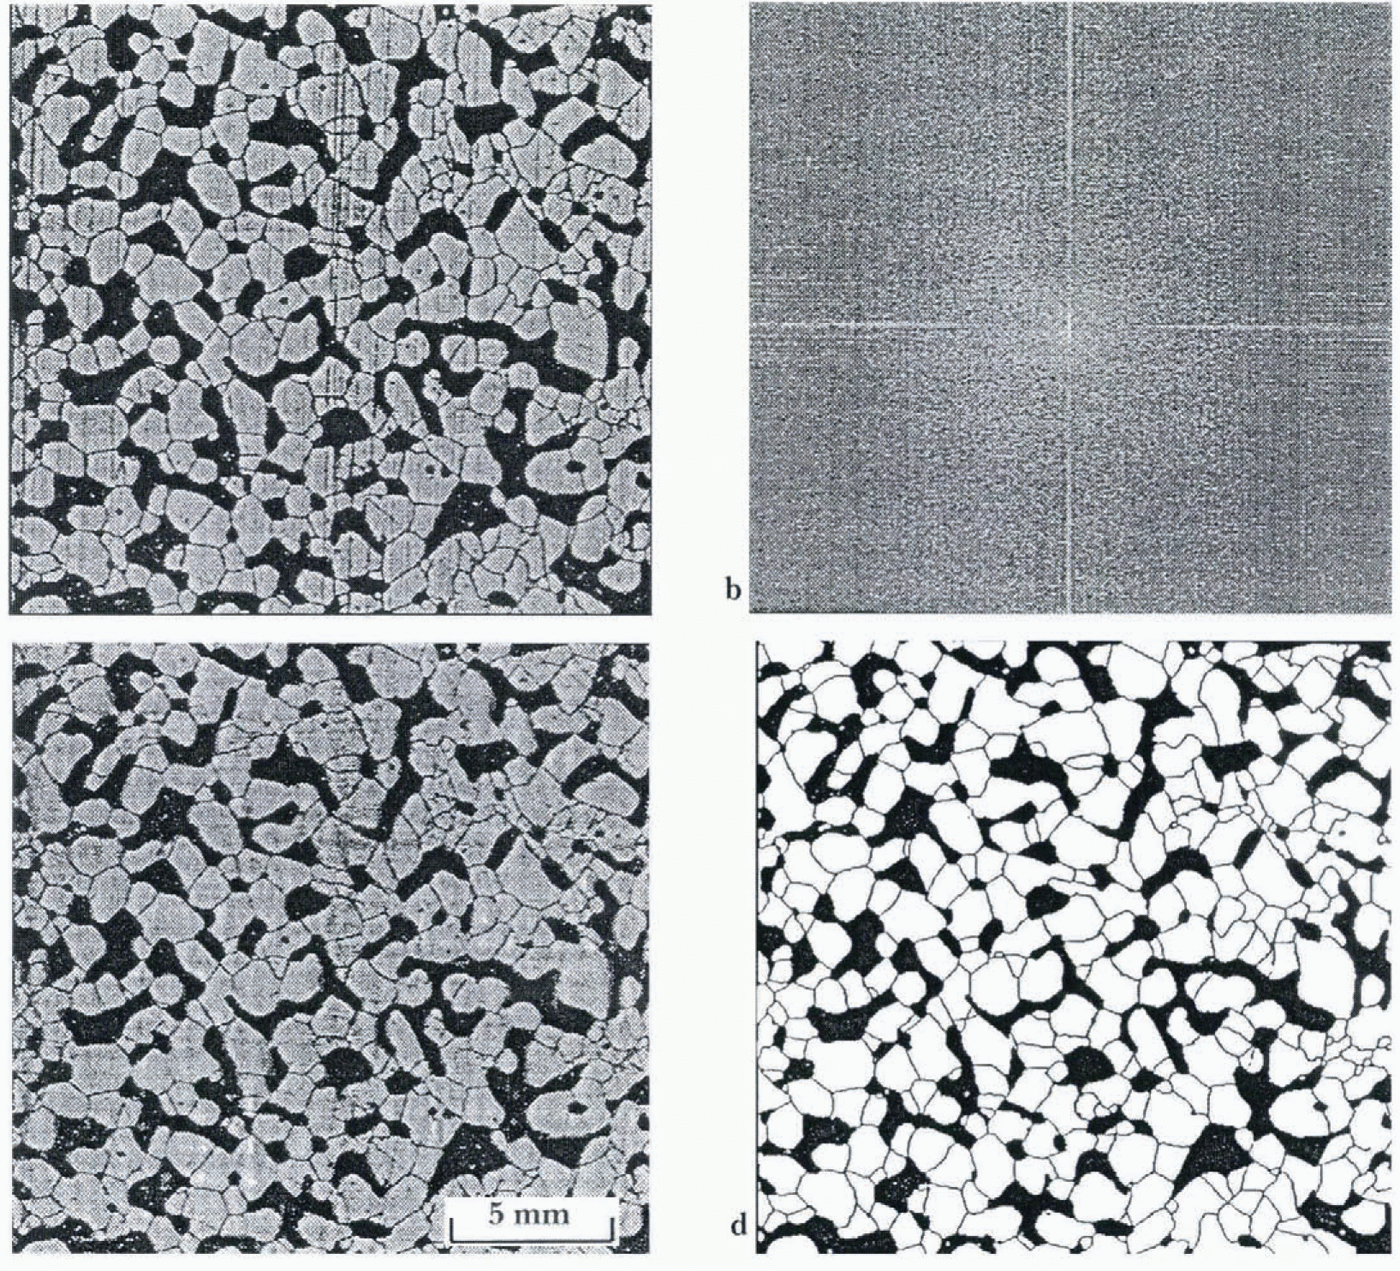
As a first stage, the image-processing allows removal of the straight lines left by the blade of the microtome, lines due to die mosaic reconstructions and all the small surface imperfections due to sublimation. Figure 7 shows the main stages of image-processing. To remove the straight lines (fig. 7a), an adapter low filter on the Fast Fourier Transform of the gray-level image [fig. 7b) is used to obtain the filtered image (Fig. 7c). From these filtered gray-level images, two stages based on morphological operations are necessary to obtain the final binary images: one for the porosities and the other one for the crystals. Concerning the treatment of the porosity and the erasure of small surface imperfections due to sublimation, morphological operations (Euclidean erosion and geodesic dilation) are used. These operations enable us to obtain a binary image composed with two phases: porosity and ice. The second stage consists of morphological transformations of the gray-level image (fig. 7c). First, the morphological “top-hat" transformation (Reference Coster and ChermantCoster and Chermant, 1989) enables to extract grain boundaries. Secondly, from the last image of grain boundaries, a skeleton transformation reduces the width of the boundary to one pixel. This image of the skeleton of grain boundaries is added to the binary image of the. porosity and ice to obtain the final clean binary images (fig. 7d).
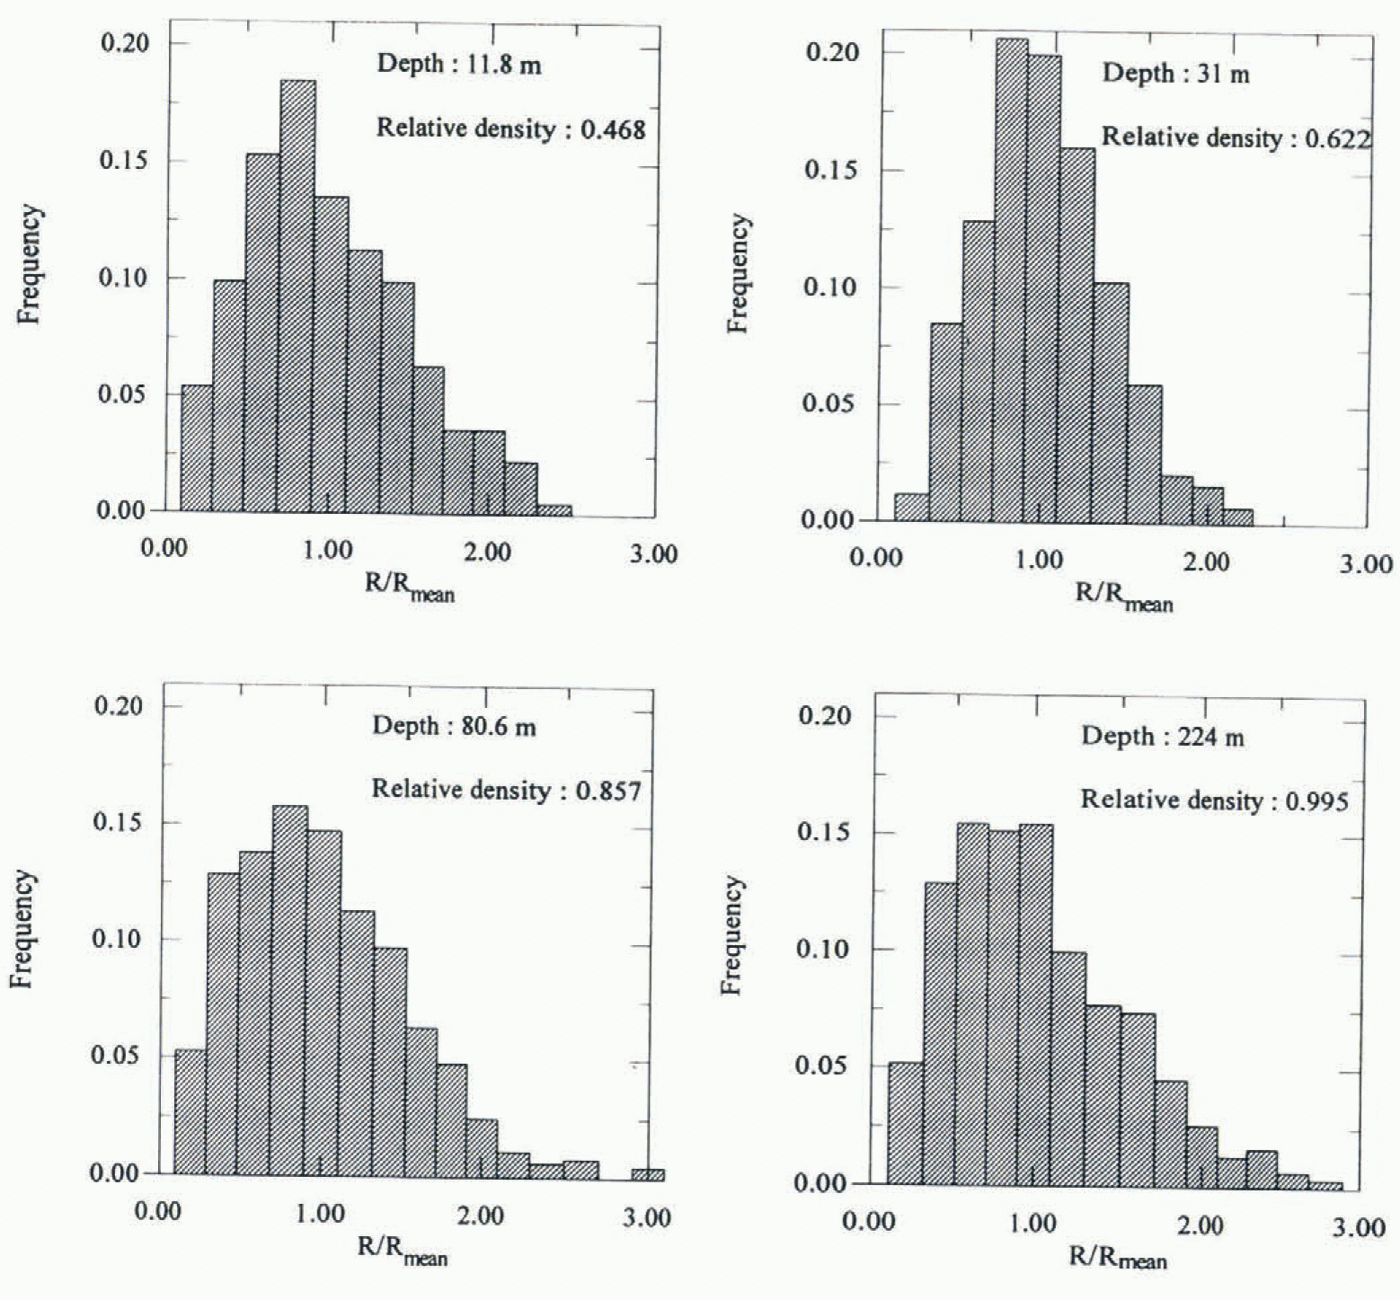
Image-processing also provides the various and numerous structural parameters useful for modelling. These images are presently analysed with two objectives: the characterization of structural changes (size and shape of crystals and porosities network) as a function of density and the influence of climatic conditions on these changes (average annual temperature and accumulation). As an example of an analysed parameter, Figure 8 shows the evolution of the crystal-size distributions in the Vostok firn and ice during the densification and grain-growth processes.
Conclusion
The structural analysis of firn and bubbly ice requires characterization of ice crystals, pore network and interfaces. The proposed method consists of subliming polished samples in order to reveal the grain boundaries, before observing them by coaxial episcopy. Observation in coaxial reflection shows relief differences on our sample surfaces, which makes it possible to see the pores and grain boundaries “etched" by sublimation. This procedure simultaneously gives images of the crystal (grain boundaries) and of the porous network that are truly representative of a two-dimensional section of the firn. In addition, this technique requires neither impregnation nor thin sections, so it is easy to use in the field and introduces no measurement bias. Another advantage is the short time required to obtain a structural image for a given density, making it possible to collect successive images throughout a progressively thinning section (serial-sectioning technique). The study of these images would give a real three-dimensional structure of firn pores and the real size and shape of ice crystals. This work was initiated to obtain images of the structure of firn and ice, in order to extract parameters required by our various models (densification, pore closure and diffusion of atmospheric gases in the firn pores). In addition to the issues concerning firn densification and the observation of pores and grains, this technique could be applied to the characterization of ice cracks.
Acknowledgements
This work was supported by PNEDC (Programme National d’Étude du Climat), CNRS and by the CEC (Commission of European Communities) Environment program.
We acknowledge the Russian Antarctic Expeditions, the Arctic and Antarctic Research Institute, the U.S. National Science Foundation (Division of Polar Programs) and IFRTP (Institut Français pour la Recherche et la Tèchnologic Polaires) for logistic support at Vostok Station. We are also grateful to M. Creseveur from the LGGE for his advice and assistance.
The LGGE has an agreement with the Universitè Joseph Fourier de Grenoble.


