


1. Introduction
In recent years, short-dated options have gained popularity as a means of obtaining option exposure outside of the traditional options on commodity futures and equities. This surge in interest, particularly in the agricultural sector, raises the question of whether these short-dated options, especially weekly options, are providing unique market insights compared to regular options. According to the CME Group, weekly options trading volumes increased 65% from 2018 to 2019, with an average daily volume of almost 7,000 contracts (Britnell and Sutton-Vermeulen, Reference Brinell and Sutton-Vermeulen2020). The ratio of trading volume of weekly options to traditional options increased 3.8 times and 1.8 times, respectively, for corn and soybeans from 2017 to 2021. In the equity space, the zero-day (0DTE) options garnered a tremendous amount of attention in the media due to retail trading frenzy such as the phenomenon around GME stock and other meme stocks in early 2021. Cboe Global Markets reported over 40% of trading volume was for 0DTE SPX options since late 2022, doubling from 20% in the first quarter of 2022; initially 80% of order flows were from retail brokers (Bloomberg). The popularity of short-dated options also motivated Cboe Global Markets to create a 1-day VIX, complementing the widely referenced 30-day VIX.
The short-dated options on grains include serial options, which expire monthly when a regular option is not expiring, short-dated new-crop options, which expire monthly leading up to the settlement of the new-crop futures contract, and weekly options or weeklies that expire during weeks that do not have regular nor serial options expiring. The introduction of weeklies ensures that every Friday (or adjacent business day) has some type of option maturing that can be offset or exercised into a nearby futures contract that is not about to enter the delivery period. The CME Group has touted weekly options as an effective instrument for managing event risks such as the release of major United States Department of Agriculture (USDA) reports. Although less aggressive than the equity space that offers options expiring every weekday, it is interesting to see whether weekly options on grain futures bring more information or more noise to the market. This question forms the core of our study, seeking to understand the specific role and impact of weekly options in the broader context of market dynamics and efficiency.
Weekly options on major grain and oilseed futures are currently listed on the CME Group for three or four weeks prior to expiration. Such tenor is much shorter than the typical twelve months for most options and multiple years for new-crop options. The short tenor compared to regular options results in a generally lower theoretical value and observed lower premiums. The short tenor also increases the chance of an underlying price move that would not have time to revert prior to maturity, which may result in a volatility (variance) risk premium,Footnote 1 defined as the difference between implied volatility and realized volatility, for weeklies. This may be due to the perceived need to have a risk premium by option sellers, lower overall trading volume in weeklies (a liquidity premium), or higher volatility for a given week that affects weekly option premiums more than regular option premiums. An example in the grain markets of specific events would be the release of major reports, e.g., World Agricultural Supply and Demand Estimates (WASDE) reports, that are expected to change the underlying futures prices. The increasing trading volumes and open interest in weeklies, especially for corn and soybeans, hint at their potential for providing additional insights into short-run price movements, challenging the traditional dominance of regular options.
Weekly options for corn, wheat and soybeans were introduced in May 2011, on top of existing standard and serial options. Weekly options add at least four option contracts expiring on successive Fridays during the nearby month or months of a futures contract. The unique characteristic of weekly options, compared to longer-date options, is their ability to provide direct exposure to diffusive price risk via at-the-money (ATM) strikes and separately to price jump risk via deep out-of-the-money (OTM) strikes. In practice, weekly options offer farmers and agribusinesses (or speculators) an inexpensive way to lay off (acquire) short-term risks, such as drastic weather conditions, fundamental news in USDA reports, geopolitical news, etc. Conversely, other options are more expensive and less sensitive to the short-term event risks that may concern interested participants.
The existing literature in agricultural commodity options provides empirical evidence for informativeness of regular options in predicting future realized volatility. Egelkraut et al. (Reference Egelkraut, Garcia and Sherrick2007) found that forward volatility implied in regular options can predict future realized volatility better than can historical volatility, especially earlier in the calendar year. To our knowledge, there is no existing literature on weekly options on agricultural futures. However, related literature includes the predictability of implied volatility and weekly options on stock index. Todorov and Zhang (Reference Todorov and Zhang2021) showed that spot volatility (SV) introduced in Todorov (Reference Todorov2019) complements the existing return-based volatility measure in volatility prediction. Andersen et al. (Reference Andersen, Fusari and Todorov2017) proposed a semi-nonparametric model to extract negative tail risk from S&P 500 index options between 2011 and 2015. They found that jump metrics implied in weekly options help predict stock returns.
In essence, this paper aims to bridge a gap in the literature by exploring the role of weekly options in agricultural futures, scrutinizing their changing role in the marketplace, their ex-ante and ex-post pricing, and their informational efficiency. The objectives of this paper are to determine (a) whether weekly options on grain futures are gaining popularity in the marketplace that has been dominated by regular options; (b) whether weekly and regular options are priced fairly ex-ante compared to realized volatility ex-post, especially around major USDA reports; and (c) whether weekly options provide additional information beyond regular options. If information about the short-run price situation is reflected in weekly options on grain futures, implied volatility of weeklies would be expected to track realized volatility closely over their lifespans. Furthermore, SV (Todorov, Reference Todorov2019) that utilizes OTM strikes are presumably an ideal candidate to capture dynamics in weekly options. We also assess whether SV offers any unique value about future volatility beyond the classical Black–Scholes implied volatility (BSIV). The insights gained from this investigation could significantly influence the strategic approaches of market participants and contribute to the evolution of trading strategies in agricultural futures. More specifically, if weekly options are redundant in terms of information provision, their presence will simply introduce noise into the market and take liquidity away from regular options. On the other hand, if weekly options provide unique information beyond regular options, market participants should use weekly options to express their views and inform their trading decisions.
We employ end-of-day options data for corn and soybeans from the CME Group. Both weekly and standard options are included from 2017 to 2021. We discuss trading activities and liquidity of weekly options in comparison to regular options over the sample period. We document stylized facts on volatility risk premium (VRP) based on Black–Scholes ATM implied volatility surrounding important events such as the release of USDA reports. To highlight potential information embedded in weekly options, we run regressions of realized volatility on SV and BSVI from both weekly and regular options.
Our empirical results show that the popularity of weekly versus regular options is increasing over time and is associated with the ability to position around major reports; there is higher risk around major USDA report dates and more significantly negative VRPs, reflected in weekly but not regular options; weekly options are particularly informative in predicting future volatility in shorter horizons, up to 2 weeks, on top of what is already embedded in regular options; there is mixed evidence for the informativeness of SV beyond the classical Black–Scholes volatility implied in options.
We organize the rest of the paper as follows: Section 2 reviews the relevant literature on weekly options and predictability of various implied volatility measures. Section 3 proposes hypotheses to be tested. Section 4 presents data and regression models. Section 5 discusses the rising popularity of weekly options, the effects of major USDA reports on realized volatility, and the information content of weekly options and SV. Section 6 contains the conclusions.
2. Literature review
Different strands of research are related to the current study: weekly options, predictability of various implied volatility measures, and the prevalence of volatility around major reports. Existing research on weekly options is focused on equity markets. Andersen et al. (Reference Andersen, Fusari and Todorov2017) propose a semi-parametric model to extract tail risk from SPX weekly options. They find that left-tail risk embedded in weekly options is not spanned by market volatility and helps predict future returns. Todorov (Reference Todorov2019) proposes a nonparametric measure of SV from short-dated options that is separated from jumps by virtue of a diminishing effect of higher values of the characteristic exponent for the log return. Todorov and Zhang (Reference Todorov and Zhang2021) show that combining return-based and option-based volatility estimators offers nontrivial gains in volatility prediction.
The forecasting gain is due to a more precise measure of SV. The literature is abundant in using option-implied volatility to predict future volatility. Carr and Wu (Reference Carr and Wu2009) employ a variance swapFootnote 2 rate (option-implied variance) to predict realized variance and document the significant variance risk premium, namely implied variance (volatility) being higher than realized variance (volatility). In the agricultural commodity literature, Egelkraut et al. (Reference Egelkraut, Garcia and Sherrick2007) show that regular option-implied volatility is better at predicting future volatility than historical volatility does for the corn market. Wang et al. (Reference Wang, Fausti and Qasmi2012) find that a VIX-like measure of implied volatility improves volatility prediction over both historical volatility and BSIV for corn.
Several recent studies have connected events to different futures price changes and changes in volatility, but none have incorporated the presence of weekly options. Using daily data from 2009 through 2019, Cao and Robe (Reference Cao and Robe2022) find that the implied volatility on the nearby regular options prices fall from the closing before major reports to the close on the day of major reports. For corn and soybeans, the typical change in the implied volatility from day-to-day was close to zero, then statistically different on major report dates. Similar findings about the scope of the decrease in the implied volatility following reports were found by Goyal and Adjemian (Reference Goyal and Adjemian2021). They modeled the daily change in the implied volatility of the nearby prices using daily data from 1995 through 2019 to assess the impact of the WASDE report that was not released in January of 2019. Such studies consistently find report-related declines in the implied volatility. However, knowing changes occur does not say anything about the relative effectiveness of the implied volatility as a forecast of the volatility around the reports.
Isengildina-Massa et al. (Reference Isengildina-Massa, Cao, Karali, Irwin, Adjemian and Johansson2021) clearly describe the range of major USDA reports likely to affect the prominently traded futures contracts. Using data from 1985 through 2018, they compare the nearby futures price changes on report dates to non-report dates across commodities. They find that prices generally, and often in statistically significant ways, fluctuate more on report dates. Similarly, Adjemian (Reference Adjemian2012) found higher price volatility around WASDE releases for cotton, soybeans, and wheat. Thus, by providing information to the market, prices can respond and afterward volatility can be reduced. What is missing to date from the studies of major reports is any connection between implied and realized volatility.
3. Hypothesis development
We address objective (a) by comparing the trading activity of weekly options to regular options over time by visualizing trends in trading volume and open interest and by running a regression on a time trend and a dummy variable representing major reports. The market has witnessed a tremendous surge in short-dated stock and index options trading. As of December 2024, 0DTE (zero days to expiry) options represent 49% of SPX trading volume, rising from 5% in 2016 and logging an annual increase of 52% according to Cboe Global Markets.Footnote 3 We hypothesize that there is also a positive time trend in the popularity of weekly options on agricultural commodities and such a trend is partially associated with major events.
Regarding objective (b), we hypothesize that there is a negative VRP for both weekly and regular options, i.e., the underpricing of realized volatility relative to implied volatility. The existing literature has pointed to the existence of VRP for regular options in equity markets (Carr and Wu, Reference Carr and Wu2009) and in grain markets (Wang et al., Reference Wang, Fausti and Qasmi2012). End users, especially retail traders, tend to long 0DTE options, leading to net short positions by market makers. Since retail traders lose money on 0DTE options on average (Beckmeyer et al., Reference Beckmeyer, Branger and Gayda2023), it is reasonable to conjecture that retail traders overpay 0DTE options, consistent with negative VRP. Short-dated options are typically used for hedging or speculating on events. We further hypothesize that the overpricing (or underpricing) of implied (realized) volatility is more pronounced around major report dates, such as WASDE reports.
Regarding objective (c), we conjecture that (i) weekly options provide additional information for predicting short-term volatility due to their short tenor nature compared to regular options. Andersen et al. (Reference Andersen, Fusari and Todorov2017) show that short-dated options provide “an easy way to separately manage market jumps and diffusive risks” and “a simple and robust way to identify market volatility and priced tail risk.” We further conjecture that (ii) SV is more informative than ATM BSIV due to the inclusion of the full range of OTM strikes in the former’s calculation. Todorov (Reference Todorov2019) shows that SV, unlike BSIV, is an option-based measure of the “true” volatility theoretically via the risk-neutral conditional characteristic function over the time span of the options. The well-known presence of price jumps causes an upward bias in the ATM BSIV. The SV measure underweights the OTM options gradually as the strikes move further away from the current underlying price. Todorov and Zhang (Reference Todorov and Zhang2021) provide empirical evidence for the gains of using short-dated options and SV in forecasting volatilities of the S&P 500 index and individual stocks.
4. Data and methodology
Before we delve into the data, we introduce the two key measures of volatilities in this study: implied volatility and realized volatility.
4.1. Volatility measures
Implied volatility is a measure of future asset volatility derived from options, hence the notion of options-implied volatility and forward-looking volatility. We consider two options-implied volatility measures: BSIV and SV proposed by Todorov (Reference Todorov2019). The former measure is the volatility parameter backed out of the Black–Scholes option pricing formula and provided in the CME Group dataset, while the latter is computed according to Todorov (Reference Todorov2019). SV, like BSIV, is an option-implied volatility but it spans the whole range of strikes, as opposed to a single strike for BSIV. The calculation of SV for a given contract month includes all available strikes, therefore embedding any information about volatility smiles. Todorov and Zhang (Reference Todorov and Zhang2021) show that SV, when combined with high-frequency (5-minute) returns-based realized volatility, is more informative than measures based on past returns or options alone. Following their approach, we extrapolate OTM options to the value of 2 ticks or 2.5 cents to overcome the limited range of option strikes when computing SV. The key difference between SV and ATM BSIV is that SV spans the whole spectrum of strikes, therefore potentially embedding the information on price jumps in a more proper way.
For convenience, we reproduce the option-based spot variance of Todorov (Reference Todorov2019) at time t with time-to-maturity T as follows:
 $$SV_{t,T}=-{2 \over T{\hat u}_{t,T}^{2}}\mathcal{R}\left\{\log \left({\cal L}_{t,T}\left({\hat u}_{t,T}\right)\right)\right\},$$
 $${\cal L}_{t,T}\left(u\right)=1-\left(u^{2}+iu\right){\sum} _{j=1}^{N_{t,T}}e^{iu\left[log\left(K_{j-1}\right)-log\left(F_{t,T}\right)\right]}{O_{t,T}\left(K_{j-1}\right) \over K_{j-1}^{2}}\Delta _{j},u\in {\rm R}.$$
where Nt,T, Ft,T, Kj Ot,T(Kj), Δj, T are the number of OTM option strikes, futures price with maturity T, strike price, option premium for strike Kj, strike increment (Kj – Kj-1), and time-to-maturity, respectively. Furthermore, ${{\hat u}}_{{t},{T}}={{\hat u}}_{{t},{T}}^{(1)}\,{\Lambda}\,{{\hat u}}_{{t},{T}}^{(2)}$
is defined below:
${{\hat u}}_{{t},{T}}={{\hat u}}_{{t},{T}}^{(1)}\,{\Lambda}\,{{\hat u}}_{{t},{T}}^{(2)}$
is defined below:
 $$\hat{u}_{t,T}^{\left(1\right)}=\inf \{{\rm u}\geq 0\colon \left| \hat{{\cal L}}_{t,T}\left(u\right)\right| \leq 0.2\},$$
 $$\hat{{\rm u}}_{{\rm t},{\rm T}}^{\left(2\right)}={\rm argmi}n_{u\in [0,\overline{u}]}\left| \hat{{\cal L}}_{t,T}\left(u\right)\right|.$$
where $\overline{{\rm u}}_{{\rm t},{\rm T}}=\sqrt{{2 \over {\rm T}}{\log \left(1/0.05\right) \over \widehat{{\rm BSIV}}_{{\rm t},{\rm T}}^{2}}}$
and BSIV is the BSIV of the option with the closest strike to the underlying futures price.
$\overline{{\rm u}}_{{\rm t},{\rm T}}=\sqrt{{2 \over {\rm T}}{\log \left(1/0.05\right) \over \widehat{{\rm BSIV}}_{{\rm t},{\rm T}}^{2}}}$
and BSIV is the BSIV of the option with the closest strike to the underlying futures price.
Realized volatility is a statistical measure of asset return variability that uses historical prices or returns, hence the notion of historical volatility. We calculate realized volatility (RV) as the standard deviation of the underlying futures’ daily returns. Daily return at time t, r t , is defined as the log difference of daily futures price with maturity T as follows:
 $$r_{t}=\log {F_{t,T} \over F_{t-1,T}},$$
 $$RV_{t}=\sqrt{{\sum _{i=0}^{N-1}\left(r_{t+i}-\overline{r}\right)^{2} \over N}}.$$
where $F_{t,T},\overline{r},N$
are futures prices with maturity T, mean return, and the number of days, respectively. For volatility prediction, we consider realized volatility ranging from 1 week, 2 weeks, 4 weeks, and 8 weeks. RVt throughout the paper is a short notation for RVt, t + N, ex-post realized volatility at time t for a given horizon N. RV will take the form of RVW, RV2W, RV4W, RV8W, respectively. Henceforth, we use the terminology of realized volatility (RV) in a general sense and RVW through RV8W when we refer to RV for a specific horizon. Note that all volatility measures are annualized in this study.
$F_{t,T},\overline{r},N$
are futures prices with maturity T, mean return, and the number of days, respectively. For volatility prediction, we consider realized volatility ranging from 1 week, 2 weeks, 4 weeks, and 8 weeks. RVt throughout the paper is a short notation for RVt, t + N, ex-post realized volatility at time t for a given horizon N. RV will take the form of RVW, RV2W, RV4W, RV8W, respectively. Henceforth, we use the terminology of realized volatility (RV) in a general sense and RVW through RV8W when we refer to RV for a specific horizon. Note that all volatility measures are annualized in this study.
4.2. Data and summary statistics
4.2.1. Data source
We employ end-of-day corn and soybean futures and options data from the CME Group. The data span from 1/1/2017 to 12/31/2021.Footnote 4 The options data include weekly, regular, and serial options. Weekly options have up to five contract offerings for a given calendar month. Regular options have the contract months of March (“H” as the month code), May (K), July (N), September (U), and December (Z) for corn and January (F), March (H), May (K), July (N), August (Q), September (U), and November (X) for soybeans. Serial options cover all other calendar months that are not available for regular options. The options dataset includes 70 variables, of which settlement price, open interest, volume, Globex open-high-low prices, delta, and BSIV are used in this research. We pair each option with its underlying futures price. The underlying futures contract for a weekly option is typically the nearby futures contract, or the next deferred futures contract if the options expiration week is after the regular options expiration date.
4.2.2. Summary Statistics
We report end-of-day summary statistics on select variables for corn and soybean futures and options (2017–2021) in Table 1. The variables include daily futures price (FutP), futures return (FutR), SV, BSIV, 1-week (RVW), 2-week (RV2W), 4-week (RV4W), and 8-week (RV8W) realized volatilities, option trading volume (Volm) and open interest (OI). Such statistics as mean, standard deviation (std), minimum (min), median (med), and maximum (max) are reported for the overall sample (denoted “All”) that includes weeklies and only for weeklies (denoted “Weekly”).
Summary statistics for corn and soybeans (2017–2021)

Summary statistics for corn and soybeans are reported for end of day futures price (FutP), futures return (FutR), spot volatility (SV), Black–Scholes implied volatility (BSIV), 1-week (RVW), 2-week (RV2W), 4-week (RV4W), and 8-week (RV8W) realized volatilities, option trading volume (Volm) and open interest (OI). “All” and “Weekly” cover the whole sample (including weekly options) and only weekly options, respectively. The sample period spans 2017 through 2021.
We find that the mean of futures prices is greater than the median for both commodities, indicating positive skewness. RV exhibits a contango term structure, indicating higher volatility for longer maturity, for both commodities. For corn, SV is higher than BSIV and RV with p-values less than 0.001. This implies the market impounds a higher premium in options due to the likelihood of price jumps. For soybeans, the relationship only holds largely for weekly options with p-values less than 0.001. We conjecture that it might be due to less liquidity in the soybean options and the extrapolation procedure potentially biases the estimate of SV downward. In fact, trading volumes for soybean options are 60% (calls) and 67% (puts) of their counterparts for corn options. Soybean volume and open interest levels never exceed those of corn by any moneyness category, being as low as 30% of the latter. The breakdown by moneyness categories is reported in Table A1 in the Appendix.
4.2.3. Volatility risk premium
We further examine the difference between realized volatility and implied volatility, namely VRP. Since we focus on 1-week through 8-week realized volatilities, we interpolate (or extrapolate) two nearby BSIVs to obtain a measure of implied volatility (IV) while matching the corresponding horizon of realized volatilities.Footnote 5 Figure 1 shows the median VRPs for corn and soybeans based on weekly options (VRP_w) and regular options (VRP_r). We find that (a) weekly options carry more negative VRP than regular options, but their differences narrow as the horizon increases and (b) VRPs become more negative as the horizon increases. These findings are consistent with our hypothesis (objective b) that shorter-dated options, which are often used for managing or speculating on events, price in more volatility risk.
Median volatility risk premium (VRP).

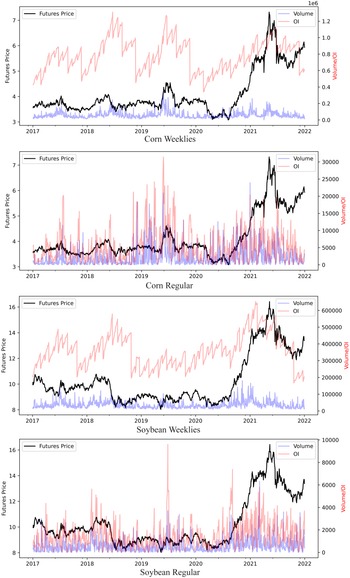
4.2.4. Volume and open interest
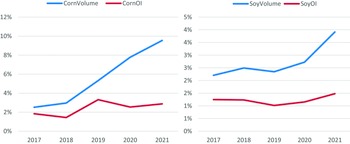
With a further look into options trading volume and open interest in Figure 2, there does not seem to be a clear trend in either weekly or regular options over the sample period of 2017 to 2021. But the comparison between the two types of options in Figure 3 shows that trading volume and open interest in weekly options have grown relative to regular options, for both commodities. Corn weeklies have seen a significant increase in trading volume, from 2.5% to 9.5% of regular options.
Options trading volume and open interest.

Weeklies as % of regular (volume and open interest).

Finally, we report the correlations among the four measures of forward volatilities in Table A2 in the Appendix. The overall finding is that weekly option-based SV and BSIV are highly correlated and that weekly and regular BSIVs are also highly correlated.
4.3. Methodology
We address the three objectives, respectively, by examining the trading activities of weekly versus regular options, the responsiveness of future realized volatility to implied volatility at the monthly horizon interval and the weekly horizon, especially around major USDA reports, and the relative information content of weekly and regular options and of SV and BSIV in predicting future volatility.
We run a regression of the ratio of trading volume (and open interest) of regular versus weekly options to determine (a) whether there is an upward trend in the popularity of weekly options and (b) whether the popularity of weekly options is positively associated with major reports.
 $$\textit{Ratio}_{t}=b_{0}+b_{1}t+b_{2}\textit{WASDE}_{t}+e_{t}$$
where the “Ratio” variable is the ratio of trading volume or open interest of regular options to that of weekly options, “t” is the time trend variable, and “WASDE” is a dummy variable that takes value 1 when the trading date is on or before a WASDE or major USDA report date.
We first consider a one-month ahead prediction of realized volatility. Since each month contains at least a WASDE report, market participants can use regular options to express their views about future volatilityFootnote 6 . BSIV is a commonly used measure of volatility inferred from an option price. We use the realized volatility with 28 days (or adjusted for holidays) until expiration as the dependent variable to examine its responsiveness to BSIV. This is a departure from the literature, which often considers a longer lead time prior to and following the event date, e.g., the event window in Cao and Robe (Reference Cao and Robe2022).
The regression is given as follows:
 $$RV_{t}=b_{0}+b_{1}BSIV_{t}+e_{t}$$
where RV t and BSIV t are the one-month ahead realized volatility and the BSIV, respectively.Footnote 7 A value of b1 less than 1 would indicate the existence of a VRP or of the implied volatility overestimating realized volatility.
In contrast, the presence of weeklies allows traders to position around major reports. By design, there is a weekly option that will expire on the Friday following a given major report. The underlying futures price may continue to adjust and/or incorporate information, but the weekly option’s expiration provides a different way to look at positioning around events. The relevant timeframe is now one week as opposed to one month. The differences can be quantified by adding a dummy variable if the week contains a major report or reports, and a dummy variable interaction term with the implied volatility if the week contains a major report or reports. The regression is given as follows:
 $$RV_{t}=b_{0}+b_{1}BSIV_{t}+b_{2}D_{t}+b_{3}(D_{t}\times BSIV_{t})+e_{t}$$
where RV t is the one-week ahead realized volatility, BSIV t and D t are the BSIV, and a dummy variable if the week contains a major report or reports, respectively.Footnote 8 Differences in the parameter estimates between (2) and (3) would support different responsiveness of RV to implied volatility and events across prediction horizons.
4.4. Information content of implied volatility
The unique features of weekly options lend themselves to potential advantage in predicting future volatility. We run a regression of realized volatility on a combination of implied volatility measures, an extension of Carr and Wu (Reference Carr and Wu2009), Egelkraut et al. (Reference Egelkraut, Garcia and Sherrick2007), Szakmary et al. (Reference Szakmary, Evren, Kim and Davidson2003), and Wang et al. (Reference Wang, Fausti and Qasmi2012). We conjecture that (a) both weekly and regular options can inform future volatility as the prior literature provides empirical evidence for the predictive power of implied volatility and (b) SV as an option-based measure of the “true” underlying volatility proposed by Todorov (Reference Todorov2019) embeds additional information beyond BSIV as discussed in Section 3.
The benchmark regression is given as follows:
 $$RV_{t}=b_{0}+b_{1}SV_{wt}+b_{2}BSIV_{wt}+b_{3}SV_{rt}+b_{4}BSIV_{rt}+e_{t}$$
where “w” and “r” denote “weekly” and “regular,” respectively, and the dependent variable, RV, can take the form of RVW, RV2W, RV4W, RV8W for 1-week, 2-week, 4-week, and 8-week realized volatility, respectively.
We assess the informativeness of weekly versus regular options in predicting future volatility using the forecast encompassing regression as in Harvey et al. (Reference Harvey, Leybourne and Newbold1998) and Manfredo and Sanders (Reference Manfredo and Sanders2004). We run two competing predictive regressions of RV on weekly SV and BSIV, and on regular SV and BSIV, namely the first and last two nonintercept regressors in Equation (4), respectively. We obtain the predicted values from each regression and regress RV on the two competing predictions as follows:
 $$RV_{t}=b_{0}+b_{1}RV_{wt}+b_{2}RV_{rt}+e_{t}$$
where “RVwt” and “RWrt” denote predicted values from “weekly” and “regular” regressions, respectively, and the dependent variable, RV, is the same as in equation (3). An insignificant b1 (b2) means weekly (regular) SV and BSIV do not provide additional information beyond what is done by their regular (weekly) counterparts, hence being encompassed by the latter.
Similarly, we assess the informativeness of SV versus BSIV in predicting future volatility. We run competing predictive regressions of RV on weekly and regular SV, and on weekly and regular BSIV, the first and the third regressors versus the second and the fourth regressors in equation (4), respectively. The equivalent encompassing test regression is given as
 $$RV_{t}=b_{0}+b_{1}RV_{SVt}+b_{2}RV_{\textit{BSIVt}}+e_{t}$$
where “RVSVt” and “RWBSIVt” denote predicted values from regressions using SVs and BSIVs, respectively, and the dependent variable, RV, is the same as in equation (3). An insignificant b1 (b2) means SV (BSIV) is encompassed by their BSIV (SV) counterparts.
Next, we cast all four RV predictions, RVW-RV8W, in a multivariate setting. Similar to Goyal and Adjemian (Reference Goyal and Adjemian2021), we run a DCC-GARCH model to account for the ARCH effect and the dynamic correlations among the residuals of regressions for the four RV measures. We further control the general market uncertainty by including the VIX (Cboe Global Markets volatility index for the S&P 500), the specific macroconditions by including the trade war (2018–2019) and the COVID pandemicFootnote 9 (January 23 to December 31, 2020) dummy variables and seasonality by including seasonal dummy variables. The final regression takes the following form:
 $$RV_{t}=b_{0}+b_{1}SV_{wt}+b_{2}SV_{rt}+b_{3}BSIV_{rt}+b_{4}SV_{wt-1}+{b_{5}}S{V_{rt-1}}+b_{6}X_{t}+e_{t}$$
where Xt is a collection of control variables, including the VIX, the trade war, the COVID period, and seasonality dummy variables.Footnote 10 The definition of seasonality dummies follows Goodwin and Schnepf (Reference Goodwin and Schnepf2000) and Elegkraut et al., (Reference Egelkraut, Garcia and Sherrick2007). We divide the calendar year into three seasons: the pre-growing season from January to May as Season 1, the growing season from June to August (Season 2), and the harvest season from September to December as Season 3.Footnote 11
The high correlations among forward volatility measures reported in Section 4.2 could point to potential multicollinearity in Equation (4c). To address the issue, we exclude regressors that have variance inflation factors (VIFs) higher than 5. As a result, the VIFs for the remaining regressors are well below 5 after the above treatment. The detailed VIF values are reported in Table A3 in the Appendix. More specifically, we exclude BSIVwt and add statistically significant lagged variables of weekly and regular spot volatilities.Footnote 12
5. Results and discussion
We report the regression results for relative trading volume and open interest in Table 2. We find that the coefficients for the trend and the WASDE dummy are negative and statistically significant at the 10% or better level. This indicates the growing influence of weekly options over time and around major report dates relative to regular options, confirming the visual evidence in Figure 3.
Popularity of weekly vs. regular options

This table reports the regression of equation (1) for corn and soybeans using weekly and regular options from 2017 to 2021. “coef” and “std err” represent coefficient estimate and standard error, respectively. The dependent variable is volume or open interest ratio of regular to weekly options. Standard errors are HAC robust with 5 lags. A negative coefficient means declining popularity of regular versus weekly options. “t” and “WASDE” are a time trend variable and a dummy variable indicating the WASDE reporting day, respectively. ***, **, * represents statistical significance at the 1, 5 and 10% level, respectively.
5.1. Volatilities and volatility risk premia around major reports
During the sample period, 2017 through 2021, there were 59 WASDE dates and 74 distinct dates with reports.Footnote 13 The WASDE and other reports were released during trading days at noon ET during the sample period. To assess the futures variability on major report dates, we analyze the daily high–low spread, volatility risk premia, and the responsiveness of realized volatility to Black–Scholes implied volatilities on major report and non-report dates. Holidays are present in the futures data, so those observations were removed. The volatility measures at the one-month and one-week intervals reported in this section are nonoverlapping, contrasting with the end-of-day measures in Table 1.
On average for the full sample, 1,261 trading days, the observed high–low range or spread for corn futures prices was $0.08 per bushel. On dates with a major report, 74 trading days, the daily high–low spread averaged $0.14 per bushel on the nearby corn futures. On non-report dates, 1,187 trading days, the spread averaged $0.08 per bushel. For soybeans, the spread on report dates was $0.25 per bushel versus $0.17 per bushel for both the full sample period and non-report dates. The difference in the spread between report and non-report dates is statistically significant for both commodities at the 0.001 level. Thus, there is more variability and risk present on major report dates. The higher variability might be associated with a greater trading volume on major report dates (see Table A4 in the Appendix). The average trading volumes for corn options are 56% higher for calls and 72% higher for puts on reporting dates than an average day. The corresponding values are 40 and 64% for soybean options. Such hikes are not evident in option prices and open interest.
We first examine the responsiveness of one-month realized volatility to BSIV in the baseline regression, equation (2), in which USDA reports are always present. For the corn model, the intercept coefficient is not statistically different from zero at the 0.05 level. The implied volatility coefficient, at 0.836, is statistically significant from 1.0 at the 3% significance level (Table 3 and Figure 4). In other words, BSIV overestimates the corresponding volatility realized in the future. We also run the same regression in equation (2) for VRP. We find VRP for corn is not statistically significant at the monthly interval but responds positively and significantly to higher implied volatility (Table A5 in the Appendix). For soybeans, the intercept is not statistically significant. The implied volatility coefficient is 0.966, not significantly different from 1.0. Unlike corn, we find no statistically significant VRP for soybeans at the monthly interval. Different from corn, the positive association of implied volatility with VRP is not statistically significant.
Implied and realized volatilities comparisons.

One-month ahead realized volatility model

Note: This table reports the regression results for one-month ahead realized volatility. The regression model is given as follows: RV t = b 0 + b 1 BSIV t + e t , where RV and BSIV are realized volatility and Black–Scholes implied volatility from regular options, respectively. “coef,” “std err,” and “R 2” represent coefficient estimate, standard error, and R-squared, respectively. ***, **, * represent statistical significance at the 1, 5, and 10% level, respectively.
We then distinguish realized volatilities between the report and non-report dates. With weekly options, we can measure implied volatilities directly associated with report dates. We compare realized volatilities and BSIV measured one-week ahead for both report and non-report dates. For the full corn sample, the implied volatility for the week ahead averaged 21.5% while the realized volatility averaged 17.3%, implying a VRP of 420 basis points (bps). However, much of the difference was concentrated in weeks that contained a major report. During weeks with major reports pending, the implied volatility averaged 25.6% and the realized volatility averaged 16.8%, i.e., a VRP of 880 bps. In weeks without a major report pending, the implied volatility averaged 19.8% and the realized volatility averaged 17.5%, i.e., a VRP of 230 bps. A major report induces an additional premium of 650 bps for corn. For the full soybean sample, the implied volatility for the week ahead averaged 16.7% while the realized volatility averaged 13.9%, i.e., a VRP of 280 bps. During the weeks with major reports, the implied volatility was 19.0% and the realized averaged 14.5%, i.e., a VRP of 450 bps. In non-report weeks, the implied volatility was 15.8%, and the realized was 13.7%, i.e., a VRP of 210 bps. A major report drives an additional premium of 240 bps. These findings are also confirmed by the regression results reported in Table A6 in the appendix (see Models 1 and 3). In other words, in the short run during weeks with major reports, there was a substantially higher VRP paid for weekly options than during weeks without major reports. This finding contrasts with no significant VRP for regular options at the monthly interval.
Finally, we evaluate the responsiveness of one-week realized volatility to BSIV. For corn, the slope coefficient for BSIV in Equation 3 is 0.835, less than 1 and statistically significant. The presence of major reports results in a pronounced shift up in the intercept and a pronounced shift down in the slope (Table 4). The shift is evident in the diamond-shaped observations in Figure 4. In other words, during report weeks, the implied volatility outpaces the realized volatility. We also run the same regression in equation (3) for VRP. We find VRP for corn is statistically significant at the weekly interval and responds positively and significantly to higher implied volatility and major reports (Table A6 in the Appendix). For soybeans, the results are not as pronounced. The implied volatility coefficient, b1 in equation (2), is 0.842, but not significantly different from 1. Conditional on a USDA report, BSIV overestimates the corresponding volatility realized in the upcoming week, as evidenced by the rejection of b1+b3 = 1 in equation (3) at the 2% significance level. Like corn, we find a statistically significant VRP for soybeans at the weekly interval. There is also a positive association of implied volatility and major reports with VRP (Model 4 in Table A6 in the Appendix), but the relationship is not statistically significant once the interaction between BSIV and major reports is controlled.
One-week ahead realized volatility model

This table reports the regression results for one-week ahead realized volatility. The regression model is given as follows: RV t = b 0 + b 1 BSIV t + b 2 D t + b 3(D t ×BSIV t ) + e t , where RV and BSIV are realized volatility and Black–Scholes implied volatility from options expiring within one weekFootnote 14 , respectively. D is a dummy variable for major report dates. “coef,” “std err,” and “R 2” represent coefficient estimate, standard error, and R-squared, respectively. ***, **, * represent statistical significance at the 1, 5, and 10% level, respectively.
Note: Blue dots in the left panel represent combinations of implied and realized volatilities for non-reporting days. Red diamonds in the left panel represent the combinations for major reporting days. Blue dots in the right panel represent the combinations for all days. Solid lines are a linear fit to the respective data.
5.2. Forecast encompassing and volatility prediction
The forecast encompassing regression in Equation (4a) helps answer whether the information embedded in weekly options is subsumed by that in regular options. We report the encompassing regression results in Table 5. Recall that RVw and RVr are predicted RV values using weekly and regular options information, respectively. Both coefficients for corn and soybeans are statistically significant at the 5% or better level for the 1-week and 2-week horizons, indicating both weekly and regular options are informative in predicting future volatility. Information from weekly options is unique and not encompassed by regular options in short horizons. However, only the coefficients for regular options for both corn and soybeans are statistically significant for the 4-week and 8-week horizons. In other words, information from weekly options is subsumed by regular options in longer horizons.
RV forecast encompassing (weekly versus regular)

Note: This table reports the regression of Equation (4a) for corn using weekly and regular options from 2017 to 2021. Subscripts “w” and “r” in the regression variables denote “weekly” and “regular,” respectively. “coef,” “std err,” and “R 2” represent coefficient estimate, standard error, and R-squared, respectively. Standard errors are HAC robust with 5 lags. ***, **, * represent statistical significance at the 1, 5, and 10% level, respectively.
The forecast encompassing regression in Equation (4b) helps answer whether information embedded in SV is subsumed by that in BSIV. The encompassing regression results are reported in Table 6. RVSV and RVBSIV are predicted RV values using SV and BSIV, respectively. In all 8 cases, only the coefficient for BSIV is statistically significant at the 5% or better level, indicating only BSIV is informative in predicting future volatility when compared to SV. Information from SV is encompassed by BSIV in both short and long horizons in the context of Equation (4b). Although it does not mean SV does not possess meaningful information, the classical BSIV is a stronger predictor of future volatility. One reason is that SV requires a larger number of strikes to be computed as opposed to the classical ATM BSIV Using the end-of-day interval data may mask any intraday price jumps that are meaningful to SV. Both might dampen the usefulness of SV measure for agricultural commodity options, compared to stock index options studied by Todorov (Reference Todorov2019).
RV forecast encompassing (SV versus BSIV)

Note: This table reports the regression of Equation (4b) for corn using weekly and regular options from 2017 to 2021. Subscripts “SV” and “BSIV” in the regression variables denote “spot volatility” and “Black–Scholes implied volatility,” respectively. “coef,” “std err,” “R 2” represent coefficient estimate, standard error, and R-squared, respectively. Standard errors are HAC robust with five lags. ***, **, * represent statistical significance at the 1, 5, and 10% level, respectively.
We report realized volatility prediction results (Equation 4c) for corn and soybeans in Table 7. Regular BSIV is statistically significant at the 1% level across all time horizons. This finding is consistent with the existing literature (Egelkraut et al., Reference Egelkraut, Garcia and Sherrick2007; Wang et al., Reference Wang, Fausti and Qasmi2012). Regular BSIV also carries the highest weight among all four implied volatility measures in predicting future volatility. The coefficient for BSIV loads more heavily for soybeans than for corn. For corn, SV shows statistical significance at longer horizons (4–8 weeks). For soybeans, weekly SV is statistically significant in shorter time horizons up to 2 weeks, and regular SV becomes significant for longer horizons (4–8 weeks). This evidence indicates additional information afforded by OTM options. Overall, the effect of SV is not as strong as BSIV. The VIX and the COVID factors are statistically significant at the 5% level in general for soybeans, but only show varying degrees of significance in 2-week and 4-week volatility predictions for corn. The trade war factor has mixed results: stronger effects seem to be found to be short lived (1 week) for corn but to be more prominent for most horizons for soybeans. In terms of seasonality, the common findings are that the growing season (the Season 2 dummy) exhibit higher realized volatility for corn, but lower for soybeans except at the 1-week horizon. The negative sign in the growing-season dummy variable seems counterintuitive for soybeans. The large positive coefficient of regular BSIV, ranging from 0.392 to 0.550, shows that a significant degree of seasonality is already captured in implied volatilities as known in the previous literature (Egelkraut et al., Reference Egelkraut, Garcia and Sherrick2007, Goswami and Karali, Reference Goswami and Karali2022). On the other hand, the smaller coefficient for regular BSIV for corn, ranging from 0.169 to 0.369, leaves room for the seasonal dummy to capture additional positive effects.
Realized volatility prediction

The conventional wisdom still holds that the classical BSIV from regular options is informative; weekly options are particularly informative in near term, and SV provides extra information beyond the traditional Black–Scholes volatility when all four RV predictions are modeled simultaneously (as opposed to the univariate prediction in the forecast encompassing test).
6. Conclusions
The popularity of weekly options on grain futures poses a critical question of whether they provide additional information or simply generate noise in the market. The essential determinant of an option’s price is its underlying asset volatility, which can be input to the Black–Scholes formula or a more sophisticated function of option prices (see Todorov, Reference Todorov2019). Understanding the predictability of various option-implied volatility for future realized volatility is critical in answering the question of informativeness of options. If weekly options are uninformative, their mere existence will be called into question. We fill the gap in the existing literature on short-dated options on grain futures or agricultural commodities.
Using end-of-day weekly and regular option data on corn and soybeans, we find that:
-
(a) Weekly options have gained popularity over the past five years due to their ability to position around important events, such as major USDA reports.
-
(b) There is a negative VRP, i.e., implied volatility is greater than realized volatility in the weekly options and surrounding important events. BSIV overestimates future realized volatility, more so when major USDA reports are pending. Market participants overpay future realized volatility by 420 bps for corn and 280 bps for soybeans. Major reports induce an additional premium of 650 bps for corn and 240 bps for soybeans.
-
(c) Weekly options are particularly informative in the near term (up to two weeks) and SV does not provide extra information beyond the traditional BSIV when assessed in a univariate volatility prediction setting. When dynamic correlations between realized volatilities at different horizons and more control variables are considered, SV shows potential in volatility prediction.
Because weekly options provide information that is distinct from regular options, they may potentially increase efficiency in these markets. Traders still need to consider the trade-offs between lower capital outlays for short-dated options and the higher variance risk premium present. The liquidity, especially for corn, does not seem to suggest crowding out of the weekly options compared to regular options. Our current study is limited to the sample period from 2017 to 2021, when the commodity market experienced the COVID-19 pandemic and the trade war. We will leave to future research the analysis with a longer sample period. Our current study employs daily data, which smooths out intraday price movements. Price impacts in agricultural commodity markets are often short-lived as shown in Lehecka et al. (Reference Lehecka, Wang and Garcia2014). Todorov and Zhang (Reference Todorov and Zhang2021) also argue for the usefulness of high-frequency returns-based volatility for future volatility prediction. Another avenue to pursue in the future is to use intraday data to capture the nuanced intraday behavior in volatilities, especially around USDA report days when trading volumes are high.
Acknowledgements
We appreciate the helpful comments by Michel Robe and participants at NCCC-134 2022 Annual Conference and CEMA 2022 Annual Meeting. An earlier version of this paper that was presented at the NCCC-134 conference and was archived at https://legacy.farmdoc.illinois.edu/nccc134/. All errors are our own.
Data availability statement
The data that support the findings of this study are available from CME Group. Restrictions apply to the availability of these data, which were used under license for this study. Data are available from the authors with the permission of CME Group.
Author contribution
Conceptualization, M.D. and Z.W.; data curation, M.D. and Z.W.; formal analysis, M.D. and Z.W.; investigation, M.D. and Z.W.; methodology, M.D. and Z.W.; software, Z.W.; writing—original draft, M.D. and Z.W.; writing—review and editing, M.D. and Z.W.
Competing interests
We declare none.
Funding statement
This research received no specific grant from any funding agency, commercial, or not-for-profit sectors.
AI contributions to research
Spelling and grammar was checked in Microsoft 365 Word (Version 2403). ChatGPT was also used for spelling and grammar. ChatGPT was also used to debug some Python code.
APPENDIX
Soybeans vs. corn liquidity

Note: “Volume” and “Open Interest” columns are defined as the percentage of soybeans to corn in their respective measures. “ATM” is defined as strikes within 1% of the underlying futures price. The rest of the moneyness categories are defined in the 5% increment of the futures prices. DITM, ITM, ATM, OTM, and DOTM represent deep-in-the-money, in-the-money, at-the-money, out-of-the-money, and deep-out-of-the-money options, respectively.
Correlation matrix for forward volatilities

Note: Correlations are reported for four forward volatilities for corn and soybeans. SV and BSIV represent spot volatility and Black–Scholes implied volatility, respectively. Subscripts “w” and “r” indicate volatilities being implied from “weekly” and “regular” options, respectively.
VIF values

This table reports variance inflation factor (VIF) values for the regression equation (4c).
Option prices, trading volume and open interest on major reporting dates

Note: This table reports options price, trading volume, and open interest for the overall sample and the sample with major USDA/WASDE reports for corn and soybeans. The sample period spans 2017 through 2021.
One-month ahead VRP model

Note: This table reports the regression results for one-month ahead realized volatility. The regression model is given as follows: VRP t = b 0 + b 1 BSIV t + e t , where BSIV and VRP and Black–Scholes implied volatility and volatility risk premium (BSIV minus realized volatility) from regular options, respectively. “coef,” “std err,” and “R2” represent coefficient estimate, standard error, and R-squared, respectively. ***, **, * represent statistical significance at the 1, 5, and 10% level, respectively. Models 1–2 add regressors incrementally.
One-week ahead VRP model

Note: This table reports the regression results for one-week ahead realized volatility. The regression model is given as follows: VRP t = b 0 + b 1 BSIV t + b 2 D t + b 3(D t ×BSIV t ) + e t , where BSIV and VRP and Black–Scholes implied volatility and volatility risk premium (BSIV minus realized volatility) from weekly options, respectively. D is a dummy variable for major report dates. “coef,” “std err,” and “R2” represent coefficient estimate, standard error, and R-squared, respectively. ***, **, * represent statistical significance at the 1, 5, and 10% level, respectively. Models 1–5 add regressors incrementally.


 Open access