


Introduction
Integrating legumes into cropping systems is recognised for the benefits legumes have for associated main crops, and these impacts are greater under low fertiliser input management systems (Zhao et al., Reference Zhao, Chen, Beillouin, Lambers, Yang, Smith, Zeng, Olesen and Zang2022). In Africa, reinforcing cereal-based cropping systems with grain legumes provides a range of benefits for rotation with expected positive impacts on staple crop nutrition, as well as insect and weed control (Daryanto et al., Reference Daryanto, Fu, Zhao, Wang, Jacinthe and Wang2020; Franke et al., Reference Franke, van den Brand, Vanlauwe and Giller2018). In small-farming contexts, legumes also provide farmers with supplementary food, additional incomes and, in some cases, high-quality forage (Muoni et al., Reference Muoni, Barnes, Öborn, Watson, Bergkvist, Shiluli and Duncan2019). In Madagascar, including legumes in cereal rotations has been shown to play a role in controlling Striga asiatica, a parasitic weed of rice, not only in field experiments (Randrianjafizanaka et al., Reference Randrianjafizanaka, Autfray, Andrianaivo, Ramonta and Rodenburg2018) but also in real farm conditions (Scott et al., Reference Scott, Scholes, Randrianjafizanaka, Randriamampianina, Autfray and Freckleton2020). Short-term increases in grain yields were also obtained in under improved fallow management (Ripoche et al., Reference Ripoche, Autfray, Rabary, Randriamanantsoa, Blanchart, Trap, Sauvadet, Becquer and Letourmy2021) or when intercropped with cereals (Rodenburg et al., Reference Rodenburg, Randrianjafizanaka, Büchi, Dieng, Andrianaivo, Ravaomanarivo and Autfray2020) thanks to improved soil fertility and increased nitrogen (N) availability. Different types of legumes vary in their cycles, vegetative growth and pod. Greater rotational benefits of grain legumes for cereals have been shown for those with a low harvest index and high above-ground N accumulation, thus increasing the amount of residual N available for the following crop (Vanlauwe et al., Reference Vanlauwe, Hungria, Kanampiu and Giller2019). Despite the breakdown failure of cereal monocropping, the adoption of legumes in the smallholder farmers’ context remains limited due to several factors, including market access and pest control (Mhango et al., Reference Mhango, Snapp and Phiri2013). Although legumes are usually considered as minor crops compared to cereals, and account for a low percentage of total cropped area, they offer a wide range of opportunities for integration in cereal-based cropping systems (Franke et al., Reference Franke, van den Brand, Vanlauwe and Giller2018; Mhango et al., Reference Mhango, Snapp and Phiri2013) or with tubers (Dettweiller et al., Reference Dettweiler, Wilson, Maltais-Landry and MacDonald2023). These options have been widely studied across many agrosystems and shown to vary in space (as intercrops) and over time (in rotations) (Brooker et al. Reference Brooker, Bennett, Cong, Daniell, George, Hallett, Hawes, Iannetta, Jones, Karley, Li, McKenzie, Pakeman, Paterson, Schöb, Shen, Squire, Watson, Zhang and White2015). As C3 plants, legumes are known to exploit low solar energy and are hence preferred companion crops for cereals in a wide range of sowing systems, including mixed intercropping, row intercropping, and relay intercropping (Malézieux et al., Reference Malézieux, Crozat, Dupraz, Laurans, Makowski, Ozier-Lafontaine, Rapidel, Tourdonnet and Valantin-Morison2009; Mugi-Ngenga et al., Reference Mugi-Ngenga, Bastiaans, Anten, Zingore and Giller2022; Yu et al., Reference Yu2015). Generally, efficient mixed cropping systems provide better yields per unit area of land when the objective is to maximise the cereal yield (Rusinamhodzi et al., Reference Rusinamhodzi, Corbeels, Nyamangara and Giller2012). However, there may be strong interactions between the performance of legumes and that of the associated crops due to specific complementary and/or competitive effects driven by soil fertility management (Dettweiler et al., Reference Dettweiler, Wilson, Maltais-Landry and MacDonald2023; Kermah et al., Reference Kermah, Franke, Adjei-Nsiah, Ahiabor, Abaidoo and Giller2017). Ex-ante modelling based on expert knowledge is one way to explore feasible technical options to include legumes in cropping systems and to include a wide range of technical factors, e.g. species, genotypes, sowing patterns (Gaudio et al., Reference Gaudio, Escobar-Gutiérrez, Casadebaig, Evers, Gérard, Louarn, Colbach, Munz, Launay, Marrou, Barillot, Hinsinger, Bergez, Combes, Durand, Frak, Pagès, Pradal, Saint-Jean, Van Der Werf and Justes2019). In Madagascar, all expert-based feasible 2-crop intercropping options among a group of 13 legume species have been tested using ex-ante modelling (Naudin et al., Reference Naudin, Husson, Scopel, Auzoux, Giner and Giller2015). Another approach consists of focusing on a few contrasted legume scenarios with the aim of obtaining the provision of diverse ecological services (Ranaivoson et al., Reference Ranaivoson, Falconnier, Affholder, Leroux, Autfray, Muller, Auzoux and Ripoche2022; Ripoche et al., Reference Ripoche, Autfray, Rabary, Randriamanantsoa, Blanchart, Trap, Sauvadet, Becquer and Letourmy2021, Reference Ripoche, Barkaoui, Allouch, Christina, Heuclin, Rafenomanjato, Moonen, Autfray and Marnotte2024). Some field studies, although valuable, failed to integrate the social context right from the start, thereby limiting the impact of the results of the research (Daryanto et al., Reference Daryanto, Fu, Zhao, Wang, Jacinthe and Wang2020; Mhango et al., Reference Mhango, Snapp and Phiri2013; Nederlof and Dangbégnon, Reference Nederlof and Dangbégnon2007). The objective of the present study was to explore different scenarios for the introduction of legumes into upland rice-based cropping systems. As a first step of a participatory approach, large-scale controlled experiments involving a group of farmers over a period of three years made it possible to focus on three main indicators of agriculture performance at the rotation scale: economic via gross incomes (Sánchez et al., Reference Sánchez, Kamau, Grazioli and Jones2022), environmental via carbon soil inputs through crop residue (Fujisaki et al., Reference Fujisaki, Chevallier, Chapuis-Lardy, Albrecht, Razafimbelo, Masse, Ndour and Chotte2018) and social via farmers’ acceptance (Thomas et al., Reference Thomas, O’Hare and Coyle2023).
Materials and methods
The experimental site and the farmers
The experimental site (Figure 1a, b) comprised two contiguous fields in a research-controlled area in the mid-west of the Vakinankaratra region of Madagascar, where upland rice selection and agronomic trials have been conducted for more than 10 years (Dusserre et al., Reference Dusserre, Raveloson, Michellon, Gozé, Auzoux and Sester2017; Ripoche et al., Reference Ripoche, Autfray, Rabary, Randriamanantsoa, Blanchart, Trap, Sauvadet, Becquer and Letourmy2021; Rodenburg et al., Reference Rodenburg, Randrianjafizanaka, Büchi, Dieng, Andrianaivo, Ravaomanarivo and Autfray2020). The mean average temperature and rainfall during the 2016–2017, 2017–2018 and 2018–2019 cropping seasons (October 1 to September 30) recorded by a closed automatic climatic station were, respectively, 23.9, 23.4, 23.6 and 1352, 1415, 1215 mm, with no exceptional rainfall events. Soil characteristics were determined on one field in 2017 in the 0–10 and 10–20 cm soil layers and corresponded to the average characteristics of an Oxisol (USDA) comprising, respectively, 33% and 34% clay, 17% and 18% silt and 50% and 48% sand. The soil contained, respectively, 15.9 and 11.0 g kg−1 of C, 1.30 and 1.00 g kg−1 of total N, 870.9 and 658.2 mg kg−1 of total P and 3.5 and 1.6 mg kg−1 of available Olsen P. The average pH of the water was, respectively, 5.89 and 5.83 and the bulk density, respectively, 1.09 and 1.24. Twenty partner farms were located along a main road close to the research site (Figure 1a). This farmers’ group was voluntary and was based on a balance between partners in previous projects to promote agroecology and farmers not involved in any previous projects, according to the principles of experiential science (Baars, Reference Baars2011).
(a) Location of the research site and the network of farms in the mid-west of the Vakinankaratra region of Madagascar (Sources, altitude: NASA, SRTM 1 arc second Global, 2015; roads, towns, administrative boundaries, OSM, OpenStreetMap, 2019); (b) the two fields used for the experiments showing each component of the two-year rotations, legume-based cropping systems (BCS) and rice; (c) 36 plots represented in one block of the strip-plot design; the cropping intensity factor in the four systems, sole crop (SC), intercropping with maize (IM), intercropping with cassava (IC), intercropping with maize and cassava (ICM); the legume cropping factor with nine systems, one control with no legume, four pulses and four cover crops: rice (RI), maize (MA), cassava (CA), peanut (PA), bambara nut (PB), cowpea (PC), soybean (PS), velvet bean (CV), crotalaria (CC), pigeon pea (CP) stylosanthes (CS); (d): an elementary plot, length 7.5 m, width 5.25 m and 0.125 m × 0.125 m element grid; the location of the main rows of maize or cassava is shown in red.

Participatory experiments
The aim of this farmer-researcher collaboration was to reinforce the inclusion of legumes in rice-based cropping systems and during this first step over three years, to explore all feasible scenarios. In June 2016, a gender balanced working session involving 20 households was organised to identify cropping patterns in 2-year upland rice rotations. Farmers were asked to answer the following question: ‘Which legume cropping system is it possible to test in 2-year rotations with rice?’. They identified four cropping intensities and eight legume species. The four cropping intensities corresponded to cultivation as a sole crop (SC), as an intercrop with maize (IM), as an intercrop with cassava (IC), and as an intercrop with maize and cassava (IMC). Cropping intensity was defined as the number of crops grown in a year: 1 for the sole crop, 2 for the legume-maize intercrop and the cassava-maize intercrop and 3 for the legume-maize-cassava intercrops. The eight-legume species included four pulses, peanut (Arachis hypogaea), bambara nut (Vigna subterranea), cowpea (Vigna unguiculata), and soybean (Glycine max) and the four cover crops, velvet bean (Mucuna pruriens), showy rattlebox (Crotalaria spectabilis), pigeon pea (Cajanus cajan) and stylosanthes (Stylosanthes guianensis). In our study region, peanut and bambara nut are already widely cultivated by farmers mainly for the market, while cowpea and soybean were introduced for the purpose of diversification, both for food consumption and the market. The legume cover crops have been promoted for many years by NGOs as cover crops to control cereal pests and have been tested in conventional and no-tillage cropping systems (Naudin et al., Reference Naudin, Husson, Scopel, Auzoux, Giner and Giller2015; Randrianjafizanaka et al., Reference Randrianjafizanaka, Autfray, Andrianaivo, Ramonta and Rodenburg2018; Razafimahatratra et al., Reference Razafimahatratra, Bignebat, David-Benz, Bélières and Penot2021; Rodenburg et al., Reference Rodenburg, Randrianjafizanaka, Büchi, Dieng, Andrianaivo, Ravaomanarivo and Autfray2020). The functions of the legumes and the main uses of rice, maize and cassava are summarised in Table S1. A full factorial strip-plot experiment with four blocks was implemented with cropping intensity and legume cropping as factors, plus controls with no legume. The four controls without legume were rice as SC (i.e. rice monocropping), maize as the sole crop in IM, cassava as the sole crop in IC and maize-cassava intercropping in IMC. As an example, Figure 1c shows the 36 treatments applied in a block. The 36 combinations of the two factors were randomised strip by strip in each block. In the 2016–2017 cropping season, in the first field that had a total area of 6,090 m−2, the 36 cropping patterns of the first component of the bi-annual rotations were implemented in November 2016. In the following cropping season (2017–2018), a rice crop was grown in the same field as in the previous season, while in another narrow field with a total area of 5616 m−2, the same 36 cropping systems as previously were implemented in November 2017. In November 2018, during the third cropping season, in the first field, the same 36 cropping systems were again implemented, while in the second field, rice was cropped as a sole crop (Figure 1b). Thus, taking the last two cropping seasons into account, the same bi-annual rotations in each field made it possible to assess the same two components of a 2-year upland rice-based cropping rotation. Varieties, their cycles and sowing patterns as sole crops are listed in Table S1. Table S2 summarises the row patterns, relative densities, i.e. densities of sole crops and overlapping indices from crop cycles (Table S1) for all the intercrops. Relative crop densities ranged from 0.50 to 1.00, intercrops from 1 to 2.17 (1 equivalent to sole cropping, 2 the double density in intercrops). In the IMC control, maize was sown at the same density as in monocropping, while cassava was sown at half its sole-crop density. Overlapping indices of the growth periods for intercrops ranged from 0.07 to 0.67 (0 indicates complete overlap of crop cycles; 1 indicates no overlap). Each elementary plot measured 7.5 m × 5.25 m, subdivided into a grid of 0.125 m × 0.125 m (Figure 1d) to allow precise sowing of density and row pattern (Table S2).
Soil and crop management
The two fields had previously been used to cultivate pulses without fertiliser. In the 2016–2017 and 2018–2019 seasons (first field) and in 2017–2018 (second field), ploughing was done twice by hand using an angady (local spade), once in May and once in October. In 2017–2018 (first field) and 2018–2019 (second field), before rice cultivation, ploughing was limited to the five pulse cropping systems and the control; no ploughing was done for the four cover crops before rice sowing. All crops were sown annually in November in the following order: rice, maize, cassava, peanut, bambara nut, cowpea, soybean, velvet bean, showy rattlebox, pigeon pea, and stylosanthes. Only the rice seeds were treated against grubs using an insecticide (Insector®: 35% imidacloprid + 10% thiram, at a dose of 2.5 g per kg of seeds). Following the farmers’ usual practices, manure was applied in holes only for rice, maize and soybean and on a dry weight basis of 5 t ha−1, both as sole crops and as intercrops. Manure was subject to quality control in 2016, 2017, 2018 and showed the following mean respective annual percentages: total C, 8.45%, 6.13%, 9.88%; total N, 0.69%, 0.50%, 0.83%; total P, 0.17%, 0.14%, 0.22%. No chemical fertiliser was applied, and weeding was done by hand twice, usually one or two months after sowing. Except for cover crops, all crops were harvested at maturity from each elementary plot, leaving one crop line as a border. Cowpea was harvested twice. Grains and tubers were weighed in the field, with moisture content standardised to 13% after oven-drying samples. All above-ground parts of cereals and legumes (pulses and cover crops) were weighed separately and expressed on a dry matter basis after drying a 500 g sample. After weighing, a 100 g sub-sample was kept for dry matter and total C content determination with a CHNS microanalyzer (Flash 2000 Series, CHNS/O 122 Analyzers Thermo Scientific, IRCOF, France). Then the biomass was evenly spread on the ground, mimicking the fate of the major part of crop residues, except for cassava which stems were removed for future cuttings.
Multicriteria assessment
The performances of the 2-year rotations were assessed using three main criteria: gross incomes, carbon inputs from crop residues, and farmers’ acceptance. Gross incomes were calculated from cereal, legume grain, and tuber yields using average market prices, determined with farmers immediately after village sales. Crop inputs, such as seeds, cuttings and manure, are mainly self-produced. Average 2016–2018 prices were 650, 550, 200, 850, 850, 1350, and 950 Ariary/kg for rice, maize, cassava, peanut, bambara nut, cowpea, and soybean, respectively. Incomes were converted to USD using an average exchange rate of 1 Ariary = 0.0003 USD (2017–2019). The total gross income of a rotation was the mean of the two annual components. Carbon inputs from crop residues were estimated by multiplying the dry matter by the measured carbon content (% dry matter): 43% (rice, maize), 47% (cassava), 50% (peanut), 47% (bambara nut, cowpea), 48% (soybean), 49% (velvet bean, showy rattlebox), and 50% (pigeon pea, stylosanthes). Cassava residues were excluded since stems were exported. Results are expressed on an annual basis per hectare. Farmers’ acceptance was assessed through field inspections in February 2018 and 2019 (blocks 1 and 3). In the first year, 19 men and 15 women participated; in the second year, 18 men and 16 women. Farmers answered: ‘Would you apply this cropping pattern in a rice rotation on your own farm?’ by choosing among: ‘I don’t know’, ‘No’, ‘Why not?’, or ‘Yes’.
Data analysis
ANOVAs of data on gross incomes and carbon in crop residues were done by using the cropping intensity (CI), legume cropping (LC) and cropping season (CS), used as fixed effects. The CI × block and LC × block (constraint of the strip-plot design) were random effects. The R lme4 and lmerTest (R-4.3.1) packages were used for tests of the goodness of fit of the linear mixed effects model. Means were compared according to the least significant difference (LSD) with Fisher’s LSD test using the stats package. Normality and variance assumptions were tested with the Shapiro test (stats package) and the Levene test (car package). When the assumptions were not verified, a log transformation was applied. The farmers’ assessments were analysed with XLSTAT 2023.1.1 (Lumivero, 2024) using χ2 tests for contingency tables. The responses ‘I don’t know’, ‘No’, ‘Why not?’ were grouped as ‘Not positive’ while ‘Yes’ was considered ‘Positive’. Finally, the significant difference of each ‘Not positive’ and ‘Positive’ occurrence for the 36 treatments was tested using a Fisher test. For a multicriteria synthesis, radar charts were used to visualise the gross incomes, carbon inputs and social feasibility of all the cropping systems, by rescaling to 0 to 1 with the homothetic transformation:
where ‘y’ is the value of the variable after transformation; ‘x’ is the variable to be transformed; ‘a’ is the maximum value of the variable and ‘b’ is the minimum value of the variable. For the farmers’ assessments, ‘I don’t know’ and ‘No’ take the value 0, ‘Why not?’ the value ‘1’ and ‘Yes’ the value ‘2’.
Results
Gross incomes from the 2-year rotations
By calculating the mean of the two rotation components, we assessed the gross incomes obtained from the 36 cropping systems (Figure 2), with corresponding statistical analyses presented in Table 1. The highest gross incomes were recorded in SC and IC systems, at US$273 and US$301 ha− 1 year− 1, respectively. The lowest incomes, US$210 and US$228, were observed in the IM and IMC systems, which involved maize cultivation. A significant effect of the legume cropping factor emerged, with the highest gross incomes obtained from systems including peanut (US$355) and bambara nut (US$386). In contrast, cropping systems with cover crops such as velvet bean (US$207), crotalaria (US$209), pigeon pea (US$171), and stylosanthes (US$168) recorded the lowest incomes. Intermediate gross incomes were associated with cowpea (US$289) and soybean (US$292) cropping systems. Detailed data on gross incomes from individual crops are reported in the appendices, rice (Figure S1), maize and cassava (Figure S2), pulses (Figure S3), while statistical data are listed in Table S3.
Gross incomes obtained from the rotations in two cropping seasons with the cropping intensity factor in the four systems (SC, sole crop; IM, intercropping with maize, IC, intercropping with cassava; IMC, intercropping with maize and cassava), and the legume cropping factor with nine systems, Co, control, no legume; PA, peanut; PB, bambara nut; PC, cowpea; PS, soybean; CV, velvet bean; CC, crotalaria; CP, pigeon pea; CS, stylosanthes; Different letters indicate statistically significant differences (P ≤ 0.05).

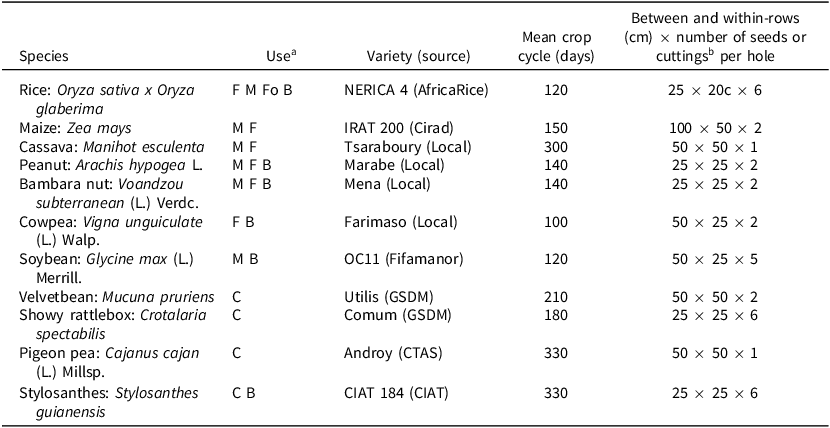
Species, varieties, uses, crop cycles and sowing patterns of sole crops in the rotations tested

a Use: F = food; M = market; Fo = forage B = bedding C = cover crop.
b Cassava.
Carbon crop residue inputs and amounts
Total carbon (C) inputs from crop residues for the 36 cropping systems represent the average of the two rotation components across the 2-year rotations (Figure 3). Cassava residues were excluded, as they were removed from the fields. ANOVA results (Table 1) indicated that both cropping intensity and legume cropping factors significantly affected carbon inputs, with a significant interaction between the two factors (P < 0.05). On average, systems without cassava (SC and IM) had higher C inputs (1.16 and 1.06 t ha− 1 year− 1) compared to systems with cassava (IC and IMC) (1.11 and 0.87 t ha− 1 year− 1, respectively). Among the legume cropping systems, the lowest C inputs were found in the control (no legume) and soybean systems (0.44 and 0.48 t ha− 1 year− 1), while the highest were associated with pigeon pea systems (1.94 t ha− 1 year− 1). Systems involving peanut (0.77 t ha− 1 year− 1) and bambara nut (0.76 t ha− 1 year− 1) also provided higher C inputs compared to the control and soybean systems, but lower than cowpea (1.06), velvet bean (1.18), crotalaria (1.06), and stylosanthes (1.23) systems. Carbon amounts from the aboveground parts of each crop are presented in the appendices, rice (Figure S4), maize and cassava (Figure S5), pulses (Figure S6), and cover crops (Figure S7), while statistical data are listed in Table S1.
Carbon soil inputs from crop residues obtained from the rotations in two cropping seasons with the cropping intensity factor in the four systems (SC, sole crop; IM, intercropping with maize, IC, intercropping with cassava; IMC, intercropping with maize and cassava) and the legume cropping factor with nine systems, Co, no legume, PA; peanut; PB, Bambara groundnut; PC, cowpea; PS, soybean; CV, velvet bean; CC, crotalaria; CP, pigeon pea; CS, stylosanthes; Different letters indicate statistically significant differences (P ≤ 0.05).

Farmers’ acceptance
Farmers’ votes during the two field sessions are shown in Figure4 A for the cropping intensity factor and in Figure 4b–e for the legume cropping factor SC, IM, IC and IMC respectively. The x-axis corresponds to the four cropping intensities in Figure 4a and the nine legume cropping systems in Figure 4b–e For the five figures, the y-axis shows the number of ‘Not positive’ responses, which correspond to the answers ‘I don’t know’, ‘No’, ‘Why not?’, and ‘Positive’ responses which correspond to ‘Yes’. The total number of responses in each sub-figure was 4,896, covering the two years of assessments by 34 farmers across the two blocks of the 36 cropping systems. Sole crop (SC) was the most widely accepted cropping system; it received 809 ‘Positive’ votes, significantly higher (P < 0.001) than the ‘Not positive’ votes, 415 (Figure 4a). There was no significant difference between the number of ‘Not positive’ and ‘Positive’ votes for intercropping systems with cassava (IC), whereas ‘Not positive’ were significantly higher than ‘Positive’ votes for intercropping with maize (IM) (P < 0.05) and for intercropping with maize and cassava (IMC) (P < 0.001). Regarding sole crops (SC, Figure 4b), rice monocropping (Co), cowpea (PC) and pigeon pea (CP) were the least significantly appreciated by farmers whereas the highest number of significant ‘Positive’ votes were recorded for peanut (PA), bambara nut (PB), soybean (PS) and stylosanthes (CS). The farmers’ assessments of velvet bean (CV) and crotalaria (CC) were evenly split between ‘Positive’ and ‘Not Positive’ votes (Figure 4). Within the IM system (Figure 4c), the control plot, rice-maize rotation (Co), intercropping maize with cowpea (PC), crotalaria (CC), and pigeon pea (CP) received significantly more ‘Not positive’ votes. Like for sole crops (SC), the significantly most ‘Positively’ assessed intercrops were peanut (PA), bambara nut (PB), soybean (PS) and stylosanthes (CS). Within the IC system (Figure 4d), in contrast to SC and IM, the control (Co), i.e. the rice-cassava rotation, was significantly positively assessed with a total of 100 votes. Significant ‘Positive’ votes were also obtained with peanut (PA), bambara nut (PB), and soybean (PS). Cassava intercropped with cowpea (CV), crotalaria (CC), pigeon pea (CP) had significantly more ‘Not positive’ votes, while there was no significant difference between ‘Positive’ and ‘Not positive’ votes for stylosanthes (CS). Within the IMC system (Figure 4e), the significantly most ‘Positive’ votes were recorded with the control (Co) and peanut (PA). Maize-cassava intercrops with bambara nut (PB), cowpea (CP), velvet bean (CV), crotalaria (CC), and pigeon pea (CP) received significantly higher ‘Negative’ votes, while any significant difference was obtained with soybean (PS) and stylosanthes (CS).
Farmers’ acceptance of the 36 legume scenarios in the rotations tested over two cropping seasons; (a) for the cropping intensity factor in the four systems, SC, sole crop; IM, intercropping with maize, IC, intercropping with cassava; IMC, intercropping with maize and cassava, and for the legume cropping factor with nine systems in each cropping intensity: (b) for SC; (c), for IM; (d), for IC; (e) for IMC; Co, control, no legume, PA; peanut; PB, Bambara groundnut; PC, cowpea; PS, soybean; CV, velvet bean; CC, crotalaria; CP, pigeon pea; CS, stylosanthes; ‘Not positive’ votes are shown in the white bars and ‘Positive’ votes in the grey bars; the symbols indicate the level of significance by a χ2 test of votes; *P < 0.05; ** P < 0.01; *** P < 0.001.

Overall assessment
The radar in Figure 5 represents the overall multicriteria assessment of all 36 cropping systems during the bi-annual rotations of the two cropping seasons of the three indicators at the same 0 to 1 scale. No cropping system combined high values for all three criteria, i.e. gross incomes, carbon inputs from residues and farmers’ acceptance. Conversely, some cropping systems combined low assessments of all criteria, control treatments (Co) for sole crop (SC) and intercropping with maize (IM), respectively, i.e. rice monoculture and rice-maize rotation. When the focus was on the overlap between gross incomes and farmers’ acceptance criteria, the cropping systems that had the highest values were sole cropping (SC) and intercropping cassava (IC) with peanut and bambara nut, between 0.75 and 1, but with low values for carbon inputs from residues (<0.5). The cropping systems, including cover crops, received particularly low assessments for gross incomes, while the assessments for their acceptance were intermediate, with the highest values for carbon inputs from residues. All cropping systems with pigeon pea received the highest values for this environmental criterion, but the lowest for the other two.
Multicriteria assessment shown in a radar graph with gross incomes, carbon inputs from crop residues and farmers’ acceptance expressed at the same 0 to 1 scale based on the 2-year assessment of the 36 legume scenarios in rice based bi-annual rotations in two cropping seasons; the cropping intensity factor in the four systems (SC, sole crop; IM, intercropping with maize, IC, intercropping with cassava; IMC, intercropping with maize and cassava), and the legume cropping factor with nine systems, Co, control no legume, PA; peanut; PB, bambara groundnut; PC, cowpea; PS, soybean; CV, velvet bean; CC, crotalaria; CP, pigeon pea; CS, stylosanthes.

Discussion
Significance of our mixed-method research design
This mixed-method research design provided quantitative and qualitative data as a basic assessment of a first understanding of a complex situation, such as in our context, the limited adoption of legumes at the farm scale. Both in focusing on this single research agronomic challenge and in combining economic, environmental and social indicators, these studies highlighted convergence and contradiction among them (Schoonenboom and Johnson, Reference Schoonenboom and Johnson2017). The overall assessment revealed that economic (gross incomes) and social performances (farmers’ acceptance) may match, while economic and environmental (carbon soil inputs from crop residues) performances could be oppositely driven. These links were obtained in other studies where pulses and cover crops or green manure were compared, as generally farmers chose edible grain over non-direct profitable products (Mhango et al., Reference Mhango, Snapp and Phiri2013). Further, through research-controlled experiments, a diverse range of cropping systems, including farmers’ practices, high-risk experimental systems, and negative treatments, were originally assessed (Dean, Reference Dean2022). At the beginning of the experiments, farmers chose four main legume cultivation systems based on cropping intensity thanks to collective activities that favour the exchange of information and opinions (Périnelle et al., Reference Périnelle, Scopel, Berre and Meynard2022). Thanks to farmers’ existing prejudices against feasible options being overcome, this is the first time cassava has been tested in rotation with rice in our area. This tuber was revealed to be a good preceding crop for this main cereal (Figure S1). The cropping season factor was significant both for gross incomes and carbon inputs, and could be linked to rainfall patterns, which could impact crop productivity through N leaching (Ranaivoson et al., Reference Ranaivoson, Falconnier, Affholder, Leroux, Autfray, Muller, Auzoux and Ripoche2022) and weed harmfulness (Ripoche et al., Reference Ripoche, Barkaoui, Allouch, Christina, Heuclin, Rafenomanjato, Moonen, Autfray and Marnotte2024). Also, despite some significant interaction between our three tested factors, i.e., cropping intensity, legume cropping and cropping season (Table 1), significant and clear impacts are detailed below on the cropping intensity and legume cropping impacts for the three indicators.
Legume scenarios linked with cropping intensity: sole cropping performed best, intercropping with maize performed worst
The cropping intensity factor had a significant impact on gross incomes, the amounts of carbon soil inputs from crop residues and on farmers’ acceptance, with sole cropping systems of legumes on average performing better than intercropping systems (Figure 5). The best gross incomes were obtained from sole cropping (SC) and intercropping with cassava (IC) (Figure 2), while sole cropping also contributed the highest soil carbon inputs (Figure 3). With IC cropping systems, the lower soil crop carbon inputs could be linked both with the export of cassava residues and the lower density of legumes in intercrops compared to in sole crops (Tables S1 and S2). These findings are in line with those of a meta-analysis by Zhao et al. (Reference Zhao, Chen, Beillouin, Lambers, Yang, Smith, Zeng, Olesen and Zang2022), showing that cereal yields benefit from the legume carry-over effect but decrease with increased crop diversity, thus confirming the better performances of cropping systems with legumes in sole cropping. Furthermore, our higher farmers’ acceptance of sole cropping (Figure 4) could be linked with labour requirements as shown in other contexts. Kinyua et al. (Reference Kinyua, Kihara, Bekunda, Bolo, Mairura, Fischer and Mucheru-Muna2023) emphasised that perceived labour requirements significantly influence the adoption of cropping systems. More specifically, intercropping systems managed manually showed to require more weeding labour time, thereby discouraging farmers from including legumes with their main crops (Nederlof and Dangbégnon, Reference Nederlof and Dangbégnon2007; Rusinamhodzi et al., Reference Rusinamhodzi, Corbeels, Nyamangara and Giller2012). This overall low performance of intercropping systems may represent a new finding in our context, as previous experiments used the same row intercropping organisation in conventional and in no-tillage cropping systems with maize and legume intercrops (Ripoche et al., Reference Ripoche, Autfray, Rabary, Randriamanantsoa, Blanchart, Trap, Sauvadet, Becquer and Letourmy2021; Rodenburg et al., Reference Rodenburg, Randrianjafizanaka, Büchi, Dieng, Andrianaivo, Ravaomanarivo and Autfray2020).
Legume scenarios linked with species: highest performance obtained with traditional pulses, the lowest with cover crops
Legumes significantly enhanced rice performance in crop rotations, with cowpea generating the highest gross incomes, with an increase of 42% compared to the control ($426 vs $299; Figure S1). These findings align with those of previous studies demonstrating that legumes have a direct impact on the performance of crop rotations (Cernay et al., Reference Cernay, Makowski and Pelzer2018; Franke et al., Reference Franke, van den Brand, Vanlauwe and Giller2018), while confirming the rapid decline in rice yields under monocropping (Ripoche et al., Reference Ripoche, Autfray, Rabary, Randriamanantsoa, Blanchart, Trap, Sauvadet, Becquer and Letourmy2021) and rotations including maize (Rodenburg et al., Reference Rodenburg, Randrianjafizanaka, Büchi, Dieng, Andrianaivo, Ravaomanarivo and Autfray2020). Rotations without legumes in sole cropping (SC) and intercropping with maize (IM), in respectively SC Co and IM Co (Figure 5), were associated with low gross incomes, low carbon inputs from crop residues and low social acceptance. Cultivating cassava without legumes was socially acceptable (IC Co and IMC Co) but insufficient for soil fertility management. Traditional pulses (peanut and bambara nut) performed well both economically and socially at all cropping intensities (Figure 5) due to their carry-over effects on rice and their individual incomes (Figures S1 and S4). The profitability of growing traditional pulses varies worldwide and depends on the context (Reckling et al., Reference Reckling, Bergkvist, Watson, Stoddard, Zander, Walker, Pristeri, Toncea and Bachinger2016). While peanut is a common pulse, bambara nut is a niche crop (Peoples et al., Reference Peoples, Giller, Jensen and Herridge2021), but in our study, it demonstrated consistent performance regardless of cropping intensity. The performance of peanut tended to be lower when intercropped with maize and cassava, highlighting its potential sensitivity to competition (Figures S3 and S6). Future research should prioritise local pulses, as suggested by Daryanto et al. (Reference Daryanto, Fu, Zhao, Wang, Jacinthe and Wang2020), to maximise the benefits of intercropping legumes with cereals. Soybean was well accepted by the farmers but had lower economic and environmental benefits, pointing to its sensitivity to soil fertility or high dependency on specific rhizobia (Figure S4). Conversely, cowpea was more negatively scored by the farmers at all four cropping intensities (Figure 4), even though a positive carry-over effect on rice was observed, regardless of the cropping intensity (Figure S1). Cropping systems with cover crops underperformed economically compared to pulses (Figure 2) as they combined both a low carry-over effect on rice (Figure S1) and no income, aligning with the results of previous studies (Adjei-Nsiah et al., Reference Adjei-Nsiah, Kuyper, Leeuwis, Abekoe and Giller2007; Mhango et al., Reference Mhango, Snapp and Phiri2013; Muoni et al., Reference Muoni, Barnes, Öborn, Watson, Bergkvist, Shiluli and Duncan2019). Among cover crops, stylosanthes had relatively higher social acceptance due to its potential use as bedding (Table S1), despite economic limitations in improving rice productivity. Among the cover crops, pigeon pea contributed the highest carbon inputs but had no significant effect on rice gross incomes (Figure S1). Farmers rated pigeon pea poorly due to its nil grain yield and the low economic performance regardless of its integration scenario (Figure 5).
Future debates
This research-farmer assessment started by the selection of feasible cropping systems for future debates, which would consider the heterogeneity of the farming community, respecting the needs and resources available to each group of farmers (Adjei-Nsiah et al., Reference Adjei-Nsiah, Kuyper, Leeuwis, Abekoe and Giller2007). Ronner et al. (Reference Ronner, Descheemaeker, Almekinders, Ebanyat and Giller2019) emphasised the importance of offering a ‘basket of options’ with flexible combinations of practices, rather than designing rigid technology packages for static farm types. A main limitation of our participatory approach was the search for group consensus, which may have masked farm differentiation and gender-specific considerations (Brooker et al., Reference Brooker, Bennett, Cong, Daniell, George, Hallett, Hawes, Iannetta, Jones, Karley, Li, McKenzie, Pakeman, Paterson, Schöb, Shen, Squire, Watson, Zhang and White2015; Ortega et al., Reference Ortega, Waldman, Richardson, Clay and Snapp2016; Ronner et al., Reference Ronner, Descheemaeker, Almekinders, Ebanyat and Giller2019). Another point for debate concerns the observed disconnect between economic and social performances of certain cropping systems, as revealed in Figure 5. Our assumption is that crop production is not solely intended for market sale but may also serve for household and livestock self-consumption. Last but not least, our environmental indicator, soil carbon inputs from crop residues, indicated that our cropping systems relied on extensive agriculture characterised by limited availability and poor quality of manure, and minimum use of synthetic fertilisers (Razafimahatratra et al., Reference Razafimahatratra, Bignebat, David-Benz, Bélières and Penot2021) and strong nitrogen and phosphorus nutrient limitation for crops (Sauvadet et al., Reference Sauvadet, Trap, Damour, Plassard, Van den Meersche, Achard, Allinne, Autfray, Bertrand, Blanchart, Deberdt, Enock, Essobo, Freschet, Hedde, de Melo Virginio Filho, Rabary, Rakotoarivelo, Randriamanantsoa and Harmand2021). In our scenarios, crop residues are left on the soil surface to maintain soil organic matter in situ or through recycling via cattle bedding and the production of farmyard manure. However, given a mean annual C soil year loss of 2% (Bationo et al., Reference Bationo, Kihara, Vanlauwe, Waswa and Kimetu2007) and total soil C stocks in the 0–20 cm soil layer that are estimated to be 26.9 t ha−1 (see section The experimental site and the farmers), around 0.54 t ha−1 of soil C was lost each year. Even with the highest carbon inputs simulated in our cropping system, i.e. 2.5 t ha−1 year−1, including manure contributions of 1.32 t C ha−1 year−1 (section Soil and crop management), the resulting stable C was only 0.10 t ha−1 year−1, based on an 8% conversion rate (Fujisaki et al., Reference Fujisaki, Chevallier, Chapuis-Lardy, Albrecht, Razafimbelo, Masse, Ndour and Chotte2018). This underscores the need for substantial improvements in soil fertility management to ensure higher crop biomass production and consequently more potential for C soil inputs from recycling residues.
Conclusion
This assessment of 36 scenarios integrating legumes into upland rice-based cropping systems, conducted by a mixed team of researchers and farmers, provides valuable insights in crossing economic, environmental, and social indicators for answering a unique question, i.e. ‘How to reinforce legume integration for diverse services in rice based-cropping systems?’. These insights could help decision-makers, researchers, NGOs, and farmers seeking to sustain productivity and food systems in the target region. First, our results emphasise that including traditional pulses in biannual rice rotations within the common low-input fertility systems can have an immediate positive carry-over effect on rice yields. Given that rice is the staple crop, these two-year rotations increased both farmers’ gross incomes and acceptance, regardless of cropping intensity. Second, building on existing practices rather than introducing unknown technologies, such as unfamiliar legume species, appears to be a promising strategy for future research. Further, cassava was found to be well-suited for upland rice-based rotations, whereas maize performed poorly and had negative carry-over effects on rice. The major challenge remains to improve carbon inputs from residues and to maintain soil organic matter under continuous cropping, particularly in cassava systems. The low economic and social performances of legume-based intercrops limit the range of feasible scenarios. In sole cropping, the ideal legume ideotype still to be identified would likely combine both food consumption and market demand with agronomic traits such as a low harvest index and high biomass production to maximise soil carbon inputs. There is also a window of opportunity for legume cover crops to serve as livestock bedding or complementary forage.
Supplementary material
The supplementary material for this article can be found at https://doi.org/10.1017/S0014479726100246.
Acknowledgements
Our special thanks to the members of the households of the rural municipalities of Vinany and Ankazomiriotra for their full engagement in these activities. The authors are grateful to anonymous students for their help with field work and data valorisation.
Funding statement
This study was part of the STRADIV project (System approach for the TRAnsition to bio-DIVersified agroecosystems no. 1504-003) supported by Agropolis Foundation (France).
Competing interests
The author(s) declare none.


 Open access