

1. Introduction
Financial markets and institutions play a key role in the economy as they channel funds from savers to investors. Excessive or extreme volatility in the prices of financial assets may be detrimental to the process of allocating investable funds, impairing the smooth functioning of the financial system and adversely affecting economic performance. Particularly high stock market volatility could affect the economy through higher capital costs, increasing the value of the option to postpone business investment and depressing the effect of wealth on consumer spending.
In a seminal influential study, Schwert (Reference Schwert1989) examined the relation of stock market volatility to real and nominal macroeconomic volatility, economic activity, financial leverage, and stock trading activity. The author identified real economic activity as being the most important determinant of stock market volatility. Hamilton and Lin (Reference Hamilton and Lin1996) found that economic activity -economic recessions- are the single largest factor explaining stock market volatility, accounting for about 60 percent of its variation. In a related study, Engle et al. (Reference Engle, Ghysels and Sohn2013) determined that macroeconomic fundamentals—output and inflation uncertainty—have the ability to predict stock market volatility. Choudhry et al. (Reference Choudhry, Papadimitriou and Shabi2016) also showed international empirical evidence of a bidirectional causal relationship between stock market volatility and the business cycle. Using firm-level data, Baker et al. (Reference Baker, Bloom and Davis2016) determined that high stock volatility is associated with high policy uncertainty, reducing output, investment, and employment in policy-sensitive sectors (i.e., defense, health care, finance, and infrastructure construction).Footnote 1 Furthermore, numerous studies reported that equity market volatility is related to crude oil prices (see, for example, Degiannakis et al. Reference Degiannakis, Filis and Kizys2014; Kang et al. Reference Kang, Ratti and Yoon2015b; Bastianin and Manera, Reference Bastianin and Manera2018; Nonejad, Reference Nonejad2019) and commodity prices (Kang et al. Reference Kang, Ratti and Vespignani2020). A recent strand of the literature also establishes that the financialization of commodities provides valuable information about the behavior of macro-financial variables (see, the theoretical framework by Basak and Pavlova, Reference Basak and Pavlova2016; and the survey by Cheng and Xiong, Reference Cheng and Xiong2014, and references therein). Motivated by the aforementioned research, this paper aims to fill this gap in the literature by examining the effect of stock market volatility on commodity prices via the time-varying risk aversion channel, this being different from the economic policy/financial uncertainty channel, using daily data between December 31, 1999 and June 14, 2021. We adopt a structural VAR model with time-varying parameters following Koop et al. (Reference Koop, Leon-Gonzalez and Strachan2009). The Bayesian estimation of a time-varying structural VAR model helps us to examine whether the commodity prices transmission mechanism has changed—gradually versus abruptly—or whether apparent changes are due to changes in the volatility of the stock market.
The purpose of this paper is to provide new empirical evidence on these unexplored avenues of research and contributes to the literature by shedding light on the following areas. First, we present results relating to the transmission mechanism between stock market volatility and commodity prices. We employ recent long span daily data that allow us to compare the changes in stock market volatility and commodity prices relationship during the COVID-19 pandemic in 2020 with that of the Global Financial Crisis in 2008-09. Second, we provide impulse response functions of stock market shocks on (aggregate, sectoral and sixteen individual) commodity prices and propose hedging strategies based on different responses of individual commodity prices to different shocks at different times. Finally, following Bekaert et al. (Reference Bekaert, Hoerova and Lo Duca2013) we decompose the daily time-series VIX based on S&P500 index options into two components (a proxy for risk aversion and uncertainty captured by expected stock market volatility) to explore the dynamic relationship between stock market volatility and commodity prices through the time-varying risk aversion channel. We relate the time-varying risk premium to the VAR model with time-varying parameters, which differs from current literature that normally parameterizes the time-varying risk aversion as models with constant parameters (Gospodinov and Ng, Reference Gospodinov and Ng2013; Gospodinov and Jamali, Reference Gospodinov and Jamali2018; among many others), in the sense that the risk aversion varies over time as the market’s ability to bear risk is greater in good times but less so in bad times (Cochrane and Campbell, Reference Campbell and Cochrane1999; Cochrane, Reference Cochrane2017). We provide the literature with supporting evidence to show that investors’ time-varying risk aversion in the commodity market differs from the economic policy/financial uncertainty in Bakas and Triantafyllou (Reference Bakas and Triantafyllou2018) and Kang et al. (Reference Kang, Ratti and Vespignani2020, Reference Kang, Ratti and Vespignani2021).
Our main findings can be summarized as follows. Initially, we find that the transmission mechanism of stock market volatility shocks on the commodity prices changes over time. The negative effect of stock market volatility on commodity prices is more statistically significant in the 2008–09 Global Financial Crisis than during the COVID-19 pandemic in 2020. The effect is greater on energy commodities compared to that on the agricultural and precious metals markets. The long-lasting negative effect of risk aversion is stronger compared to that of the expected stock market volatility on the commodity price. The change in the commodity transmission mechanism is likely due to changes in underlying sources of risk aversion and expected uncertainty over time. We further confirm that what matters most for policy makers is the degree of unpredictability contained in the macroeconomic variables shown in Bekaert et al. (Reference Bekaert, Hoerova and Lo Duca2013) and Bakas and Triantafyllou (Reference Bakas and Triantafyllou2018). The effect of the unpredictability measured by risk aversion shocks on commodity prices has become relatively stronger since the COVID-19 pandemic in 2020. It implies that the market’s inability to bear risk is growing in bad times.
The remainder of the paper is organized as follows. Section 2 presents the related literature review on stock market volatility and commodity prices. Section 3 describes the dataset, provides some preliminary analysis, and presents the methodological approach. Section 4 discusses the empirical findings of the evidence on the time-varying effect of stock market volatility on commodity prices. Section 5 breaks stock market volatility down into risk aversion and uncertainty to seek out the source of the time-varying effects of stock market volatility on the commodity prices. Section 6 presents the robustness check. Finally, Section 7 concludes.
2. Related literature review
Initially, this paper contributes to the quantitative empirical literature on stock market volatility that features a relationship between commodity markets and equity market volatility (see, for example, Degiannakis et al. Reference Degiannakis, Filis and Kizys2014; Narayan and Sharma, Reference Narayan and Sharma2014; Kang et al. Reference Kang, Ratti and Yoon2015b; Bastianin and Manera, Reference Bastianin and Manera2018; Nonejad, Reference Nonejad2019; Kang et al. Reference Kang, Ratti and Vespignani2020; inter alia). Degiannakis et al. (Reference Degiannakis, Filis and Kizys2014), Kang et al. (Reference Kang, Ratti and Yoon2015b) and Bastianin and Manera (Reference Bastianin and Manera2018) examine the effects of oil prices shocks (namely supply-side shock, aggregate demand shock and oil-market specific demand shock) on stock market volatility building on the structural VAR model of Kilian and Park (Reference Kilian and Park2009). They found that supply-side shocks have no impact on equity market volatility, whereas oil price changes due to demand shocks lead to a reduction in stock market volatility. In addition, Kang et al. (Reference Kang, Ratti and Yoon2015b) and Bastianin and Manera (Reference Bastianin and Manera2018) also detected that positive shocks to oil-market specific demand have a statistically significantly negative effect on equity market volatility. Using U.S. daily firm-level data, Narayan and Sharma (Reference Narayan and Sharma2014) showed that the price of oil reduces stock return volatility in every economic sector except for firms in the banking sector for which oil prices tend to increase stock return volatility. Nonejad (Reference Nonejad2019) explored the predictive power of oil price shocks as predictors of aggregate equity return volatility. Using alternative measures of nonlinear crude oil price variables previously suggested in the literature, Nonejad (Reference Nonejad2019) obtained statistically significant accuracy gains by employing nonlinear transformations of oil price as predictors of stock return volatility. In a recent study, Kang et al. (Reference Kang, Ratti and Vespignani2020) investigate the time-varying dynamics of global stock market volatility, commodity prices, and domestic output and consumer prices across 16 countries. Their results indicate that shocks to global commodity prices have positive effects on global stock market volatility that are statistically significant and persistent. During the global financial crisis, shocks to commodity prices caused a dramatic rise in global stock market volatility.
In addition, the paper also contributes to burgeoning studies that explore empirically the time-varying risk aversion channel. Previous studies show that risk aversion tends to vary over time as the market’s ability to bear risk is greater in good times but less so in bad times (see, for example, Cochrane and Campbell, Reference Campbell and Cochrane1999; Cochrane, Reference Cochrane2017; Guiso et al. Reference Guiso, Sapienza and Zingales2018 and recently, Pflueger and Rinaldi, Reference Pflueger and Rinaldi2022). For example, related studies find that time-varying risk aversion (i) fluctuates in response to news about inflation (Brandt and Wang, Reference Brandt and Wang2003), (ii) shows predictive value for gold volatility (Demirer et al. Reference Demirer, Gkillas, Gupta and Pierdzioch2019); and (iii) has negative effects on exchange rate volatility (Wu et al. Reference Wu, Xie and Zhang2022). In this paper, following Bekaert et al. (Reference Bekaert, Hoerova and Lo Duca2013), we decompose stock market volatility into risk aversion and expected stock market volatility—uncertainty—to investigate empirically the dynamic relationship between stock market volatility and commodity prices through the time-varying risk aversion channel.
Finally, the paper is also related to the recent empirical exploration of economic uncertainty and commodity prices in Bakas and Triantafyllou (Reference Bakas and Triantafyllou2018) and Kang et al. (Reference Kang, Ratti and Vespignani2020, Reference Kang, Ratti and Vespignani2021) for example. In contrast to these previous related studies, we adopt a time-varying structural VAR model similar to that used in Koop et al. (Reference Koop, Leon-Gonzalez and Strachan2009) in which both the transmission mechanism and the elements of error variance-covariance matrix can change over time. Following Koop et al. (Reference Koop, Leon-Gonzalez and Strachan2009), the change in parameters over time is modeled based on the mixture innovation method of Gerlach et al. (Reference Gerlach, Carter and Kohn2000) and Giordani and Kohn (Reference Giordani and Kohn2008), that is regarded as a special Bayesian stochastic search approach to model selection restrictions on the high dimensional parameter structural VAR models. The time-varying structural VAR model facilitates the investigation into stock market volatility and commodity price dynamics through the channel of time-varying risk aversion that varies over time as the market’s ability to bear risk is greater in good times but less so in bad times (Cochrane and Campbell, Reference Campbell and Cochrane1999; Cochrane, Reference Cochrane2017). It is observed that investors’ time-varying risk aversion in the commodity market differs from the economic policy/financial uncertainty in Bakas and Triantafyllou (Reference Bakas and Triantafyllou2018, Reference Bakas and Triantafyllou2020) and Kang et al. (Reference Kang, Ratti and Vespignani2020, Reference Kang, Ratti and Vespignani2021).
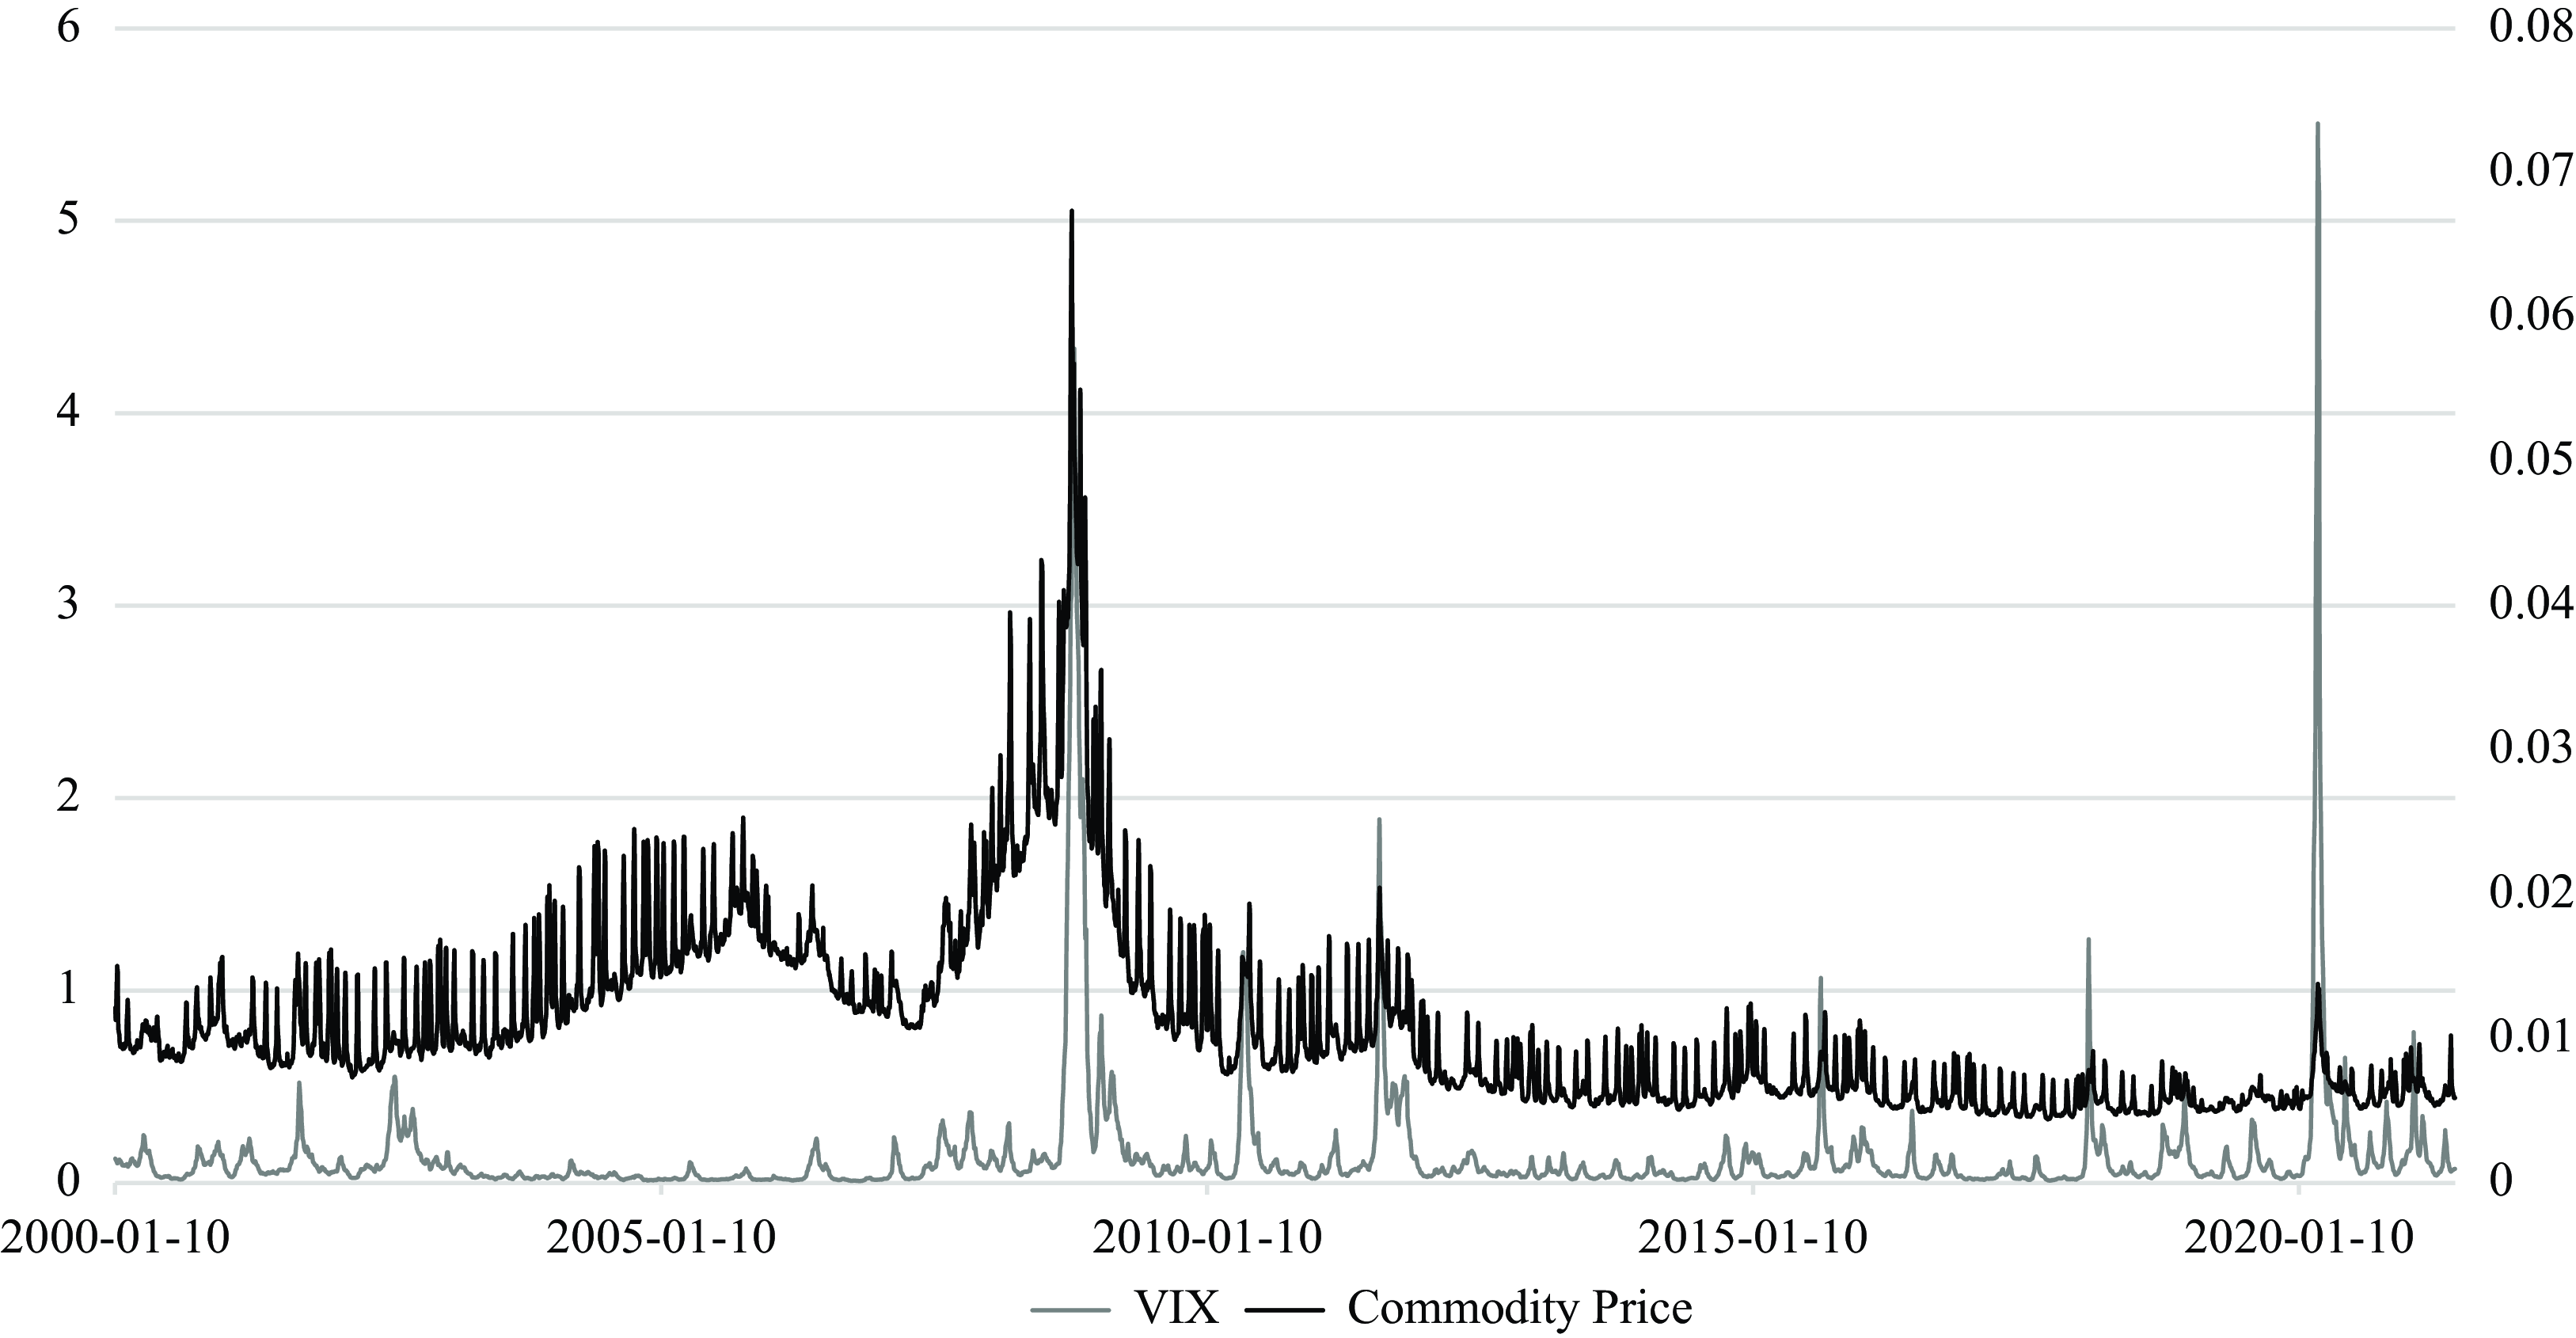
Residual Standard Deviations of VIX and Commodity Price.
Notes: The figure shows the residual standard deviations of VIX and commodity prices in the model, described in the text, from January 10, 2000 to June 14, 2021.
3. Data and model
3.1 Data source and a first look at the data
We obtain the daily excess returns of the broad (16 major individual) commodity futures market S&P GSCI indices between December 31, 1999 and June 14, 2021 from the Datastream database. The individual daily time-series of commodity futures market indices includes metals commodities of the S&P GSCI commodity futures indices (gold, silver, copper, precious metals, and industrial metals), agricultural commodities (agriculture, corn, cocoa, cotton, soybeans, sugar, and wheat), and energy commodities (energy, crude oil, petroleum, heating oil, natural gas, gas oil). Footnote 2 The daily time-series VIX based on the S&P500 index options is our proxy for stock market volatility. The daily interest term spread is the difference between the 10-year constant U.S. government bond yield and the 3-month U.S. Treasury Bill rate. We also draw on monthly data of the three time-series and the U.S. industrial production index for the robustness analysis. In our estimation, we demean and standardize each variable to make each shock effect comparable in the analysis over time.
Figure 1 plots the point estimates of the residual standard deviations of VIX and the commodity futures market index in the model specified in Section 3.3 from January 10, 2000 to June 14, 2021. The figure indicates substantial variation in volatility. Following the Global Financial Crisis in 2008-09, there is a significant rise in the volatility of stock and commodity prices. The significant rise in the volatility of stock market prices is associated with a relatively moderate rise in the volatility of commodity prices during the COVID-19 pandemic in 2020. Figure 1 illustrates that the properties of the exogeneous shocks have changed over time in the commodity market. The change in the volatility implies that the transmission mechanism of stock market shocks on the commodity prices is likely to change over time. The understanding typically involves the investigation on the inter-relationships between the stock market volatility and commodity prices based on multivariate models where the transmission mechanism and the variances of the exogenous shocks can both potentially change over time (see the time-varying effects of monetary policy by Primiceri (Reference Primiceri2005) and Koop et al. (Reference Koop, Leon-Gonzalez and Strachan2009) and oil prices by Baumeister and Peersman (Reference Baumeister and Peersman2013) on the U.S. economy respectively).
3.2 Time-varying risk premium of commodity prices
The literature shows that commodity prices are affected by various factors including the demand for commodities, exchange rates, financialization of commodities markets, futures markets, expected inflation, investors’ risk aversion, supply of commodities, and interest rates (e.g., Gruber, Reference Gruber2011; Gruber and Vigfusson, Reference Gruber and Vigfusson2018). Pindyck (Reference Pindyck1993) and Gospodinov and Ng (Reference Gospodinov and Ng2013) emphasize that interest rates are related to the opportunity cost of buying and holding inventories. Decreases in interest rates lower the opportunity cost and attract investors to buy and hold commodities in search of yields. Gospodinov and Jamali (Reference Gospodinov and Jamali2018) show that monetary policy uncertainty is a key factor in determining the commodity risk premium. The monetary policy uncertainty is related to investors’ time-varying risk aversion in the commodity market, which differs from the economic policy/financial uncertainty in Bakas and Triantafyllou (Reference Bakas and Triantafyllou2018) and Kang et al. (Reference Kang, Ratti and Vespignani2020, Reference Kang, Ratti and Vespignani2021).
We relate stock market volatility and commodity prices through the risk aversion channel following Gospodinov and Ng (Reference Gospodinov and Ng2013) and Gospodinov and Jamali (Reference Gospodinov and Jamali2018) who discuss the time-varying risk premium that compensates for the risk of fluctuations in the commodity future spot prices in a non-arbitrage model based on the theory of normal backwardation. Define $S_{jt}$
and
$S_{jt}$
and $F_{j,n}$
as the spot and futures prices for a contract delivery at time
$F_{j,n}$
as the spot and futures prices for a contract delivery at time $(t+n),$
the futures basis (
$(t+n),$
the futures basis ( $F_{j,n}-S_{jt})$
is then comprised of risk premium
$F_{j,n}-S_{jt})$
is then comprised of risk premium $(\Psi _{jt,n})$
and expected price change (
$(\Psi _{jt,n})$
and expected price change ( $E_{t}S_{jt+n}-S_{jt})$
in buying and holding the commodity,
$E_{t}S_{jt+n}-S_{jt})$
in buying and holding the commodity,
 \begin{equation}F_{j,n}-S_{jt}=E_{t}S_{jt+n}-S_{jt}-\Psi _{jt,n},\end{equation}
that is the time-varying risk premium expressed as $\Psi _{jt,n}=E_{t}S_{jt+n}-F_{j,n}$
, the difference between the expected spot price at time
$\Psi _{jt,n}=E_{t}S_{jt+n}-F_{j,n}$
, the difference between the expected spot price at time $(t+n)$
and the futures prices of the commodity for delivery at time
$(t+n)$
and the futures prices of the commodity for delivery at time $(t+n)$
. A positive
$(t+n)$
. A positive $\Psi _{jt,n}$
indicates that the futures price is backwardated at a discount. We utilize the daily excess returns of the broad commodity futures market S&P GSCI indices
$\Psi _{jt,n}$
indicates that the futures price is backwardated at a discount. We utilize the daily excess returns of the broad commodity futures market S&P GSCI indices $(y_{t})$
as our proxy for the risk premium
$(y_{t})$
as our proxy for the risk premium $(\Psi _{jt,n})$
and parameterize it in terms of observables such as,
$(\Psi _{jt,n})$
and parameterize it in terms of observables such as,
 \begin{equation}\mathrm{y}_{t}={\unicode[Arial]{x03B1}} _{t}+{\unicode[Arial]{x03B2}} _{t}\mathrm{XIV}_{t}+{\unicode[Arial]{x03B8}} _{t}{\unicode[Arial]{x03C9}} _{t},\end{equation}
where the daily time-series $(\mathrm{XIV}_{t})$
based on S&P500 index options is decomposed into risk aversion
$(\mathrm{XIV}_{t})$
based on S&P500 index options is decomposed into risk aversion $(s_{t}^{r})$
and expected stock market volatility
$(s_{t}^{r})$
and expected stock market volatility $(s_{t}^{v})$
followed by Bekaert et al. (Reference Bekaert, Hoerova and Lo Duca2013), and
$(s_{t}^{v})$
followed by Bekaert et al. (Reference Bekaert, Hoerova and Lo Duca2013), and ${\unicode[Arial]{x03C9}} _{t}$
the major determinants of commodity prices (interest rate
${\unicode[Arial]{x03C9}} _{t}$
the major determinants of commodity prices (interest rate $(\mathrm{i}_{t})$
using daily data and the additional variables including the U.S. industrial production index
$(\mathrm{i}_{t})$
using daily data and the additional variables including the U.S. industrial production index $(\mathrm{ip}_{t})$
and the U.S. consumer price index (
$(\mathrm{ip}_{t})$
and the U.S. consumer price index ( $({\unicode[Arial]{x03C0}} _{t})$
using monthly data), in search of the source of commodity prices and stock market volatility dynamics.
$({\unicode[Arial]{x03C0}} _{t})$
using monthly data), in search of the source of commodity prices and stock market volatility dynamics.
3.3 The time-varying structural-form VAR model
We relate the time-varying risk premium $(\Psi _{jt,n})$
to the multivariate model with time-varying parameters, which differs from current literature that normally parameterizes the time-varying risk aversion as models with constant parameters (e.g., Gospodinov and Ng (Reference Gospodinov and Ng2013), Gospoding and Jamali (Reference Gospodinov and Jamali2018), among many others), in the sense that the risk aversion varies over time as the market’s ability to bear risk is greater in good times but less so in bad times (Cochrane and Campbell, Reference Campbell and Cochrane1999; Cochrane, Reference Cochrane2017). Our multivariate model starts from the time-varying reduced-form VAR to the time-varying structural-form VAR specification. It follows Primiceri (Reference Primiceri2005) and Del Negro and Primiceri (Reference Del Negro and Primiceri2015) to begin with a state space model in which the sources of time variation include both the regression coefficients and the elements of variance-covariance matrix. The measurement equation in the state space system is
$(\Psi _{jt,n})$
to the multivariate model with time-varying parameters, which differs from current literature that normally parameterizes the time-varying risk aversion as models with constant parameters (e.g., Gospodinov and Ng (Reference Gospodinov and Ng2013), Gospoding and Jamali (Reference Gospodinov and Jamali2018), among many others), in the sense that the risk aversion varies over time as the market’s ability to bear risk is greater in good times but less so in bad times (Cochrane and Campbell, Reference Campbell and Cochrane1999; Cochrane, Reference Cochrane2017). Our multivariate model starts from the time-varying reduced-form VAR to the time-varying structural-form VAR specification. It follows Primiceri (Reference Primiceri2005) and Del Negro and Primiceri (Reference Del Negro and Primiceri2015) to begin with a state space model in which the sources of time variation include both the regression coefficients and the elements of variance-covariance matrix. The measurement equation in the state space system is
 \begin{equation}y_{t}=z_{t}\beta _{t}+\varepsilon _{t},\end{equation}
and the state equation is
 \begin{equation}\beta _{t+1}=\beta _{t}+k_{1t}\eta _{t},\end{equation}
where $y_{t}=(r_{t},s_{t},c_{t})$
is a
$y_{t}=(r_{t},s_{t},c_{t})$
is a $m\times 1(m=3)$
vector of endogenous variables including daily interest rate spread
$m\times 1(m=3)$
vector of endogenous variables including daily interest rate spread $r_{t}$
(i.e., the difference between the 10-year U.S. government bond yield and the 3-month U.S. T-Bill rate), daily stock market volatility
$r_{t}$
(i.e., the difference between the 10-year U.S. government bond yield and the 3-month U.S. T-Bill rate), daily stock market volatility $s_{t}$
, and the daily excess returns of the S&P GSCI indices on commodity futures prices
$s_{t}$
, and the daily excess returns of the S&P GSCI indices on commodity futures prices $c_{t}$
.
$c_{t}$
.
We choose to place the interest rate spread $r_{t}$
first and financial variables
$r_{t}$
first and financial variables $s_{t}$
and
$s_{t}$
and $c_{t}$
last in the VAR ordering selection by assuming that the shock to the financial market has no immediate effect on the monetary policy within a day. This is a standard assumption used in the literature by Bernanke et al. (Reference Bernanke, Boivin and Eliasz2005), Bekaert et al. (Reference Bekaert, Hoerova and Lo Duca2013) and Bakas and Triantafyllou (Reference Bakas and Triantafyllou2018) among many others, in the sense that the literature argues that monetary policy shocks measured by the innovations in the interest rates have a contemporary effect on all the fast-moving variables, the stock and commodity prices in our model, that are highly sensitive to the monetary policy news. With regards to the financial market block, we assume that the shock to the commodity prices in one day has no immediate effect on the broad stock market volatility accumulated over a long time (30 days for the VIX measure). These contemporaneous exclusion restrictions allow us to use standard Cholesky decomposition in the estimation of the variance-covariance matrix of the error term
$c_{t}$
last in the VAR ordering selection by assuming that the shock to the financial market has no immediate effect on the monetary policy within a day. This is a standard assumption used in the literature by Bernanke et al. (Reference Bernanke, Boivin and Eliasz2005), Bekaert et al. (Reference Bekaert, Hoerova and Lo Duca2013) and Bakas and Triantafyllou (Reference Bakas and Triantafyllou2018) among many others, in the sense that the literature argues that monetary policy shocks measured by the innovations in the interest rates have a contemporary effect on all the fast-moving variables, the stock and commodity prices in our model, that are highly sensitive to the monetary policy news. With regards to the financial market block, we assume that the shock to the commodity prices in one day has no immediate effect on the broad stock market volatility accumulated over a long time (30 days for the VIX measure). These contemporaneous exclusion restrictions allow us to use standard Cholesky decomposition in the estimation of the variance-covariance matrix of the error term $\varepsilon _{t}$
to identify the structural-form VAR shocks, based on the estimation of the reduced-form VAR model (3).
$\varepsilon _{t}$
to identify the structural-form VAR shocks, based on the estimation of the reduced-form VAR model (3).
In the state space model (3) - (4), $z_{t}=(c_{t},y_{t-1},\ldots y_{t-p})$
stands for a
$z_{t}=(c_{t},y_{t-1},\ldots y_{t-p})$
stands for a $m\times (p+1)$
matrix of data on explanatory variables where
$m\times (p+1)$
matrix of data on explanatory variables where $p$
denotes the appropriate lag length of the endogenous variables,Footnote 3
$p$
denotes the appropriate lag length of the endogenous variables,Footnote 3 $\beta _{t}=(\beta _{0,t},\beta _{1,t},\ldots, \beta _{p,t})^{\prime}$
the regression coefficients, and
$\beta _{t}=(\beta _{0,t},\beta _{1,t},\ldots, \beta _{p,t})^{\prime}$
the regression coefficients, and $\varepsilon _{t}\sim N(0,H_{t})$
the error term in the measurement Equation (1) and
$\varepsilon _{t}\sim N(0,H_{t})$
the error term in the measurement Equation (1) and $\eta _{t}\sim N(0,Q)$
the error term in the state Equation (4). Define
$\eta _{t}\sim N(0,Q)$
the error term in the state Equation (4). Define $H_{t}=A_{t}^{-1}\Sigma _{t}\Sigma^{\prime}_{t}(A_{t}^{-1})^{\prime}$
, where
$H_{t}=A_{t}^{-1}\Sigma _{t}\Sigma^{\prime}_{t}(A_{t}^{-1})^{\prime}$
, where $\Sigma _{t}$
is a diagonal matrix,
$\Sigma _{t}$
is a diagonal matrix, $A_{t}$
a lower triangular matrix with diagonal elements equal to one. Let the natural logarithm of the elements of the diagonal matrix
$A_{t}$
a lower triangular matrix with diagonal elements equal to one. Let the natural logarithm of the elements of the diagonal matrix $\Sigma _{t}$
be
$\Sigma _{t}$
be $\mathit{\ln } \sigma _{t}=(\mathit{\ln } \sigma _{1t},\ldots, \mathit{\ln } \sigma _{mt})^{\prime}$
allowed to evolve as follows:
$\mathit{\ln } \sigma _{t}=(\mathit{\ln } \sigma _{1t},\ldots, \mathit{\ln } \sigma _{mt})^{\prime}$
allowed to evolve as follows:
 \begin{equation}\mathit{\ln } \sigma _{t+1}=\mathit{\ln } \sigma _{t}+k_{2t}\mu _{t},\end{equation}
where $\mu _{t}$
is
$\mu _{t}$
is $N(0,W)$
and independent over
$N(0,W)$
and independent over $t$
. We then stack the non-zero and non-one elements of the lower triangular matrix
$t$
. We then stack the non-zero and non-one elements of the lower triangular matrix $A_{t}$
by rows into a
$A_{t}$
by rows into a $m(m-1)/2$
vector as
$m(m-1)/2$
vector as $a_{t}=(a^{\prime}_{21,t},a^{\prime}_{31,t},a^{\prime}_{32,t},\cdots, a^{\prime}_{m(m-1),t})^{\prime}$
. The evolution of elements in
$a_{t}=(a^{\prime}_{21,t},a^{\prime}_{31,t},a^{\prime}_{32,t},\cdots, a^{\prime}_{m(m-1),t})^{\prime}$
. The evolution of elements in $A_{t}$
is assumed to be a driftless random walk,
$A_{t}$
is assumed to be a driftless random walk,
 \begin{equation}a_{t+1}=a_{t}+k_{3t}\varsigma _{t},\end{equation}
where $\varsigma _{t}$
is
$\varsigma _{t}$
is $N(0,S)$
and independent over
$N(0,S)$
and independent over $t$
. We assume that
$t$
. We assume that $\eta _{t}$
,
$\eta _{t}$
, $\mu _{t}$
and
$\mu _{t}$
and $\varsigma _{t}$
are independent over
$\varsigma _{t}$
are independent over $t$
and independent of
$t$
and independent of $\varepsilon _{t}$
, and
$\varepsilon _{t}$
, and $Q, W\text{ and }S$
are positive definite matrices.
$Q, W\text{ and }S$
are positive definite matrices.
Following Koop et al. (Reference Koop, Leon-Gonzalez and Strachan2009) in the state Equations (4), (5) and (6), the latent variables $k_{1t}, k_{2t}$
and
$k_{1t}, k_{2t}$
and $k_{3t}$
are assumed to be independent both contemporaneously as well as at all lags and leads and to take on the value of 1 if there is a change in the corresponding state errors and 0 otherwise. The probabilities of
$k_{3t}$
are assumed to be independent both contemporaneously as well as at all lags and leads and to take on the value of 1 if there is a change in the corresponding state errors and 0 otherwise. The probabilities of $k_{jt}, j=1,2,3,$
being zero or one are assigned with a Beta prior distribution,
$k_{jt}, j=1,2,3,$
being zero or one are assigned with a Beta prior distribution, $p_{j}\sim Beta(1,1)$
and are subsequently updated from the data likelihood. The prior belief assumes the number of breaks through a non-informative choice at an even break with
$p_{j}\sim Beta(1,1)$
and are subsequently updated from the data likelihood. The prior belief assumes the number of breaks through a non-informative choice at an even break with $E(p_{j})=0.5$
and
$E(p_{j})=0.5$
and $std(p_{j})=0.29$
, rather than the traditional hard restriction on the break points based on the economic theory. The mixture innovation specification is regarded as a special form of the Bayesian model stochastic search method for the model selection restrictions on the VAR models based on the data providing us with information on changes of parameters in the model in George and McCulloch (Reference George and McCulloch1997), George et al. (Reference George, Sun and Ni2008), Jochmann et al. (Reference Jochmann, Koop and Strachan2010), and Jochmann et al. (Reference Jochmann, Koop, Leon-Gonzalez and Strachan2013).
$std(p_{j})=0.29$
, rather than the traditional hard restriction on the break points based on the economic theory. The mixture innovation specification is regarded as a special form of the Bayesian model stochastic search method for the model selection restrictions on the VAR models based on the data providing us with information on changes of parameters in the model in George and McCulloch (Reference George and McCulloch1997), George et al. (Reference George, Sun and Ni2008), Jochmann et al. (Reference Jochmann, Koop and Strachan2010), and Jochmann et al. (Reference Jochmann, Koop, Leon-Gonzalez and Strachan2013).
We follow Koop et al. (Reference Koop, Leon-Gonzalez and Strachan2009) and Kang et al. (Reference Kang, Ratti and Yoon2015a) to use similar prior distributions of unknown parameters and take the training sample of the first six years of the data to calibrate the key priors of hyperparameters at time $t=0\,:\,\beta _{0}\sim N(\hat{\beta }_{0},m(p+1)\times \hat{V}_{\beta })$
,
$t=0\,:\,\beta _{0}\sim N(\hat{\beta }_{0},m(p+1)\times \hat{V}_{\beta })$
, $\ln (\sigma _{0})\sim N(\ln (\hat{\sigma }_{0}),I_{m})$
, and
$\ln (\sigma _{0})\sim N(\ln (\hat{\sigma }_{0}),I_{m})$
, and $a_{0}\sim N(\hat{a}_{0},m(m-1)\times \hat{V}_{a})$
. We utilize Wishart distribution priors for the variance-covariance matrices:
$a_{0}\sim N(\hat{a}_{0},m(m-1)\times \hat{V}_{a})$
. We utilize Wishart distribution priors for the variance-covariance matrices: $Q^{-1}\sim W(v_{Q},V_{Q}^{-1}),$
where
$Q^{-1}\sim W(v_{Q},V_{Q}^{-1}),$
where $v_{Q}=m(p+1)+1$
and
$v_{Q}=m(p+1)+1$
and $V_{Q}=0.05\times m(p+1)\times I_{m(p+1)}$
,
$V_{Q}=0.05\times m(p+1)\times I_{m(p+1)}$
, $W^{-1}\sim W(v_{w},V_{w}^{-1})$
, where
$W^{-1}\sim W(v_{w},V_{w}^{-1})$
, where $v_{w}=m+1$
and
$v_{w}=m+1$
and $V_{Q}=0.0001\times m\times I_{m}$
, and
$V_{Q}=0.0001\times m\times I_{m}$
, and $S^{-1}\sim W(v_{s},V_{s}^{-1}),$
where
$S^{-1}\sim W(v_{s},V_{s}^{-1}),$
where $v_{s}=m(m-1)+1$
and
$v_{s}=m(m-1)+1$
and $V_{s}=0.01\times m(m-1)\times I_{m(m-1)}$
. The calibration of
$V_{s}=0.01\times m(m-1)\times I_{m(m-1)}$
. The calibration of $\hat{\beta }_{0}$
and
$\hat{\beta }_{0}$
and $\hat{V}_{\beta }$
is obtained from the conditional Maximum Likelihood Estimates of the time-invariant version of Equation (3). The specification of
$\hat{V}_{\beta }$
is obtained from the conditional Maximum Likelihood Estimates of the time-invariant version of Equation (3). The specification of $\hat{\sigma }_{0}$
,
$\hat{\sigma }_{0}$
, $\hat{a}_{0}$
and
$\hat{a}_{0}$
and $\hat{V}_{a}$
is drawn from the decomposition of time-invariant error variance-covariance matrix
$\hat{V}_{a}$
is drawn from the decomposition of time-invariant error variance-covariance matrix $H=A^{-1} \Sigma \Sigma^{\prime}(A^{-1})^{\prime}$
.
$H=A^{-1} \Sigma \Sigma^{\prime}(A^{-1})^{\prime}$
.
We then run the Markov chain Monte Carlo algorithm executed 12,000 times with the first 10,000 draws discarded as burn-in iterates, based on the joint posterior density, $p(\beta ^{T},\sigma ^{T},a^{T},Q,W,S|y^{T})$
, obtained from the combination of the prior distribution and the likelihood function of the sample. Finally, the resulting estimates are used to construct the structural-form VAR representation of the model,
$p(\beta ^{T},\sigma ^{T},a^{T},Q,W,S|y^{T})$
, obtained from the combination of the prior distribution and the likelihood function of the sample. Finally, the resulting estimates are used to construct the structural-form VAR representation of the model, $y_{t}=z_{t}\beta _{t}+A_{t}^{-1}\Sigma _{t}u_{t}$
, where
$y_{t}=z_{t}\beta _{t}+A_{t}^{-1}\Sigma _{t}u_{t}$
, where $\varepsilon _{t}=A_{t}^{-1}\Sigma _{t}u_{t}$
.
$\varepsilon _{t}=A_{t}^{-1}\Sigma _{t}u_{t}$
.
4. Time-varying effects of stock market volatility on commodity prices
4.1 Evidence on the time-varying parameters
Our mixture innovation specification in the state space system allows us to obtain the probabilities of a break at each point in time that presents evidence on how the parameters of model have changed over time. Table 1 shows the average probabilities of the break of the three parameters $\beta _{t}$
,
$\beta _{t}$
, $\mathit{\log } \sigma _{t}$
and
$\mathit{\log } \sigma _{t}$
and $a_{t}$
for the broad/individual commodity price over time. The transition probabilities of the three parameter posteriors are
$a_{t}$
for the broad/individual commodity price over time. The transition probabilities of the three parameter posteriors are $E(p_{1}|data)=0.817$
,
$E(p_{1}|data)=0.817$
, $E(p_{2}|data)=0.997$
, and
$E(p_{2}|data)=0.997$
, and $E(p_{3}|data)=0.129$
for the regression coefficients
$E(p_{3}|data)=0.129$
for the regression coefficients $\beta _{t}$
, the elements of the diagonal error variance
$\beta _{t}$
, the elements of the diagonal error variance $\delta _{t}$
, and the non-zero and non-one elements of the off-diagonal error covariance
$\delta _{t}$
, and the non-zero and non-one elements of the off-diagonal error covariance $a_{t}$
, respectively, for the broad commodity price. It indicates the gradual evolution of parameters in the model, even though we use their priors that are non-informative, rather than the abrupt breaks of conventional structural break models argued (see Primiceri (Reference Primiceri2005) for monetary policy and Baumeister and Peersman (Reference Baumeister and Peersman2013) for oil prices). The evidence of parameter change is greatest for regression coefficients
$a_{t}$
, respectively, for the broad commodity price. It indicates the gradual evolution of parameters in the model, even though we use their priors that are non-informative, rather than the abrupt breaks of conventional structural break models argued (see Primiceri (Reference Primiceri2005) for monetary policy and Baumeister and Peersman (Reference Baumeister and Peersman2013) for oil prices). The evidence of parameter change is greatest for regression coefficients $\beta _{t}$
and error variances
$\beta _{t}$
and error variances $\sigma _{t}$
and is appreciable for
$\sigma _{t}$
and is appreciable for $a_{t}$
the covariance of commodity prices and stock market volatility (expected a break to occur about once per week). The results confirm that exogenous shocks generated particularly by the variance in the error variance-covariance matrix change over time and are of predominant importance in the commodity prices. The evolution of the regression coefficients and the covariance elements in the variance-covariance matrix is appreciable enough that should not be neglected, in the sense that the transmission mechanism is not merely the properties of the exogenous shocks that have changed in the commodity market over time.
$a_{t}$
the covariance of commodity prices and stock market volatility (expected a break to occur about once per week). The results confirm that exogenous shocks generated particularly by the variance in the error variance-covariance matrix change over time and are of predominant importance in the commodity prices. The evolution of the regression coefficients and the covariance elements in the variance-covariance matrix is appreciable enough that should not be neglected, in the sense that the transmission mechanism is not merely the properties of the exogenous shocks that have changed in the commodity market over time.
Transition probability of regression coefficients and error variance and covariance elements

Notes: The posteriors for the transition probabilities E(P1|Data) for the regression coefficients βt, E(P2|Data) the elements of the diagonal error variance δt, and E(P3|Data) the non-zero and non-one elements of the off-diagonal error covariance αt respectively.
The results are very similar to those using the sectoral/individual commodity prices in Table 1. Note that the evidence of changes in the regression coefficients $\beta _{t}$
is relatively larger for the prices of petroleum, heating oil, gas oil, and crude oil that have relatively higher trading activities with the stock market. The result is in line with the findings in the literature showing the changes in the transmission mechanism by investigating the historical decomposition of oil and stock dynamics over time using the standard VAR model with time-invariant parameters in Kilian and Park (Reference Kilian and Park2009) for example. Our methodology allows the distinction by selecting restrictions for VAR models using the data information on changes of parameters in the model. In contrast, changes in the posterior probabilities of regression coefficients
$\beta _{t}$
is relatively larger for the prices of petroleum, heating oil, gas oil, and crude oil that have relatively higher trading activities with the stock market. The result is in line with the findings in the literature showing the changes in the transmission mechanism by investigating the historical decomposition of oil and stock dynamics over time using the standard VAR model with time-invariant parameters in Kilian and Park (Reference Kilian and Park2009) for example. Our methodology allows the distinction by selecting restrictions for VAR models using the data information on changes of parameters in the model. In contrast, changes in the posterior probabilities of regression coefficients $\beta _{t}$
are relatively smaller for the prices of copper, gold, silver, and the previous metals. It implies that the changes in the transmission mechanism generated particularly by stock volatility on the precious metal prices are relatively smaller over time, in the fact that investing in precious metals is conventionally regarded as a risk management tool in the time of stock market turbulence. The evidence of changes in the covariance
$\beta _{t}$
are relatively smaller for the prices of copper, gold, silver, and the previous metals. It implies that the changes in the transmission mechanism generated particularly by stock volatility on the precious metal prices are relatively smaller over time, in the fact that investing in precious metals is conventionally regarded as a risk management tool in the time of stock market turbulence. The evidence of changes in the covariance $a_{t}$
is appreciable in the agriculture sector, this being an expected break to occur about once per trading week in the contemporaneous co-movement between stock market volatility and cocoa, cotton, soybeans, sugar, and corn prices, respectively. The evidence of parameter change is consistently large, greater than 0.97 across industries for the error variances
$a_{t}$
is appreciable in the agriculture sector, this being an expected break to occur about once per trading week in the contemporaneous co-movement between stock market volatility and cocoa, cotton, soybeans, sugar, and corn prices, respectively. The evidence of parameter change is consistently large, greater than 0.97 across industries for the error variances $\sigma _{t}$
, confirming that exogenous shocks generated by the variance are significantly changed over time and are of predominant importance in the fluctuation of commodity prices.
$\sigma _{t}$
, confirming that exogenous shocks generated by the variance are significantly changed over time and are of predominant importance in the fluctuation of commodity prices.
The substantial variation in the heteroskedastic VAR specification is consistent with major changes in the shocks in stock and commodity market over time (see, for example, Kang et al. Reference Kang, Ratti and Yoon2015a). It confirms that the transmission mechanism (shown via regression coefficients in particular) is not constant over time and the way the exogenous shocks (shown via variances in particular) are generated changes over time in the dynamics of stock market volatility and commodity prices.
4.2 Impulse response functions of stock market volatility shocks on commodity prices
In this subsection, we investigate whether the changes of the parameters in the model have important implications (i.e., the transmission mechanism) for the effect of stock market volatility on the commodity price through the analysis of impulse response functions at each point of time. We calculate the effect of a shock of size one to the structure errors, $\varepsilon _{t}=A_{t}^{-1}\Sigma _{t}u_{t}$
, in Equation (1). All the endogenous variables are demeaned and standardized to make each shock effect comparable in the analysis over time.
$\varepsilon _{t}=A_{t}^{-1}\Sigma _{t}u_{t}$
, in Equation (1). All the endogenous variables are demeaned and standardized to make each shock effect comparable in the analysis over time.
Figure 2 shows that the posterior median of the impulse response functions of the broad commodity prices to stock market shocks along with the 16th and 84th percentiles of the posterior median. Specifically, the impulse responses of the commodity prices to one point increase in stock prices are negative but small before 2005, fluctuate significantly thereafter over the period of 2005–2007, and then plummet to the nadir during the 2008–2009 Global Financial Crisis (GFC). The negative effects are persistently large for more than two years after the GFC, close to zeros between 2013–2017, built up in the 2018 Trump Tariff, and then increased dramatically since the start of COVID-19 pandemic in 2020. The evolution of the impulse response functions presents that the transmission mechanism has changed in the commodity market; that is the way exogeneous stock market shocks affect the commodity prices varies significantly over past two decades.
Responses of Commodity Price to Stock Volatility Shock.
Notes: The figure shows the posterior median, 16-th and 84-th percentiles of the impulse responses of commodity prices to stock market volatility shocks from January 10, 2000 to June 14, 2021.

Overall, the values of the posterior medians present that stock market shocks have a systematically negative effect on commodity prices over time. Note that each credible interval contains zero individually does not necessarily imply that there is no interesting difference in the impulse response functions jointly over time (Koop et al. Reference Koop, Leon-Gonzalez and Strachan2009). The evolution of impulse response functions is negative on average, with the most significantly negative effects being in October/November 2008 during the GFC. The negative effect is nonsignificant in March 2020 during the beginning of the COVID-19 shock. It indicates that the effect of stock market shocks associated with financial uncertainty is relatively more significant on the commodity prices than that associated with nonfinancial uncertainty. The impact is stronger in energy commodities such as crude oil, gas oil, heating oil, and petroleum compared to the agricultural and precious metals markets.Footnote 4 Similar results are also seen in Bakas and Triantafyllou (Reference Bakas and Triantafyllou2018) and Kang et al. (Reference Kang, Ratti and Vespignani2021)when investigating the effect of financial/nonfinancial uncertainty on commodity prices using the monthly sample data before the COVID-19 pandemics in 2020. The hedging strategy of longing agricultural and precious metals commodities and shorting energy commodities is beneficial, for example, for a stock market shock associated with financial uncertainty, vice versa on a stock market shock associated with nonfinancial uncertainty. This hedging strategy is conventionally regarded as a risk management tool in the time of energy market turbulence (e.g., Kang et al. Reference Kang, Ratti and Vespignani2021).
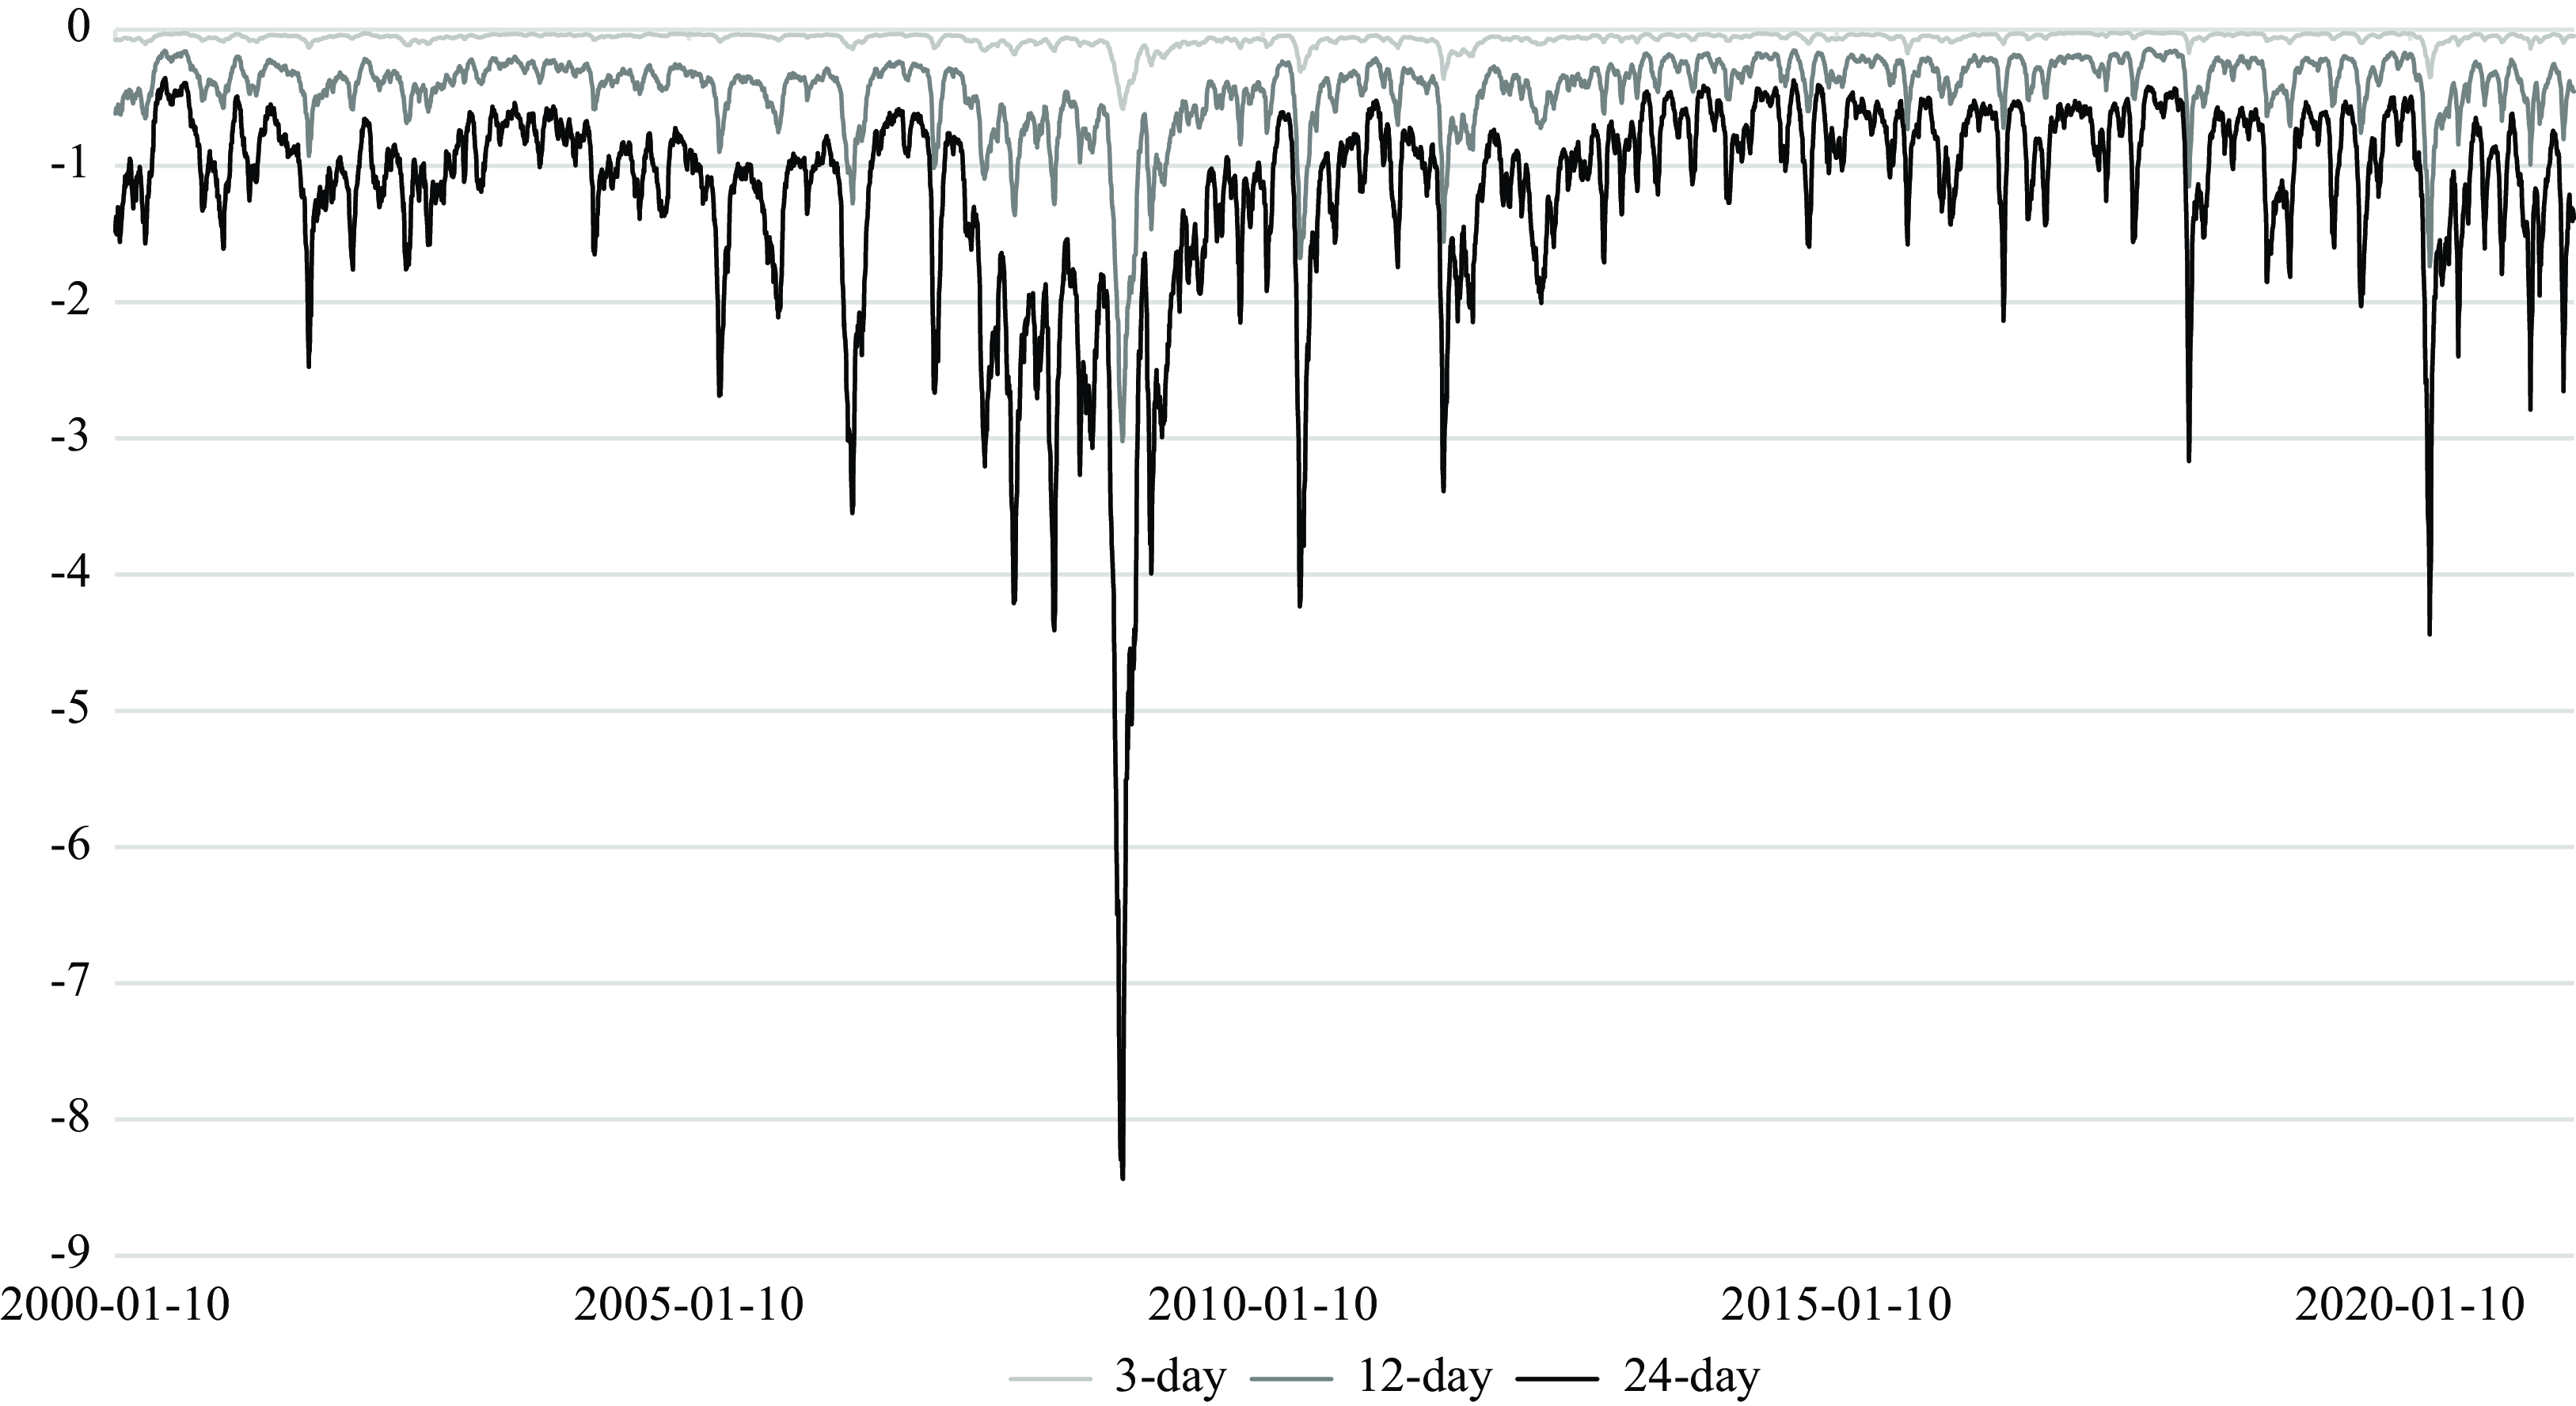
The evolution of the median of the cumulative responses of commodity prices in 3-day (short-term responses), 12-day and 24-day (long-term responses) are shown between January 2000 and June 2021 in Figure 3. First, the correlation between short-term and long-term responses to stock market volatility shocks are high, in that their upward/downward sloping trends are similar at each point in time. Second, the response of commodity prices to stock market shocks is often gradual, in the sense that it takes time for the commodity price response to reach the long-term response level following a stock market volatility shock. It is often the case that the commodity price responses reach approximately the same level after 24 days, in the sense that commodity investors have time to restructure their portfolios to hedge the risk associated with the stock market shocks.
Responses of Commodity Prices to Stock Volatility in 3, 12, and 24 Days.
Notes: The figure shows the posterior median of the impulse responses of commodity prices to stock market volatility shocks in 3-, 12--, and 24-days from January 10, 2000 to June 14, 2021.
5. Sources of the time-varying effects of stock market volatility on commodity prices
Bekaert et al. (Reference Bekaert, Hoerova and Lo Duca2013) argue that the time-varying stock market volatility as proxied by the VIX index can be decomposed to risk aversion and expected stock market volatility, with the former having stronger effects on the economy. We revisit the study and attempt to show that shocks to risk aversion and expected stock market volatility and such shocks on the stock-commodity transmission mechanism change over time in a full set of structural VAR model with time-varying parameters rather than the conventional VAR model with time-invariant parameters in Bekaert et al. (Reference Bekaert, Hoerova and Lo Duca2013). We use Bekaert et al. (Reference Bekaert, Hoerova and Lo Duca2013) to show that the time-varying risk aversion contained in the VIX index differs from the economic policy/financial uncertainty in Bakas and Triantafyllou (Reference Bakas and Triantafyllou2018) and Kang et al. (Reference Kang, Ratti and Vespignani2020, Reference Kang, Ratti and Vespignani2021). The investigation provides us with the channel of time-varying risk aversion to examine the dynamic relationship between stock market volatility and commodity prices. The analysis relates the time-varying risk premium to the VAR model with time-varying parameters to verify that the market’s ability to bear risk is greater in good times but less so in bad times (see the literature using models with time-invariant parameters, for example, Campbell and Cochrane, Reference Campbell and Cochrane1999; Gospodinov and Ng, Reference Gospodinov and Ng2013; Cochrane, Reference Cochrane2017; Gospodinov and Jamali, Reference Gospodinov and Jamali2018; Pflueger and Rinaldi, Reference Pflueger and Rinaldi2022).
We first follow Bekaert et al. (Reference Bekaert, Hoerova and Lo Duca2013) to calculate the daily realized stock market variances $(RVAR_{t})$
,
$(RVAR_{t})$
,
 \begin{equation}RVAR_{t}=\beta _{0}+\beta _{1}VIX_{t-22}^{2}+\beta _{2}RVAR_{t-22}+e_{t},\end{equation}
where $VIX_{t}$
represents the option-implied expected volatility on the S&P500 index with a horizon of 22 trading days (30 calendar days),
$VIX_{t}$
represents the option-implied expected volatility on the S&P500 index with a horizon of 22 trading days (30 calendar days), $RVAR_{t}$
the square of daily S&P500 stock market returns. The fitted value of
$RVAR_{t}$
the square of daily S&P500 stock market returns. The fitted value of $RVAR_{t}$
is our proxy for expected stock market volatility, whereas the difference between the squared VIX and the expected stock market volatility is the measure of risk aversion and other nonlinear pricing effects.
$RVAR_{t}$
is our proxy for expected stock market volatility, whereas the difference between the squared VIX and the expected stock market volatility is the measure of risk aversion and other nonlinear pricing effects.
Figure 4 shows the residual standard deviations of the risk aversion $(s_{t}^{r})$
and the expected stock market volatility
$(s_{t}^{r})$
and the expected stock market volatility $(s_{t}^{v})$
in our state space model using four variables,
$(s_{t}^{v})$
in our state space model using four variables, $y_{t}=(r_{t},s_{t}^{r},s_{t}^{v},c_{t})$
, from February 1, 2000 to June 14, 2021. The figure shows similar results in Bekaert et al. (Reference Bekaert, Hoerova and Lo Duca2013), in the sense that the overall variation of the risk aversion is relatively larger than that of the expected stock market volatility. On average, it provides supporting evidence that the unobservable factor of risk aversion plays a relatively more important role in the economy as the conventional VAR model shows in Bekaert et al. (Reference Bekaert, Hoerova and Lo Duca2013).
$y_{t}=(r_{t},s_{t}^{r},s_{t}^{v},c_{t})$
, from February 1, 2000 to June 14, 2021. The figure shows similar results in Bekaert et al. (Reference Bekaert, Hoerova and Lo Duca2013), in the sense that the overall variation of the risk aversion is relatively larger than that of the expected stock market volatility. On average, it provides supporting evidence that the unobservable factor of risk aversion plays a relatively more important role in the economy as the conventional VAR model shows in Bekaert et al. (Reference Bekaert, Hoerova and Lo Duca2013).
VIX Decomposition into Uncertainty and Risk Aversion.
Notes: The figure presents a decomposition of the squared VIX in the two components of the uncertainty (expected stock market volatility) and the risk aversion (the difference between the squared VIX and uncertainty) from February 1, 2000 to June 14, 2021.

Here in our structural VAR model with time-varying parameters, we compare the average probabilities of the breaks of the three parameters, $\beta _{t}$
,
$\beta _{t}$
, $\mathit{\log } \sigma _{t}$
and
$\mathit{\log } \sigma _{t}$
and $a_{t}$
, in the four variable model including the time-varying risk aversion and expected stock market volatility with that in the three variable model including stock market volatility. The four (three) variable model shows that the transition probabilities of the posteriors are
$a_{t}$
, in the four variable model including the time-varying risk aversion and expected stock market volatility with that in the three variable model including stock market volatility. The four (three) variable model shows that the transition probabilities of the posteriors are $E(p_{1}|data)=0.613(0.817)$
,
$E(p_{1}|data)=0.613(0.817)$
, $E(p_{2}|data)=0.995(0.997)$
, and
$E(p_{2}|data)=0.995(0.997)$
, and $E(p_{3}|data)=0.202(0.129)$
for the regression coefficients
$E(p_{3}|data)=0.202(0.129)$
for the regression coefficients $\beta _{t}$
, the elements of the diagonal error variance
$\beta _{t}$
, the elements of the diagonal error variance $\delta _{t}$
, and the non-zero and non-one elements of the off-diagonal error covariance
$\delta _{t}$
, and the non-zero and non-one elements of the off-diagonal error covariance $a_{t}$
, respectively. The result indicates that the changes in the transmission mechanism (shown in the regression coefficients) are reduced by more than 33% when the stock market volatility of VIX index is decomposed into risk aversion and expected stock market volatility. Changes in the way the exogenous shocks to the co-movement of stock market volatility and commodity prices are generated (shown in the covariances) are improved by more than 56% when considering the decomposition of risk aversion and expected stock volatility.
$a_{t}$
, respectively. The result indicates that the changes in the transmission mechanism (shown in the regression coefficients) are reduced by more than 33% when the stock market volatility of VIX index is decomposed into risk aversion and expected stock market volatility. Changes in the way the exogenous shocks to the co-movement of stock market volatility and commodity prices are generated (shown in the covariances) are improved by more than 56% when considering the decomposition of risk aversion and expected stock volatility.
On average, as shown in Figure 5, the long-lasting negative effect of risk aversion is stronger compared to that of the expected stock market volatility on the commodity price. This result is in line with that of Bakas and Triantafyllou (2015) that unobservable uncertainty has a more significantly impact effect on the commodity price. However, we find that the stock-commodity transmission mechanism has changed due to changes in underlying sources of risk aversion and expected stock market uncertainty. For example, the variation of the risk aversion (expected stock market uncertainty) during the COVID-19 pandemics in March 2020 is relatively larger (smaller) than that during the GFC in November 2008 as shown in Figure 4, as is the effect of the risk aversion on the commodity price relatively stronger in that pandemic period as shown in Figure 5. This verifies that the time-varying risk aversion contained in the VIX index differs from the economic policy/financial uncertainty in its impact on the commodity prices in Bakas and Triantafyllou (Reference Bakas and Triantafyllou2018) and Kang et al. (Reference Kang, Ratti and Vespignani2020, Reference Kang, Ratti and Vespignani2021). The change in the transmission mechanism in the commodity market is likely due to changes in underlying sources of risk aversion and expected stock market uncertainty over time. The latent factor of risk aversion contained in stock market volatility plays a relatively more important role in the fluctuation of commodity prices overall and during the recent COVID-19 pandemic period. In contrast, shocks to the expected stock market uncertainty are relatively stronger on the commodity prices during the 2008-2009 GFC.
Responses of Commodity Prices to Uncertainty and Risk Aversion Shocks.
Notes: The figure shows the posterior median of the impulse responses of commodity prices to the uncertainty and risk aversion shocks from February 9, 2000 to June 14, 2021.

The investigation above confirms that what matters most for policy makers (and commodity investors) is not the observed (expected) macroeconomic (stock) uncertainty, but the degree of unpredictability over the fluctuation of macroeconomic variables shown in Bekaert et al. (Reference Bekaert, Hoerova and Lo Duca2013) and Bakas and Triantafyllou (Reference Bakas and Triantafyllou2018). We contribute the literature to show that both shocks to the unpredictability measured by latent risk aversion and the expected stock market uncertainty vary over time, in which the transmission mechanism of risk aversion shocks on commodity prices has become relatively stronger since the COVID-19 pandemic in 2020.
6. Robustness
6.1 Evidence on the time-varying parameters using monthly data
We draw on the monthly data of the three time-series of interest rate spread $(r_{t})$
, VIX index
$(r_{t})$
, VIX index $(VIX_{t})$
, and the commodity futures market S&P GSCI index
$(VIX_{t})$
, and the commodity futures market S&P GSCI index $(c_{t})$
as in the daily data analysis and the monthly U.S. industrial production index
$(c_{t})$
as in the daily data analysis and the monthly U.S. industrial production index $(ip_{t})$
and the monthly U.S. consumer price index
$(ip_{t})$
and the monthly U.S. consumer price index $(\pi _{t})$
between December in 1999 and June in 2021 for the robustness analysis based on our state space model using five variables,
$(\pi _{t})$
between December in 1999 and June in 2021 for the robustness analysis based on our state space model using five variables, $y_{t}=(ip_{t},\pi _{t},r_{t},s_{t},c_{t})$
. We place the U.S. industrial production in first place in the order in the model by assuming that the industrial production within a month does not respond contemporaneously to innovations in the inflation, interest rate, stock market volatility or commodity prices, given the sluggishness of real aggregate economic activity. We also assume that the U.S. aggregate price level responds to innovations in the interest rate, stock market volatility, and commodity prices with, at least, a one-month delay. The posterior mean of transition probability is
$y_{t}=(ip_{t},\pi _{t},r_{t},s_{t},c_{t})$
. We place the U.S. industrial production in first place in the order in the model by assuming that the industrial production within a month does not respond contemporaneously to innovations in the inflation, interest rate, stock market volatility or commodity prices, given the sluggishness of real aggregate economic activity. We also assume that the U.S. aggregate price level responds to innovations in the interest rate, stock market volatility, and commodity prices with, at least, a one-month delay. The posterior mean of transition probability is $E(p_{1}|data)=0.584$
,
$E(p_{1}|data)=0.584$
, $E(p_{2}|data)=0.948$
, and
$E(p_{2}|data)=0.948$
, and $E(p_{3}|data)=0.527$
for the regression coefficients
$E(p_{3}|data)=0.527$
for the regression coefficients $\beta _{t}$
, the elements of the diagonal error variance
$\beta _{t}$
, the elements of the diagonal error variance $\delta _{t}$
, and the non-zero and non-one elements of the off-diagonal error covariance
$\delta _{t}$
, and the non-zero and non-one elements of the off-diagonal error covariance $a_{t}$
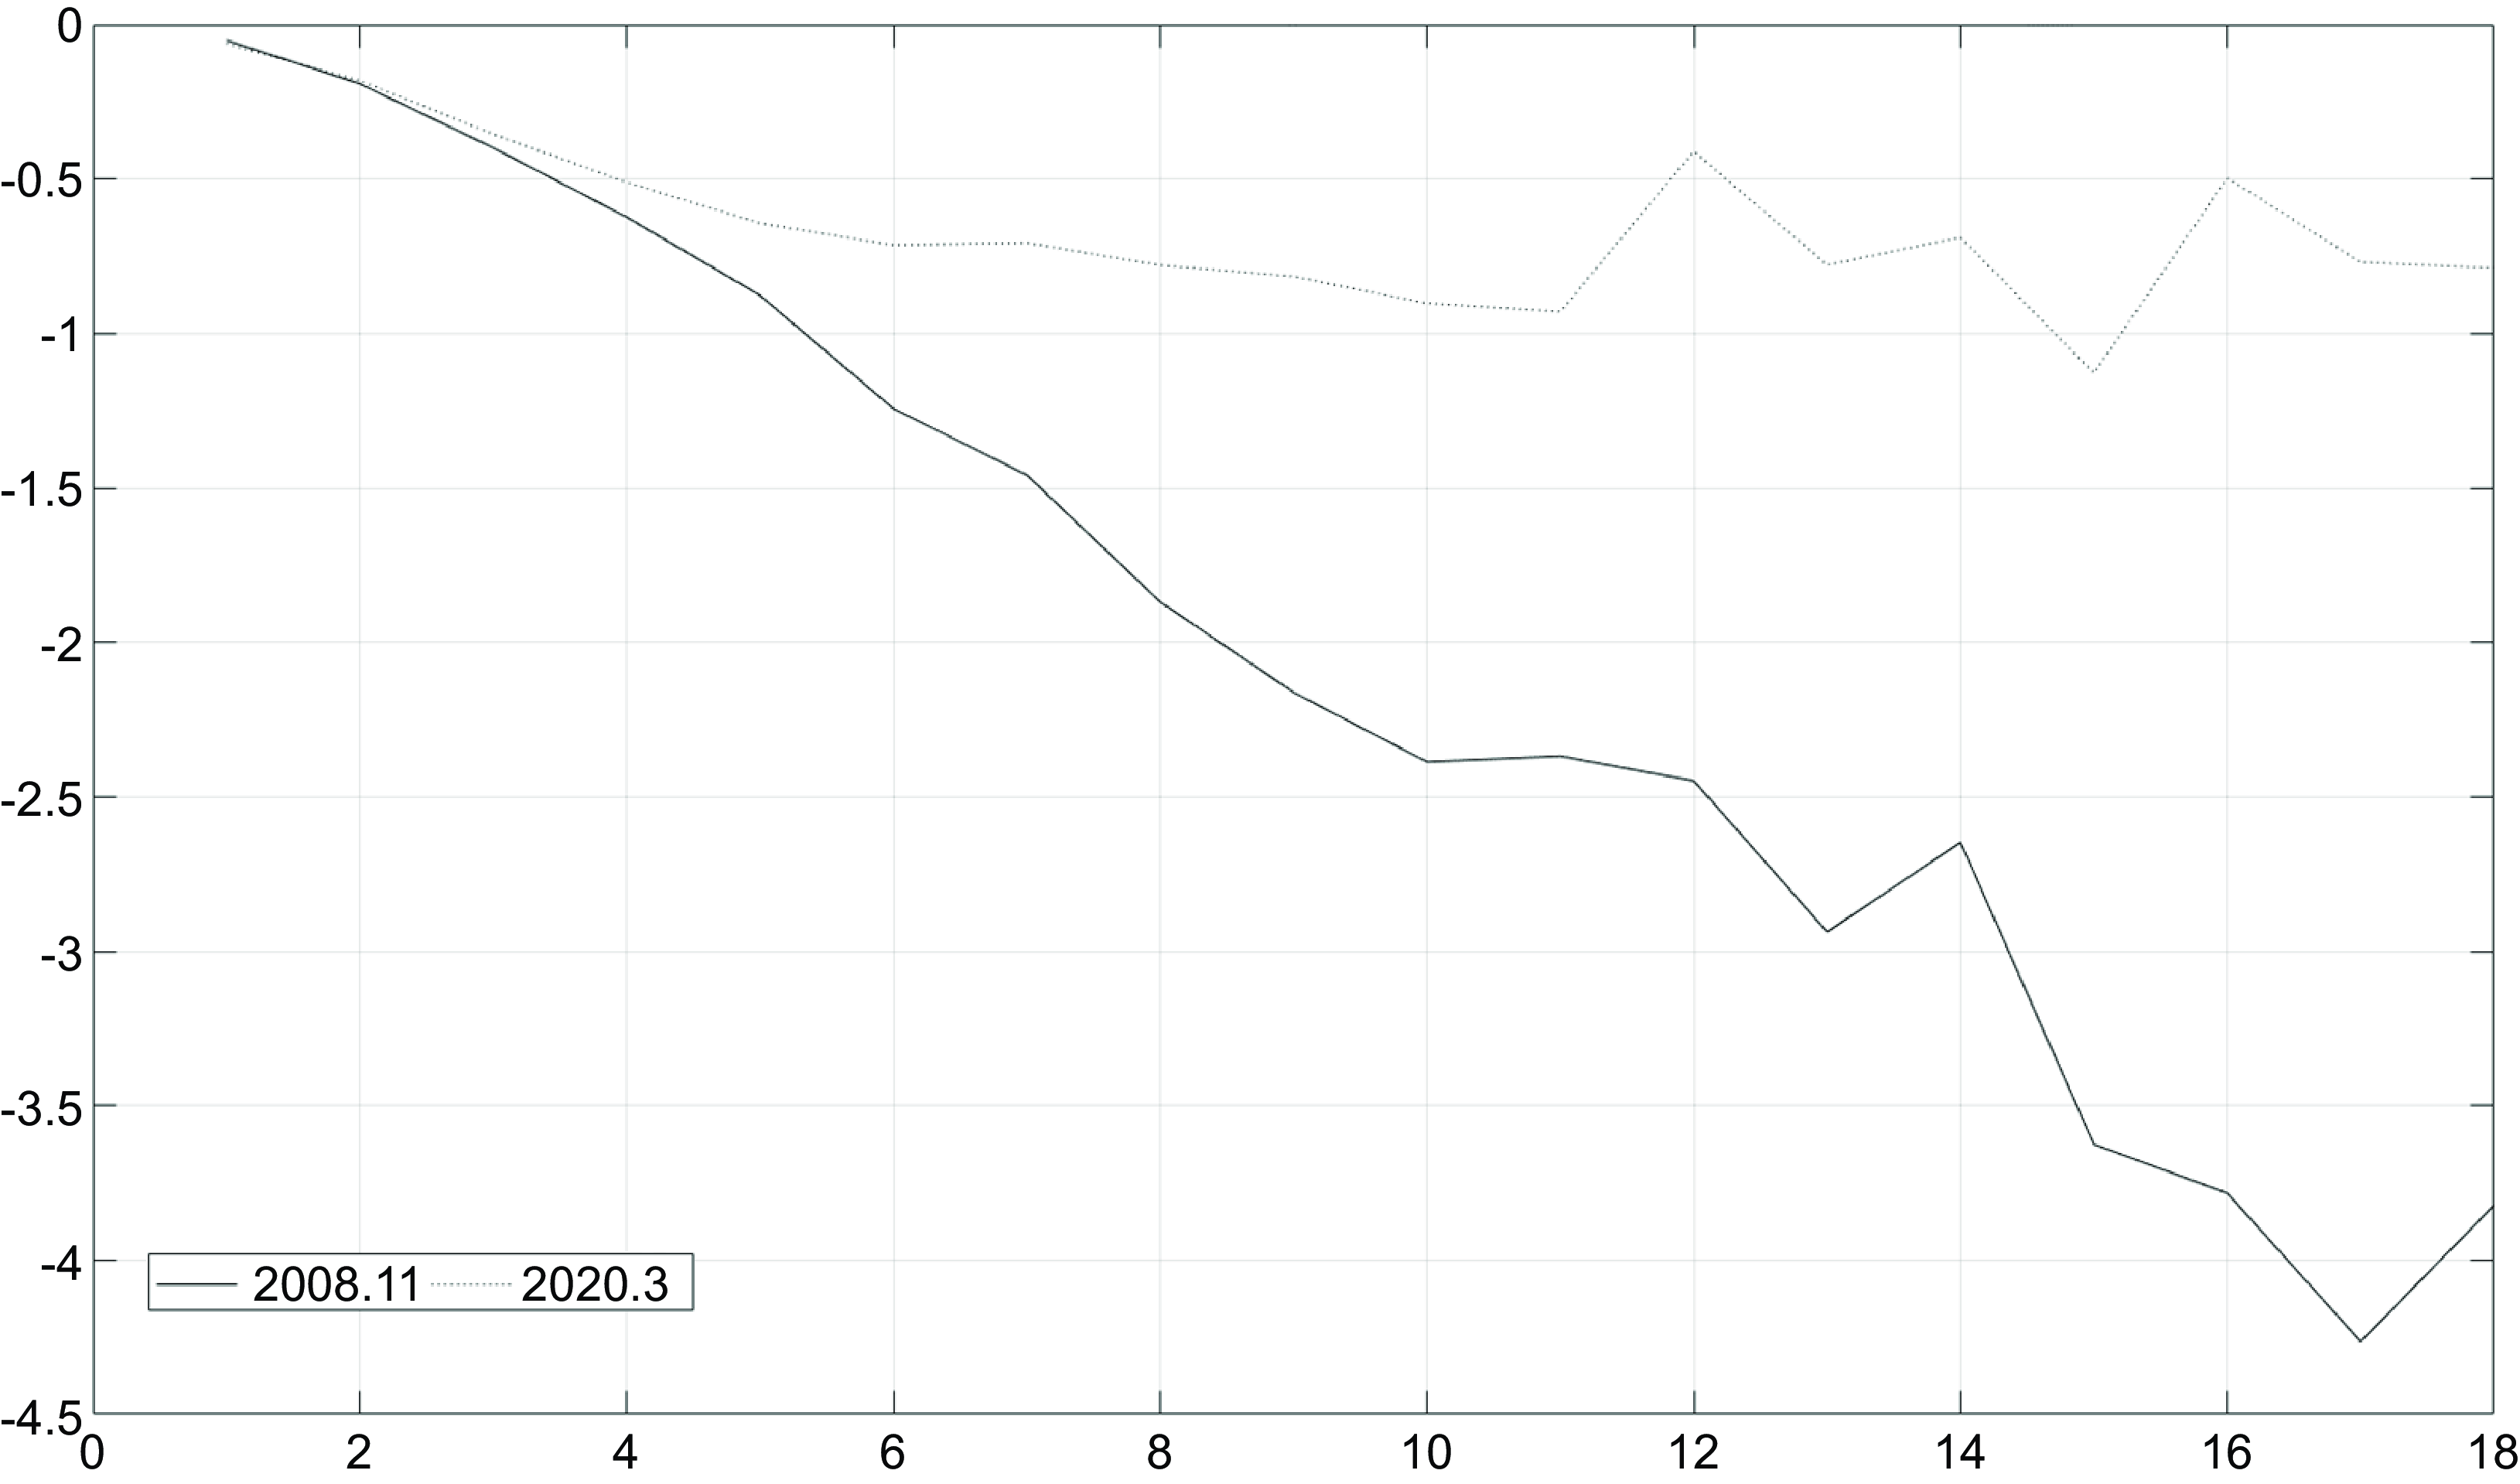
, respectively, for the monthly broad commodity price. Figure 6 shows the posterior median of commodity price responses to stock market volatility shocks in 18 months in November 2008 and in March 2020. The result confirms that there is a high probability of changes in all parameters in the model at each point of time, while shocks to stock market volatility may cause long-lasting negative effects on the commodity price.
$a_{t}$
, respectively, for the monthly broad commodity price. Figure 6 shows the posterior median of commodity price responses to stock market volatility shocks in 18 months in November 2008 and in March 2020. The result confirms that there is a high probability of changes in all parameters in the model at each point of time, while shocks to stock market volatility may cause long-lasting negative effects on the commodity price.
Posterior median of commodity price responses to stock in 2008.11 and 2020.3.
Notes: The figure shows the posterior median of the impulse responses of commodity prices to stock market volatility shocks in 18 months in November 2008 and in March 2020.

We then compare the results using alternative measures of economic uncertainty related to the VIX index $(VIX_{t})$
, including economic policy uncertainty proposed by Baker et al. (Reference Baker, Bloom and Davis2016) and unobserved macroeconomic uncertainty based on Jurado et al., (2015), which have been studied thoroughly in the recent literature. While the similar result shows the high probability of changes in the parameters in the model using alternative measures of economic uncertainty, Figure 7 shows that the negative effects of economic policy uncertainty shocks on the commodity prices are short-lived followed by a strong recovery in 6 months. In contrast, Figure 8 illustrates that shocks to unobserved macroeconomic uncertainty may cause long-lasting negative effects on the commodity price, which are stronger in November 2008. Our results are in line with the findings in Bakas and Triantafyllou (Reference Bakas and Triantafyllou2018) who show that latent uncertainty shocks have the most significant impact on the commodity prices when compared to observable economic policy uncertainty.
$(VIX_{t})$
, including economic policy uncertainty proposed by Baker et al. (Reference Baker, Bloom and Davis2016) and unobserved macroeconomic uncertainty based on Jurado et al., (2015), which have been studied thoroughly in the recent literature. While the similar result shows the high probability of changes in the parameters in the model using alternative measures of economic uncertainty, Figure 7 shows that the negative effects of economic policy uncertainty shocks on the commodity prices are short-lived followed by a strong recovery in 6 months. In contrast, Figure 8 illustrates that shocks to unobserved macroeconomic uncertainty may cause long-lasting negative effects on the commodity price, which are stronger in November 2008. Our results are in line with the findings in Bakas and Triantafyllou (Reference Bakas and Triantafyllou2018) who show that latent uncertainty shocks have the most significant impact on the commodity prices when compared to observable economic policy uncertainty.
Posterior median of commodity price responses to economic policy uncertainty shocks in 2008.11 and 2020.3.
Notes: The figure shows the posterior median of the impulse responses of commodity prices to the economic policy uncertainty shocks in 18 months in November 2008 and in March 2020.

Posterior median of commodity price responses to unobserved macroeconomic uncertainty shocks in 2008.11 and 2020.3.
Notes: The figure shows the posterior median of the impulse responses of commodity prices to the unobserved macroeconomic shocks in 18 months in November 2008 and in March 2020.
6.2 International evidence
In the second robustness check, we draw on the daily major world stock market volatility indices including the Euro Stoxx 50 volatility index in Europe (VSTOXX) and the Japanese volatility index in Asian (VXJ) between December 31, 1999 and June 14, 2021. We run the time-varying state space system (3) - (6) by replacing the U.S. stock market volatility index (VIX) with the major world stock market volatility index respectively. In Europe, the posterior mean of transition probability is $E(p_{1}|data)=0.772$
,
$E(p_{1}|data)=0.772$
, $E(p_{2}|data)=0.996$
, and
$E(p_{2}|data)=0.996$
, and $E(p_{3}|data)=0.131$
for the regression coefficients
$E(p_{3}|data)=0.131$
for the regression coefficients $\beta _{t}$
, the elements of the diagonal error variance
$\beta _{t}$
, the elements of the diagonal error variance $\delta _{t}$
, and the non-zero and non-one elements of the off-diagonal error covariance
$\delta _{t}$
, and the non-zero and non-one elements of the off-diagonal error covariance $a_{t}$
, respectively, for the daily broad commodity price. In Asia, the posterior mean of transition probability is
$a_{t}$
, respectively, for the daily broad commodity price. In Asia, the posterior mean of transition probability is $E(p_{1}|data)=0.774$
,
$E(p_{1}|data)=0.774$
, $E(p_{2}|data)=0.995$
, and
$E(p_{2}|data)=0.995$
, and $E(p_{3}|data)=0.145$
for
$E(p_{3}|data)=0.145$
for $\beta _{t}$
,
$\beta _{t}$
, $\delta _{t}$
, and
$\delta _{t}$
, and $a_{t}$
respectively. These results are very similar to those obtained using the U.S. VIX index, confirming that the transmission mechanism is not constant over time and the way the exogenous shocks are generated changes over time in the dynamics of stock market volatility and commodity prices.
$a_{t}$
respectively. These results are very similar to those obtained using the U.S. VIX index, confirming that the transmission mechanism is not constant over time and the way the exogenous shocks are generated changes over time in the dynamics of stock market volatility and commodity prices.
7. Conclusion
There has been significant interest in the recent macroeconomic literature on the transmission of stock market shocks and the volatility of the shocks. Particularly, questions of interest to policymakers typically involve the inter-relationships between the stock market volatility and commodity prices by building a multivariate model and investigating whether the relation has changed over time. This empirical paper analyzes the relationship between stock market volatility and commodity prices via the time-varying risk aversion channel using a time-varying structural-form VAR model. The paper makes three main novel contributions: (i) we employ long span daily data that help us to compare the first two economic recessions of the XXI century, (ii) we estimate the impact of stock market volatility on—aggregate, sectoral and individual—commodity prices, and (iii) we also investigate the nexus between VIX volatility components—risk aversion and uncertainty—on commodity prices.
The main results are the following. First, empirical results suggest that the transmission mechanism of stock market volatility shocks on the commodity prices change gradually rather than abruptly over time, although such exogenous shocks change at each point in time. It implies that policymakers and investment practitioners have time to adjust their decisions on the commodity market upon a stock market volatility shock. Using aggregate commodity data, the negative effect of stock market volatility on commodity prices is stronger in the 2008-09 GFC than that during the COVID-19 pandemic in 2020. Focusing on sectoral and individual commodity data, the significantly negative effect is greater in energy commodities compared to the agricultural and precious metals markets, in the sense that investing in precious metals is regarded as a risk management tool in the time of stock/energy market turbulence.
Second, decomposing VIX volatility into uncertainty and risk aversion, we detect that the long-lasting negative effect of risk aversion is stronger compared to that of the uncertainty—expected stock market volatility—on the commodity price. We confirm that what matters most for policy makers and investors is not the observed macroeconomic uncertainty, but the degree of unpredictability over the fluctuation of macroeconomic variables shown in Bekaert et al. (Reference Bekaert, Hoerova and Lo Duca2013) and Bakas and Triantafyllou (Reference Bakas and Triantafyllou2018). We contribute to the literature by showing that both shocks to latent risk aversion and expected stock uncertainty vary over time, in which the transmission mechanism of risk aversion shocks on commodity prices has become relatively stronger since the COVID-19 pandemic in 2020. It implies that the market’s inability to bear risk is growing in bad times.
Acknowledgements
The authors would like to thank the editor, Prof. William A. Barnett, and two anonymous referees for their useful comments and editorial suggestions. We also thank Gilles Dufrenot, Fredj Jawadi and the participants at the 7th International Workshop on Financial Markets and Nonlinear Dynamics – 2023 for their valuable comments and insightful suggestions that greatly improved the contents and presentation of the paper.
Funding
Fernando Perez de Gracia gratefully acknowledges financial support by the Grant PID2020-114275 GB-I00 funded by MCIN/AEI/10.13039/501100011033.
Supplementary material
The supplementary material for this article can be found at https://doi.org/10.1017/S1365100524000324.


 Open access