


Introduction
Depression is one of the largest contributors to global disability in individuals aged ⩾65 years (Empana, Boutouyrie, Lemogne, Jouven, & van Sloten, Reference Empana, Boutouyrie, Lemogne, Jouven and van Sloten2021). Depression has a complex and multifactorial pathophysiology, heterogeneous manifestations, and different courses (or trajectories) over the life span (Musliner, Munk-Olsen, Eaton, & Zandi, Reference Musliner, Munk-Olsen, Eaton and Zandi2016). The ‘vascular depression hypothesis’ postulates that cerebrovascular damage may contribute to a specific subtype of depression that may be more common among older individuals and may be characterized by a chronic trajectory (Musliner et al., Reference Musliner, Munk-Olsen, Eaton and Zandi2016) and a lower response to current antidepressant medication targeting neurotransmitters (Empana et al., Reference Empana, Boutouyrie, Lemogne, Jouven and van Sloten2021). Cerebral microvascular dysfunction may disrupt brain regions involved in mood regulation leading to clinically relevant depressive symptoms (Aizenstein et al., Reference Aizenstein, Baskys, Boldrini, Butters, Diniz, Jaiswal and Tene2016). In accordance, cross-sectional studies have shown that clinically relevant depressive symptoms are associated with reduced cerebrovascular reactivity (Direk et al., Reference Direk, Koudstaal, Hofman, Ikram, Hoogendijk and Tiemeier2012) and features of cerebral small vessel disease (Rensma, van Sloten, Launer, & Stehouwer, Reference Rensma, van Sloten, Launer and Stehouwer2018; van Agtmaal, Houben, Pouwer, Stehouwer, & Schram, Reference van Agtmaal, Houben, Pouwer, Stehouwer and Schram2017), which both may be a result of microvascular dysfunction.
The retina offers a unique opportunity to study cerebral microvascular changes because it allows for non-invasive and easily accessible visualization of a microvascular bed that shares similarities with the cerebral microvasculature (Cheung, Ikram, Chen, & Wong, Reference Cheung, Ikram, Chen and Wong2017). Previous studies have found that retinal microvascular measures are associated with features of cerebral small vessel disease (Heringa et al., Reference Heringa, Bouvy, van den Berg, Moll, Kappelle and Biessels2013; Umemura, Kawamura, & Hotta, Reference Umemura, Kawamura and Hotta2017) and dementia (Cheung, Chan, Mok, Chen, & Wong, Reference Cheung, Chan, Mok, Chen and Wong2019). However, data on the association of retinal microvascular measures with incident clinically relevant depressive symptoms are limited and findings are inconsistent (Geraets et al., Reference Geraets, van Agtmaal, Stehouwer, Sorensen, Berendschot, Webers and Houben2020; Ikram et al., Reference Ikram, Luijendijk, Hofman, de Jong, Breteler, Vingerling and Tiemeier2010; van Gennip et al., Reference van Gennip, Sedaghat, Carnethon, Allen, Klein, Cotch and van Sloten2022).
In a large population-based cohort, we investigated the association of retinal microvascular function, as measured by central retinal arteriolar equivalent or caliber and central retinal venular equivalent or caliber (CRAE and CRVE) and flicker light-induced retinal dilation, with incidence and trajectories of clinically relevant depressive symptoms.
Methods and materials
Study design
We used prospective data from The Maastricht Study, an observational population-based cohort study, the rationale and methodology of which have been described previously (Schram et al., Reference Schram, Sep, van der Kallen, Dagnelie, Koster, Schaper and Stehouwer2014). In brief, the study focuses on the etiology and pathophysiology of type 2 diabetes mellitus and the development of chronic diseases and is characterized by an extensive phenotyping approach. Eligible for participation were all individuals aged between 40 and 75 years and living in the southern part of the Netherlands. Participants were recruited through mass media campaigns and from the municipal registries and the regional Diabetes Patient Registry via mailings. Recruitment was stratified according to known type 2 diabetes status, with an oversampling of individuals with type 2 diabetes for reasons of efficiency. The present report includes prospective data from the first 7689 participants who completed the baseline survey between November 2010 and December 2017. The examinations of each participant were performed within a time window of 3 months. The study has been approved by the institutional medical ethical committee (NL31329.068.10) and the Dutch Minister of Health, Welfare and Sports (Permit 131088-105234-PG). All participants gave written informed consent. Data are available from The Maastricht Study for any researcher who meets the criteria for access to confidential data, and the corresponding author may be contacted to request data.
Retinal microvascular function
We quantified retinal microvascular function by retinal microvascular calibers (CRAE and CRVE) and flicker light-induced retinal dilation. Protocols of these measurements have been described previously (Li et al., Reference Li, Schram, Sorensen, Agtmaal, Berendschot, Webers and Houben2020).
Retinal microvascular calibers
Fundus photography was performed using an auto-focus, shot and tracker 45° camera (Model AFC-230; Nidek) in an optic disc-centered field of view, as described previously (Li et al., Reference Li, Schram, Sorensen, Agtmaal, Berendschot, Webers and Houben2020). The six largest arterioles and venules passing through an area one-half to one disc diameter from the optic margin were measured and summarized as CRAE and CRVE using RHINO software (Eindhoven University of Technology, Eindhoven, the Netherlands) (Li et al., Reference Li, Schram, Sorensen, Agtmaal, Berendschot, Webers and Houben2020). Calibers were obtained in both eyes from 2013 onward; data on both eyes were available in 53.8% out of the 7689 participants. When data on two eyes were available, we used the average of CRAE and CRVE of both eyes.
Flicker light-induced retinal dilation
We measured retinal arteriolar and venular dilation to flicker light exposure by the Dynamic Vessel Analyzer (Imedos, Jena, Germany), as described previously (Li et al., Reference Li, Schram, Sorensen, Agtmaal, Berendschot, Webers and Houben2020). Investigation of the left or right eye was randomly chosen. A 50 s baseline recording was followed by 40 s flicker light exposure and a subsequent 60 s recovery period. We calculated baseline diameters (in measurement units) as the average diameter during the 20–50 s recording. We calculated absolute arteriolar and venular dilation over baseline using the maximal dilation achieved at time points of 10 and 40 s during the flicker stimulation period, as done previously (van der Heide et al., Reference van der Heide, Eussen, Houben, Henry, Kroon, van der Kallen and Stehouwer2023).
Clinically relevant depressive symptoms
Depressive symptoms were assessed at baseline and annually during follow-up using the 9-item Patient Health Questionnaire (PHQ-9) (Kroenke, Spitzer, & Williams, Reference Kroenke, Spitzer and Williams2001). The PHQ-9 is a self-administered questionnaire and is based on the Diagnostic and Statistical Manual of Mental Disorders 4th edition criteria for a major depressive episode. Each item is scored from 0 to 3, with a higher score representing more depressive symptoms. Clinically relevant depressive symptoms were defined as a predefined PHQ-9 cut-off score of ⩾10 (Kroenke et al., Reference Kroenke, Spitzer and Williams2001). Current or lifetime major depression diagnosis was assessed solely at baseline using the Mini-International Neuropsychiatric Interview (Sheehan et al., Reference Sheehan, Lecrubier, Sheehan, Amorim, Janavs, Weiller and Dunbar1998). Online Supplementary Methods S1 provides a detailed definition of major depression.
Covariates
Covariates were assessed at the baseline examination. We assessed education level, smoking, alcohol use, dietary habits (Looman et al., Reference Looman, Feskens, de Rijk, Meijboom, Biesbroek, Temme and Geelen2017; van der Heide et al., Reference van der Heide, Steens, Geraets, Foreman, Henry, Kroon and Stehouwer2021), and prior cardiovascular disease (CVD) by questionnaire. Physical activity was assessed by questionnaire and by accelerometry (Schram et al., Reference Schram, Sep, van der Kallen, Dagnelie, Koster, Schaper and Stehouwer2014). Glucose metabolism status, blood pressure, body mass index, waist circumference, lipid levels, and markers of low-grade inflammation were measured using standardized methods (Schram et al., Reference Schram, Sep, van der Kallen, Dagnelie, Koster, Schaper and Stehouwer2014). Online Supplementary Methods S2 provides further definitions of covariates.
Statistical analysis
All analyses were done on individuals free of clinically relevant depressive symptoms at baseline (baseline PHQ-9 score <10). We excluded individuals with clinically relevant depressive symptoms at baseline to limit the possibility of reverse causation (VanderWeele, Reference VanderWeele2021; VanderWeele, Jackson, & Li, Reference VanderWeele, Jackson and Li2016). We evaluated the association between retinal microvascular function, as measured by CRAE and CRVE and flicker light-induced retinal dilation, with incidence and trajectories of clinically relevant depressive symptoms. Prior studies have reported that both larger (Heringa et al., Reference Heringa, Bouvy, van den Berg, Moll, Kappelle and Biessels2013; McGeechan et al., Reference McGeechan, Liew, Macaskill, Irwig, Klein, Klein and Wong2009; McGrory et al., Reference McGrory, Cameron, Pellegrini, Warren, Doubal, Deary and MacGillivray2017) and smaller (Heringa et al., Reference Heringa, Bouvy, van den Berg, Moll, Kappelle and Biessels2013; McGeechan et al., Reference McGeechan, Liew, Macaskill, Irwig, Klein, Klein and Wong2009; McGrory et al., Reference McGrory, Cameron, Pellegrini, Warren, Doubal, Deary and MacGillivray2017) CRAE are associated with higher prevalence of features of cerebral small vessel disease and higher dementia risk. We therefore did not inverse CRAE values. CRAE and CRVE were expressed per standard deviation (s.d.). We inversed flicker light-induced retinal arteriolar and venular dilation so that higher values indicate worse microvascular function. We calculated a composite score for the flicker light-induced retinal arteriolar and venular dilation, as done previously (van der Heide et al., Reference van der Heide, Eussen, Houben, Henry, Kroon, van der Kallen and Stehouwer2023). The composite score was calculated as the standardized average of the z-scores of flicker light-induced retinal arteriolar and venular dilations.
To calculate trajectories of clinically relevant depressive symptoms, we used a group-based trajectory modeling approach, which is based on finite mixture modeling (i.e. latent class growth modeling). This analysis was done with Stata software version 17 (StataCorp) using the traj-command (Jones & Nagin, Reference Jones and Nagin2013). An example of the code used is provided in online Supplementary Methods S3. This analysis aims to capture the heterogeneity in the population by identifying subgroups with comparable presence of clinically relevant depressive symptoms over time. Individuals are allocated to one trajectory based on their highest posterior probability (Nagin & Odgers, Reference Nagin and Odgers2010). We estimated the number of distinct trajectories based on model fit statistics (Bayesian information criterion and average posterior probabilities) and clinical interpretation while maintaining ⩾100 participants in each trajectory (Nagin & Odgers, Reference Nagin and Odgers2010).
We used Cox regression with time-in-study as the time scale to estimate hazard ratios (HRs) and 95% confidence intervals (95% CIs) for the association between a larger CRAE and CRVE and a lower flicker light-induced retinal dilation composite score with incident clinically relevant depressive symptoms. Follow-up time was calculated from baseline (2010–2017) to incidence of clinically relevant depressive symptoms or time of the last examination, whichever came first. The proportional hazard assumption was assessed using Schoenfeld's test. In addition, we used multinomial logistic regression to estimate odds ratios (ORs) and 95% CIs for the association between a larger CRAE and CRVE and a lower flicker light-induced retinal dilation composite score with probability of belonging to one of the trajectories of clinically relevant depressive symptoms. All analyses were adjusted for the following potential confounders: age, sex, education, and glucose metabolism status (model 1), and for body mass index, smoking, alcohol use, total-to-high-density lipoprotein cholesterol ratio, lipid-modifying medication use, dietary habits, and moderate-to-vigorous physical activity (model 2), and for prior CVD, systolic blood pressure, and antihypertensive medication use (model 3), and for baseline PHQ-9 scores (model 4) (Empana et al., Reference Empana, Boutouyrie, Lemogne, Jouven and van Sloten2021; Vaccarino et al., Reference Vaccarino, Badimon, Bremner, Cenko, Cubedo, Dorobantu and Reviewers2020). Conclusions were based on model 4.
We imputed data on covariates using multiple imputation by chained equations under the assumption that data were missing at random (Heymans & Eekhout, Reference Heymans and Eekhout2019). We used predictive mean matching to impute 20 datasets with each 10 iterations. We pooled results across all imputed datasets using the Rubin's rule (Heymans & Eekhout, Reference Heymans and Eekhout2019).
We did several additional analyses. First, we tested interaction with age, sex, glucose metabolism status, or systolic blood pressure (Stehouwer, Reference Stehouwer2018). Second, we repeated the analysis with the individual flicker light-induced retinal arteriolar and venular dilation. Third, analyses were repeated after excluding individuals who had a major depression diagnosis at baseline (i.e. individuals without clinically relevant depressive symptoms can have a major depression diagnosis, online Supplementary Methods S1), used antidepressant medication at baseline, or had a lifetime history of depression. Fourth, we adjusted for income instead of education, for mean 24 h instead of office systolic blood pressure, for waist circumference instead of body mass index, and for moderate-to-vigorous physical activity assessed by accelerometry instead of by questionnaire. Fifth, we additionally adjusted for markers of low-grade inflammation. We did not adjust for low-grade inflammation in the main analysis, because low-grade inflammation may act as a confounder, antecedent, or mediator (Aizenstein et al., Reference Aizenstein, Baskys, Boldrini, Butters, Diniz, Jaiswal and Tene2016). Sixth, we repeated the analysis with flicker light-induced retinal arteriolar and venular dilation expressed as percentage dilation over baseline based on the average dilation achieved at time points of 10 and 40 s to account for interindividual variation in the curve shape during dilation (Li et al., Reference Li, Schram, Sorensen, Agtmaal, Berendschot, Webers and Houben2020). Seventh, we mutually adjusted for CRVE and CRAE, to explore if associations of CRAE and CRVE are linked. Eighth, we conducted a complete case analysis without imputation for covariates. Finally, to explore if retinal microvascular function mediates the association between prior CVD and incident clinically relevant depressive symptoms (if any), we evaluated the association between prior CVD and incident clinically relevant depressive symptoms with and without adjustment for the retinal microvascular measures.
Results
Online Supplementary Fig. S1 shows the flowchart for the derivation of the study population. The study population included 5952 individuals free of clinically relevant depressive symptoms at baseline who had complete data on CRAE and CRVE and data on depressive symptoms on at least one follow-up examination. Flicker light-induced retinal dilation was available in a subsample of 4744 individuals (online Supplementary Fig. S1). Characteristics of the subpopulation with data on flicker light-induced retinal dilation were comparable with the total study population (online Supplementary Table S1). Mean age of the total study population was 59.9 (s.d.: 8.5) years and 49.7% were women (Table 1). The individuals excluded due to missing data (n = 1408) or clinically relevant depressive symptoms at baseline (n = 292) were less educated and had a worse cardiovascular risk profile compared to those included (online Supplementary Table S2).
Characteristics of the total study population on retinal microvascular calibers, and according to incidence and trajectories of clinically relevant depressive symptoms

Data are means (s.d.) or median (interquartile range).
CVD, cardiovascular disease; HDL, high-density lipoprotein; PHQ-9, 9-item Patient Health Questionnaire; CRAE, central retinal arteriolar equivalent or caliber; CRVE, central retinal venular equivalent or caliber.
a Clinically relevant depressive symptoms were defined as a PHQ-9 score of ⩾10.
b Trajectories of clinically relevant depressive symptoms are defined in Fig. 2.
c Data available in n = 5879.
d Data available in n = 5915.
e Data available in n = 5709.
f Data available in n = 5332.
g Data available in n = 5945.
h Data available in n = 5894.
i Data available in n = 5983.
j Data available in n = 5950.
k Data available in n = 5949.
l Data available in n = 5948.
Incident clinically relevant depressive symptoms
During a median follow-up of 7.0 (range: 1.0–11.0) years, 806 (13.5%) individuals had incident clinically relevant depressive symptoms on at least one of the follow-up examinations. Results of the Cox regression showed that one s.d. larger CRAE (19.7 μm) and one s.d. larger CRVE (30.1 μm) were each associated with a lower risk of clinically relevant depressive symptoms (HR: 0.89 [95% CI 0.83–0.96] and 0.93 [0.86–0.99], respectively) (Fig. 1). In addition, one s.d. lower flicker light-induced retinal dilation composite score was associated with a higher risk of clinically relevant depressive symptoms (HR: 1.10 [1.01–1.20]) (Fig. 1).
Association between CRAE, CRVE, and the composite score of flicker light-induced retinal dilation and incident clinically relevant depressive symptoms (PHQ-9 score ⩾10). Results are reported for CRAE and CRVE expressed per one larger s.d. and for the composite score of flicker light-induced retinal dilation per one lower s.d. Model 1 adjusted for age, sex, education, and glucose metabolism status. Model 2 additionally adjusted for body mass index, smoking, alcohol use, total/HDL ratio, lipid-modifying medication use, dietary habits, and moderate-to-vigorous physical activity. Model 3 additionally adjusted for prior CVD, systolic blood pressure, and antihypertensive medication use. Model 4 additionally adjusted for baseline PHQ-9 score. CRAE, central retinal arteriolar equivalent or caliber; CRVE, central retinal venular equivalent or caliber; s.d., standard deviation; PHQ-9, 9-item Patient Health Questionnaire; HDL, high-density lipoprotein; CVD, cardiovascular disease.

Trajectories of clinically relevant depressive symptoms
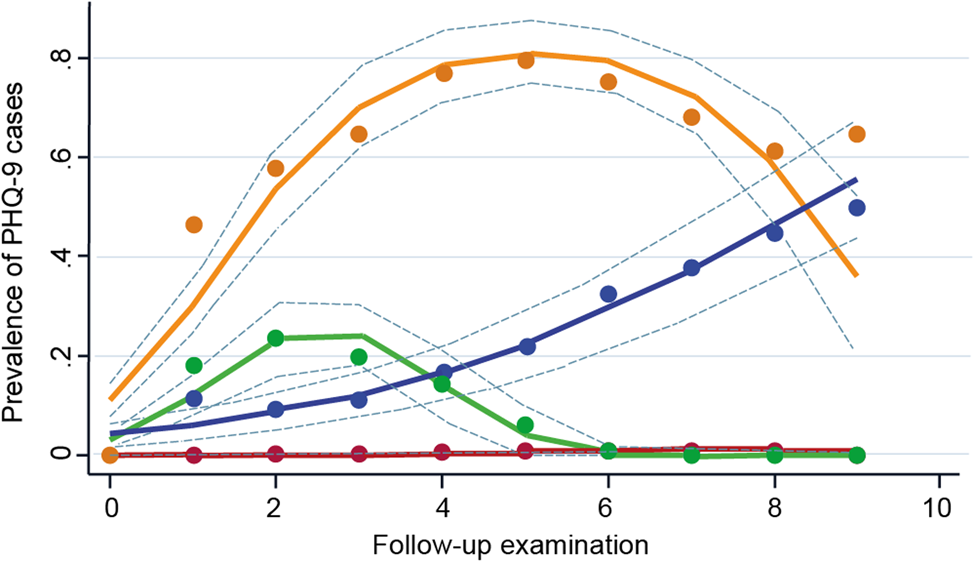
We identified four trajectories defined by the presence of clinically relevant depressive symptoms (Fig. 2): (1) maintaining a low prevalence throughout the follow-up (low trajectory, n = 5225 [87.8%]); (2) increasing prevalence, then a chronic high prevalence (early-chronic trajectory, n = 157 [2.6%]); (3) a low prevalence, then increasing (late-increasing trajectory, n = 247 [4.2%]); and (4) increasing prevalence, then remitting (remitting trajectory, n = 323 [5.4%]). Online Supplementary Fig. S2 shows the median PHQ-9 scores by wave and online Supplementary Table S3 shows the fit statistics for the model selection and the polynomial used for each trajectory. The model we selected used a first-order polynomial for the late-increasing trajectory and second-order polynomials for the other three trajectories, i.e. the low trajectory, the early-chronic trajectory, and the remitting trajectory (online Supplementary Table S3). The baseline characteristics according to the trajectories are shown in Table 1 and online Supplementary Table S2. Results of the multinomial regression showed that, using the low trajectory as the reference, one s.d. larger CRAE was associated with a lower odds of belonging to the early-chronic trajectory (OR: 0.83 [0.69–0.99]), but not with any of the other trajectories (Table 2). CRVE was not associated with any of the trajectories (Table 2). One s.d. lower flicker light-induced retinal dilation composite score was associated with a higher odds of belonging to the remitting trajectory (OR: 1.23 [1.07–1.43]), but not with any of the other trajectories (Table 2).
Trajectories of clinically relevant depressive symptoms (PHQ-9 score ⩾10). The four trajectories are characterized by: (1) maintaining a low prevalence of clinically relevant depressive symptoms throughout the follow-up (low, purple, n = 5225 [87.8%]); (2) increasing prevalence of clinically relevant depressive symptoms and then maintaining a high prevalence (early-chronic, orange, n = 157 [2.6%]); (3) a low prevalence of clinically relevant depressive symptoms and then increasing (late-increasing, blue, n = 247 [4.2%]); and (4) increasing pattern of clinically relevant depressive symptoms then remitting (remitting, green, n = 323 [5.4%]). Dashed lines are 95% CIs on the estimated trajectories. PHQ-9, 9-item Patient Health Questionnaire.
Association between CRAE and CRVE and the composite score of flicker light-induced retinal dilation and trajectories of clinically relevant depressive symptomsa (PHQ-9 score ⩾10)

Results are reported for CRAE and CRVE expressed per one larger s.d. and for the composite score of flicker light-induced retinal dilation per one lower s.d. Model 1 adjusted for age, sex, education, and glucose metabolism status. Model 2 additionally adjusted for body mass index, smoking, alcohol use, total/HDL ratio, lipid-modifying medication use, dietary habits, and moderate-to-vigorous physical activity. Model 3 additionally adjusted for prior CVD, systolic blood pressure, and antihypertensive medication use. Model 4 additionally adjusted for baseline PHQ-9 score.
CRAE, central retinal arteriolar equivalent or caliber; CRVE, central retinal venular equivalent or caliber; s.d., standard deviation; PHQ-9, 9-item Patient Health Questionnaire; HDL, high-density lipoprotein; CVD, cardiovascular disease.
a Graphical representation of trajectories of clinically relevant depressive symptoms is shown in Fig. 2.
Additional analyses
There were no consistent interactions with age, sex, glucose metabolism status, or systolic blood pressure (online Supplementary Tables S4 and S5). Of the individual arteriolar and venular flicker light-induced dilation measures, a lower arteriolar dilation, but not venular dilation, was associated with a higher risk of clinically depressive symptoms and a higher odds of belonging to the remitting trajectory (online Supplementary Fig. S3 and Table S6). All other additional analyses provided results similar to those obtained in the main analysis (online Supplementary Tables S7 and S8). We did not observe mediating effects by the retinal microvascular measures of the association between prior CVD and incident clinically relevant depressive symptoms (online Supplementary Table S9).
Discussion
In this study, a larger CRAE and a larger CRVE were each associated with a lower risk of clinically relevant depressive symptoms, while a lower flicker light-induced retinal dilation was associated with a higher risk of clinically relevant depressive symptoms. The trajectory analyses showed that a larger CRAE was associated with a lower odds of belonging to the early-chronic trajectory, and a lower flicker light-induced retinal dilation with a higher odds of belonging to the remitting trajectory.
Three population-based studies (Geraets et al., Reference Geraets, van Agtmaal, Stehouwer, Sorensen, Berendschot, Webers and Houben2020; Ikram et al., Reference Ikram, Luijendijk, Hofman, de Jong, Breteler, Vingerling and Tiemeier2010; van Gennip et al., Reference van Gennip, Sedaghat, Carnethon, Allen, Klein, Cotch and van Sloten2022) have evaluated the association between retinal microvascular function and incident clinically relevant depressive symptoms. Data on the association between CRAE and CRVE and incident clinically relevant depressive symptoms have been inconsistent. The Multi-Ethnic Study of Atherosclerosis (MESA) found that a larger CRVE, but not CRAE, was associated with a higher risk of clinically relevant depressive symptoms (van Gennip et al., Reference van Gennip, Sedaghat, Carnethon, Allen, Klein, Cotch and van Sloten2022), whereas The Rotterdam Study found that CRAE and CRVE were not associated with incident clinically relevant depressive symptoms (Ikram et al., Reference Ikram, Luijendijk, Hofman, de Jong, Breteler, Vingerling and Tiemeier2010). Our current findings are supported by results of an early analysis on flicker light-induced retinal dilation from The Maastricht Study (Geraets et al., Reference Geraets, van Agtmaal, Stehouwer, Sorensen, Berendschot, Webers and Houben2020) in a restricted sample (N = 1865) with a maximum follow-up of 4 years. In that analysis, a lower flicker light-induced retinal arteriolar dilation was associated with a higher risk of clinically relevant depressive symptoms, whereas a lower flicker light-induced venular dilation was not (Geraets et al., Reference Geraets, van Agtmaal, Stehouwer, Sorensen, Berendschot, Webers and Houben2020). We extend these previous studies as the present study had a larger number of follow-up examinations (nine follow-up examinations v. three in MESA, van Gennip et al., Reference van Gennip, Sedaghat, Carnethon, Allen, Klein, Cotch and van Sloten2022; two in The Rotterdam Study, Ikram et al., Reference Ikram, Luijendijk, Hofman, de Jong, Breteler, Vingerling and Tiemeier2010; and four in the previous Maastricht Study analysis, Geraets et al., Reference Geraets, van Agtmaal, Stehouwer, Sorensen, Berendschot, Webers and Houben2020) and a larger sample size (n = 5952 v. n = 4336 in MESA, van Gennip et al., Reference van Gennip, Sedaghat, Carnethon, Allen, Klein, Cotch and van Sloten2022; n = 3605 in The Rotterdam Study, Ikram et al., Reference Ikram, Luijendijk, Hofman, de Jong, Breteler, Vingerling and Tiemeier2010; and n = 1865 in the previous Maastricht Study analysis, Geraets et al., Reference Geraets, van Agtmaal, Stehouwer, Sorensen, Berendschot, Webers and Houben2020) which allowed us to evaluate not only incidence but also trajectories of clinically relevant depressive symptoms.
The associations of larger CRAE and CRVE and lower flicker light-induced retinal dilation with risk of clinically depressive symptoms are consistent with the vascular depression hypothesis (Aizenstein et al., Reference Aizenstein, Baskys, Boldrini, Butters, Diniz, Jaiswal and Tene2016). In general, the interpretation of CRAE and CRVE is complex, because both larger and smaller CRAE or CRVE may reflect microvascular dysfunction. Changes in CRAE and CRVE might represent a dynamic process, and the interpretation might differ according to different stages of microvascular dysfunction (McGrory et al., Reference McGrory, Cameron, Pellegrini, Warren, Doubal, Deary and MacGillivray2017). Widening of calibers might reflect early-stage microvascular dysfunction resulting from impaired autoregulation (Gardiner, Archer, Curtis, & Stitt, Reference Gardiner, Archer, Curtis and Stitt2007), while narrowing of calibers might reflect late-stage microvascular dysfunction resulting from microvascular remodeling (McGrory et al., Reference McGrory, Cameron, Pellegrini, Warren, Doubal, Deary and MacGillivray2017). In contrast to MESA (van Gennip et al., Reference van Gennip, Sedaghat, Carnethon, Allen, Klein, Cotch and van Sloten2022), in which larger CRVE was found to be associated with a higher risk of clinically relevant depressive symptoms, we found that larger CRVE was associated with a lower risk of clinically relevant depressive symptoms. These contrasting findings might be explained by different study populations. Participants in the present study had a more adverse cardiometabolic profile (e.g. prevalence of type 2 diabetes was 22.4% in our study [by design] v. 13.7% in MESA; and prior CVD was 16.3% in our study v. 0% [by design] in MESA). This worse cardiometabolic profile may be accompanied by a more advanced stage of microvascular dysfunction. Another explanation might be that a larger CRVE is associated with a lower risk of clinically relevant depressive symptoms because of confounding effects of CRAE. Venular dilatation might be a consequence of arteriolar dilatation possibly due to higher transmission of blood pressure (Gardiner et al., Reference Gardiner, Archer, Curtis and Stitt2007). In accordance, when we additionally adjusted the associations of CRVE for CRAE, the associations attenuated. However, the finding of this additional analysis needs to be interpreted with caution, because we cannot exclude the effects of multicollinearity between CRAE and CRVE (correlation between CRAE and CRVE in our study was 0.74) (Vatcheva, Lee, McCormick, & Rahbar, Reference Vatcheva, Lee, McCormick and Rahbar2016). A lower retinal dilation after flicker light exposure is thought to reflect impaired neurovascular coupling, a mechanism that can rapidly increase blood flow to activated regions (Empana et al., Reference Empana, Boutouyrie, Lemogne, Jouven and van Sloten2021). Impaired neurovascular coupling can result in perfusion deficits, which may contribute to clinically relevant depressive symptoms (Empana et al., Reference Empana, Boutouyrie, Lemogne, Jouven and van Sloten2021).
The trajectory analyses suggest that CRAE may correlate more closely with a chronic disease course, whereas altered flicker light-induced retinal dilation may correlate with clinically relevant depressive symptoms that can remit over time. Possibly, arteriolar narrowing may reflect more structural and less reversible changes in the retinal microvasculature (Houben, Martens, & Stehouwer, Reference Houben, Martens and Stehouwer2017), and CRAE may, thus, correlate more closely with a chronic disease course. In contrast, altered flicker light-induced retinal dilation may reflect a more functional and easily reversible change (Houben et al., Reference Houben, Martens and Stehouwer2017), and, thus, correlate with clinically relevant depressive symptoms that can remit over time. However, this study is the first to investigate the association of microvascular dysfunction with trajectories of clinically relevant depressive symptoms, and this issue requires further study.
From a clinical point of view, this study suggests that cerebral microvascular dysfunction could be a target for prevention, treatment, and prediction of depression. Evidence suggests that both lifestyle modifications, such as weight loss and physical activity, and drugs, such as phosphodiesterase-3 inhibitors (cilostazol), nitric oxide donors (isosorbide mononitrate), and some antihyperglycemic agents (metformin and glucagon-like peptide-1 receptor agonist), may improve microvascular function and have antidepressant effects (Empana et al., Reference Empana, Boutouyrie, Lemogne, Jouven and van Sloten2021). Furthermore, retinal microvascular measures might help to identify individuals who will most likely benefit from targeted prevention for depression.
Depressive symptoms frequently co-occur with other cerebral syndromes or diseases, including dementia, cognitive dysfunction (Empana et al., Reference Empana, Boutouyrie, Lemogne, Jouven and van Sloten2021), and other mental illness, such as anxiety (Tanaka & Chen, Reference Tanaka and Chen2023). It has been suggested that this link may be explained partially by microvascular dysfunction as a common underlying cause (Empana et al., Reference Empana, Boutouyrie, Lemogne, Jouven and van Sloten2021; Mirza et al., Reference Mirza, Wolters, Swanson, Koudstaal, Hofman, Tiemeier and Ikram2016; Singh-Manoux et al., Reference Singh-Manoux, Dugravot, Fournier, Abell, Ebmeier, Kivimaki and Sabia2017). This hypothesis is supported by our current findings and by findings of The Rotterdam Study showing that changes in retinal microvascular calibers (i.e. larger CRVE, but not CRAE) were associated with a higher risk of dementia (de Jong et al., Reference de Jong, Schrijvers, Ikram, Koudstaal, de Jong, Hofman and Breteler2011). In contrast, The Atherosclerosis Risk in Communities study found that CRAE and CRVE were not associated with cognitive decline (Lesage et al., Reference Lesage, Mosley, Wong, Szklo, Knopman, Catellier and Sharrett2009). The association of retinal microvascular function with anxiety has not yet been investigated.
This study has several limitations. First, depressive symptoms were assessed by questionnaire, and antidepressant medication use was assessed solely at baseline. In addition, we did not analyze depressive symptoms on a continuous scale, which may have reduced our statistical power. Second, the study population consisted mostly of White individuals, and the results may therefore not generalize to other ethnic groups. The results of our trajectory analysis need to be interpreted in light of its own limitations. First, a limitation of trajectory analysis involves the complexity and flexibility of its data-driven models (Twisk & Hoekstra, Reference Twisk and Hoekstra2012). The number of trajectories and their characteristics are influenced by statistical procedure used for the trajectory selection (Twisk & Hoekstra, Reference Twisk and Hoekstra2012), the study population and the number of follow-up examinations (Nagin & Tremblay, Reference Nagin and Tremblay2001). Therefore, our results on trajectories of clinically relevant depressive symptoms require replication in other cohorts. Second, it is important to acknowledge that trajectory allocation based on posterior probabilities may lead to uncertainty in the trajectory assignment. Third, latent class growth modeling (i.e. group-based trajectory modeling) defines trajectories under the assumption that there is no variation within trajectories (Herle et al., Reference Herle, Micali, Abdulkadir, Loos, Bryant-Waugh, Hubel and De Stavola2020). Latent class growth mixture modeling is an extension of latent class growth modeling that may lead to a better model fit because it allows individuals to differ in trajectory within groups. However, this approach is more complex and sometimes leads to models that do not converge (Twisk & Hoekstra, Reference Twisk and Hoekstra2012). Future research is required to investigate which approach performs best.
In conclusion, larger CRAE and larger CRVE were each associated with a lower risk of clinically relevant depressive symptoms, and a larger CRAE with a lower odds of belonging to the early-chronic trajectory. Furthermore, a lower flicker light-induced retinal dilation was associated with a higher risk of clinically relevant depressive symptoms and a higher odds of belonging to the remitting trajectory. These findings support the hypothesis that cerebral microvascular dysfunction contributes to the development of depressive symptoms. In addition, these findings suggest that CRAE may correlate more closely with a chronic disease course, whereas altered flicker light-induced retinal dilation may correlate with clinically relevant depressive symptoms that can remit over time.
Supplementary material
The supplementary material for this article can be found at https://doi.org/10.1017/S0033291724000618.
Funding statement
The Maastricht Study was supported by the European Regional Development Fund via OP-Zuid (31O.041), the Province of Limburg, the Dutch Ministry of Economic Affairs (31O.041), Stichting De Weijerhorst, the Pearl String Initiative Diabetes, CVC Maastricht, Imedos Health GmbH, CARIM Maastricht, CAPHRI Maastricht, NUTRIM Maastricht, Stichting Annadal, Health Foundation Limburg, Netherlands Organization for Health Research and Development (ZonMW), Netherlands Consortium of Dementia Cohorts, and the Memorabel program. In addition, this work was supported by the Netherlands Organization for Health Research and Development (ZonMW) Veni research grant (TVS, grant number 916.19.074), a Diabetes Fonds Junior Fellowship grant (TVS grant number 2021.81.004), and by a Dutch Heart Foundation research grant (AVG, TVS grant number 2018T025).
Competing interests
None.
Ethical standards
The authors assert that all procedures contributing to this work comply with the ethical standards of the relevant national and institutional committees on human experimentation and with the Helsinki Declaration of 1975, as revised in 2008. All procedures involving human subjects were approved by the institutional medical ethical committee (NL31329.068.10) and the Minister of Health, Welfare, and Sports of the Netherlands (Permit 131088-105234-PG).


 Open access