


Introduction
Anxiety and related disorders are common and follow a chronic course if left untreated (Bandelow and Michaelis, Reference Bandelow and Michaelis2015). Individuals experience significant functional impairment, reductions in quality of life, and are frequent utilizers of healthcare services (Horenstein and Heimberg, Reference Horenstein and Heimberg2020; Kessler and Greenberg, Reference Kessler, Greenberg, Davis, Charney, Cole and Nemeroff2002; Laynard et al., Reference Laynard, Clark, Knapp and Mayraz2007). Cognitive behavioural therapy (CBT) is a well-established first-line treatment for anxiety and related disorders. Meta-analyses have demonstrated the efficacy of CBT (Carpenter et al., Reference Carpenter, Andrews, Witcraft, Powers, Smits and Hofmann2018; Hofmann and Smits, Reference Hofmann and Smits2008). CBT results in significant symptom improvement over the course of therapy for generalized anxiety disorder (GAD; Cuijpers et al., Reference Cuijpers, Sijbrandij, Koole, Huibers, Berking and Andersson2014), social anxiety disorder (SAD; Mayo-Wilson et al., Reference Mayo-Wilson, Dias, Mavranezouli, Kew, Clark, Ades and Pilling2014), and post-traumatic stress disorder (PTSD; Bisson et al., Reference Bisson, Roberts, Andrew, Cooper and Lewis2013).
Meta-analyses also suggest reasonable maintenance of gains over the 12 months following treatment with relapse rates ranging from 0% (van Dis et al., Reference van Dis, van Veen, Hagenaars, Batelaan, Bockting, van den Heuvel, Cuijpers and Engelhard2020) to 23.8% (Lorimer et al., Reference Lorimer, Kellett, Nye and Delgadillo2021) across studies. This variability in relapse rates may be due to different rates across anxiety and related disorders; another recent meta-analysis found that relapse rates for PTSD (10%), obsessive compulsive disorder (17%), and GAD (18%) were higher compared with other anxiety disorders including specific phobia (4%) and panic disorder (PD) with or without agoraphobia (5%) (Levy et al., Reference Levy, O’Bryan and Tolin2021). However, studies included in these meta-analyses are limited in number (only six of the 69 included studies in van Dis et al. (Reference van Dis, van Veen, Hagenaars, Batelaan, Bockting, van den Heuvel, Cuijpers and Engelhard2020) reported relapse rates between 3 and 12 months following treatment) and length of follow-up period (few studies have follow-up durations beyond 12 months; Levy et al., Reference Levy, O’Bryan and Tolin2021). This aligns with findings that follow-up periods in randomized controlled trials are, on average, 5.55 months (Carpenter et al., Reference Carpenter, Andrews, Witcraft, Powers, Smits and Hofmann2018). This highlights two key limitations of the existing literature: (1) limited studies are specifically designed to investigate long-term outcomes, and (2) follow-up periods in treatment outcome studies are typically short in duration. Taken together, this underscores the need for additional research incorporating extended follow-up periods to better understand the durability of treatment gains.
It is also important to further elucidate factors associated with changes in outcomes over time, to better understand which individuals may be at risk for a return of significant symptoms following treatment. Individuals with anxiety and related disorders commonly experience co-morbid depressive symptoms (Gorman, Reference Gorman1996). Those with co-morbid depression have been shown to exhibit more severe and persistent symptom profiles over time compared with those with an anxiety disorder in the absence of depression (Durham et al., Reference Durham, Higgins, Chambers, Swan and Dow2012). Furthermore, symptoms of depression may increase the risk of symptom return following treatment completion for anxiety and related disorders (Ali et al., Reference Ali, Rhodes, Moreea, McMillan, Gilbody, Leach, Lucock, Lutz and Delgadillo2017; Lorimer et al., Reference Lorimer, Kellett, Nye and Delgadillo2021; Palacios et al., Reference Palacios, Enrique, Mooney, Farraell, Earley, Duffy, Eilert, Harty, Timulak and Richards2022). Thus, investigating the predictive ability of co-morbid symptoms of depression on long-term outcomes is a potent target.
Investigating whether individuals sustain improvements or experience a significant return of symptoms, particularly in the years following treatment, is imperative for informing enhancements to discharge planning and relapse prevention. Doing so for those receiving CBT in a naturalistic setting will help improve generalizability and inform considerations related to whether patients outside of rigorously controlled studies can be retained in long-term follow-up. As such, our understanding of what occurs in the years following CBT for anxiety and related disorders in naturalistic settings remains largely unclear and represents an important area of investigation.
The present study sought to investigate symptom change occurring pre- to post-treatment and over a 2-year period following disorder-specific CBT for anxiety and related disorders in a naturalistic treatment seeking sample, while also documenting rates of attrition during follow-up. More specifically, study aims were twofold:
-
(1) The primary objective was to investigate symptom change over time for GAD, SAD, and PTSD during and after CBT in a naturalistic setting. For all disorders, it was hypothesized that gains observed pre- to post-CBT would generally be maintained across the 2-year follow-up, with a gradual worsening of symptoms observed at later points in the follow-up period.
-
(2) This study aimed to investigate whether symptoms of depression at pre-treatment are associated with changes in risk of symptom return following CBT. For all disorders, it was hypothesized that greater depressive symptoms would be associated with greater symptom severity and predict worsening symptoms across the follow-up period.
Method
Participants
Participants were adults seeking treatment at a specialized anxiety out-patient clinic in Ontario, Canada. All participants received a diagnostic assessment from a trained mental health professional according to the 5th edition of the Diagnostic and Statistical Manual of Mental Disorders (DSM-5; American Psychiatric Association, 2013). Participants either received a diagnostic assessment using the Diagnostic Assessment Research Tool (DART; McCabe et al., Reference McCabe, Milosevic, Rowa, Shnaider, Pawluk and Antony2017) by a clinical psychologist, social worker, or graduate-level psychology student, or a comprehensive psychiatric consultation by an experienced psychiatrist. Based on their primary diagnosis, participants were referred to 12 weeks of group CBT for either GAD or SAD. Participants receiving a primary diagnosis of PTSD were referred to 12 weeks of group cognitive processing therapy (CPT). Participants were defined as treatment completers, requiring attendance of at least eight of the total 12 sessions and at least one of the final three sessions. Following treatment, participants were contacted at 3, 6, 9, 12, and 24 months to complete self-report questionnaires measuring symptoms associated with their primary diagnosis.
Pre-treatment sample sizes were: GAD (n = 381), SAD (n = 317), and PTSD (n = 304). At post-treatment the sample sizes were: GAD (n = 150), SAD (n = 142), and PTSD (n = 157). At 1-year follow-up there was a total of 135 participants (GAD = 57; SAD = 34; PTSD = 44). At 2-year follow-up, there was a total of 132 participants (GAD = 62; SAD = 33; PTSD = 37).
Across disorders, the GAD, SAD, and PTSD samples were predominantly female (78.2%, 66.2%, and 79.6%, respectively) with mean ages of 37.9 (GAD), 31.7 (SD = 10.8), and 41.2 years (SD = 11.5), respectively. Further demographic details are reported in Table S3 (Supplementary material).
Procedure
Individuals were referred to the clinic by a healthcare professional and received a diagnostic assessment. Participants meeting diagnostic criteria for GAD completed 12 weeks of group CBT for GAD, participants diagnosed with SAD completed 12 weeks of group for SAD, and participants meeting criteria for PTSD completed 12 weeks of group CPT. While most clients were referred to group following initial assessment, a small proportion entered group after completing a previous CBT group for another form of anxiety. The anxiety clinic where this study was conducted provides time-limited interventions, consistent with evidence on treatment duration (i.e. 12 sessions; Levy et al., Reference Levy, Worden, Davies and Stevens2020; Robinson et al., Reference Robinson, Delgadillo and Kellett2020) and employs group-based treatment to manage demand and access to care. Individuals attended weekly sessions co-facilitated by at least two clinical psychologists, social workers, mental health nurses, or graduate-level clinical psychology students. All groups adhered to manualized treatment protocols developed based on primary sources (GAD: Borkovec and Costello, Reference Borkovec and Costello1993; Craske and Waters, Reference Craske and Waters2005; Dugas et al., Reference Dugas, Buhr, Ladouceur, Heimberg, Turk and Mennin2004; Gyoerkoe and Wiegartz, Reference Gyoerkoe and Wiegartz2006; Heimberg et al., Reference Heimberg, Turk and Mennin2004; SAD: Heimberg and Becker, Reference Heimberg and Becker2002; PTSD: Resick et al., Reference Resick, Monson and Chard2024), and therapists met weekly to discuss group progress and fidelity to the manuals. Participants completed a symptom measure corresponding to their primary diagnosis at pre- and post-treatment, as well as 3-, 6-, 9-, 12-, and 24-month follow-up. Participants in all groups completed the Depression Anxiety Stress Scale (DASS-21; Lovibond and Lovibond, Reference Lovibond and Lovibond1995). This study used data drawn from the anxiety clinic’s clinical database, which is an ongoing system that routinely gathers client outcomes to assess treatment effectiveness and ensure quality of care including sending symptom questionnaires at 3-, 6-, 9-, 12-, and 24-month follow-up. Thus, all individuals receiving group CBT are able to provide data up to 24 months after treatment. Individuals are asked to provide consent for their clinical data to be used in research; those who consented were included in the current study.
Measures
The Diagnostic Assessment and Research Tool (DART; McCabe et al., Reference McCabe, Milosevic, Rowa, Shnaider, Pawluk and Antony2017)
The DART is a semi-structured, modular interview based on DSM-5 diagnostic criteria (American Psychiatric Association, 2013). Each diagnostic module contains criterion-based questions and optional clarifying questions to enhance accuracy. The DART has demonstrated good construct, convergent, and divergent validity (Schneider et al., Reference Schneider, Pawluk, Milosevic, Shnaider, Rowa, Antony, Musielak and McCabe2022).
GAD Group – Penn State Worry Questionnaire Past Week (PSWQ-PW; Stöber and Bittencourt, Reference Stöber and Bittencourt1998)
The PSWQ-PW is a 16-item self-report measure adapted from the Penn State Worry Questionnaire (Meyer et al., Reference Meyer, Miller, Metzger and Borkovec1990). The ‘past week’ version retained all the original items except for item 12 (‘I have been a worrier all of my life’) and changed the items to past tense. Items are rated on a scale from 0 (never) to 6 (almost always). Total scores range from 0 to 90, with higher scores indicating greater worry. The PSWQ-PW displays excellent reliability and convergent validity (Puccinelli et al., Reference Puccinelli, Cameron, Ouellette, McCabe and Rowa2023; Stöber and Bittencourt, Reference Stöber and Bittencourt1998). Excellent internal consistency was observed across the study (α = .92–97).
SAD Group – Social Phobia Inventory (SPIN; Connor et al., Reference Connor, Davidson, Churchill, Sherwood, Weisler and Foa2000)
The SPIN is a 17-item self-report measure evaluating an individual’s fear (e.g. of being criticized or embarrassed), avoidance (e.g. of talking to strangers), and physiological discomfort (e.g. heart palpitations, sweating) in social situations. Items are rated on a scale from 0 (not at all) to 4 (extremely), and total scores range from 0 to 68. Higher scores correspond to greater distress in social situations. The SPIN demonstrates strong reliability and validity for distinguishing social anxiety disorder (Connor et al., Reference Connor, Davidson, Churchill, Sherwood, Weisler and Foa2000; Antony et al., Reference Antony, Coons, McCabe, Ashbaugh and Swinson2006). Good to excellent internal consistency was observed across the study (α = .88–.95).
PTSD Group – Post-traumatic Stress Disorder Checklist for DSM-5 (PCL-5; Blevins et al., Reference Blevins, Weathers, Davis, Witte and Domino2015)
The PCL-5 is a self-report measure of PTSD symptom presence and severity. The scale includes 20 items assessing experiences related to an index trauma over the past month on a scale ranging from 0 (not at all) to 4 (extremely). Total scores range from 0 to 80, with greater scores reflecting greater PTSD symptom severity. The PCL-5 demonstrates strong reliability and validity for detecting PTSD symptoms (Bovin et al., Reference Bovin, Marx, Weathers, Gallagher, Rodriguez, Schnurr and Keane2016). Furthermore, good to excellent internal consistency was observed across the study (α = .90–.97).
The Depression Anxiety Stress Scale (DASS-21; Lovibond and Lovibond, Reference Lovibond and Lovibond1995)
The DASS-21 is a self-report measure assessing distress across three subscales: depression, anxiety, and stress. The scale consists of 21 items, rated on a scale from 0 (did not apply to me at all) to 3 (applied to me very much or most of the time). Higher scores indicate greater symptom severity (Henry and Crawford, Reference Henry and Crawford2005). The DASS-21 has sound psychometric properties with high internal consistency of the subscales and good construct and concurrent validity (Antony et al., Reference Antony, Bieling, Cox, Enns and Swinson1998). The present study utilized the depression subscale across all groups, which demonstrated good to excellent internal consistency for GAD (α = .91), SAD (α = .89), and PTSD (α = .90) at pre-treatment.
Data analysis
All analyses were conducted in R v. 4.5.1 (R Core Team, 2025). We evaluated longitudinal symptom scores using mixed effects models for repeated measures (MMRMs; mmrm package v. 0.3.15; Sabanés Bové et al., Reference Sabanés Bové, Li, Dedić, Kelkhoff, Kunzmann, Lang, Stock, Wang, James, Sidi, Leibovitz, Sjöberg and Krieger2025) fit separately for each disorder group, including categorical time, mean-centered DASS-depression subscale scores at pre-treatment, and the time-by-depression interaction as focal predictors, and sex and age as covariates. These models were fit with restricted maximum likelihood estimation (REML), and to account for the within-subject dependency over time we specified them with an unstructured co-variance matrix. Missing predictor data were handled using multiple imputation by chained equations implemented with the mice package (v. 3.18.0; van Buuren and Groothuis-Oudshoorn, Reference van Buuren and Groothuis-Oudshoorn2011; see Supplementary material for details), while missing outcome data were handled natively via MMRM’s maximum likelihood estimation (Enders, Reference Enders2022). We fit an MMRM specified as above on each imputed dataset utilizing the Kenward–Roger small-sample adjustment for the standard errors and degrees of freedom (Kenward and Roger, Reference Kenward and Roger1997), and results were pooled according to Rubin’s rules (Rubin, Reference Rubin1987) including the Barnard–Rubin degrees of freedom adjustment to account for the statistical uncertainty in the imputation process (Barnard and Rubin, Reference Barnard and Rubin1999). We confirmed the assumptions of normality, homoscedasticity, and linearity of continuous covariates in models fit with the imputed datasets. Multi-collinearity was negligible (VIFs all <2.5), and we performed sensitivity analyses leaving out the subject IDs with the highest mean absolute residuals which showed all of our results were robust to subject-level outliers.
To test the omnibus main effect of time (conditional on mean baseline depression) and time-by-depression interaction effects, we employed a pooled multivariate Wald test (D1 statistic; Li et al., Reference Li, Raghunathan and Rubin1991) based on Kenward–Roger adjusted co-variance matrices and utilizing a Barnard–Rubin adjusted denominator degrees of freedom calculated using the smallest (i.e. most conservative) Kenward–Roger degrees of freedom among the tested terms. To assess our a priori research aims of maintenance of treatment gains and potential return of symptoms to pre-treatment level, we pre-specified two sets of contrasts of estimated marginal means utilizing the emmeans package (v. 1.11.1; Lenth, Reference Lenth2025), first comparing symptoms at post-treatment to each follow-up measurement, and second comparing symptoms at pre-treatment to post- and each follow-up measurement, all while holding depression to its mean. We additionally calculated difference-in-difference (DiD) contrasts to assess the time-by-depression interaction, specifically by comparing four time transitions (pre → post, post → 6 months, post → 1 year, and post → 2 year) between individuals with high vs low baseline depression (defined as mean baseline depression ± 1SD), representing moderating effects in the treatment response, and short-, medium-, and long-term maintenance. All contrasts were pooled as above according to Rubin’s rules and using Kenward–Roger adjusted co-variance matrices. Degrees of freedom were calculated using the Barnard–Rubin adjustment which was derived from contrast-specific Kenward–Roger estimates. Cohen’s d values were calculated using the standard deviation at baseline as the reference. We report multivariate t-distribution (MVT) multiplicity-adjusted p-values and 95% confidence intervals to control the familywise error rate for each contrast family (Hothorn et al., Reference Hothorn, Bretz and Westfall2008). Contrast estimates and their confidence intervals (CIs) were compared with a pre-determined threshold for a minimum clinically important difference (MCID = 0.5SD of the outcome at baseline; Norman et al., Reference Norman, Sloan and Wyrwich2003), and a threshold for ‘large’ effects (0.8SD; Cohen, Reference Cohen1988) in order to assess whether effects may be clinically meaningful and whether non-significant estimates can rule out potentially meaningful effects, and establish formal equivalence. Furthermore, we calculated retrospective power for these pre-defined effect sizes (not our observed effect sizes to avoid the mathematical circularity of observed power; Hoenig and Heisey, Reference Hoenig and Heisey2001), as well as minimum detectable effect sizes (MDEs) at 80% power for the post-vs-later and DiD contrasts as an analysis of our ability to detect relevant effects given our current sample and level of attrition.
To assess the potential impact of attrition and therefore plausible departures from our assumption of outcome data being missing-at-random (MAR), we performed a delta-adjusted pattern mixture model sensitivity analysis (Ratitch et al., Reference Ratitch, O’Kelly and Tosiello2013). This involved applying a series of worsening penalties (deltas) to individuals’ multiply imputed outcome data, representing increasingly severe missing-not-at-random (MNAR) scenarios (i.e. increasing symptoms). See Supplementary material for additional details.
Results
From post-treatment to the 2-year follow-up, 58.7% attrition was observed for GAD, 76.8% for SAD, and 70.6% for PTSD (see Table S1 in the Supplementary material). The hospital clinic where this study was completed also provides treatments for panic disorder/agoraphobia, and obsessive-compulsive disorder, but attrition was too significant across the follow-up to make reasonably confident conclusions. For all participants, there was a significant reduction in PSWQ-PW (d = 1.26, 95% CI [1.04, 1.48]), SPIN (d = 1.23, 95% CI [1.00, 1.46]), and PCL-5 (d = 1.28, 95% CI [1.03, 1.52]) scores from pre- to post-treatment with large effects observed.
The full summary of fixed effect estimates and CIs for the mixed models for repeated measures (MMRMs) is presented in Table S4 (Supplementary material), and the full summary of results for the longitudinal contrasts is presented in Table S5, and the summary of the interaction (difference-in-difference) contrasts is presented in Tables S6 and S7.
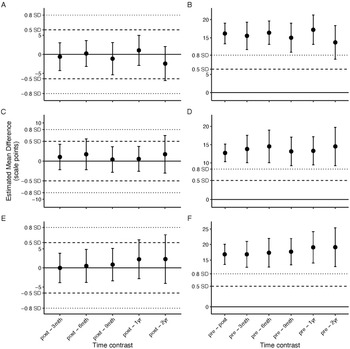
For all disorders, symptom scores at post-treatment were maintained to the 2-year follow-up and remained significantly improved from pre-treatment (see Fig. 1). For GAD, contrasts comparing post-treatment PSWQ-PW with each follow-up indicate that estimated change in PSWQ-PW remained close to zero (see Fig. 2A), with CIs showing clinically significant effects being excluded except at 2 years when a clinically significant return of symptoms cannot be ruled out. For SAD and PTSD, contrasts examining change from post-treatment SPIN (Fig. 2C) and PCL-5 scores (Fig. 2E), respectively, showed that estimates again remained close to zero, and CIs did not approach a clinically significant return of symptoms. However, CIs at later points cross the threshold for clinically significant symptom improvement. Contrasts comparing pre-treatment symptom scores with each follow-up point demonstrated that estimated mean scores at all follow-ups remained significantly improved from pre-treatment, and CIs remained outside the clinically negligible or large effect range of pre-treatment scores, except for GAD at 2 years where we could not exclude a less-than-large difference from pre (Fig. 2B,D,F). Equivalence testing for post-anchored contrasts established equivalence for all comparisons except GAD at 2 years, although that is still equivalent at the large effect (0.8SD) threshold. Our retrospective power for clinically significant effects does decrease at later time points, especially in PTSD (dropping below 80% at 1 and 2 years), but power was still high for the large effect threshold.
Mean symptom severity scores from pretreatment to 2-year follow up at low, average, and high levels of depression. Figure 1A includes participants with GAD, 1B includes participants with SAD, and 1C includes participants with PTSD.

Figure 1. Long description
Panel A: A line graph shows the estimated mean PSWQ-PW scores over time. The x-axis represents time points (pre, post, 3 months, 6 months, 9 months, 1 year, 2 years), and the y-axis represents the estimated mean PSWQ-PW score. Three lines represent different pre-treatment DASS-Dep scores: Mean + SD (red), Mean (green), and Mean - SD (blue). The red line starts highest and shows a significant drop post-treatment, followed by fluctuations. The green and blue lines also show declines post-treatment but remain lower than the red line throughout. Panel B: A line graph displays the estimated mean SPIN scores over time. The x-axis represents time points, and the y-axis represents the estimated mean SPIN score. The red line starts highest and shows a notable decrease post-treatment, with subsequent fluctuations. The green and blue lines follow similar patterns but remain lower than the red line. Panel C: A line graph illustrates the estimated mean PCL-5 scores over time. The x-axis represents time points, and the y-axis represents the estimated mean PCL-5 score. The red line starts highest and shows a significant drop post-treatment, followed by fluctuations. The green and blue lines also show declines post-treatment but stay lower than the red line throughout.
Plots of custom contrasts of estimated marginal means to assess maintenance of gains at post-treatment (left; A, C, E), and return of symptoms to pre-treatment level (right; B, D, F) in GAD (top; A, B), SAD (middle; C, D), and PTSD (bottom; E, F), while holding depression to its mean. Estimates are derived from the primary mixed models for repeated measures (MMRMs) and pooled across multiply imputed datasets, with error bars representing 95% confidence intervals adjusted via the Kenward-Roger and Barnard-Rubin methods. Confidence intervals are further MVT-multiplicity adjusted within each plot to control the familywise error rate. Y-axis values are on the original scales, with dashed and dotted horizontal lines representing thresholds for clinically significant (0.5 SD) and large (0.8 SD) effects respectively. For the post-anchored contrasts (left), positive values indicate a further reduction in symptom scores from post while negative values represent a return of symptoms after post. For the pre-anchored contrasts (right), values above zero indicate a reduction in symptom scores from pre, with thresholds representing clinically significant and large reductions from pre.

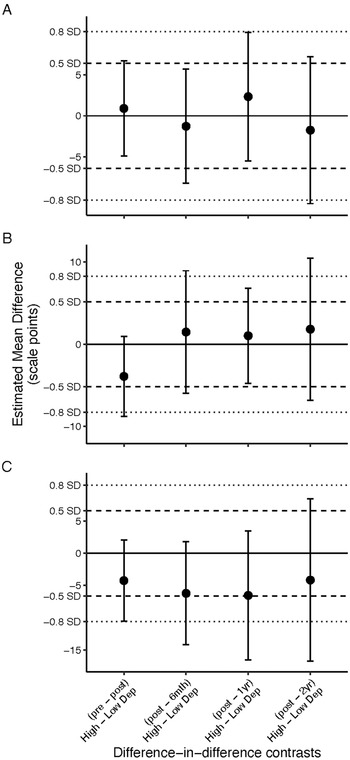
For all groups, baseline depression scores were significantly positively associated with symptom scores at pre-treatment (Table S1, Supplementary material); however, for GAD and SAD there was no significant interaction with time (GAD: F 6,90.9 = 0.61, p = 0.72; SAD: F 6,43.0 = 0.91, p = .50). Consequently, for the GAD and SAD groups, individuals with high pre-treatment depression exhibited consistently higher PSWQ-PW and SPIN scores across the follow-up compared with those with low baseline depression (see Fig. 1A,B). Analyzing our pre-determined contrasts comparing the difference in symptom change between individuals with high and low depression revealed estimates generally remained close to zero for GAD and SAD (see Fig. 3A,B). However, CIs for both disorders crossed the threshold of clinical significance for all follow-ups, although for GAD the CIs remained within the large effect bounds except for the post–2-year contrast. For SAD, only the post–1-year contrast CIs remained within the large effect bounds, and the pre–post contrast suggested a larger, although non-significant, reduction from pre- to post-treatment for low vs high depression individuals (or a smaller reduction for individuals with high vs low levels of depression). For PTSD there was a significant interaction (F 6,47.3 = 2.97, p = 0.015), indicating an effect of baseline depression on symptom change over time. Our pre-defined contrasts comparing individuals with high and low depression at four intervals indicate that the estimated differences in symptom change (see Fig. 3C) were not significant. However, CIs consistently passed the negative clinical significance thresholds, suggesting that we cannot exclude a greater increase in later symptoms relative to post for those with high vs low depression.
Plots of custom difference-in-difference contrasts comparing longitudinal changes in estimated marginal means to assess the time-by-depression interaction in the A) GAD, B) SAD, and C) PTSD groups. Estimates are derived from the primary mixed models for repeated measures (MMRMs) and pooled across multiply imputed datasets, with error bars representing 95% confidence intervals adjusted via the Kenward-Roger and Barnard-Rubin methods. Confidence intervals are further MVT-multiplicity adjusted within each plot to control the familywise error rate. Negative values indicate symptom scores increased more (or decreased less) in high depression vs low depression individuals, while positive values indicate symptom scores increased less (or decreased more) in high depression vs low depression individuals.

Given our a priori contrasts were aimed at capturing differences in relapse from gains made after treatment according to pre-treatment depression, we developed a series of exploratory contrasts anchored at baseline instead of post-treatment as overall change from pre may have been driving the significant omnibus interaction. These indeed revealed more of a cumulative long-term divergence (see Table S7 and Fig. S2 in the Supplementary material), where individuals with high baseline depression do not achieve as high of a cumulative reduction in symptoms from pre-treatment compared with those with low baseline depression, at least through the first year after treatment, although our uncertainty by 2 years is high due to attrition. Equivalence testing for all pre-defined interaction contrasts suggests that equivalence at either the clinically significant or large effect thresholds can largely not be established for all groups, and low power may influence our ability to detect clinically significant and large effects (see Table S9, Supplementary material).
Sensitivity analyses were completed for each disorder to evaluate the robustness of the findings to departures of increasing symptom severity from our missing data assumptions (i.e. missing at random (MAR); see Fig. S1, Supplementary material). The analysis tested different missing not at random (MNAR) scenarios where individuals who discontinued follow-up were assumed to have higher symptom scores at missing time points than those predicted under MAR. For GAD, point estimates for maintenance contrasts anchored at post-treatment do not cross the threshold of clinical significance until 2 years. However, CIs for clinically relevant and large deltas were observed to cross this threshold beginning at 9 months, meaning that the return of clinically relevant symptoms cannot be excluded. At 2 years, CIs for all deltas were observed to cross the threshold for clinical significance. Sensitivity analyses of pre-anchored contrasts were also performed as these more cleanly represent the full departure from MAR, as pre-treatment scores never receive a delta adjustment, whereas post-treatment may. For GAD, contrasts anchored at pre-treatment, which represent a return of pre-treatment level symptoms, show that by 2 years, estimates pass into the clinically negligible zone, but CIs cross starting at 3 months for large deltas. For SAD and PTSD, point estimates for maintenance contrasts anchored at post-treatment do not cross the threshold of clinical significance across the follow-up. However, CIs for clinically relevant and large deltas were observed to cross the threshold starting at 9 months. Similarly, SAD and PTSD contrasts anchored at pre-treatment, show that point estimates do not pass into the clinically negligible zone, but CIs cross starting at 3 months for large deltas. The sensitivity analysis revealed no effect on the time-by-depression interaction analysis with increasing departures from the MAR assumption.
Our analysis of a potential survivorship bias in the post to 2-year period revealed no significant differences in post-treatment scores between individuals that did and did not continue with follow-up (see Table S8, Supplementary material).
Discussion
Little research has investigated long-term outcomes following disorder-specific CBT for anxiety and related disorders, especially in a naturalistic treatment seeking sample. The present study examined changes in symptoms following completion of disorder-specific CBT for individuals with GAD, SAD, and PTSD at an out-patient anxiety clinic. This study also investigated the impact of pre-treatment depressive symptoms on long-term outcomes.
Results suggested that individuals with GAD, SAD, and PTSD demonstrated significant improvements in symptom severity pre- to post-treatment with large effects and, on average, maintained their gains across the 2-year follow-up. Although preliminary, this provides encouraging evidence of long-term maintenance of gains in a naturalistic sample and builds upon studies using shorter follow-ups (Carpenter et al., Reference Carpenter, Andrews, Witcraft, Powers, Smits and Hofmann2018; van Dis et al., Reference van Dis, van Veen, Hagenaars, Batelaan, Bockting, van den Heuvel, Cuijpers and Engelhard2020). Results also suggested significant challenges in retaining individuals over long-term follow-up in a naturalistic sample, with attrition ranging from 58.7% to 76.8%. Future research could investigate the characteristics and motivations of those continuing to provide follow-up data vs those who do not, but gathering data from the latter individuals may be challenging. Nonetheless, furthering our understanding of high attrition rates in long-term follow-up studies represents a meaningful area of future exploration.
For individuals with GAD, confidence in these findings is observed across the follow-up until the 2-year mark, when the possibility of significant symptom worsening cannot be ruled out. For SAD and PTSD, reasonable confidence in the maintenance of gains is observed across the duration of the follow-up, but the possibility of symptom improvement at later time points cannot be ruled out. Relatedly, for all disorders, symptom severity scores never return to thresholds consistent with pre-treatment symptom severity, suggesting no evidence of relapse to symptom levels observed prior to beginning treatment for GAD, SAD, and PTSD. While promising, these findings misalign with some previous research suggesting that the recurrence of symptoms may be quite high, particularly when monitoring people years following treatment (Durham et al., Reference Durham, Chambers, Power, Sharp, Macdonald, Major, Dow and Gumley2005; Lorimer et al., Reference Lorimer, Kellett, Nye and Delgadillo2021; Scholten et al., Reference Scholten, Batelaan, van Balkom, Penninx, Smit and van Oppen2013). This may be due to discrepancies in previous research including the varying definitions of relapse/recurrence, and whether researchers control for maintenance interventions (e.g. booster sessions) or changes in medications (Lorimer et al., Reference Lorimer, Kellett, Nye and Delgadillo2021; Scholten et al., Reference Scholten, Batelaan, van Balkom, Penninx, Smit and van Oppen2013; van Dis et al., Reference van Dis, van Veen, Hagenaars, Batelaan, Bockting, van den Heuvel, Cuijpers and Engelhard2020). This study did not control for these factors, thereby limiting the ability to determine whether long-term gains are attributable solely to receiving a sufficient dose of CBT or whether additional forms of treatment (e.g. booster sessions and medication), also contribute to the observed outcomes.
Individuals with higher levels of depression at pre-treatment exhibited greater symptom severity over the course of treatment, yet depression did not affect the magnitude of symptom change individuals achieved during the treatment period. This result is consistent with previous research suggesting that depressive symptoms do not negatively influence treatment outcomes for GAD and SAD (LeMoult et al., Reference LeMoult, Rowa, Antony, Chudzik and McCabe2014; Newman et al., Reference Newman, Prezeworski, Fisher and Borkovec2010; Rozen and Aderka, Reference Rozen and Aderka2021). However, further inspection of confidence intervals suggests that clinically meaningful differences pre- to post-treatment in those with high vs low depression cannot be ruled out, especially for those with SAD and PTSD, where those with lower pre-treatment depression may experience greater symptom improvement during treatment compared with those with higher pre-treatment depression. This may reflect a ceiling effect at pre-treatment, although unlikely due to the observed distribution of pre-treatment scores, or could represent meaningful individual differences in treatment response wherein greater depression may attenuate treatment gains. Thus, our results do not fully rule out the possibility that greater pre-treatment depression is associated with a reduced response to treatment, which has been observed across other studies (Dold et al., Reference Dold, Bartova, Souery, Mendlewicz, Serretti, Porcelli, Zohar, Montgomery and Kasper2017; Kline et al., Reference Kline, Cooper, Rytwinski and Feeny2021; Ledley et al., Reference Ledley, Huppert, Foa, Davidson, Keefe and Potts2005). Differences in results could reflect differences in sample characteristics, particularly the use of tertiary care vs community samples and associated differences in symptom severity. Taken together, these findings suggest that clinicians should be mindful of how symptoms of depression may make it challenging for individuals to engage in components of CBT (Ledley et al., Reference Ledley, Huppert, Foa, Davidson, Keefe and Potts2005). Therefore, while depressive symptoms do not appear to preclude individuals with GAD, SAD, and PTSD from making meaningful improvements over the course of treatment, they may inhibit engagement in a full dose of treatment, leading to higher post-treatment symptom severity which is maintained long-term.
Across the follow-up period, individuals with higher levels of depression at pre-treatment exhibited greater symptom severity, but for those with GAD and SAD, symptom change over the follow-up period did not differ as a function of pre-treatment depression severity. Yet, for individuals with PTSD, pre-treatment levels of depression impacted change over the follow-up period wherein individuals with lower depressive symptoms had greater symptom reduction than those with greater depressive symptoms across the follow-up. More specifically, visual inspection of Fig. 1C suggests that individuals with lower pre-treatment depression continued to experience slight symptom reductions following treatment, whereas those with higher pre-treatment depression showed slight symptom increases, contributing to the observed divergence in symptom trends over time. It is possible that individuals with PTSD who have greater depressive symptoms may experience a synergistic relationship between negative cognitions associated with both conditions, which may influence the degree of improvement observed across treatment when this synergy is moving in a positive direction, but could also impact changes in symptom severity over time when the synergism is negative. This aligns with findings that changes in negative cognitions about the self are associated with changes in depressive symptoms over the course of treatment (Gradl et al., Reference Gradl, Burghardt, Oppenauer and Sprung2023). It is also possible that the degree of depressive symptoms interacts with an individual’s ability to engage with approach vs avoidance behaviours following treatment completion, which could impact changes in symptoms over time. Use of avoidance coping has been observed to predict more severe PTSD symptoms following treatment for PTSD and greater symptom severity at post-treatment predicts increased avoidance coping across follow-up (Badour et al., Reference Badour, Blonigen, Boden, Feldner and Bonn-Miller2012).
While challenging to retain, the participants in this study represent unscreened participants, who seek treatment at a specialized out-patient anxiety treatment clinic and then proceed to continue with their everyday lives. However, attrition across the follow-up is a notable limitation. Accordingly, interpretation of the findings should occur within the context of reported confidence intervals and sensitivity analyses. Sensitivity analyses confer confidence in the reported findings even under the assumption that participants who discontinued would have experienced a substantial increase in symptoms. The only exception is for GAD, where a significant return of symptoms at 2 years would be observed under the assumption that participants who discontinued would have reported a substantial increase in symptoms. Despite these findings, a clinically significant return of symptoms often cannot be ruled out for all disorders under the assumption that participants discontinuing with the study experienced a substantial increase in symptoms, and thus results, particularly at later time points, should be interpreted with caution. Future research may benefit from creative and low-cost strategies to encourage retention, such as tiered payment rewards (e.g. $5 per follow-up with a final $50 reward) to further our understanding of whether gains are maintained years after treatment. This study could also not examine long-term outcomes for other anxiety and related disorders (e.g. panic disorder/agoraphobia, obsessive-compulsive disorder) due to attrition. Therefore, our sample may represent a biased group of individuals who remained compliant with treatment and follow-up. This study also focused on individuals completing group CBT, limiting the generalizability to those seeking individual treatment. Furthermore, the sample was predominantly female and White, limiting generalizability to other genders and racial backgrounds. While internal consistency for the PCL-5 and PSWQ-PW were largely below .95, occasional estimates slightly exceeding this threshold suggest potential scale redundancy (Streiner, Reference Streiner2003). This study also did not examine various factors that may influence symptom change over time, including medication changes, other psychological treatments, and life stressors across the follow-up. Inclusion of such factors represents an important avenue for future research to elucidate variables that may contribute to maintenance of gains or poorer outcomes over time.
Conclusion
Despite the attrition observed in this study, the findings provide evidence that disorder-specific CBT outcomes for individuals receiving specialized care for GAD, SAD, and PTSD in a naturalistic setting are likely to maintain their gains until 2 years post-treatment. While an important factor for clinicians to consider during treatment, depressive symptoms do not seem to significantly impact the degree of change individuals with GAD and SAD experience over the course of treatment and across the follow-up. However, for those with PTSD, the severity of depressive symptoms did influence symptom change across the follow-up period, pointing to a useful target of intervention.
Supplementary material
To view supplementary material for this article, please visit https://doi.org/10.1017/S1352465826101374
Data availability statement
Due to the clinical nature of the data used for this study, survey respondents were assured raw data would remain confidential and would not be shared.
Acknowledgements
None.
Author contributions
Sydney A Parkinson: Conceptualization-Lead, Methodology-Lead, Project administration-Lead, Writing - original draft-Lead; Andrew M. Scott: Formal analysis-Lead, Methodology-Supporting, Writing - review & editing-Supporting; Karen Rowa: Conceptualization-Supporting, Supervision-Lead, Writing - review & editing-Lead; Randi E. McCabe: Conceptualization-Supporting, Supervision-Supporting, Writing - review & editing-Supporting.
Financial support
None.
Competing interests
The authors declare none.
Ethical standards
The authors state that this research conformed to the Declaration of Helsinki in 1975, and its most recent revisions. The authors also state that this project complied with, and was approved by, the local institutional review board (Hamilton Integrated Research Ethics Board ref. no. 11019). As part of the consent procedure, participants were informed that their data may be used for presentations, reports, or articles but under the conditions that their identifying information would never be included.



 Open access


Comments
No Comments have been published for this article.