


1. Introduction
Debris-covered glaciers are found in most glacierized mountains and are particularly extensive in the high Asian ranges, Alaska and the Andes (Reference Kirkbride, Singh, Singh and HaritashyaKirkbride, 2011). Extensive mantles of rock debris significantly reduce surface melt rates and have a positive overall influence on glacier mass balance, despite localized melt enhancement in areas of thin and patchy debris (Reference Brock, Rivera, Casassa, Bown and Acun˜aBrock and others, 2007; Reference Hagg, Mayer, Lambrecht and HelmHagg and others, 2008; Reference MihalceaMihalcea and others, 2008; Reference Reid, Carenzo, Pellicciotti and BrockReid and others, 2012). Brock and others (2010) calculated a melt rate sensitivity to temperature for a debris-covered glacier about four times less than that of comparable clean (debris-free) glaciers, suggesting that debris-covered ice is relatively well insulated against the direct effects of climatic warming.
Some researchers have shown that the process of backwasting on localized ice cliffs could make a large net contribution to total ablation of debris-covered glaciers (Reference Sakai, Nakawo and FujitaSakai and others, 2002; Reference Han, Wang, Wei and LiuHan and others 2010). These cliffs are likely to show enhanced melt rates relative to cliffs on clean glaciers because they have reduced ice albedos due to deposition of fine debris, and are in close proximity to warm debris layers that emit longwave radiation and raise ambient air temperature through convection (Reference Reid and BrockBrock and others, 2010). Assessing the contribution of ice cliffs to total glacier ablation is challenging due to complex geometry, local topography, variable surface materials and inaccessibility, which present difficulties for both modelling and direct measurement of micrometeorology and melt rates. Mapping ice cliffs is hampered by their steep vertical angles making them difficult to identify using remote sensing, unless imagery of very high spatial resolution is available. Furthermore, many ice cliffs are ephemeral features as they will become buried by debris if their vertical gradient falls below the angle of friction of the debris material. Hence, models need to consider changes in geometry due to differential melt rates across an ice cliff, as well as any changes to the debris layer, in ablation calculations.
This paper describes an assessment of the contribution of backwasting to total ablation of Miage glacier (45847’30’’ N, 6852’00’’ E; Fig. 1a), a well-studied debris-covered glacier on the southwestern side of the Mont Blanc massif, Italy (e.g. Reference Foster, Brock, Cutler and DiotriFoster and others, 2012). Field measurements and analysis using physical melt models are employed to investigate processes that may cause differential ablation across cliff faces. In a further advance on previous work, a high-resolution digital elevation model (DEM) derived from an airborne lidar survey is used to identify ice cliffs across the glacier’s debris-covered zone to estimate their overall contribution to ablation.
(a) Map of Miage glacier. (b) Close-up on debris-covered area, with pixels classified as ice cliffs for this paper shaded black. Upper right shows the region where five of the studied cliffs were situated (Table 2); there are many C-type and H-type cliffs here created by the splitting of the glacier into two lobes, and these change from year to year (also visible is a large north-facing M-type cliff near the top left that has been known to persist for at least 8 years).

2. Field Measurements
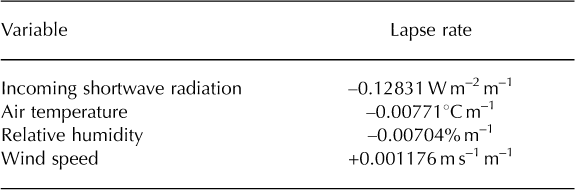
Figure 1a and b show the shape of the debris-covered tongue of Miage glacier, on which two automatic weather stations (AWSs) were deployed. The lower weather station (LWS) was deployed at 2030 m a.s.l. near the centre of the lower ablation zone of Miage glacier in both 2010 and 2011, on an area with debris ~20 cm thick, following the protocols described in Brock and others (2010). This provided hourly measurements of air temperature, relative humidity, up-welling and downwelling longwave radiation, incoming and reflected shortwave radiation, wind speed and wind direction. The shortwave measurements were used to calculate an average debris albedo of 0.12. An upper weather station (UWS) with similar sensors was installed on the upper part of the debris-covered zone at 2340 m a.s.l. over the same period to enable calculation of lapse rates for meteorological variables (Table 1).
Elevation lapse rates for meteorological variables on Miage glacier calculated using data from the upper (2340 m a.s.l.) and lower (2030 m a.s.l.) weather stations
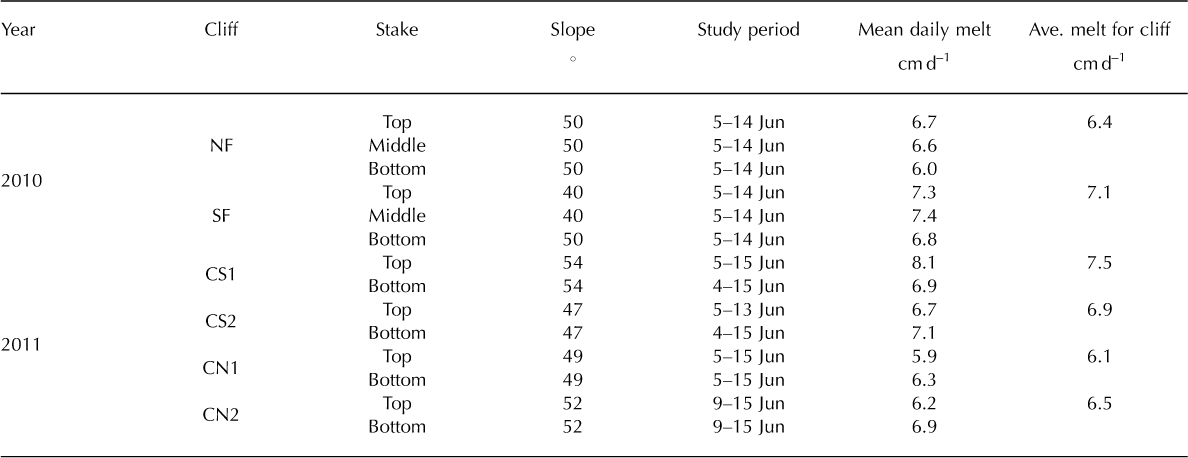
In 2010 two small ice cliffs, one north-facing (named NF; Fig. 2a) and the other south-facing (named SF; Fig. 2b), were identified ~100 m south of the LWS. The cliffs faced one another from ~15 m apart, and between the two cliffs an ice-cored mound of debris rose to a height of 1 m below the top of the cliffs (Fig. 2c). The size and orientation of each cliff are described in Table 2 and illustrated in Figure 2d. The north-facing cliff showed a fairly uniform slope, while the larger south-facing cliff was composed of a shallow top section, a steep middle section and a shallower lower section, the base of which was undercut by a supraglacial stream.
(a, b) Photographs of the (a) north-facing and (b) south-facing ice cliffs on Miage glacier studied in 2010. Ablation stakes are circled. (c) DEM of the ice-cliff area studied on Miage glacier in 2010, interpolated from differential GPS measurements and manual surveying. (d) Approximate schematics of the two cliffs as used for calculations, showing positions of three ablation stakes on each cliff. Distances are in metres.

Physical characteristics of ice cliffs studied in 2010 and 2011. Total cliff surface areas were not measured in 2011

In 2011 three ice cliffs, two south-facing (named CS1 and CS2) and one north-facing (named CN1), were identified within 50 m of each other in approximately the same area as in 2010 (Table 2). A fourth ice cliff (named CN2) was chosen further up-glacier at ~2270 m a.s.l. as representative of the upper-valley section of the debris-covered zone, which experiences higher levels of topographic shading from Mont Blanc and Petit Mont Blanc (Reference Reid and BrockBrock and others, 2010).
In both years, white plastic ablation stakes of length 1 m were inserted in vertical profiles at the tallest parts of the ice cliffs using a Kovacs ice auger and abseiling equipment. Three stakes were installed in 2010 at positions indicated in Figure 2d, and stakes were installed at the top and bottom of each cliff in 2011. In 2010 all the stakes were revisited and measured at 3 day intervals for a 9 day study period. In 2011 the lower stakes were measured nearly every day and the upper stakes were measured approximately every 3 days for the periods indicated in Table 3. Ablation measurements were converted to water equivalent (w.e.) melt assuming an ice-to-water density ratio of 0.89.
Mean daily melt rates (overall melt in the study period divided by the number of days) recorded at the ice-cliff ablation stakes for the indicated periods in 2010 and 2011
Measurements of ice-cliff albedo were performed in June 2011 using a Kipp & Zonen CM7B handheld albedometer. Readings were taken at ~5 m horizontal intervals, about 1 m below the top and 2 m above the base of each of the four study cliffs, holding the albedometer parallel to and ~1 m from the cliff face. This provided between two and seven albedo readings for each cliff top and cliff bottom. Statistical t –tests between paired groups of readings showed no significant difference at the 95% confidence level between the top and bottom albedo of any individual cliff or the cliff-top and cliff-bottom albedo averaged over all the cliffs, and only one of six possible pairs of cliffs showed a significant difference in overall albedo. This lack of variability justifies a choice of one albedo value for all ice cliffs. The overall mean value across all albedo readings was 0.094 ± 0.005. This is a relatively low albedo for ice, but reflects the fact that the ice cliffs were very dirty with fine-grained debris, and measurements were made in the middle of the day when cliffs were generally very wet with meltwater. Albedo might arguably be higher on cold mornings and into the evenings, so the mean was rounded up slightly to 0.1 for the default value in the models; the effects of this are investigated later in a sensitivity analysis. This value concurs with the value of 0.11 used by Sakai and others (1998), but is much lower than the value of 0.37 adopted by Han and others (2010).
3. Theoretical Background And Model Development
On ice-cliff evolution
Within a continuously debris-mantled ablation zone, bare ice cliffs form where the surface slope exceeds the angle of friction of the debris. Bare ice cliffs can form through three sets of processes: M-type cliffs, where steep slopes form either at the glacier margins or on the sides of medial moraines; C-type cliffs, from opening of crevasses; and hydrological H-type cliffs caused by thermal erosion and calving at the side-walls of surface ponds (e.g. Reference RöhlRöhl, 2008) and surface streams, or the roof collapse and exposure of englacial conduits.
The evolution of an ice cliff is governed by its initial slope and aspect angles and by the surrounding topography, which control the pattern of energy receipts across the face of the ice cliff; and also by the backslope – the glacier surface slope behind the cliff which determines whether the cliff will grow or shrink during backwasting. The field of view of M-type cliffs is normally unobstructed by local topography, so ice melt rates should be fairly uniform across the cliff, maintaining a steep slope angle. M-type cliffs have the potential to persist over many years and remove a large volume of ice as they plane laterally across the glacier surface. Ice-cliff burial may occur when it encounters a zone of thick debris or a downward-sloping backslope.
The field of view of C- and H-type cliffs is more likely to be affected by local topography, and this may play an important role in the pattern of energy receipts across the face of the ice cliff and its subsequent evolution through differential melt rates. Some of the relevant processes can be illustrated by considering an opposing pair of north- and south-facing ice cliffs initiating at a crevasse. Shading of the lower part of an equatorward-facing cliff during the daytime, while its upper section receives direct solar radiation, will lead to a relaxation of slope angle, while a poleward-facing cliff, which receives only diffuse shortwave radiation across its entire face, will tend to maintain a steep angle. As the crevasse widens, a crevasse-fill ridge may form a mound of debris between the cliffs which plays a further role in both modifying the field of view from different parts of the ice cliff and the pattern of longwave radiation receipts as debris heats up during the daytime. The distribution of fine-grained debris, through its influence on albedo, is another factor that may lead to variable melt rates and change in ice-cliff slope angles over time.
Sakai and others (2002) hypothesized that the pattern of net short- and longwave radiation across the face of poleward-facing ice cliffs would favour their persistence, whereas relatively high net radiation at the top of ice cliffs with other orientations would cause their vertical angles to relax, leading to burial by debris. However, M-type cliffs with both poleward and equatorward aspects have been observed by the authors to persist for at least 8 years at Miage glacier.
Modelling individual cliff ablation
This paper adapts the approach of Han and others (2010; herein referred to as H2010) who presented a physically based energy-balance model for clean (not debris-covered) ice-cliff ablation taking into account net shortwave radiation (I n), net longwave radiation (L n), sensible heat (H) and latent heat (LE) fluxes, and applied it to ice cliffs of Koxkar glacier, China. They calculated the sum of vertically downwelling fluxes above a cliff:

and used trigonometrical considerations to calculate horizontal backwasting for comparison to their measurements, which were made by measuring distances from cliff tops to fixed markers. For this paper, the melt perpendicular to the cliff face is required for comparison to ablation stake measurements and for calculating total runoff from the cliffs. In metres water equivalent, this is
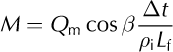
where β is the ice-cliff slope, Δt is the model time-step (1 hour = 3600 s), ρ i is the density of ice and L f is the latent heat of fusion of water.
The bulk of the model code is concerned with calculating the fluxes I n, L n, H and LE. This section presents only those parts of the flux calculations that have been changed for this paper, and reference should be made to H2010 for further details.
The H2010 model requires information on the extent of horizon visible in the hemisphere of view from the study site, in order to assess contributions from direct and diffuse solar shortwave radiation, and longwave radiation from the atmosphere or terrain. These data were acquired by applying the viewshed function in ArcGIS to an Advanced Space-borne Thermal Emission and Reflection Radiometer (ASTER) global DEM (GDEM) for Miage glacier and its surroundings (ASTER GDEM Validation Team, 2011). This yielded values of the horizon zenith angle at intervals of 108 azimuth, which were used to calculate sky-view factors for study sites. Radiative fluxes were also corrected for slope and aspect according to H2010.
This paper expands on the longwave parameterization scheme from H2010. Downwelling longwave radiation was recorded at the AWS, so it was not necessary to model the longwave contribution from the sky, a process that is notoriously site-specific (Juszak and Reference Juszak and PellicciottiPellicciotti, 2013). The recorded longwave (L
in) accounts for the contribution from both the sky and those parts of the surrounding mountains that project into the upper hemisphere of view from the ice cliff, but with no significant contribution from the glacier because of the open aspect of the AWS site. Figure 3a shows how glacier debris affects the view from an ice cliff, with both a sky-view factor and an added debris-view factor ( , with angles in radians). The net vertically down-welling longwave L
n at the ice-cliff surface is
, with angles in radians). The net vertically down-welling longwave L
n at the ice-cliff surface is

(a) Sky-view factor V s and debris-view factor V d for a cliff unobscured by local topography. (b) A nearby mound of debris adds some extra factor V e to the debris view at the expense of sky view.

where V s is the sky-view factor (Fig. 3a), L o is the outgoing longwave from the ice surface, calculated exactly as in H2010 using the Stefan–Boltzmann relationship with an ice emissivity of 0.97 and surface temperature of 0°C, and L d is the longwave from the debris, defined as

where ԑd is the emissivity of the debris, set to 0.95, σ is the Stefan–Boltzmann constant (5.67 × 10⁻⁸ W m-2 K-4) and T s is the debris surface temperature, derived from hourly measurements of upwelling longwave radiation at the AWS site as in Brock and others (2010). This is an improvement on H2010, where the flux from surrounding terrain was accounted for by assuming the terrain was at the same temperature as the air; this assumption is questionable given that debris heats up considerably during the daytime (Reid and Reference Reid and BrockBrock, 2010; Reference Reid, Carenzo, Pellicciotti and BrockReid and others 2012).
For shortwave radiation calculations the sky view V s is reduced appropriately using the horizon angles from the GDEM, to calculate the separate diffuse irradiances from the terrain and the sky using the equations from H2010. In 2011, the necessary input data were not available for the whole period of ice-cliff measurements. For this reason, and given the more extensive detail collected in 2010 on the ice-cliff topography, the 2010 data were used for initial model runs, sensitivity analysis and a more detailed theoretical study of ice-cliff evolution.
Further adjustments were made to the H2010 model in order to investigate melt rates at different heights on an ice cliff. Figure 3b illustrates how nearby mounds of debris affect the sky- and debris-view factors for points low on an ice-cliff face, and thus the balance of shortwave and longwave radiation. Parts that project above the horizontal introduce an extra factor V e to the debris view, at the expense of the sky view. Due to the complex nature of the terrain, no attempt was made to estimate V e for the field sites; rather it is introduced as an adjustable parameter for theoretical insight into the phenomena at play.
The turbulent fluxes of sensible and latent heat are calculated using the bulk-aerodynamic method as in H2010, but can also be expected to vary at different heights on an ice-cliff face. Arguably, the most crucial parameterization to consider is that of the aerodynamic roughness length for momentum, z 0. H2010 use a formula for z 0 that depends on the height and slope of the cliff, and the wind direction relative to the cliff face. The roughness lengths for temperature, z 0T , and humidity, z 0e , are derived using a model based on the roughness Reynolds number (Reference AndreasAndreas, 1987). The same approach is adopted in this paper for an initial comparison to observed melt rates. However, the H2010 scheme does not account for variations in effective roughness up and down the cliffs, which are likely to be significant and might contribute to the evolution of the ice-cliff shape. In the absence of an accurate method to account for these variations, for later model runs the equations are disposed of and z 0 is replaced by an adjustable effective roughness parameter, zf , which can be fitted to the data to gain insight into how local differences with height may arise. Under this scheme, z 0T and z 0e are set equal to z 0, as in Brock and others (2010) and Reid and Brock (2010). The parameter is renamed zf because it loses the original definition of z 0 (the height at which wind speed becomes zero). This adapted model, named ZF from here on, was run multiple times for the north-facing cliff, with zf varied between 0 and 100 mm in order to find a best-fitting value that minimizes the residual sum of squares in comparing measured to modelled ablation.
Locating ice cliffs glacier-wide
Previously, assessment of the impact of backwasting on net ablation on debris-covered glaciers has been hampered by the lack of a suitable method to map ice cliffs across an entire glacier. Here we identified ice cliffs from a high-resolution DEM of Miage glacier, using a slope threshold of 40°. The maximum angle at which debris can lie on a slope will vary with the size, shape and thickness of debris, but a critical threshold value of 40° has been suggested based on extensive field and satellite measurements at Miage glacier (Reference FosterFoster, 2009). This DEM (LDEM, hereafter) was derived from an airborne lidar survey collected by the UK Natural Environment Research Council (NERC) Airborne Research and Survey Facility on 31 July 2010. The raw point cloud was cleaned to remove outliers and resampled to a resolution of 1 m. Every cell was assigned a value for slope and aspect using the second-order finite-difference method, shown to be the most accurate of six common algorithms tested by Zhou and Liu (2004). Pixels with slope greater than 40° were identified and grouped using a connected-component algorithm. Any pixels with fewer than ten neighbours in their group were discarded, such that a cliff was defined as having a minimum size of 10 m2. Maps of these pixels maintained many boulders and areas of moraine which were easily identified using a map of aspect angle and manually deleted. The remaining map therefore retained only well-known ice cliffs and others deemed believable based on their position and evidence from aerial photography.
Applying ice-cliff models glacier-wide
The two ice cliffs studied in 2010 and three of those studied in 2011 were very close to the lower AWS (2030 m a.s.l.) on Miage glacier, so the meteorological data from the AWS were applied without adjustment. It should be noted that the micrometeorology of the ice cliffs might be different from that of the nearby AWS site on debris, especially air temperature because ice cools the air next to it more than debris, as shown in Reid and others (2012) for debris-free and debris-covered areas of Haut Glacier d’Arolla, Switzerland. We argue that these effects will be small for an ice cliff because the area of exposed ice is small relative to the surrounding debris cover, and the wind will usually quickly replenish the air in contact with the ice.
To apply the model to ice cliffs over the entire debris-covered zone, the input variables were adjusted for different elevations using the locally derived lapse rates. The debris surface temperature T s and downwelling longwave radiation L in were not measured at the upper weather station, so lapse rates were not available. Instead T s was calculated for each site based on a strong correlation with the air temperature (Pearson coefficient r = 0.87) observed at the lower AWS, linked by the formula T s = 2.04T a – 7.79. A lapse rate of 0.029 W m–2 m–1 was chosen for L in based on Marty and others (2002) and Iziomon and Mayer (2002) who report very similar longwave lapse rates for alpine sites in Switzerland and Germany respectively.
Applying lapse rates for shortwave radiation is unusual, and a full treatment should incorporate viewshed calculations on a DEM and estimates of the diffuse radiation fraction. A full simulation of these processes in a distributed model is beyond the scope of this paper, so the lapse rate was applied for the sake of simplicity. The slightly negative lapse rate between the lower and upper weather stations reflects the increasingly steep valley walls on the upper glacier formed by Mont Blanc and Petit Mont Blanc. With the imposed lapse rate (Table 1), the change in shortwave from the lower to upper stations (310 m apart in elevation) is in any case rather small at 39 W m–2.
Lapse rates for wind speed are also unusual; but wind speed is always difficult to distribute accurately for models in mountainous terrain, depending in complex ways on wind direction and local topographic obstacles. The measured lapse rate was very small (0.36 m s–1 difference between the two weather stations), possibly because, although the upper glacier is exposed to katabatic winds from the higher summits, its enclosed topography shields it from regional-scale prevailing winds through the Val Veny that could affect the lower glacier.
To calculate the all-glacier ice-cliff melt, the melt model was run for every 1 m2 cliff pixel and values were summed.
Calculating sub-debris melt
To acquire an estimate of the total melt on the debris-covered zone over the study period, a very simplified distributed model was developed by assuming a constant debris thickness of 0.26 m, the mean debris thickness on Miage estimated through thermal remote-sensing methods by Foster and others (2012). Then the point model of Reid and Brock (2010; ‘DEB-model’), which calculates sub-debris ice ablation, was applied to every pixel. To avoid running DEB-model millions of times, the elevation of each pixel was rounded to the nearest 10 m, and the melt values for each 10 m elevation band were calculated after applying relevant elevation lapse rates (Table 1); these melt values were then multiplied by the numbers of pixels in each elevation band and summed.
4. Results and Discussion
Ablation data
Table 3 shows the mean daily melt rates recorded at all the ablation stakes in 2010 and 2011. In both years the south-facing cliffs melted faster than the north-facing cliffs. In 2010, both cliffs showed slightly faster rates of melt at the top and middle stakes than at the bottom; however, in 2011, only cliff CS1 showed this trend, while the other three cliffs all showed slight opposite trends. Given the errors involved in measuring stake lengths while abseiling (estimated to be at least ±1 cm), we conclude that data on this short timescale are insufficient to reach conclusions about differential melt rates on the vertical profile of an ice cliff. For this reason the mean melt rates across the stakes are adopted for each ice cliff in the following analysis, apart from the theoretical discussion below.
Model as in Han and others (2010)
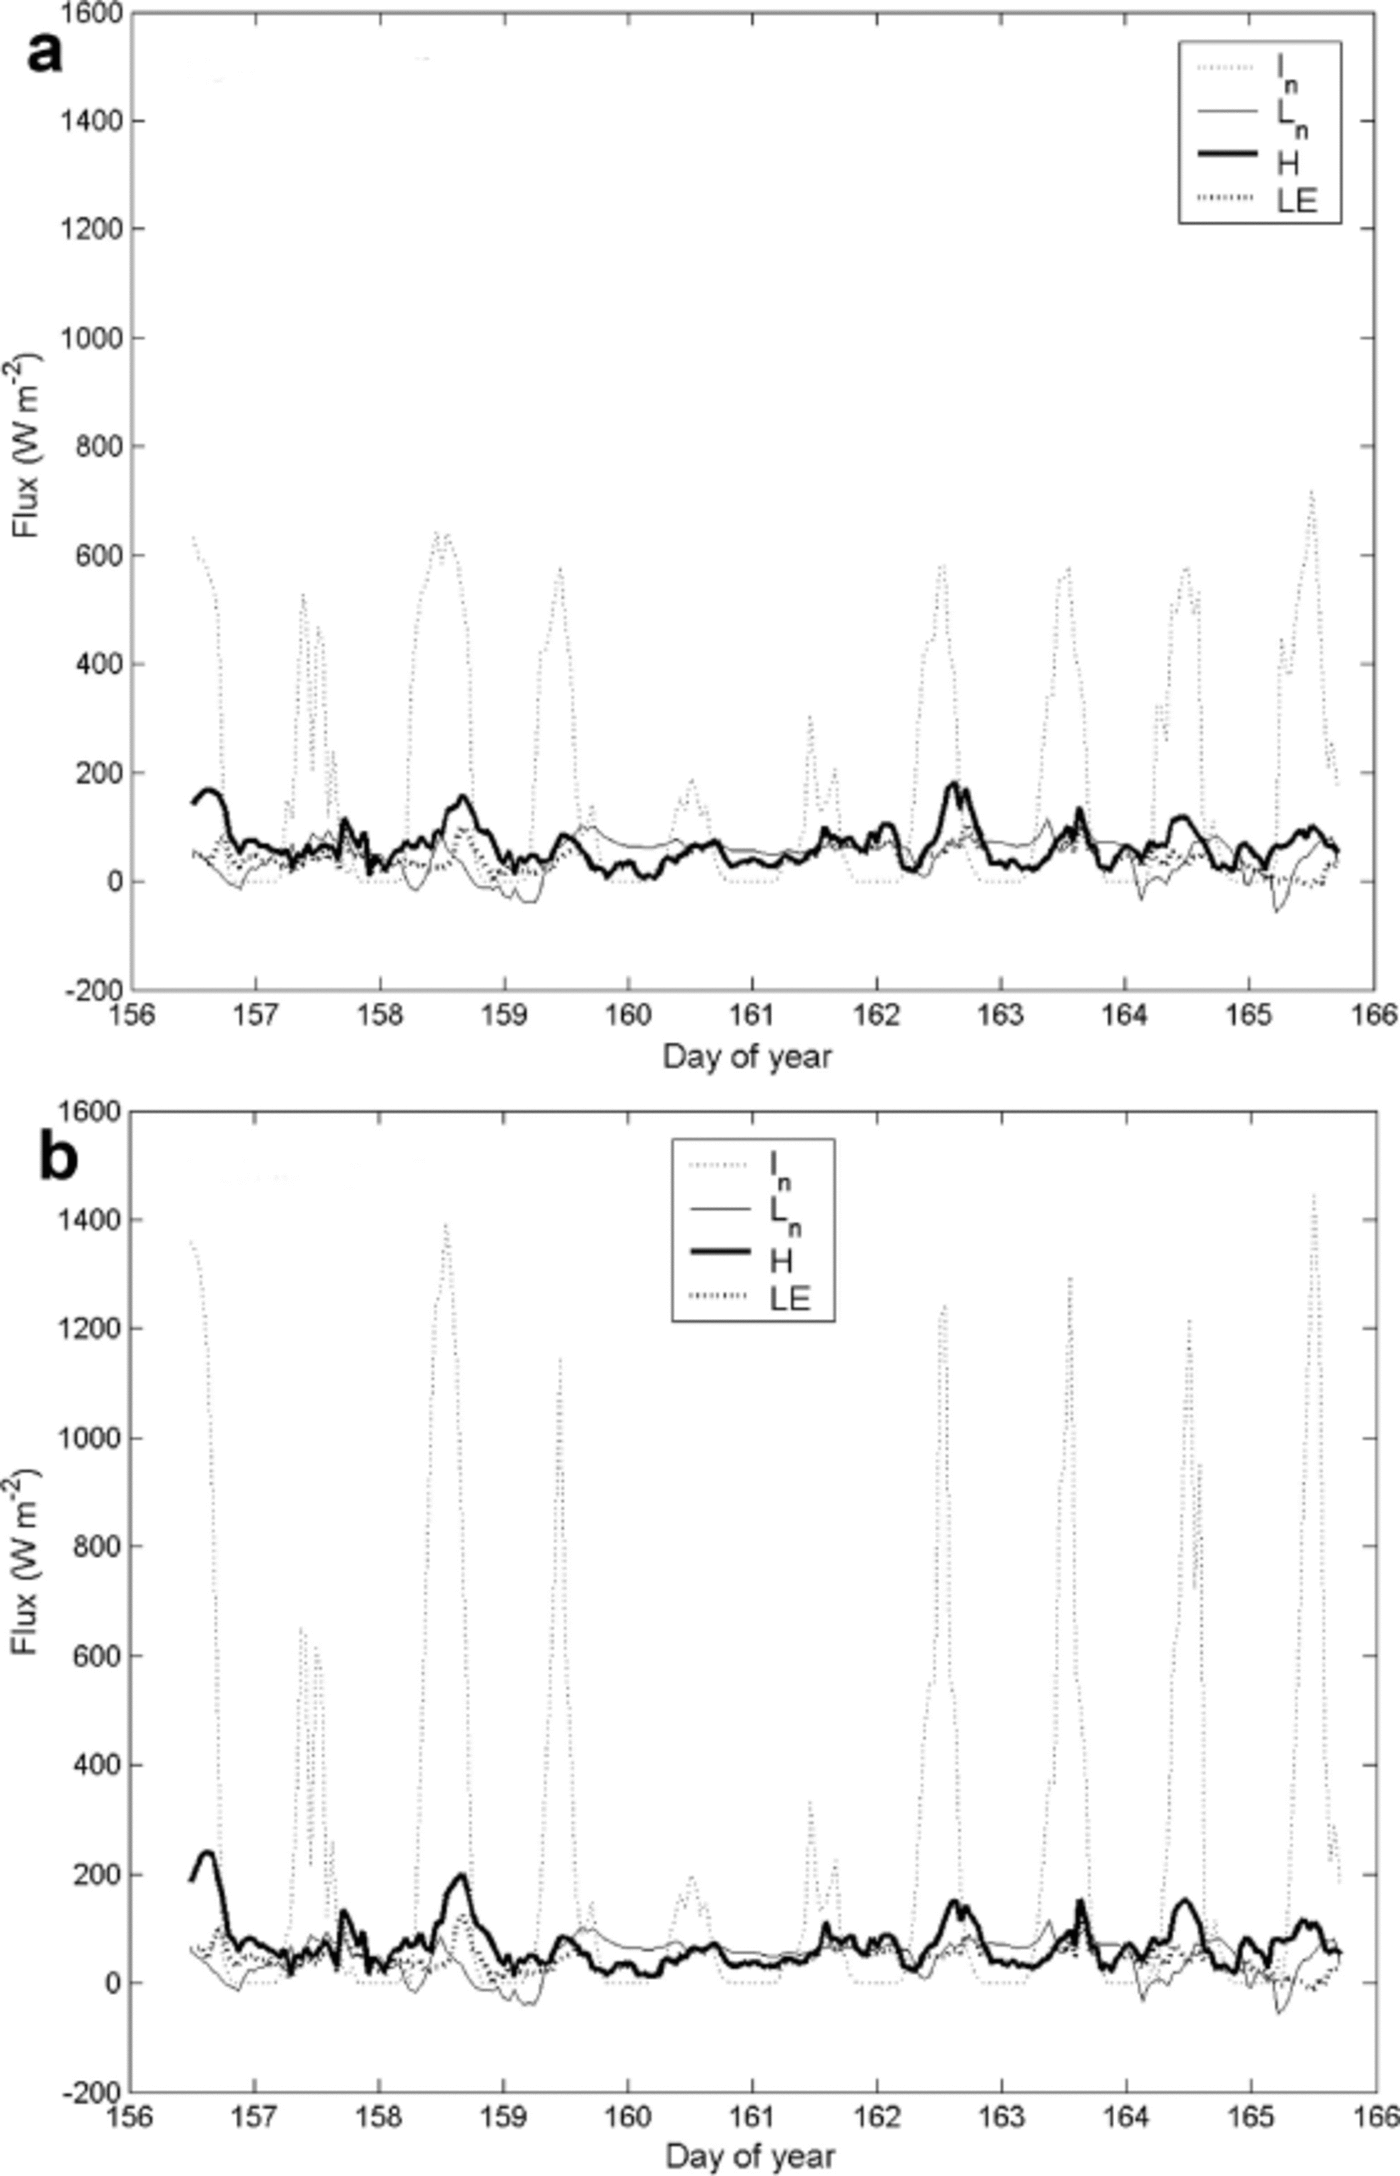
Figure 4 shows the results of running the model with the default value of ice albedo (α i = 0.1), no extra debris obstruction (V e = 0) and with z 0 calculations performed exactly as in H2010. The general modelled ablation trend for the north-facing cliff is close to the stake data. The south-facing cliff is modelled twice with slope set to 40° for the top and middle stakes and then to 50°for the bottom stake, reflecting the observed cliff shape. The curves match the relevant stake data well, and illustrate the importance of cliff slope in determining ablation. On both cliffs the largest flux is the net shortwave radiation I n, which is significantly greater on the south-facing cliff (Fig. 5).
Cumulative melt predicted by the model adapted from Han and others (2010) for the (a) north-facing and (b) south-facing ice cliffs on Miage glacier, plotted with ablation stake measurements. For the south-facing cliff, the model was run twice with two values of slope to represent the observed cliff shape (40° for the top two stakes, 50° for the bottom stake).

Heat fluxes calculated for (a) the north-facing cliff and (b) the 50°slope of the south-facing cliff. I n is net shortwave radiation, L n is net longwave, H is sensible heat and LE is latent heat.
Model sensitivity analysis
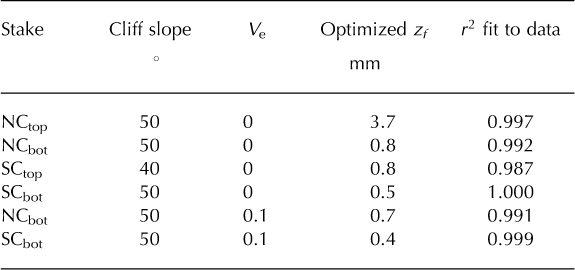
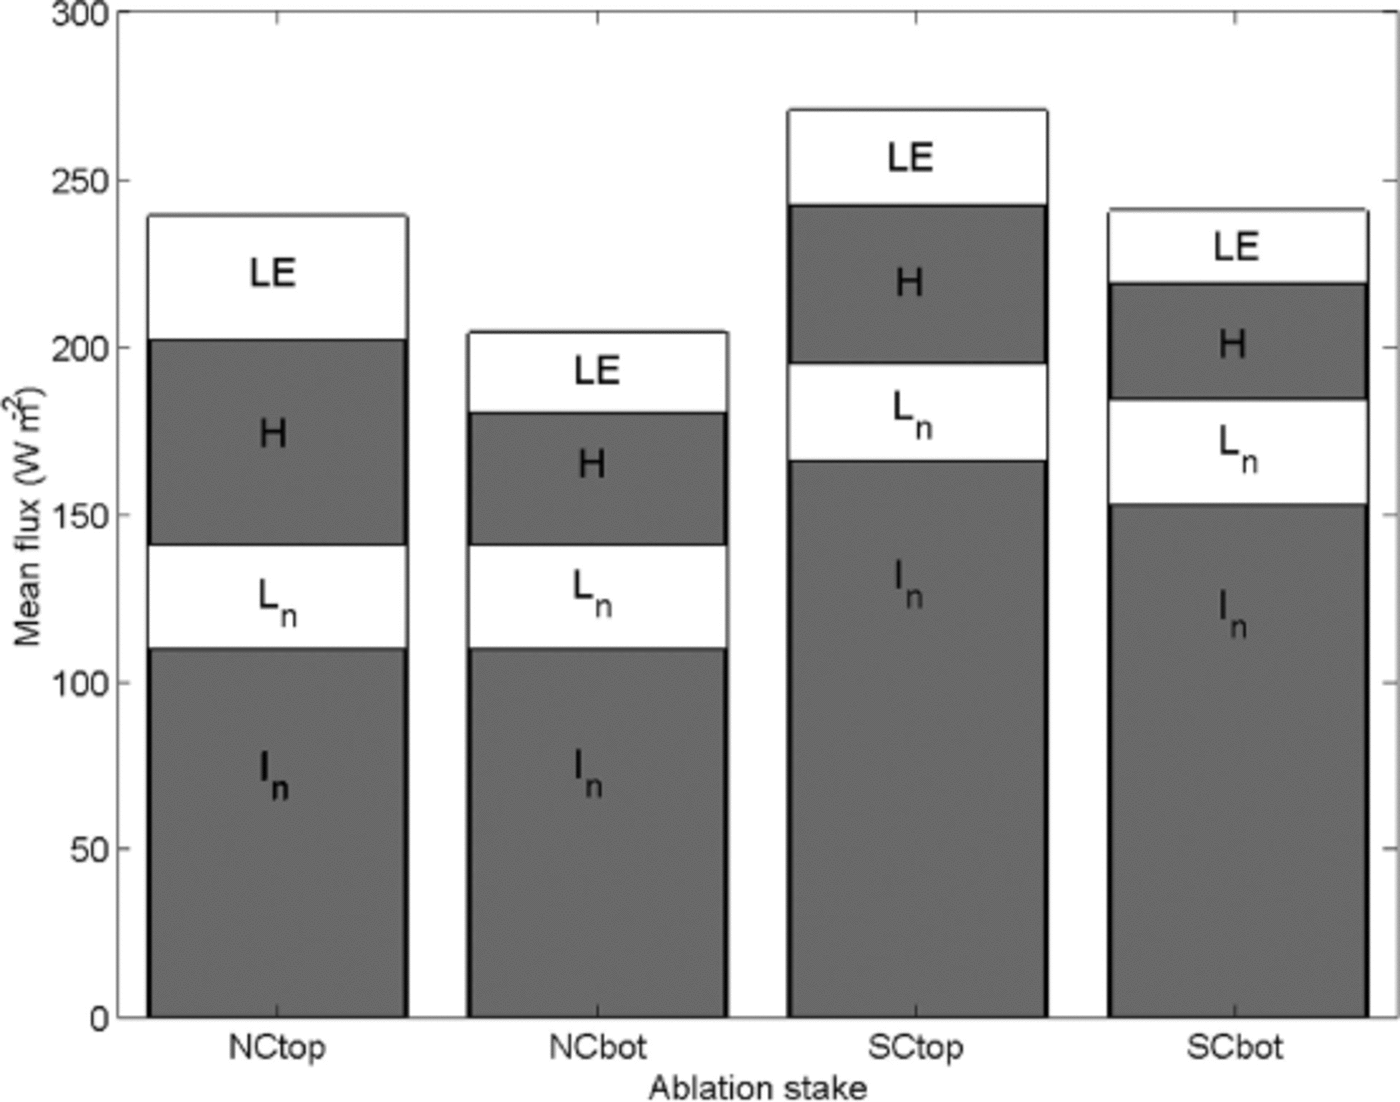
On running the adapted model with the effective roughness parameter zf ,, the optimal value of zf″ for NCtop was found to be 3.7 mm, providing a fit of r 2 = 0.997 (where r 2 is equivalent to the Nash–Sutcliffe model efficiency coefficient (Reference Nash and SutcliffeNash and Sutcliffe, 1970)). The same approach was taken for the stakes NCbot, SCtop and SCbot. The results are summarized in the top four rows of Table 4, the corresponding melt curves for all four stakes are plotted in Figure 6 and the contributions from different heat fluxes for each stake are shown in Figure 7. The optimized zf values for NCtop and SCtop are reassuring because one might expect the shallower south-facing cliff top (40°slope) to have a lower effective roughness length than the north-facing cliff top (50°slope), resulting in less turbulent heat transfer. For both cliffs, the optimized zf value is lower at the bottom of the cliff than at the top, but this effect is less pronounced for the south-facing cliff. Total energy fluxes are higher at the top of both north- and south-facing cliffs compared to the bottom (Fig. 7). As discussed, both cliffs show higher turbulent fluxes at the top of the cliff, but the south-facing cliff also receives increased net shortwave on the upper part of the cliff due to a more favourable slope angle (Fig. 2).
Optimized values of the effective roughness parameter zf and the resulting goodness of fit (r 2) after fitting zf to data for the top and bottom ablation stakes on both the north- and south-facing ice cliffs. V e is an extra view factor to account for the effect of a debris mound in the field of view of the ice cliff (see Fig. 3)
Melt rates calculated using the adapted model (lines), plotted with ablation stake measurements (symbols). For each stake, the model was fitted to data by optimizing the roughness parameter zf to the values shown in Table 4.

Contributions from different heat fluxes perpendicular to the ice-cliff surface for each ablation stake, calculated using the optimized values of zf shown in Table 4.
zf is not a physically defined quantity, rather an empirical parameter that indirectly accounts for the fact that the wind speed is almost certainly lower at the bottom of the cliffs due to sheltering. If one wanted a full physically accurate simulation, the AWS data should not be directly applied to the cliff bottom: some sheltering factor would be required, but this would be difficult to quantify without collecting a large amount of extra data.
The second method to account for differential ablation rates at lower stakes is to introduce a nonzero value of V e to account for the extra obstruction caused by nearby debris mounds. Figure 8 shows how the calculated heat fluxes vary for values of V e in the range 0–0.5. As V e is increased from zero, the strongest initial effect is an increase in net longwave radiation L n due to the added flux from the warm debris. Therefore the total heat flux and, by extension, the melt rate increase. However, as V e is increased further (the simulated debris mound gets taller) the reduction in sky-view factor causes a sharper decrease in net shortwave radiation I n, and the total heat flux decreases after passing a maximum ‘critical’ value. For the north-facing ice cliff, the critical value that produces the highest total heat flux is V e = 0.200, while for the south-facing cliff it is V e = 0.148.
Mean values of heat fluxes perpendicular to the cliff faces as a function of the extra debris-view factor V e, as simulated for the lower stake sites on the (a) north-facing and (b) south-facing ice cliffs in 2010 to account for the effects of an ice-cored debris mound nearby.
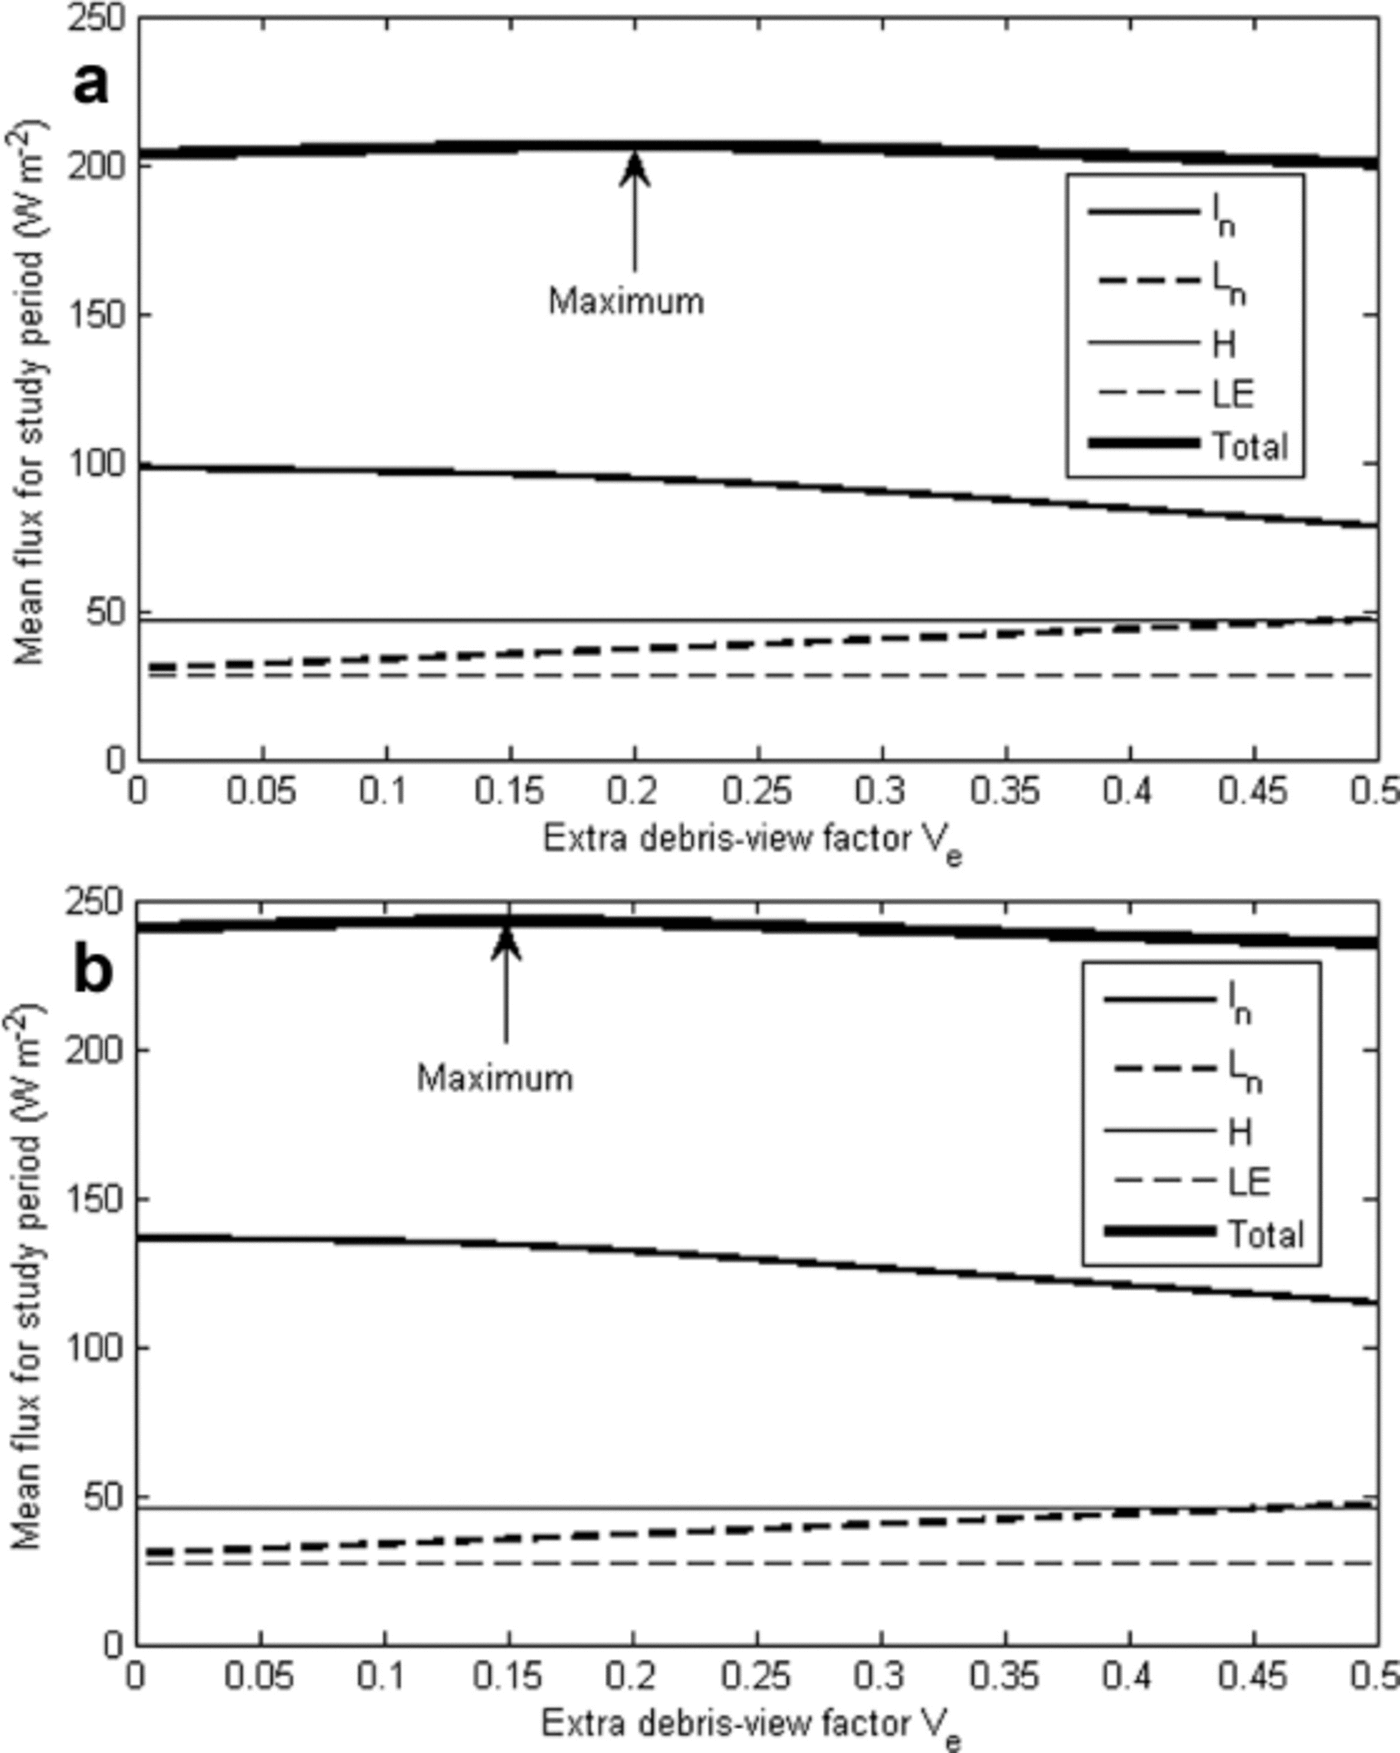
By examining the local topography (Fig. 2c), we estimate that V e should have a real maximum value around 0.1 for the bottom stakes on both the north- and south-facing ice cliffs. Given that, according to Figure 8, this value of V e would slightly increase the melt rate for sites lower on the cliffs, rather than decrease the melt rate as the data suggest, it might be concluded that longwave radiation from and shadowing by local topographic objects is not a significant factor in driving any observed differential ablation down a cliff face. Alternatively, the explanation may come from changes in the sensible (H) and latent (LE) heat fluxes. With the model in its current form, H and LE are unaffected by changes in V e, although it could be argued that in reality they would be affected by the debris mound interfering with wind speeds, turbulence and local surface roughness. These processes are highly complex, and a fully detailed simulation of them would be very difficult to justify in terms of model parsimony. Instead, the above approach of optimizing the effective roughness zf can be taken. The lower two rows in Table 4 show the results of optimizing zf for the bottom stakes on both cliffs, with V e set to the observed value of 0.1. For both cliffs, the optimized zf drops by a small amount, meaning the turbulent fluxes are lower. As argued above, this actually means the wind speed is lower, but has the interesting implication that shielding from the wind could effectively compensate for increased longwave from debris mounds.
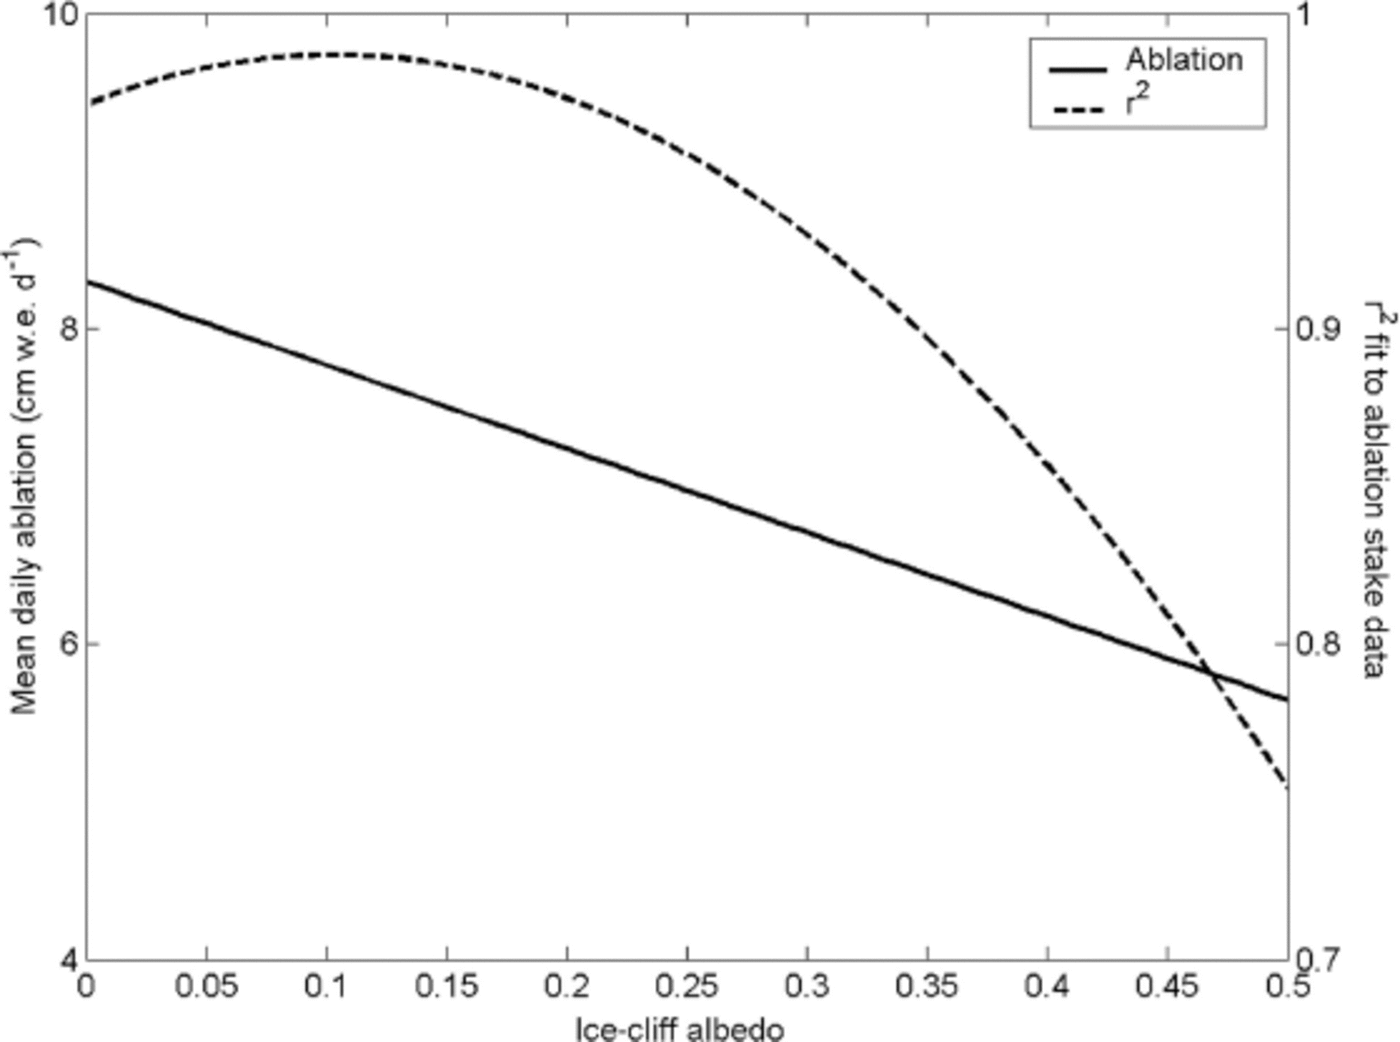
The final factor to consider is ice albedo. As stated earlier, measurements in 2011 showed no significant differences in albedo between different cliffs, or between different heights on the same cliff. However, visual observations show different areas of cliffs have different amounts of fine debris cover, or different amounts of meltwater running down them. A sensitivity analysis was performed to assess the impact that albedo variations might have on melt rates, and hence the evolving shape of an ice cliff. This was performed by running the model with values of αi between 0.1 and 0.5, and zf at the optimized values from Table 4. Figure 9 shows the changes in mean daily melt rate and goodness of fit for the top of the south-facing cliff. Because this is a fitted model, the goodness of fit decreases on either side of the default value of αi = 0.1 to a minimum of r 2 = 0.75 at αi = 0.5. The mean daily melt rate shows an approximately linear relationship to ice albedo, and the gradient of the line indicates that a decrease of 0.5 cm in melt – the difference between the top and bottom of the cliff as shown in Table 2 – would require a change in albedo of ~0.1. It seems unlikely that one would observe such a relatively large change in albedo for the ice cliff in question, where the slope difference between the top and bottom is just 10°. However, it is clear that ice albedo has a significant effect on melt rates, and future studies of ice cliffs would benefit from more albedo measurements.
Mean daily ablation and model goodness of fit as a function of ice-cliff albedo. The curves apply to ablation stake SCtop using the optimized parameter values shown in Table 4.
Given these results, we propose that to begin with, turbulent heat fluxes are lower towards the cliff base due to sheltering from the wind (Figure 8 shows that any increased melt at the bottom due to extra longwave from nearby debris mounds will be small in comparison). The top of the cliff therefore melts faster than the bottom and develops a shallower slope, meaning that it begins to receive more direct solar shortwave radiation and can support more small particles of debris that lower the surface albedo. Both these effects would further enhance melting towards the top of the cliff and contribute to cliff decay. However, one must consider the possibility that as the debris load increases due to slope decay, the debris would start to insulate the ice cliff from melting further (Reference Brock, Mihalcea, Kirkbride, Diolaiuti, Cutler and SmiragliaBrock and others, 2010; Reid and Reference Reid and BrockBrock, 2010). This implies there may be some critical slope angle at which the cliff will stop decaying and behave in a similar manner to the rest of the debris-covered glacier area. In some cases, most likely for M-type cliffs, sheltering of the cliff base may be insignificant, enabling a cliff to maintain a steep slope angle over several years.
Glacier-wide calculations
To calculate the total melt contribution of ice cliffs across the glacier identified in the DEM, a generalized model was required. In light of the above analysis, the extra debris factor V e was set to zero and ice-cliff albedo to 0.1. zf was re-optimized to fit the mean melt curves averaged from the three ablation stakes on each cliff (here the south-facing cliff was assigned a uniform slope of 528: the weighted mean based on its shape). The new optimum values of zf were 0.0023 m for the north-facing cliff and 0.0022 m for the south-facing cliff. In the absence of a better estimate, zf was assigned a value of 0.00225 m for all the cliffs on the glacier. We chose not to use the H2010 approach to turbulent fluxes – where roughness is dependent on cliff height and wind direction – for the reasons that most ice cliffs on Miage glacier are certainly not uniform in height along their lengths (e.g. Fig. 2), and that it is very difficult to distribute wind direction data across the glacier due to the complex topography.
The DEM processing described in Section 3 classified 1.3% of pixels within the debris-covered zone as ice cliffs (Fig. 1b). Values of slope, aspect and elevation were extracted for all these pixels; ablation was calculated for each cliff pixel by applying the relevant lapse rates to meteorological data and running the adapted melt model for the period 5–14 June 2010. Summing the calculated ablation for all the cliff pixels indicated a total runoff due to ice-cliff ablation of 2925 m3 d–1.
Accepting the considerable limitations in distributing the meteorological variables and applying a constant debris thickness, the distributed model for sub-debris melt provided an estimate of 37 178 m3 d–1 as the melt rate of the debris-covered zone if there were no ice cliffs. This implies that the ice cliffs provide ~7.4% of the total melt of the continuously debris-covered part of the ablation zone of Miage glacier, which has an area of ~3.1 km2. We argue that this number is an upper bound on the ice-cliff contribution, because it is likely that some of the pixels classified as cliffs in Figure 1b are actually moraine slopes, the sides of boulders, or steep slopes created by large piles of debris. However, the result highlights the disproportionate contribution of ice cliffs to ablation given their limited distribution on the glacier. This effect is exacerbated by the fact that the largest concentrations of ice cliffs are found on the lower glacier, where meteorological conditions are more conducive to melting.
7.4% is a lower contribution than that estimated by Sakai and others (2002) who found an ice-cliff ablation contribution of 20% for Lirung glacier, Nepal, but similar to that of H2010 who found 7.3% for Koxkar glacier, China. Any differences are likely related to the different numbers and distributions of ice cliffs per square kilometre of glacier; moreover, the relatively thin average debris cover of around 20–30 cm on the flat areas of Miage glacier (Reference Foster, Brock, Cutler and DiotriFoster and others, 2012) reduces melt rates less significantly than the thick (>1 m) debris cover on well-studied Asian glaciers; this indirectly lowers the percentage contribution of ice-cliff ablation at Miage.
5. Conclusions
In this paper we have adapted existing melt models to investigate the backwasting of ice cliffs and their contribution to ablation on Miage glacier. This is the first time such a high-resolution (1 m) DEM has been used to identify and characterize all ice cliffs across a debris-covered glacier, and certainly the first such study for a debris-covered glacier in the European Alps. The DEM, together with the models, provides an objective assessment of the total ice-cliff contribution to glacier melt during the ablation season, with the cliffs providing up to 7.4% of total ablation in the debris-covered part of the glacier despite covering only 1.3% of this area.
The measured backwasting rates of 61–75 mm d–1 in this study, while high, are not exceptional, in spite of the very low ice albedo measured (0.1) and high ambient air temperatures which average 10–118C at the AWS site. Part of the explanation is that steep slopes are oblique to direct incoming solar radiation in the summer months, when the sun is at low zenith angles during the middle hours of the day.
Backwasting is a complex process, and physical models require detailed treatment of radiative and turbulent fluxes that are heavily data-dependent. However, the model sensitivity analysis in this paper has indicated that some processes (e.g. the longwave emission from complex geometries of debris mounds and sheltering of lower parts of cliffs from the wind) could be neglected for large-scale studies. Modelled melt rates are more sensitive to slope angle and aspect, which can be derived from a high-resolution DEM as in this study, and albedo, for which more field measurements would be beneficial. The question of whether wind direction should be considered in more detail cannot be answered until glacier wind fields can be modelled accurately. Finally, a more detailed model for distributing short-wave radiation based on a regional DEM could constrain estimates of all-glacier melt rates.
As glaciers retreat and debris covers expand, backwasting will continue to be an important process. Future studies could make use of time-lapse photography, or repeat surveys with ground or airborne laser scanning to observe ice-cliff evolution in greater spatial resolution and over longer time periods.
Acknowledgements
This work was funded by the EU/FP7 ACQWA (Assessing Climate impacts on the Quantity and quality of WAter) project, the Carnegie Trust for the Universities of Scotland and the University of Dundee. The airborne lidar data were provided by the NERC Airborne Research and Survey Facility (projects GB07–09 and GB07–10) and processed by Michael Lim at Northumbria University. T. Reid is currently employed on NERC grant number NE/H008187/1 and we are grateful to Richard Essery for allowing him some time to work on this paper. The authors are extremely grateful to Fondazione Montagna Sicura, Courmayeur, Italy, for logistical assistance, and Catriona Fyffe, Martin Kirkbride and several undergraduate students from the University of Dundee who assisted with the fieldwork. We also thank two anonymous reviewers whose comments greatly improved the paper.


 Open access

