


1. Introduction
Quantifying the timing of ductile deformation is vital for evaluating the initiation, duration and rates of kinematic processes at all scales. Current methods for dating ductile deformation include those which are relative, i.e. dating using variable cross-cutting relationships to infer a sequence of events, and those which are absolute, i.e. quantifying the timing of dynamic recrystallization-driven and deformation-driven re-equilibration of radioisotopes in accessory phase geochronometers such as titanite (e.g. Tilton and Grunenfelder, Reference Tilton and Grunenfelder1968; Walters et al. Reference Walters, Cruz-Uribe, Song, Gerbi and Biela2022) or apatite (e.g. Dill, Reference Dill1994; Ribeiro et al. Reference Ribeiro, Lagoeiro, Faleiros, Hunter, Queiroga, Raveggi, Cawood, Finch and Campanha2020; Colleps et al. Reference Colleps, van der Beek, Amalberti, Sobel, Tremblay and Bernard2025; Tremblay et al. Reference Tremblay, Fayon, Guo, Zeitler and Idleman2025). Relative dating is limited by specimen availability with relevant cross-cutting context and can, thus, lack the resolution required to precisely bracket ductile deformation. Whereas absolute dating of accessory phases can bracket the timing of ductile deformation, but it is limited to specimens with appropriate mineralogy where the target geochronometers have actively re-equilibrated during deformation. Therefore, to expand the potential applicability of absolute dating, the identification of additional commonly occurring geochronometers that can record ductile deformation in a variety of rock types is required.
Mica phases are prime candidates for such a study as they readily participate in deformation, occur across a wide range of crustal conditions, and have the potential to record many different processes, including igneous crystallization, metamorphism/cooling and deformation (e.g. Olierook et al. Reference Olierook, Rankenburg, Ulrich, Kirkland, Evans, Brown, McInnes, Prent, Gillespie, McDonalad and Darragh2020; Wang et al. Reference Wang, Alard, Lai, Foley, Liu, Munnikhuis and Wang2022; Ribeiro et al. Reference Ribeiro, Kirkland, Finch, Faleiros, Reddy, Rickard and Hartnady2023a; Ribeiro et al. Reference Ribeiro, Kirkland, Kelsey, Reddy, Hartnady, Faleiros, Rankenburg, Liebmann, Korhonen and Clark2023b; Kellett et al. Reference Kellett, Larson and Skipton2024). Moreover, the improved time efficiency and spatial resolution of in situ beta decay-based geochronologic methods (e.g. Zack and Hogmalm, Reference Zack and Hogmalm2016), make it practical and cost-efficient to date mica using the Rb-Sr system (e.g. Olierook et al. Reference Olierook, Rankenburg, Ulrich, Kirkland, Evans, Brown, McInnes, Prent, Gillespie, McDonalad and Darragh2020; Wang et al. Reference Wang, Alard, Lai, Foley, Liu, Munnikhuis and Wang2022).
Dates derived from geochronometers typically indicate when diffusion of decay product (child) isotopes out of a mineral effectively ceased, often linked to the cooling of a mineral through its ‘closure temperature’ – the temperature at which further diffusion is highly inefficient (Dodson, Reference Dodson1973). Published estimates of the closure temperature of 87Sr in biotite and muscovite for typical grain sizes and cooling rates range between ∼350–450°C for biotite (e.g. Jäger et al. Reference Jäger, Niggli and Wenk1967; Verschure et al. Reference Verschure, Andriessen, Boelrijk, Hebeda, Maijer, Priem and Verdurmen1980; Del Moro et al. Reference Del Moro, Puxeddu, Di Brozolo and Villa1982; Blanckenburg et al. Reference Blanckenburg, Villa, Baur, Morteani and Steiger1989) and ∼500–600°C for muscovite (e.g. Jäger et al. Reference Jäger, Niggli and Wenk1967; Blanckenburg et al. Reference Blanckenburg, Villa, Baur, Morteani and Steiger1989; Freeman et al. Reference Freeman, Inger, Butler and Cliff1997). In addition to temperature, deformation can also play a role in facilitating diffusion by creating fast diffusion pathways within crystal lattices through the generation of interconnected dislocations, fractures, kink bands or ripplocations (Wilson and Bell, Reference Wilson and Bell1979; Bell and Wilson, Reference Bell and Wilson1981; Bell et al. Reference Bell, Wilson, McLaren and Etheridge1986; Kronenberg et al. Reference Kronenberg, Kirby and Pinkston1990; Mares and Kronenberg, Reference Mares and Kronenberg1993; Aslin et al. Reference Aslin, Mariani, Dawson and Barsoum2019). Moreover, fluids, with or without deformation, can further promote mineral alteration and enhance ion mobility (Mulch and Cosca, Reference Mulch and Cosca2004; Glodny et al. Reference Glodny, Kühn and Austrheim2008).
The effect of deformation and/or fluids on isotopic systems in alkali feldspar and mica has been investigated via in situ 40Ar/39Ar dating (e.g. Kellett et al. Reference Kellett, Warren, Larson, Zwingmann, van Staal and Rogers2016; Barnes et al. Reference Barnes, Schneider, Majka, Camacho, Bukała and Włodek2023; Neofitu et al. Reference Neofitu, Mark, O’Connell, Zack, Rösel, Mark, Barford, Flowerdew, Kelley and Daly2024). The 40Ar/39Ar and Rb-Sr isotopic systems in feldspar and mica have been shown to decouple (e.g. Kellett et al. Reference Kellett, Larson and Skipton2024; Neofitu et al. Reference Neofitu, Mark, O’Connell, Zack, Rösel, Mark, Barford, Flowerdew, Kelley and Daly2024), in some cases dramatically (i.e. Miocene vs Proterozoic; Larson et al. Reference Larson, Button, Shrestha and Camacho2023a), indicating that the mica chronometers have distinct sensitivities to (re-)equilibration.
To study the effect of mica deformation (i.e. lattice strain) on in situ Rb-Sr geochronology, we examine multiple rock specimens that contain large (>1 mm diameter) mica porphyroclasts (fish) and record deformation over a range of temperatures (i.e. greenschist to amphibolite conditions) (Figure 1). In these specimens, lattice distortion in the porphyroclasts is assessed using electron backscatter diffraction (EBSD), and major and trace elemental distributions are mapped by electron microprobe (EMPA) and laser ablation induced coupled plasma mass spectroscopy (LA-ICP-MS), respectively. Both the lattice distortion and elemental compositional maps are used to target locations of differing lattice distortion and to avoid mixing chemical domains for in situ Rb-Sr spot analyses. From these targeted analyses, we investigate the relationships between composition, lattice distortion and in situ Rb-Sr two-point spot dates in mica. These relationships elucidate how lattice strain and/or mica composition might influence Rb-Sr geochronology and under what conditions the different mica species may be used as deformation geochronometers.
Top: Cross-polarized photomicrographs showing quartz dynamic recrystallization textures.

2. Methods
To quantify lattice distortion within mica, lattice orientation data were collected using an Oxford Instruments Symmetry 3 EBSD system on a Tescan Mira 3 XMU scanning electron microscope (SEM) in Fipke Laboratory for Trace Element Research (FiLTER) at the University of British Columbia, Okanagan. Each analysed specimen had a ∼5 µm carbon coat applied to prevent charging. Analyses were completed using an operating voltage of 30 kV, beam current of 1 nA, a working distance of 20 mm, 70° specimen tilt and 10 μm step-size. The MATLAB toolkit, MTEX (Bachmann et al. Reference Bachmann, Hielscher and Schaeben2010), was used to denoise the EBSD data and create kernel average misorientation (KAM) maps using first-order kernel averaging and grain reference orientation deviation (GROD) maps. Polishing mica phases for EBSD analysis, which requires a flat surface, can be difficult. Polished thin sections (1000 grit) were further prepared by hand polishing with 0.25 µm diamond paste for 15 minutes and then 0.05 µm diamond paste for 15 minutes, and finally polishing for 5 minutes in an Advanced Materialography Saphir Vibro vibropolisher with 0.06 colloidal silica.
A Cameca SXFiveFE electron microprobe analyser was used to quantify the major element chemistry of mica porphyroclasts using both element oxide mapping and mineral spot analyses of Al2O3, Cl, F, FeO, K2O, MgO, MnO, Na2O, SiO2 and TiO2. Element maps were collected using an operating voltage of 15 kV with a beam size matching the step size of each map (S29: 6 µm, NP17-58: 4 µm, AC4: 8 µm), a current of ∼200 nA and a dwell time of 5 ms. Twenty-five quantitative spot measurements per porphyroclast were carried out using an operating voltage of 15 kV with a beam size of ∼5 μm, a current of 20 nA and a dwell time of 10 ms. Calibration standards include in-house oxides and Smithsonian mineral mounts from CF Minerals and Micro Analysis Consultants. These data were combined using XMapTools (Lanari et al. Reference Lanari, Vidal, De Andrade, Dubacq, Lewin, Grosch and Schwartz2014) to create quantitative element maps and Ti-in-biotite temperature maps (Henry et al. Reference Henry, Guidotti and Thomson2005). EMPA quantitative spot data, element distribution maps and transects are provided in the Supplementary Data.
Element maps of Al, Ba, Ca, Cs, Eu, Fe, K, La, Li, Lu, Mg, Mn, Na, Rb, Si, Sr, Ti and Y were collected using an Elemental Scientific Laser NWR 193 nm excimer laser with a TwoVol3 ablation cell paired with an Agilent 8900 tandem mass spectrometer (LA-ICP-MS/MS) in the FiLTER facility and processed using the Iolite software package v 4.10 (Paton et al. Reference Paton, Hellstrom, Paul, Woodhead and Hergt2011) to create semi-quantitative element maps. Laser element distribution maps and instrument settings are provided in the Supplementary Data.
In situ spot isotope analysis of Rb-Sr and Mg, Si, Ti, Fe, Cs, La and Yb utilized the same LA-ICP-MS/MS in the FiLTER facility following the methods detailed in Larson et al. (2023, Reference Larson, Dyck, Shrestha, Button and Najman2024, Reference Larson, Shrestha, Button, Cottle and Barnes2025) modified from those outlined in (Zack and Hogmalm, Reference Zack and Hogmalm2016; Hogmalm et al. Reference Hogmalm, Zack, Karlsson, Sjöqvist and Garbe-Schönberg2017). Instrument settings for Rb-Sr analysis are presented in the supplementary materials. Data were processed using the Iolite software package v 4.10 (Paton et al. Reference Paton, Hellstrom, Paul, Woodhead and Hergt2011) using the DRS developed by Larson (Reference Larson2024) and plotted using ChrontouR (Larson, Reference Larson2022). Determination of the integration periods of the ablation signals targeted portions of the signal with no significant changes in the Mg, Si, Ti, Fe, Cs, La and Yb, consistent with ablation of a single chemical domain. The glass reference material SRM NIST610 (Jochum et al. Reference Jochum, Weis, Stoll, Kuzmin, Yang, Raczek, Jacob, Stracke, Birbaum, Frick, Gunther and Enzweiler2011). Woodhead and Hergt (Reference Woodhead and Hergt2001) was used for primary isotope ratio normalization, background subtraction, drift correction and down-hole fractionation correction (as required), while the glass reference material SRM NIST612 (Jochum et al. Reference Jochum, Weis, Stoll, Kuzmin, Yang, Raczek, Jacob, Stracke, Birbaum, Frick, Gunther and Enzweiler2011). Woodhead and Hergt (Reference Woodhead and Hergt2001) was used with SRM NIST610 for pulse versus analogue detector mode cross-calibration. The difference between the measured and expected slopes of a regression through analyses of in-house reference phlogopite MICA-1O (986 ± 5 Ma, initial 87Sr/86Sr value of 0.7035 per Camacho et al. Reference Camacho, Lee, Zhao, Abdu, Fayek and Creaser2020) was used for matrix correction of all unknowns and reference materials. The uncertainty on the slope of the regression for MICA-1O was propagated in quadrature into the reported isochron dates.
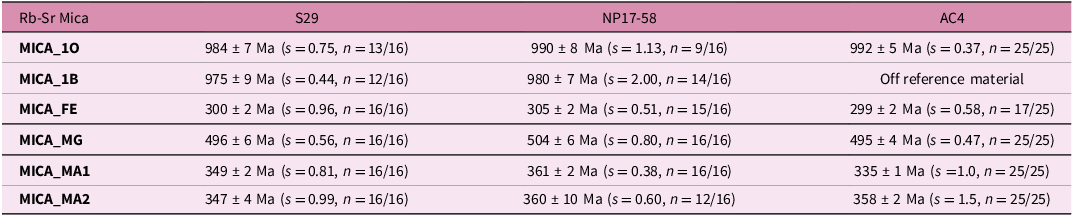
Secondary reference materials analysed included the nano-powders MICA-Fe (303 ± 2 to 316 ± 10 Ma; Govindaraju, Reference Govindaraju1979; Rösel and Zack, Reference Rösel and Zack2022; initial 87Sr/86Sr value of 0.709 per Turpin et al. Reference Turpin, Cuney, Friedrich, Bouchez and Aubertin1990) and Mica-Mg (518 ± 8 Ma, initial 87Sr/86Sr value of 0.726 per Hogmalm et al. Reference Hogmalm, Zack, Karlsson, Sjöqvist and Garbe-Schönberg2017). Other secondary reference materials included phlogopite MICA-1B (990 ± 6 Ma; Camacho et al. Reference Camacho, Lee, Fitz Gerald, Zhao, Abdu, Jenkins, Hawthorne, Kyser, Creaser, Armstrong and Heaman2012; initial 87Sr/86Sr value of 0.7035 per Camacho et al. Reference Camacho, Lee, Zhao, Abdu, Fayek and Creaser2020), and muscovites MICA-MA1 (340–360 Ma, initial 87Sr/86Sr value of 0.75; in-house reference material) and MICA-MA2 (340–360 Ma, initial 87Sr/86Sr value of 0.75; in-house reference material). Repeat analyses of these secondary reference materials yielded single population isochron dates (using the robust regression of Powell et al. Reference Powell, Green, Marillo Sialer and Woodhead2020) (Table 1). Reference materials were analysed with the laser parallel to the mica c-axis, which can cause basal cleavage plane flaking, resulting in increased signal variability and therefore lower data precision (Larson et al. Reference Larson, Shrestha, Button, Cottle and Barnes2025). The signal variability may also be amplified by chemical heterogeneity within these natural mica reference materials and for these reasons outlier secondary reference analyses were excluded while calculating isochron dates. Nano-powder reference materials and mica grains may have a minor matrix difference that could result in different down-hole fractionation, as shown in Glorie et al. (Reference Glorie, Gilbert, Hand and Lloyd2024). Rb-Sr data for reference materials and unknowns can be found in the supplemental materials.
Secondary reference material Rb-Sr dates

Due to the complexity of Rb-Sr systematics in mica, the isochron dates reported for each specimen were determined using the robust regression of Powell et al. (Reference Powell, Green, Marillo Sialer and Woodhead2020). This regression does not assume a Gaussian distribution of data like classical statistics (i.e. York regression) but instead focuses on how well the data define a ‘spine’, allowing for further complexity in the data (Powell et al. Reference Powell, Green, Marillo Sialer and Woodhead2020). For data that has a Gaussian distribution, the spine width (s), which is the normalized median absolute deviation of the distances of the datapoints to the regression line divided by the uncertainty of the distances, will converge on the classical statistics approach (e.g. 1, similar to mean squares weighted deviates). Moreover, and again akin to classical approaches, if s is larger than a threshold value for a given number of analyses, the data are considered to be over-dispersed and define an errorchron, for which the uncertainties have no significance (Powell et al. Reference Powell, Green, Marillo Sialer and Woodhead2020).
The robust regression of Powell et al. (Reference Powell, Green, Marillo Sialer and Woodhead2020) was fit through in situ Rb-Sr mica analyses and anchored by apatite and/or feldspar analyses, which were targeted in each specimen to inform the initial 87Sr/86Sr value. The apatite and feldspar were assessed petrographically to confirm apparent textural equilibrium with mica; 87Sr/86Sr reservoir equilibrium was confirmed when the data from those minerals fall along a single population regression with mica analyses. Individual spot dates were determined using IsoplotR (Vermeesch, Reference Vermeesch2018) using a two-point isochron between individual in situ Rb-Sr spot data and the initial 87Sr/86Sr value determined from the specimen isochron.
To determine the correlation between Rb-Sr spot dates, lattice distortion (KAM) and spot chemistry, principal component analysis (PCA) was completed for each analysed porphyroclast using the PCA function from the psych package (Revelle, Reference Revelle2024) in RStudio (Posit Team, 2024).
3. Specimen selection and deformation temperatures
For this study, a collection of archive specimens with previous geochronological, and, in some cases, microstructural information was selected for investigation based on the presence of large mica porphyroclasts that appear to have participated in deformation (e.g. undulose extinction, kink-banding or recrystallized grains). Specimens that contain large mica that participated in deformation were further narrowed by including only those specimens with evidence of quartz dynamic recrystallization (i.e. bulging, sub-grain rotation, grain boundary migration), which could be used to help link the deformation to a broad temperature range (e.g. Law, Reference Law2014). Three specimens (S29, NP17-58 and AC4) were chosen that fit the above criteria and that span a gradient of apparent deformation temperatures S29: Bulging [300–400°C], NP17-58: Sub-grain rotation [400–500°C] and AC4: Grain boundary migration [greater than 500°C].
3.a. S29 setting and deformation temperature
S29 was collected from a locally foliated part of the Tirich Mir pluton in the Hindu Kush of Northwest Pakistan (Faisal et al. Reference Faisal, Larson, King and Cottle2016). The Tirich Mir pluton is a subduction-related porphyritic granite interpreted to have crystallized continuously from 127 to 123 Ma (U-Pb zircon; Faisal et al. Reference Faisal, Larson, King and Cottle2016) with later deformation during Himalayan-related crustal shortening and/or anatexis, perhaps during the intrusion of the ca. 24 Ma Gharam Chasma pluton (Hildebrand et al. Reference Hildebrand, Noble, Searle, Waters and Parrish2001; Faisal et al. Reference Faisal, Larson, King and Cottle2016).
S29 has a mineral assemblage of Qz + Kfs + Pl + Bt + Ms and accessory Zrn + Ap + Ilm with secondary calcite and chlorite (mineral abbreviations based on Whitney and Evans, Reference Whitney and Evans2010). The mineralogy of this specimen differs from that of the other specimens in this study in that it contains both biotite and muscovite porphyroclasts as well as biotite and muscovite in the matrix. The quartz in the specimen occurs in two dominant textures (1) as small (1–25 µm diameter) grains adjacent to larger (>150 µm) grains and (2) small (5–30 µm) polygonal grains mantling larger parent grains (Figure 1). The former is consistent with dynamic recrystallization by bulging, while the latter is consistent with sub-grain rotation (Passchier and Trouw, Reference Passchier and Trouw2005). Quartz dynamic recrystallization dominated by bulging with minor subgrain rotation is consistent with deformation temperatures of ∼280–450°C (Stipp et al. Reference Stipp, Stünitz, Heilbronner and Schmid2002; Law, Reference Law2014), which are similar to a deformation temperature estimate of ∼403 ± 50°C based on the opening angle of a crossed-girdle quartz c-axis distribution from the same area (Larson et al. Reference Larson, Lamming and Faisal2014).
3.b. NP17-58 setting and deformation temperature
Specimen NP17-58 was collected from a foliated granite within the Eastern Highlands shear zone (EHSZ) exposed on Cape Breton Island, Nova Scotia (Piette-Lauzière et al. Reference Piette-Lauzière, Larson, Kellett, Harris, Cleven and Rogers2024). The EHSZ is interpreted to have initiated during the Acadian Orogeny between 420 and 399 Ma, reactivated 385–367 Ma and experienced variable fluid infiltration and brittle-ductile deformation between 363 and 339 Ma (Piette-Lauzière et al. Reference Piette-Lauzière, Larson, Kellett, Harris, Cleven and Rogers2024). A 204Pb-corrected 206Pb/238U zircon date of 370 ± 1 Ma and in situ 40Ar/39Ar muscovite weighted mean date of 374 ± 1 Ma were calculated for specimen NP17-58, both of which were interpreted as resetting during reactivation of the EHSZ (Piette-Lauzière et al. Reference Piette-Lauzière, Larson, Kellett, Harris, Cleven and Rogers2024). Monazite in the specimen was also dated by U-Pb and yielded a lower intercept date of 355 ± 6 Ma, interpreted to reflect late fluid modification (Piette-Lauzière et al. Reference Piette-Lauzière, Larson, Kellett, Harris, Cleven and Rogers2024).
Specimen NP17-58 has a mineral assemblage of Qz + Kfs + Pl + Ms and accessory Zrn + Ap + Mnz with secondary calcite and chlorite. Quartz generally occurs as small (10–50 µm) polygonal-shaped grains mantling larger parent grains characterized by undulose extinction (Figure 1). These textures are consistent with dynamic recrystallization by sub-grain rotation (Passchier and Trouw, Reference Passchier and Trouw2005) and a broad deformation temperature range of 400–550°C (Stipp et al. Reference Stipp, Stünitz, Heilbronner and Schmid2002; Law, Reference Law2014).
3.c. AC4 setting and deformation temperature
Specimen AC4 was collected from a metapelite within the Flinton group, a part of the Mazinaw domain in Southern Ontario (Same outcrop as HW07-14, 16a and 17; Wolczanski, Reference Wolczanski2017). The Flinton group is interpreted to have been buried and metamorphosed during the Grenville (Ottawan) orogeny (1090–980 Ma), with a specimen collected near the location of AC4 reaching peak metamorphic conditions of 4.5–6.5 kbar and 540–650°C at 976 ± 4 Ma (U-Pb Mnz; McCarron et al. Reference McCarron, Gaidies, McFarlane, Easton and Jones2014). Specimens from the same outcrop as AC4 returned biotite porphyroclast 40Ar/39Ar dates of 941 ± 6 to 938 ± 6 Ma that are interpreted as cooling/exhumation at ∼940 Ma and matrix muscovite 40Ar/39Ar dates of 901 ± 7 to 897 ± 7 Ma that are interpreted to record fluid influx and new muscovite growth associated with activity on the nearby Robertson Lake Shear Zone (Wolczanski, Reference Wolczanski2017).
Specimen AC4 has a mineral assemblage of Ms + Bt + Grt + Qz + Ilm with secondary calcite and chlorite. Though this specimen contains both biotite and muscovite, as noted above, the muscovite is secondary, restricted to the matrix, and as such, this study only targets the biotite. The majority of quartz exhibits grain boundary pinning and window structures (Figure 1). These textures are consistent with quartz dynamic recrystallization by grain boundary migration and deformation temperatures of 500–700°C (Stipp et al. Reference Stipp, Stünitz, Heilbronner and Schmid2002; Law, Reference Law2014).
4. Mica porphyroclast lattice distortion
The largest biotite and/or white mica porphyroclasts with evident undulose extinction, fracturing, and/or kink banding in each specimen were analysed by EBSD (Figure 2). For each specimen, two biotite and/or white mica porphyroclasts with the highest KAM and GROD values were targeted for further analyses. KAM and GROD values typically correlate to deformation of the mineral lattice, with GROD showing larger grain-scale deformation and KAM showing more localized lattice deformation, potentially due to high dislocation density (i.e. dislocation wall), fracturing, kink planes or ripplocations. Because KAM maps may be able to identify localized mineral lattice defects, which may act as fast diffusion pathways, they were chosen as the primary mineral lattice distortion variable for comparison with mineral chemistry and in situ Rb-Sr spot dates, though the same analyses with GROD values have been included in the supplemental materials.
Kernel average misorientation (KAM) maps of all analysed mica porphyroclasts with correlating cross-polarized photomicrograph.

In S29, one representative biotite porphyroclast and one representative muscovite porphyroclast were chosen for further analyses (Fig. S1). Within the biotite porphyroclast, KAM values are highest (i.e. 7.6) near, but not along the grain boundaries and along basal cleavage, while lowest (i.e. approaching 0) within the interior of the grains (Figure 2a). Similarly, the muscovite porphyroclast also has the highest KAM values (i.e. 8.8) near grain boundaries, while the lowest KAM values (i.e. approaching 0) are within the interior of the grain (Figure 2b).
Two representative muscovite porphyroclasts were analysed in NP17-58 (Fig. S1). In muscovite porphyroclast 1, the highest KAM values (porphyroclast 1: 9.7) occur near the grain boundaries and subparallel to basal cleavage, while the lowest KAM values (i.e. approaching 0) occur within the grain interior (Figure 2c). In muscovite porphyroclast 2, the highest KAM values (porphyroclast 2: 6.2) occur near the grain boundaries and parallel to undulose extinction bands, while the lowest KAM values (i.e. approaching 0) occur within the grain interior (Figure 2d).
Both representative biotite porphyroclasts examined in specimen AC4 (Fig. S1) show the highest KAM values (porphyroclast 1: 8.0, porphyroclast 2: 7.8) near grain boundaries, at the grain tips, and parallel to basal cleavage, whereas the lowest KAM values (i.e. approaching 0) occur within the grain interior (Figure 2e, f).
5. Porphyroclast compositional maps
Element oxide and element concentration maps of the biotite porphyroclast in specimen S29 have higher concentrations of FeO, TiO2 and Ba in grain interiors, while Al2O3, MgO, Li and Cs are more abundant in grain rims (Figure 3a, supplemental data). Cl, F, K2O, MnO, Na2O and SiO2 have virtually no variation (Figure 3a, supplemental data). Titanium-in-biotite temperatures, calculated using the relationship of Henry et al. Reference Henry, Guidotti and Thomson2005 from quantitative Fe, Al, Mg, Ti and Si maps within XMapTools, are generally lower in areas of higher KAM value and near grain boundaries (Figures 2a and 3a) than those from grain interiors associated with low KAM values. The Ti-in-biotite temperatures from grain boundaries and areas of high KAM values define a range of ∼350–400°C, similar to quartz dynamic recrystallization deformation temperatures of ∼350–450°C (Law, Reference Law2014; Stipp et al. Reference Stipp, Stünitz, Heilbronner and Schmid2002) for this specimen (Figure 3a). Element oxide maps of the muscovite porphyroclast in specimen S29 show enhanced Al2O3, Na2O, TiO2 and Ba in the grain interior, while FeO, MgO, K2O, Li and Cs are more concentrated in the grain rim (Figure 4a, supplemental data). Chlorine, F, MnO and SiO2 have no apparent variation (Figure 4a, supplemental data).
Element oxide maps of biotite porphyroclasts with element oxide zoning pattern for FeO, K2O, TiO2 and Na2O, and Ti-in-biotite thermometer temperatures.

Element oxide maps and parts per million map of muscovite porphyroclasts with element zoning pattern for MgO, K2O, Al2O3 and Cs (ppm).

Element oxide and element concentration maps of muscovite porphyroclast 1 in specimen NP17-58 show that one side of the grain has higher concentrations of FeO, MgO and Ba and lower concentrations of Al2O3, TiO2, Li and Cs, while the other half shows the opposite relationship (Figure 4b,c, supplemental data). Chlorine, F, K2O, MnO and SiO2 have no variation across the porphyroclast (Figure 4b,c, supplemental data). Element oxide and element concentration maps of muscovite porphyroclast 2 in the same specimen show higher concentrations of Al2O3, Na2O and TiO2 in the grain interior, while FeO, MgO, K2O, Li, Cs and Ba have higher concentrations in the rim (Figure 4b,c, supplemental data). Chlorine, F, MnO and SiO2 show no variation (Figure 4b,c, supplemental data).
Element oxide and element concentration maps of both biotite porphyroclasts in specimen AC4 show that Fe, Mn and Na are more abundant in grain interiors, while K, Mg and Ti are more concentrated in grain rims (Figure 3b,c, supplemental data). Barium matches the distribution of Fe, Mn and Na, but only in biotite porphyroclast 1. Iron in both porphyroblasts is highest along basal cleavage, while K is significantly depleted in those same areas. Aluminium, Si and Cs show minor variation across the porphyroclasts with no apparent pattern, whereas Cl and F do not appear to vary within each grain (Figure 3b,c, supplemental data). Titanium-in-biotite temperatures of 500–550°C in areas of high KAM values and near grain boundaries (Figures 2 and 3) are lower than those from the rest of the grain, consistent with deformation and/or diffusion (fluid-assisted?) induced re-equilibration. The 500–550°C Ti-in-biotite temperature range from deformed regions overlaps that estimated from quartz textures of 500–700°C (Stipp et al. Reference Stipp, Stünitz, Heilbronner and Schmid2002; Law, Reference Law2014).
6. In situ Rb-Sr geochronology
Elemental oxide and elemental maps were used for targeting in situ Rb-Sr dating analyses of mica porphyroclasts. A range of compositions was targeted, and locations of individual laser spots were chosen to avoid mixing compositional domains. All three specimens contain both large mica porphyroclasts (>1 mm) and distinct smaller mica grains (<0.5 mm), which are referred to as matrix grains hereafter. Therefore, matrix mica grains were also targeted for comparison with porphyroclast results.
6.a. S29 (Granite, greenschist conditions) Rb-Sr geochronology and chemistry
S29 contains both biotite and muscovite porphyroclasts as well as biotite and muscovite matrix grains. Sixty analyses of the biotite porphyroclast and 25 of apatite/feldspar do not form a single population isochron (Figure 5). Calculating a robust regression (Powell et al. Reference Powell, Green, Marillo Sialer and Woodhead2020) through the data results in an errorchron with individual analyses spreading between reference isochrons of ca. 65 and 25 Ma (Figure 5). Matrix biotite has a similar distribution of Rb-Sr spot data as the biotite porphyroclast analyses, with a regression through 61 analyses of matrix biotite and the same low radiogenic phases resulting in an errorchron with individual analyses spreading between the same reference isochrons (Figure 5). Major and trace element spot chemistries measured with Rb-Sr isotopes in biotite porphyroclasts and matrix grains form dispersed groupings in Si-Fe-Mg and Li-Ti-Cs ternary space (Figure 5).
S29 inverse isochron plots of porphyroclast and matrix mica Rb-Sr isochrons (a). Major and trace element spot chemistry ternaries plotted with distinguished mica porphyroclasts and matrix grain data (b). Mica porphyroclasts with spread in data are fit with inferred isochrons to bracket the range of spot dates.

Unlike the errorchron regressions through the biotite data, 62 analyses of muscovite porphyroclasts, paired with the same low radiogenic phases (feldspar and apatite) utilized for the biotite regressions, define a single population isochron at 112.2 ± 2.7 Ma (2SE; s = 0.65) (Figure 5). Even though the muscovite Rb-Sr spot data define a single statistical population, individual analyses spread between bracketing reference isochrons of ca. 130 and 65 Ma (Figure 5). Sixty analyses of muscovite matrix grains paired with the same low radiogenic phases define an overlapping single population isochron of 110.7 ± 2.6 Ma (2SE; s = 0.65). The individual analyses of matrix muscovite spread between bracketing reference isochrons of ca. 130 and 30 Ma (Figure 5). Major and trace element spot chemistries for the muscovite porphyroclast and matrix grains form more dispersed groupings than biotite in Si-Fe-Mg and Li-Ti-Cs ternary space (Figure 5).
6.b. NP17-58 (Granite, amphibolite conditions) Rb-Sr geochronology and chemistry
Analyses of muscovite in specimen NP17-58 define single population isochrons for both porphyroclasts and matrix grains. Forty-eight analyses in muscovite porphyroclast 1, paired with eight feldspar analyses, define an isochron of 394.9 ± 3.6 Ma (2SE; s = 0.58). The results of 60 analyses in muscovite porphyroclast 2 paired with the same feldspar analyses produce an overlapping isochron at 394.8 ± 3.5 Ma (2SE; s = 0.42) (Figure 6). The 60 matrix muscovite analyses paired with the same low radiogenic analyses define an isochron date of 389.4 ± 3.5 Ma (2SE; s = 0.52) (Figure 6).
NP17-58 inverse isochron plots of porphyroclast and matrix mica Rb-Sr isochrons (a). Major and trace element spot chemistry ternaries plotted with distinguished mica porphyroclasts and matrix grain data (b).

While the muscovite porphyroclasts and matrix grains yielded similar Rb-Sr dates, the associated spot chemistries in Si-Fe-Mg ternary space form a distinct distribution for porphyroclast 1 compared to porphyroclast 2 and the matrix grains. (Figure 6) Those distributions are in contrast with the trace element chemistries for the analyses plotted in Li-Ti-Cs ternary space, which are dispersed with no apparent organization (Figure 6).
6.c. AC4 (Metapelite, amphibolite conditions) Rb-Sr spot dates and chemistry
Analyses of individual biotite porphyroclasts in specimen AC4 produce distinct, single-population isochrons (Figure 7). Fifty-nine analyses in biotite porphyroclast 1, paired with 5 apatite analyses, define a single population isochron of 924.3 ± 5.5 Ma (2SE; s = 0.64). Fifty-seven analyses from biotite porphyroclast 2, and the same low radiogenic analyses, define an isochron at 901.7 ± 5.5 Ma (2SE; s = 0.77). Finally, thirty-six matrix biotite mica analyses and 5 apatite analyses define an isochron at 892.8 ± 6.0 Ma (2SE; s = 0.33) (Figure 7).
AC4 inverse isochron plots of porphyroclast and matrix mica Rb-Sr isochrons (a). Major and trace element spot chemistry ternaries plotted with distinguished mica porphyroclasts and matrix grain data (b).

Major element spot chemistries for both biotite porphyroclasts and biotite matrix grains form groupings in Si-Fe-Mg ternary space with a slight offset of the matrix grain chemistries from the porphyroclasts (Figure 7). Trace element spot chemistries plotted in Li-Ti-Cs ternary space, however, have distinct distributions for each porphyroclast and the matrix grains (Figure 7). The trace element chemistries show average Li decreasing from 138 ppm in the oldest porphyroclast to 111 ppm in the young matrix grains.
7. Principal component analysis
Mica porphyroclasts in all specimens have the highest lattice distortion near their grain boundaries and typically have core-to-rim compositional variations (Figures 2–4). Overlaying in situ Rb-Sr two-point isochron spot dates atop KAM maps of the porphyroclasts in S29 shows there is spatial variation in Rb-Sr spot dates, with the younger dates generally associated with areas of higher KAM values, such as near grain boundaries and along basal cleavage (Figure 8).
In situ Rb-Sr spot dates overlaying corresponding KAM maps.

To quantitatively investigate the relationship between in situ Rb-Sr spot dates, lattice distortion and spot chemistry in both biotite and muscovite porphyroclasts, a principal component analysis (PCA) for each porphyroclast analysed was completed (Figure 9). Elements used in the PCA were collected concurrently with Rb-Sr spot data, and KAM values are derived from taking the average of all pixels within the spot analysis region on the KAM map. Note, data for creating KAM maps were only collected for porphyroclasts and not for matrix grains. Therefore, a PCA biplot was calculated for porphyroclasts and matrix grain data separately (Figures 9 and 10). PCA was also carried out using GROD values; the results mirror those of KAM discussed below (Fig. S3).
Mica Porphyroclast PCA biplots with correlations between in situ Rb-Sr spot dates, lattice distortion (KAM), and composition.

Mica Matrix grain PCA biplots with correlations between in situ Rb-Sr spot dates, lattice distortion (KAM), and composition.

In PCA plots, the strength of positive or inverse correlations between variables is depicted by the angular relationship between the arrows corresponding to each variable (Bakker, Reference Bakker2023). Therefore, arrows near parallel pointing in the same direction have the strongest positive correlation, whereas arrows near parallel pointing in the opposite directions have the strongest inverse correlation. Arrows near orthogonal have very weak to no correlation.
7.a. S29 (Granite, greenschist conditions) PCA
In situ Rb-Sr spot dates from biotite (porphyroclast and matrix) in the S29 range from 65 to 25 Ma (Figure 5). PCA of Rb-Sr spot dates, spot chemistry and KAM for the S29 biotite porphyroclast shows that Rb-Sr spot dates have a strong positive correlation with 87Sr and a strong inverse correlation with KAM (Figure 9a). As for S29 biotite matrix grains, Rb-Sr dates also have a strong positive correlation to 87Sr and a strong inverse correlation to Li and Yb (Figure 10a). Rb-Sr spot dates for muscovite (porphyroclast and matrix) in S29 range from 130 to 30 Ma (Figure 5). Rb-Sr spot dates for the S29 muscovite porphyroclast show a strong positive correlation with 86,88Sr and 87Sr, and a strong inverse correlation with KAM (Figure 9b). While S29 muscovite matrix grains show Rb-Sr spot dates that only have a strong positive correlation with Cs (Figure 10b).
7.b. NP17-58 (Granite, amphibolite conditions) PCA
Unlike the previous specimen, the in situ Rb-Sr data for NP17-58 muscovite porphyroclasts and matrix grains define spot dates with a narrow range between ca. 405 and 375 Ma that form a single population weighted mean date at 393 ± 1 Ma (MSWD = 1, n = 163/168) (Figure 6). Given the lack of significant variation in dates, PCA-derived correlations between Rb-Sr spot dates and the various other metrics are not expected to be robust. PCA analysis for NP17-58 porphyroclasts shows Rb-Sr spot dates have no positive correlation with any other variable but have a strong inverse correlation with La, Mg, Cs, 87Sr, Fe and 85,87Rb (Figure 9c). NP17-58 muscovite matrix grains show Rb-Sr spot dates only have a strong inverse correlation with Mg, Fe, Li and 87Sr (Figure 10c).
7.c. AC4 (Metapelite, amphibolite conditions) PCA
In situ Rb-Sr data from AC4 biotite porphyroclasts define slightly over-dispersed spot dates that range from 965 to 890 Ma for porphyroclast 1 (weighted mean date = 924 ± 6 Ma, MSWD = 2.5, n = 59/59) (Figure 7) and from 930 to 865 Ma for porphyroclast 2 (weighted mean date = 902 ± 6 Ma, MSWD = 3, n = 56/57), respectively (Figure 7). Biotite matrix grains spot dates (925 to 850 Ma) define a single weighted mean population at 893 ± 6 Ma (MSWD = 1.5 for n = 35; Wendt and Carl, Reference Wendt and Carl1991) (Figure 7). Like NP17-58, due to the lack of significant variation in dates, PCA-derived correlations between Rb-Sr spot dates and the various other metrics are not expected to show any correlation. PCA analysis of AC4 biotite porphyroclasts shows that Rb-Sr spot dates have a strong positive correlation to La and a strong inverse correlation to Mg, Si and 86,88Sr (Figure 9d). While AC4 biotite matrix grain Rb-Sr spot dates have a strong positive correlation with 86,88Sr and a strong inverse correlation with Li (Figure 10d).
8. Discussion
8.a. S29 – Tirich Mir pluton, Pakistan
Spot Rb-Sr dates for both muscovite porphyroclasts and matrix grains are plotted on kernel density estimation (KDE) plots to visualize their distribution and quantify populations within the data. Gaussian demixing (Figure 10; Galbraith, Reference Galbraith2005; Vermeesch, Reference Vermeesch2012) of muscovite porphyroclast spot dates defines two major peaks centred at 120 ± 4 Ma and 107 ± 3 Ma and one broad minor peak at 75 ± 8 Ma (2SE, bandwidth: 3, binwidth: 4; Figure 11). Similar treatment of muscovite matrix grain spot dates outlines one prominent peak at 113 ± 2 Ma and three minor peaks at 128 ± 8 Ma, 86 ± 4 Ma and 41 ± 2 Ma (2SE, bandwidth: 3, binwidth: 4; Figure 10). The primary spot date distribution peaks are similar to their respective isochron dates (i.e. porphyroclast: 112.2 ± 2.7 Ma, matrix: 110.7 ± 2.6 Ma; Figure 5). The older peaks in muscovite spot dates (ca. 130, 120 and 128 Ma) approximate the timing of pluton crystallization (i.e. 123 to 127 Ma; (Faisal et al. Reference Faisal, Larson, King and Cottle2016)), whereas other peaks (ca. 107 and 113 Ma) likely record partial re-equilibration of the Rb-Sr system. This partial resetting most likely occurred during a ca. 111 Ma muscovite recrystallization event identified by Heuberger et al. (Reference Heuberger, Schaltegger, Burg, Villa, Frank, Dawood, Hussian and Zanachi2007) and Faisal et al. (Reference Faisal, Larson, Camacho and Coutand2018), which has been attributed to crustal thickening during prolonged convergence (Soret et al. Reference Soret, Larson, Cottle, Smit, Johnson, Shrestha and Faisal2019). The younger muscovite spot dates, which extend towards Cenozoic time, likely record variable resetting during Himalayan-related crustal shortening and/or anatexis, a phenomenon also noted in mica Rb-Sr data in the Hindu Raj area to the east (Larson et al. Reference Larson, Dyck, Faisal, Cottle and Searle2023b). Spot dates from the biotite porphyroclast define one major peak at 39 ± 1 Ma and two minor peaks at 28 ± 1 Ma and 51 ± 1 Ma (2SE) (bandwidth: 3, binwidth: 4; Figure 11), whereas matrix biotite spot dates define major peaks at 37 ± 1 Ma and 47 ± 1 Ma and minor peaks at 57 ± 1 Ma and 24 ± 1 Ma (2SE) (bandwidth: 3, binwidth: 4; Figure 10). The youngest biotite spot dates are consistent with complete re-equilibration/recrystallization during Himalayan-related crustal shortening and/or anatexis, perhaps during the synkinematic intrusion of the ca. 24 Ma Gharam Chasma pluton (Faisal et al. Reference Faisal, Larson, King and Cottle2016; Hildebrand et al. Reference Hildebrand, Noble, Searle, Waters and Parrish2001). The oldest spot dates in the biotite porphyroclast and matrix grains (60 and 64 Ma; Table S1) overlap the youngest muscovite spot dates and, similarly, may reflect partial resetting. The difference in the range of in situ Rb-Sr dates for biotite and muscovite (Table S1) likely reflects higher retentivity of Sr in muscovite (e.g. Lange et al. Reference Lange, Bröcker, Mezger and Don2002; Şengün et al. Reference Şengün, Bertrandsson Erlandsson, Hogmalm and Zack2019; Larson et al. Reference Larson, Button, Shrestha and Camacho2023a) and/or neoblastic growth of biotite during Himalayan orogenesis.
Kernel density estimation plots of Rb-Sr spot dates with Gaussian demixing (Vermeesch, Reference Vermeesch2012) dates (2SE) noted.

PCA biplots show that both the biotite and muscovite porphyroclasts and matrix grain Rb-Sr spot dates have an inverse correlation with lattice distortion (KAM) (Figures 9a,b and 10a,b), indicating that this partial resetting of 87Sr is deformation-controlled (i.e. 87Sr diffusion occurring more rapidly along fast diffusion pathways marked by areas of high KAM value). The single-population isochrons for the S29 muscovite porphyroclast and matrix grains, compared to errorchrons for the biotite porphyroclast and matrix grains, indicate that the Rb-Sr systematics in biotite are more easily reset and/or reactive to fluid than in muscovite, similar to the Ar-Ar system as seen in Harrison et al. (Reference Harrison, Duncan and McDougall1985, Reference Harrison, Célérier, Aikman, Hermann and Heizler2009).
8.b. NP17-58 – Granite in Eastern Highlands Shear Zone, Nova Scotia
NP17-58 muscovite porphyroclasts and matrix grains yield clustered Rb-Sr data that define single population isochrons (porphyroclast 1: 394.9 ± 3.6 Ma, porphyroclast 2: 394.8 ± 3.5 Ma, matrix: 389.4 ± 3.5 Ma; Figure 6) that are within the uncertainty of dates defined by Gaussian demixing (Figure 10; Galbraith, Reference Galbraith2005; Vermeesch, Reference Vermeesch2012) of their respective muscovite spot dates (porphyroclast 1: 396 ± 2 Ma, porphyroclast 2: 395 ± 2 Ma, matrix: 390 ± 1 Ma; Figure 11). These in situ Rb-Sr dates are older than the 204Pb-corrected 206Pb/238U zircon weighted mean date (370 + 1 Ma) and the muscovite in situ 40Ar/39Ar weighted mean date (374 ± 1 Ma), reported by Piette-Lauzière et al. (Reference Piette-Lauzière, Larson, Kellett, Harris, Cleven and Rogers2024), which they interpret to record crystallization and cooling, respectively. The published zircon U-Pb data, however, are heterogeneous. The 204Pb-corrected 206Pb/238U zircon dates with propagated external uncertainties have a stair-step pattern with two poorly defined plateaus, one at 374 ± 2 Ma comprising nine analyses and an older plateau, comprising five analyses at 389 ± 2 Ma (Fig. S4). The older zircon U-Pb population overlaps the Rb-Sr dates (porphyroclast 1: 394.9 ± 3.1 Ma, porphyroclast 2: 394.8 ± 2.9 Ma, matrix: 389.4 ± 2.9 Ma), indicating that the Rb-Sr data likely preserve the timing of pluton crystallization and are decoupled from the 40Ar/39Ar systematics (e.g. Kellett et al. Reference Kellett, Larson and Skipton2024). The single-population Rb-Sr dates across textural positions stand in contrast to the spread in lattice distortion (KAM) values, indicating that Rb-Sr systematics are decoupled from lattice distortion within the muscovite of this specimen. These results echo those reported from white mica in mylonites within the Taxaquara shear zone by Ribeiro et al. (Reference Ribeiro, Kirkland, Finch, Faleiros, Reddy, Rickard and Hartnady2023a).
8.c. AC4 – Metapelite of Flinton Group, Ontario
AC4 biotite porphyroclasts and matrix grains yield clustered Rb-Sr data that define single population isochrons (porphyroclast 1: 924.3 ± 5.5 Ma, porphyroclast 2: 901.7 ± 5.5 Ma, matrix: 892.8 ± 6.0 Ma; Figure 7) that are within the uncertainty of dates defined by Gaussian demixing (Figure 10; Galbraith, Reference Galbraith2005; Vermeesch, Reference Vermeesch2012) of their respective muscovite spot dates (porphyroclast 1: 925 ± 2 Ma, porphyroclast 2: 898 ± 2 Ma, matrix: 892 ± 3 Ma; Figure 11). Element maps of both AC4 biotite porphyroclasts analysed show that areas along basal cleavages have increased Fe and a corresponding decrease in K, which is consistent with partial chloritization (Figure 3). Trace element chemistries for both porphyroclasts, and the matrix grains, tend to form distinct groupings in Li-Ti-Cs ternary space (Figure 7), predominantly due to differing amounts of Li. Diverging Li content may indicate differing fluid interaction/modification, consistent with differences in Rb-Sr geochronological data; porphyroclast 1 (high Li): 924.3 ± 5.5 Ma, porphyroclast 2 (moderate Li): 901.7 ± 5.5 Ma, matrix (low Li): 892.8 ± 6.0 Ma. The changing Li and Rb-Sr dates are interpreted to reflect varying degrees of fluid-mediated alteration and re-equilibration of the Rb-Sr system.
An 40Ar/39Ar biotite date from the same outcrop as AC4, interpreted as a cooling age by Wolczanski (Reference Wolczanski2017), overlaps within externally propagated uncertainty of the Rb-Sr date for the biotite porphyroclast (40Ar/39Ar biotite date 938 ± 8 Ma, Rb-Sr date porphyroclast 1: 924.3 ± 6.5 Ma), indicating that the Rb-Sr data in biotite porphyroclast 1 records the same event as the 40Ar/39Ar data. Muscovite 40Ar/39Ar data from the same outcrop is younger at 897 ± 9 Ma and is interpreted to reflect a late fluid event (Wolczanski, Reference Wolczanski2017). The muscovite 40Ar/39Ar date overlaps data from both biotite porphyroclast 2 and the biotite matrix (porphyroclast 2: 901.7 ± 5.5 Ma, matrix: 892.8 ± 6.0 Ma), consistent with those Rb-Sr data reflecting fluid-mediated modification.
9. Conclusions
The results of this study indicate that, at greenschist conditions, deformation appears to be the primary influence on the Rb-Sr systematics of both biotite and muscovite. Whether this observation is broadly applicable or limited to specimen S29 is yet unknown. In contrast, specimens NP17-58 and AC4, which deformed at amphibolite conditions, show limited correlation between deformation and age. White mica in NP17-58 (deformed at lower amphibolite conditions) records the timing of its initial syn-kinematic emplacement and suggests that temperature and/or fluids primarily influenced its recorded Rb-Sr dates. Whereas a single biotite porphyroclast from AC4 (deformed at upper amphibolite conditions) records cooling and is influenced mainly by temperature and/or fluids, while another biotite porphyroclast and matrix biotite in this specimen record younger Rb-Sr dates that are primarily influenced by fluids. Notably, the results herein confirm that white mica is generally more resilient to Sr loss than biotite. This research confirms that in situ Rb-Sr mica geochronology of deformed specimens is complex, requiring careful consideration of the mica phase analysed, the temperatures experienced throughout the rock history, potential fluid interactions and the finite deformation history.
Supplementary material
The supplementary material for this article can be found at https://doi.org/10.1017/S0016756826100685
Acknowledgements
We want to thank Drs. Shah Faisal, Nicolas Piette-Lauzière and Alfredo Camacho for providing specimens for this study. As well as Drs. Supdip Shresta and Mark Button for assistance in collection of EBSD, EMPA and LA-ICP-MS data. We thank Dr. Nathan Cleven for providing funding through the GEM-GeoNorth program of the Geological Survey of Canada. As well as Dr. Chris Mark, Dr. Bruno Ribeiro, and an anonymous reviewer for constructive feedback on this paper.
Competing interests
The authors declare none.


 Open access