


Introduction
Melon (Cucumis melo L.) is a high-value, specialty crop often cultivated in semi-arid environments around the world, including the western United States (Ezzo et al., Reference Ezzo, Mohamed, Glala and Saleh2020; Fabeiro et al., Reference Fabeiro, Martõ, De, Olalla and De Juan2002; Fila et al., Reference Fila, Zeinalipour, Badeck, Delshad and Ghashghaie2019; Yavuz et al., Reference Yavuz, Seymen, Yavuz, Çoklar and Ercan2021), where multiyear droughts can constrain water availability for irrigation (Acevedo et al., Reference Acevedo, Waterhouse, Barrios-Masia, Dierks, Renwick and Bowles2022; Ayres et al., Reference Ayres, Hanak, Gray, Sencan, Bruno, Escriva-Bou, Gartell and Collins2021). Different irrigation practices aiming to reduce the amount of water applied, without a yield decrease, are being studied and implemented across the world (Champaneri et al., Reference Champaneri, Desai, Sharma, Madane and More2024; Singh et al., Reference Singh, Singh, Singh, Saini and Angadi2021). Yet, crop yield and quality are positively correlated to irrigation volumes (de Pascale et al., Reference De Pascale, Costa, Vallone, Barbieri and Maggio2011), and implementation of irrigation practices based on environmental conditions should aim to improve the effective use of water resources without compromising crop productivity (Barrios-Masias et al., Reference Barrios-Masias, Lazcano, Hernandez-Espinoza and Hochmuth2019; Blum, Reference Blum2011).
Deficit irrigation, defined as the application of water below the crop evapotranspiration (ETc) requirements, can enhance crop water productivity (CWP: yield per unit of water applied) and optimize water use in vegetable crops, including melons (Burato et al., Reference Burato, Fusco, Pentangelo, Nicastro, Modugno, Scotto di Covella, Ronga, Carillo, Campi and Parisi2024; Fereres and Soriano, Reference Fereres and Soriano2007; Morbidini et al., Reference Morbidini, Barrera, Zanin, Verdi, Camarotto, Ghinassi, Maucieri, Marta and Borin2024; Sharma et al., Reference Sharma, Leskovar and Crosby2019; Singh et al., Reference Singh, Singh, Singh, Saini and Angadi2021). An examination of 134 studies on deficit irrigation in vegetable crops showed that severe deficit irrigation (i.e., <65 % ETc) often leads to significant yield reductions, while mild to moderate deficit irrigation (>65 % ETc) maintains yield comparable to full irrigation (Singh et al., Reference Singh, Singh, Singh, Saini and Angadi2021). For instance, melon studies have shown that applying 75 % of ETc maintains yield and improves CWP (Ezzo et al., Reference Ezzo, Mohamed, Glala and Saleh2020; Sharma et al., Reference Sharma, Leskovar and Crosby2019; Vieira et al., Reference Vieira, Mesquita, Marinho, de Souza, de Tarso Aidar and Carvalho2019), but better understanding of plant water relations could help fine-tune the application of deficit irrigation in melons. The success of deficit irrigation depends on several factors, including the timing and severity of water reduction, evapotranspiration demands, soil moisture retention capacity, crop sensitivity to soil water depletion (SWD) and management practices that reduce evaporation (e.g., mulch) (Champaneri et al., Reference Champaneri, Desai, Sharma, Madane and More2024; Singh et al., Reference Singh, Singh, Singh, Saini and Angadi2021). Additionally, vegetable grafting can impact plant water use, and in melons, grafting has been reported to enhance CWP under deficit irrigation (Ezzo et al., Reference Ezzo, Mohamed, Glala and Saleh2020), although melon grafting may not always increase yield (di Santo and Barrios-Masias, Reference di Santo and Barrios-Masias2024).
Plant water relations affect water-use strategies that may prioritize growth and development (i.e., water-consumptive responses) or prevent turgor loss and desiccation (i.e., water-conservative responses) (Koehler et al., Reference Koehler, Wankmüller, Sadok and Carminati2023; Schultz, Reference Schultz2003). Over time, drought stress impairs photosynthesis to a degree that significantly diminishes yield (Singh et al., Reference Singh, Singh, Singh, Saini and Angadi2021). Because deficit irrigation induces a drought-like response in crops, it is important to identify irrigation strategies that maintain a water-consumptive response with potential reductions in plant water potential (Ψ), stomatal conductance (g s) and photosynthetic rate (P n) that do not impact yield. Plant Ψ is a direct measure of the plant water status, and the predawn water potential (Ψpd) can be used to assess drought intensity as it is assumed to reach equilibrium with the soil water potential when nighttime transpiration is negligible (Dwyer and Stewart, 1984; Domec et al., 2010; Knipfer et al., Reference Knipfer, Bambach, Isabel Hernandez, Bartlett, Sinclair, Duong, Kluepfel and McElrone2020). The midday water potential (Ψmd) represents the daily, highest water stress experienced by the plant due to high transpiration demands, usually unmet by the root water supply (Lambers et al., Reference Lambers, Chapin and Pons2008; Wijewardana et al., Reference Wijewardana, Alsajri, Irby, Krutz, Golden, Henry, Gao and Reddy2019). Both Ψpd and Ψmd can be used to monitor plant water status (e.g., water potential curve; Knipfer et al., Reference Knipfer, Bambach, Isabel Hernandez, Bartlett, Sinclair, Duong, Kluepfel and McElrone2020; di Santo et al., Reference di Santo, Knipfer and Barrios-Masias2025) and prevent the decline in leaf gas exchange to a level at which stomatal closure compromises carbon assimilation. While prolonged and large reductions in g s can constrain P n during drought-sensitive phases (e.g., flowering and fruit set), crops that are less sensitive to SWD may sustain carbon assimilation under moderate deficit irrigation and increase CWP (tomato: Barrios-Masias and Jackson, Reference Barrios-Masias and Jackson2016; Condon, Reference Condon2020; melon: Kuscu and Turhan, Reference Kuscu and Turhan2022).
Effective implementation of deficit irrigation requires water deliveries based on scheduling and volume to prevent soil water tensions that severely impair the plant to meet the canopy water demands (Shock and Wang, Reference Shock and Wang2011). This can mainly be achieved by estimating ETc from weather data or monitoring SWD using soil moisture sensors (Boltana et al., Reference Boltana, Bekele, Ukumo and Lohani2023). While ETc based methods may overestimate plant water needs (Boltana et al., Reference Boltana, Bekele, Ukumo and Lohani2023; Miller et al., Reference Miller, Vellidis, Mohawesh and Coolong2018), soil moisture sensors provide a direct measure of volumetric soil water content (θw) and offer a more reliable and precise approach for determining irrigation frequency and volume (Sui, Reference Sui2017). The FAO Irrigation and Drainage Paper No. 56 established SWD values at which crops may compromise yield production, and for melons, the recommended maximum SWD is 0.45 (Allen and Pereira, Reference Allen and Pereira2006), which can be used as a reference for scheduling irrigation events.
Vegetable grafting, including cucurbits, can enhance crop performance by providing advantages such as increased disease resistance, plant vigour and abiotic stress tolerance (e.g., King et al., Reference King, Davis, Zhang and Crosby2010). Adoption of vegetable grafting has increased in the U.S. because of the potential for higher yield, and in regions with a short growing season, vegetable grafting could enhance crop establishment and earliness (Bristow et al., Reference Bristow, Hernandez-Espinoza, Bonarota and Barrios-Masias2021).
In this study, we evaluate the physiological responses and agronomic performance of grafted and ungrafted cantaloupe melons under three irrigation regimes based on sensor-derived, volumetric soil-water content: 100 % field capacity (FC; full irrigation), 70 % of the 100 % FC (moderate deficit irrigation), and 50 % of the 100 % FC (severe deficit irrigation). Our objectives were to assess how these irrigation levels affect key physiological parameters (Ψpd, Ψmd, leaf osmotic potential (Ψ π ), g s, P n), yield components (total yield, production earliness, fruit weight and fruits per plant), and fruit quality (total soluble solids), and to determine whether deficit irrigation can serve as a viable water-saving strategy for melon growers operating in arid and semi-arid environments.
Materials and methods
Plant material and experimental trials
The experiments were conducted at the University of Nevada, Reno, Valley Road Experiment Station in Reno, Nevada, USA (39°32’ N, 119°48’ W, 1366 m.a.s.l.). Two field trials (one per year during 2023 and 2024) were conducted in two adjacent fields with similar soil texture (i.e., sandy loam) and a 0–1 % slope.
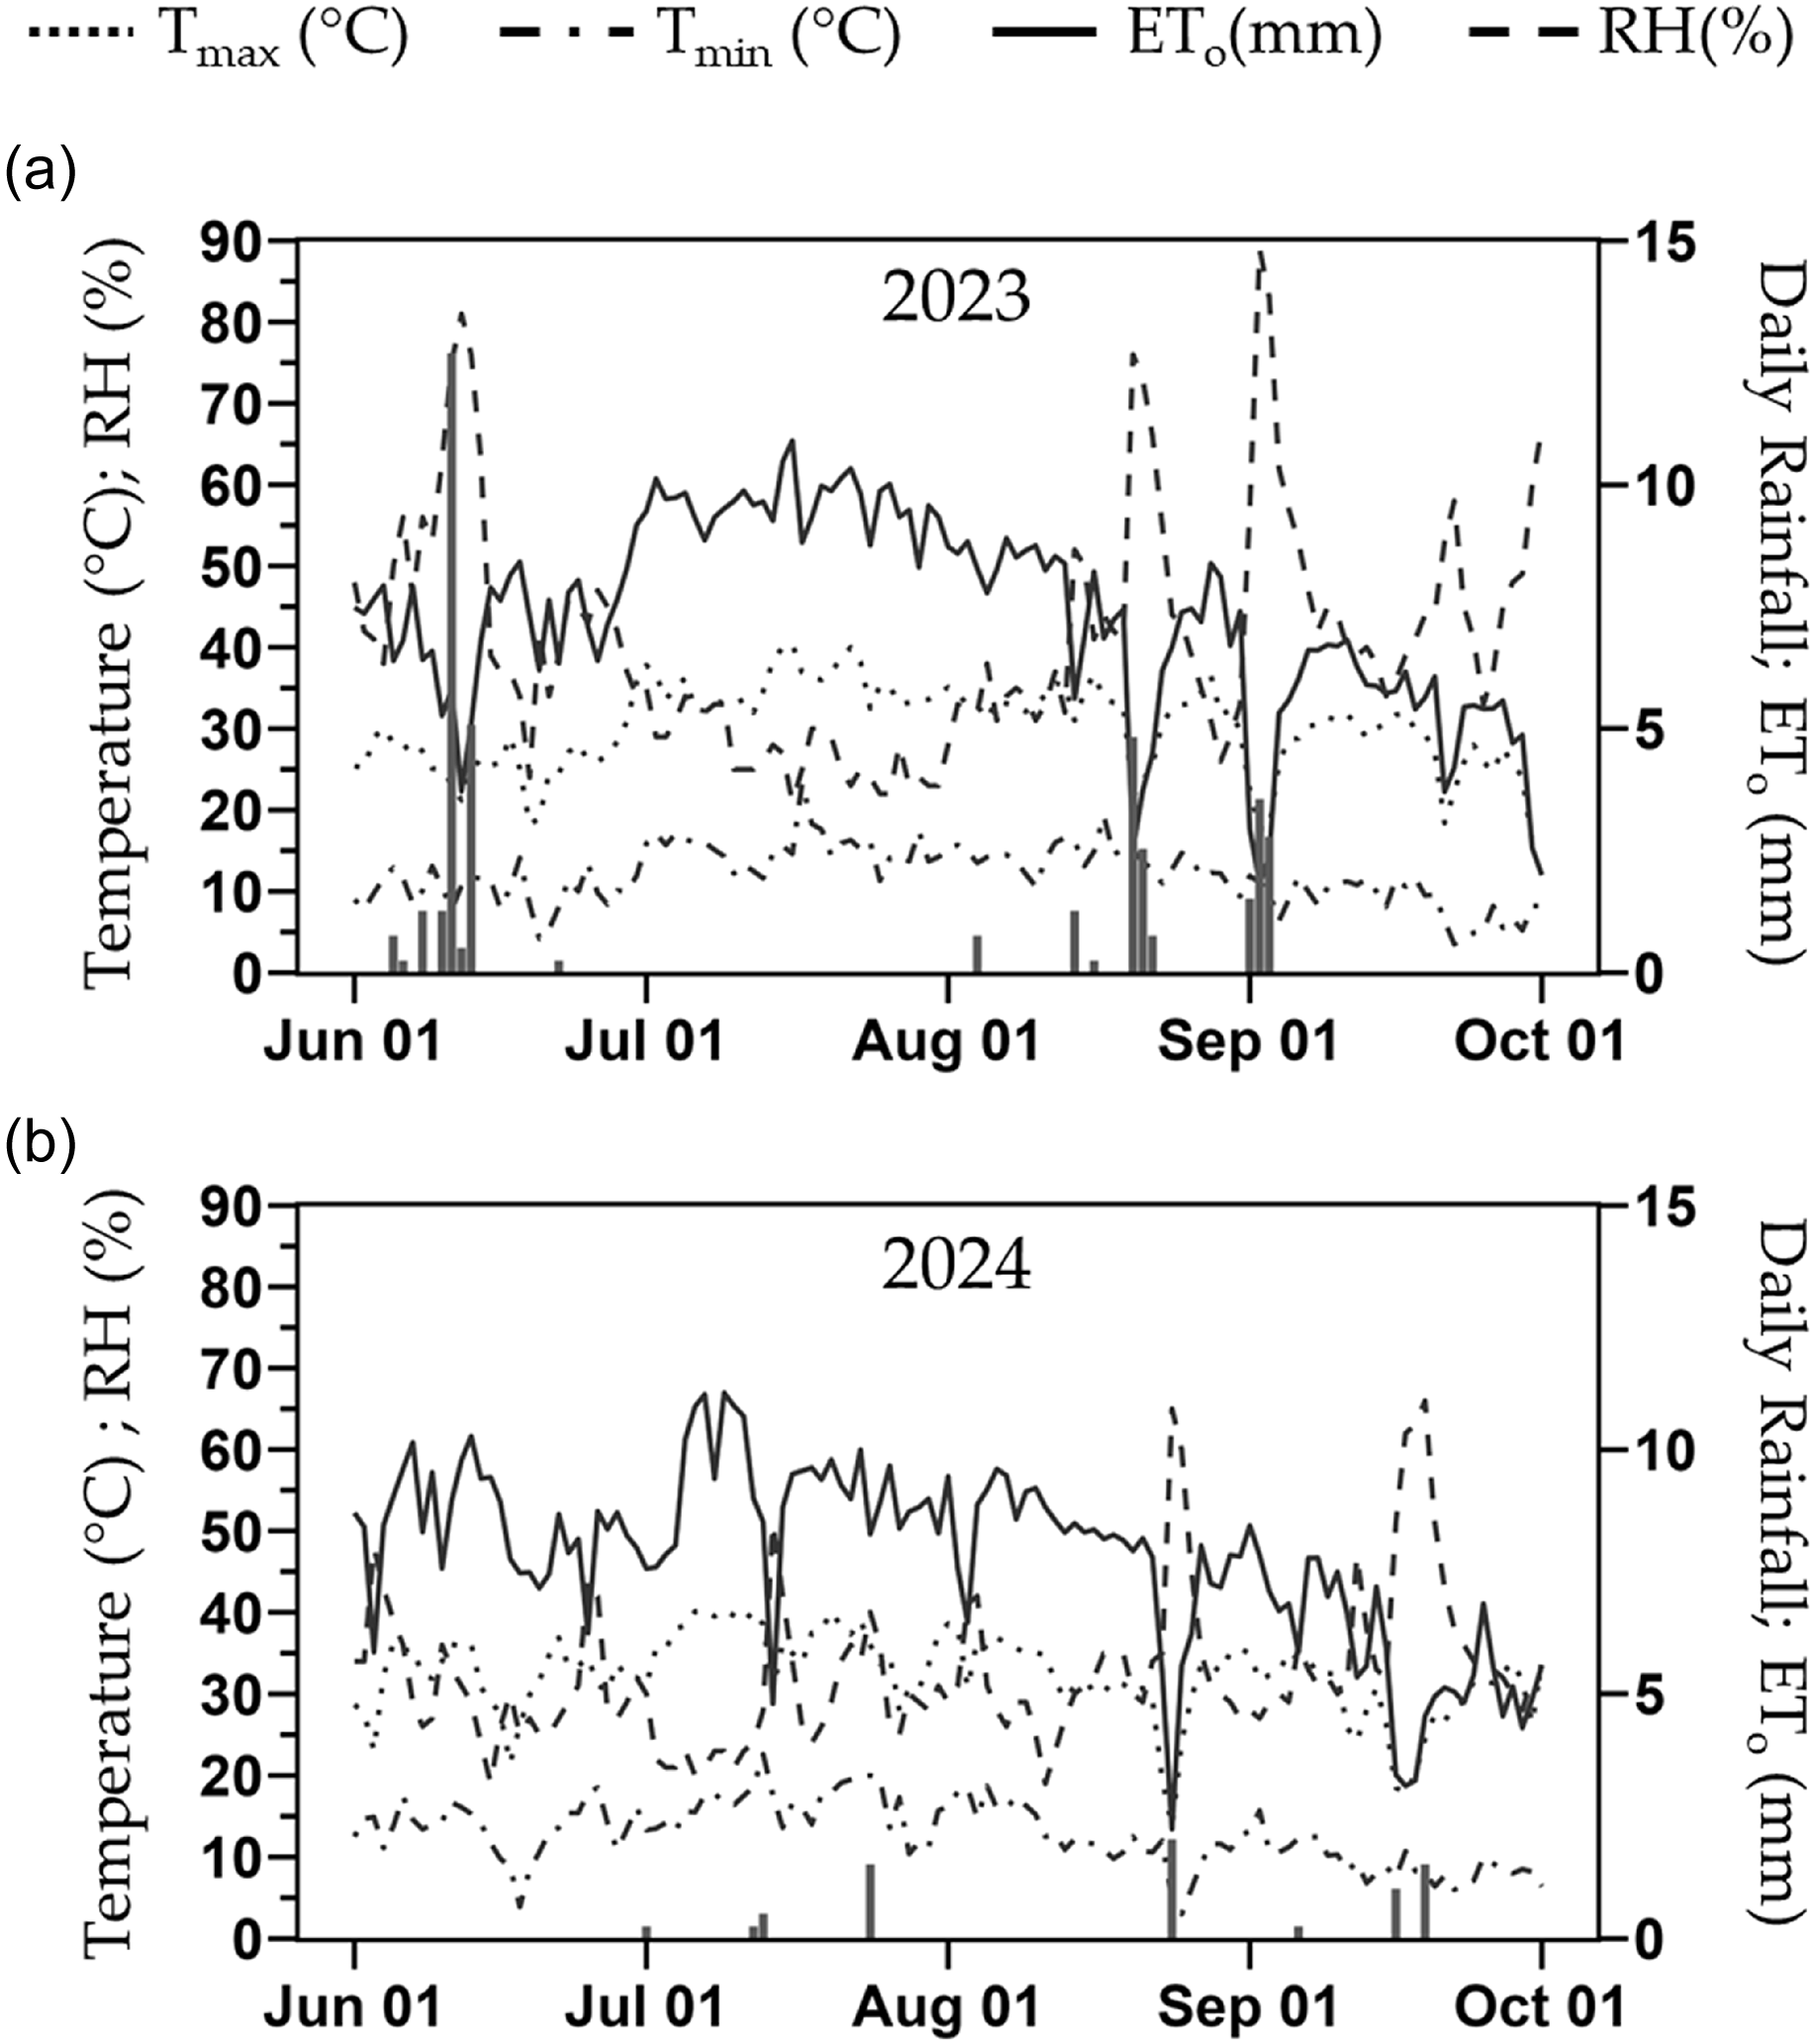
Two plant phenotypes (i.e., grafted and ungrafted plants) were included in both trials, with the melon cultivar Sarah’s Choice used as the scion and the own-rooted treatment. Grafting was done onto the commercial rootstock Carnivor, a squash hybrid derived from crossing Cucurbita maxima × Cucurbita moschata, and previously shown to perform better than several rootstocks in this region (di Santo and Barrios-Masias, Reference di Santo and Barrios-Masias2024). The scion seeds were sown six days prior to the rootstock to match the growth stage at the time of grafting (i.e., two true leaves). Seeds for the ungrafted phenotype were sown one day after the rootstock to account for the grafting healing period. All seeds were sown on Miracle-Gro Vegetable & Herbs soil mix (Miracle-Gro®, OH, USA). Grafting was performed using the one-cotyledon method (Guan and Zhao, Reference Guan and Zhao2019), and plants were placed in a GEN1000 growth chamber (Conviron, MB, Canada) with 100 % relative humidity, 26.5 °C, and no light for 48 hours to facilitate healing. Two weeks after grafting and after the risk of any late frost had passed, plants were transplanted in the field (8 June 2023 and 30 May 2024). Weather data of the 2023 and 2024 deficit irrigation trials are shown in Figure 1 (Western Regional Climate Center, 2025).
Daily maximum temperature (T max), minimum temperature (T min), reference evapotranspiration (ETo) and relative humidity (RH) (lines), and rainfall (bars) for years 2023 (a) and 2024 (b) during the months when the deficit irrigation trials were conducted in Reno, Nevada, USA.

For both years, the experimental design was a RCBD with six replicates per treatment combination (i.e., three irrigations by two phenotype treatments), resulting in a total of 36 plots. Each replicate (i.e., block) was a single planting row. A total of six rows and one buffer row on each side was a complete trial. The spacing between rows was two metes. Each planting row had six plots with seven plants per plot at a spacing of 90 cm between plants. Within each row, buffer plants were included in the top and bottom of the field and between plots to reduce irrigation treatment effects on the contiguous plot.
Irrigation treatments were based on replenishing moisture to 100 % FC, and the deficit irrigation treatments received 70 and 50 % of the irrigation volume required for the 100 % FC. Irrigation treatments began three weeks after transplanting to allow for plant establishment. Irrigation was scheduled at SWD levels between 0.25 and 0.45 based on volumetric soil water content estimations from the 100 % FC plots. Soil water content was monitored in each irrigation treatment using two stations per treatment, with each station having two TEROS 12 soil moisture sensors (Meter Group, Inc., WA, USA) at 20 and 40 cm soil depth. The field capacity was assessed before transplanting by saturating the soil for 48 h, and determined when soil moisture readings stabilized. FC was 0.35 m3/m3 at 20 cm depth and 0.38 m3/m3 at 40 cm depth for both fields. The permanent wilting point was calculated at 0.18 m3/m3 according to a soil water retention curve (data not shown) obtained from soil samples and processed with a WP4C soil water potential instrument (Meter Group, Inc., WA, USA). Irrigation was applied through drip tape (model EA5151625-400; TORO®, MN, USA). Both field trials used white plastic mulch and received nitrogen at a rate of 100 kg/ha, based on soil test recommendations (data not shown), split in three fertigation events.
Plant physiological variables
Multispectral images for soil canopy cover and normalized difference vegetation index (NDVI) were captured weekly using an agricultural digital camera (Tetracam, Inc., CA, USA) on the two central plants of each plot from 14 days after transplant (DAT) until 63 DAT, when the canopies reached their maximum growth. Images were processed with PixelWrench2 software and subsequently imported into R Studio version 4.1.2 (Bristow et al., Reference Bristow, Hernandez-Espinoza, Bonarota and Barrios-Masias2021; R Core Team, 2021). Briefly, pixels representing the melon canopy (NDVI > 0.5) were isolated and divided by the total number of pixels to determine the percentage of cover, which was then converted into the covered surface percentual using a formula derived from the PixelWrench2 field of view calculator.
Stem water potential (Ψ) and leaf gas exchange measurements were taken weekly starting at the canopy development stage from 41 to 90 DAT in 2023 and from 25 to 53 DAT in 2024 (a total of seven days per year). The measurement period included early fruit set and fruit development until the beginning of harvest. The Ψ was determined at predawn (Ψpd) and midday (Ψmd) on the same day of leaf gas exchange measurements, using a Scholander-style pressure chamber (Model 1000, PMS Instruments, OR, USA). A Mylar-wrapped plastic bag was used to cover a mature leaf the night before for Ψpd and 60 min prior for Ψmd measurements to allow the leaf water potential to equilibrate with the Ψ (Turner and Long, Reference Turner and Long1980). The leaf was then excised at the base of the petiole and kept on ice until measurements were taken within one hour (Knipfer et al., Reference Knipfer, Bambach, Isabel Hernandez, Bartlett, Sinclair, Duong, Kluepfel and McElrone2020). Leaves were collected between 0400 and 0600 hour for Ψpd and between 1200 and 1300 h for Ψmd. To measure leaf osmotic potential (Ψπ), four leaf strips (3 × 0.5 cm) were collected from the same leaf used for Ψmd measurements. Leaf strips were placed in a pipette tip inside an Eppendorf tube and frozen at −18 °C. After thawing at room temperature, the samples were centrifuged at 7000 rpm for 5 minutes to extract leaf sap (Bonarota et al., Reference Bonarota, Toups, Bristow, Santos, Jackson, Cramer and Barrios-Masias2024). A vapour pressure osmometer (Vapro 5600, ELITechGroup Biomedical Systems, UT, USA) was utilized to determine sap osmolality in mOsmol/kg. This value was then converted to Ψπ in MPa, using the conversion factor of 40.75 mOsmol/kg per 0.1 MPa (Knipfer et al., Reference Knipfer, Bambach, Isabel Hernandez, Bartlett, Sinclair, Duong, Kluepfel and McElrone2020).
Stomatal conductance (g s) and photosynthetic rate (P n) were measured using a field portable open-flow infrared gas analyser (model 6400XT, LI-COR Biosciences, NE, USA) set at 26.5 °C block temperature, 400 µmol/mol reference CO2 and 2000 mmol/m2/s photosynthetic photon flux density. Measurements were taken between 1030 and 1200 h from a recently mature, non-shaded leaf, located near the leaf used for Ψpd measurements. The same leaf used for gas exchange measurements was later used for Ψmd. The intrinsic water use efficiency (WUEi) was calculated by dividing P n per g s.
Yield variables
A total of twelve harvests were conducted from 66 to 111 DAT in 2023, and six harvests from 66 to 94 DAT in 2024. During each harvest, all ripe fruits from each plot were collected, counted and weighed. The total number of fruits per plant was calculated by dividing the total number of melons by the number of plants per plot. Single fruit weight was determined by dividing the total fresh weight of harvested fruits by the number of fruits per plot. Total yield and production over time were calculated by averaging the melon production per plant per plot and scaling up to one hectare based on the plant spacing (i.e., 0.9 m by 2.0 m). Crop water productivity (CWP) was assessed by dividing the total yield per water applied (i.e., kg fruit/m3 H2O) (Yavuz et al., Reference Yavuz, Seymen, Yavuz, Çoklar and Ercan2021). Fruit total soluble solids (Brix°) were measured on melons harvested three days prior and stored at 5°C. Each fruit was halved, a 2 by 2 cm cube was taken from each half near the seed cavity, the juice was extracted, and Brix° was measured using an analog RSA-BR92T refractometer (Cole-Parmer, IL, USA) (Suh et al., 2012).
Statistical approach
A three-way ANOVA was conducted considering irrigation, phenotype and year as independent, fixed factors. All interactions among main factors were considered. For soil canopy cover, NDVI, Ψ, g s, P n and production over time, a repeated measures three-way ANOVA model was employed to assess differences between phenotypes and irrigation treatments. For post hoc mean comparisons, the Fisher’s Least Significant Difference (LSD) test was performed for significant ANOVAs to identify differences between phenotype and irrigation treatments (Saville, Reference Saville2015). For all models, the α for the main effects was set at 0.05 level. Statistical computation and graphical data representation was conducted using R version 4.1.2 (R Core Team, 2021) with the following packages: agricolae (de Mendiburu and Yaseen, Reference De Mendiburu and Yaseen2020), Cairo (Urbanek and Horner, Reference Urbanek and Horner2023), lmerTest (Kuznetsova et al., Reference Kuznetsova, Brockhoff and Christensen2017), ggplot2 (Wickham, Reference Wickham2009), ggprism (Dawson, Reference Dawson2024), rstatix (Kassambara, Reference Kassambara2021) and stats (R Core Team, 2021).
Results
Irrigation amounts and soil water depletion
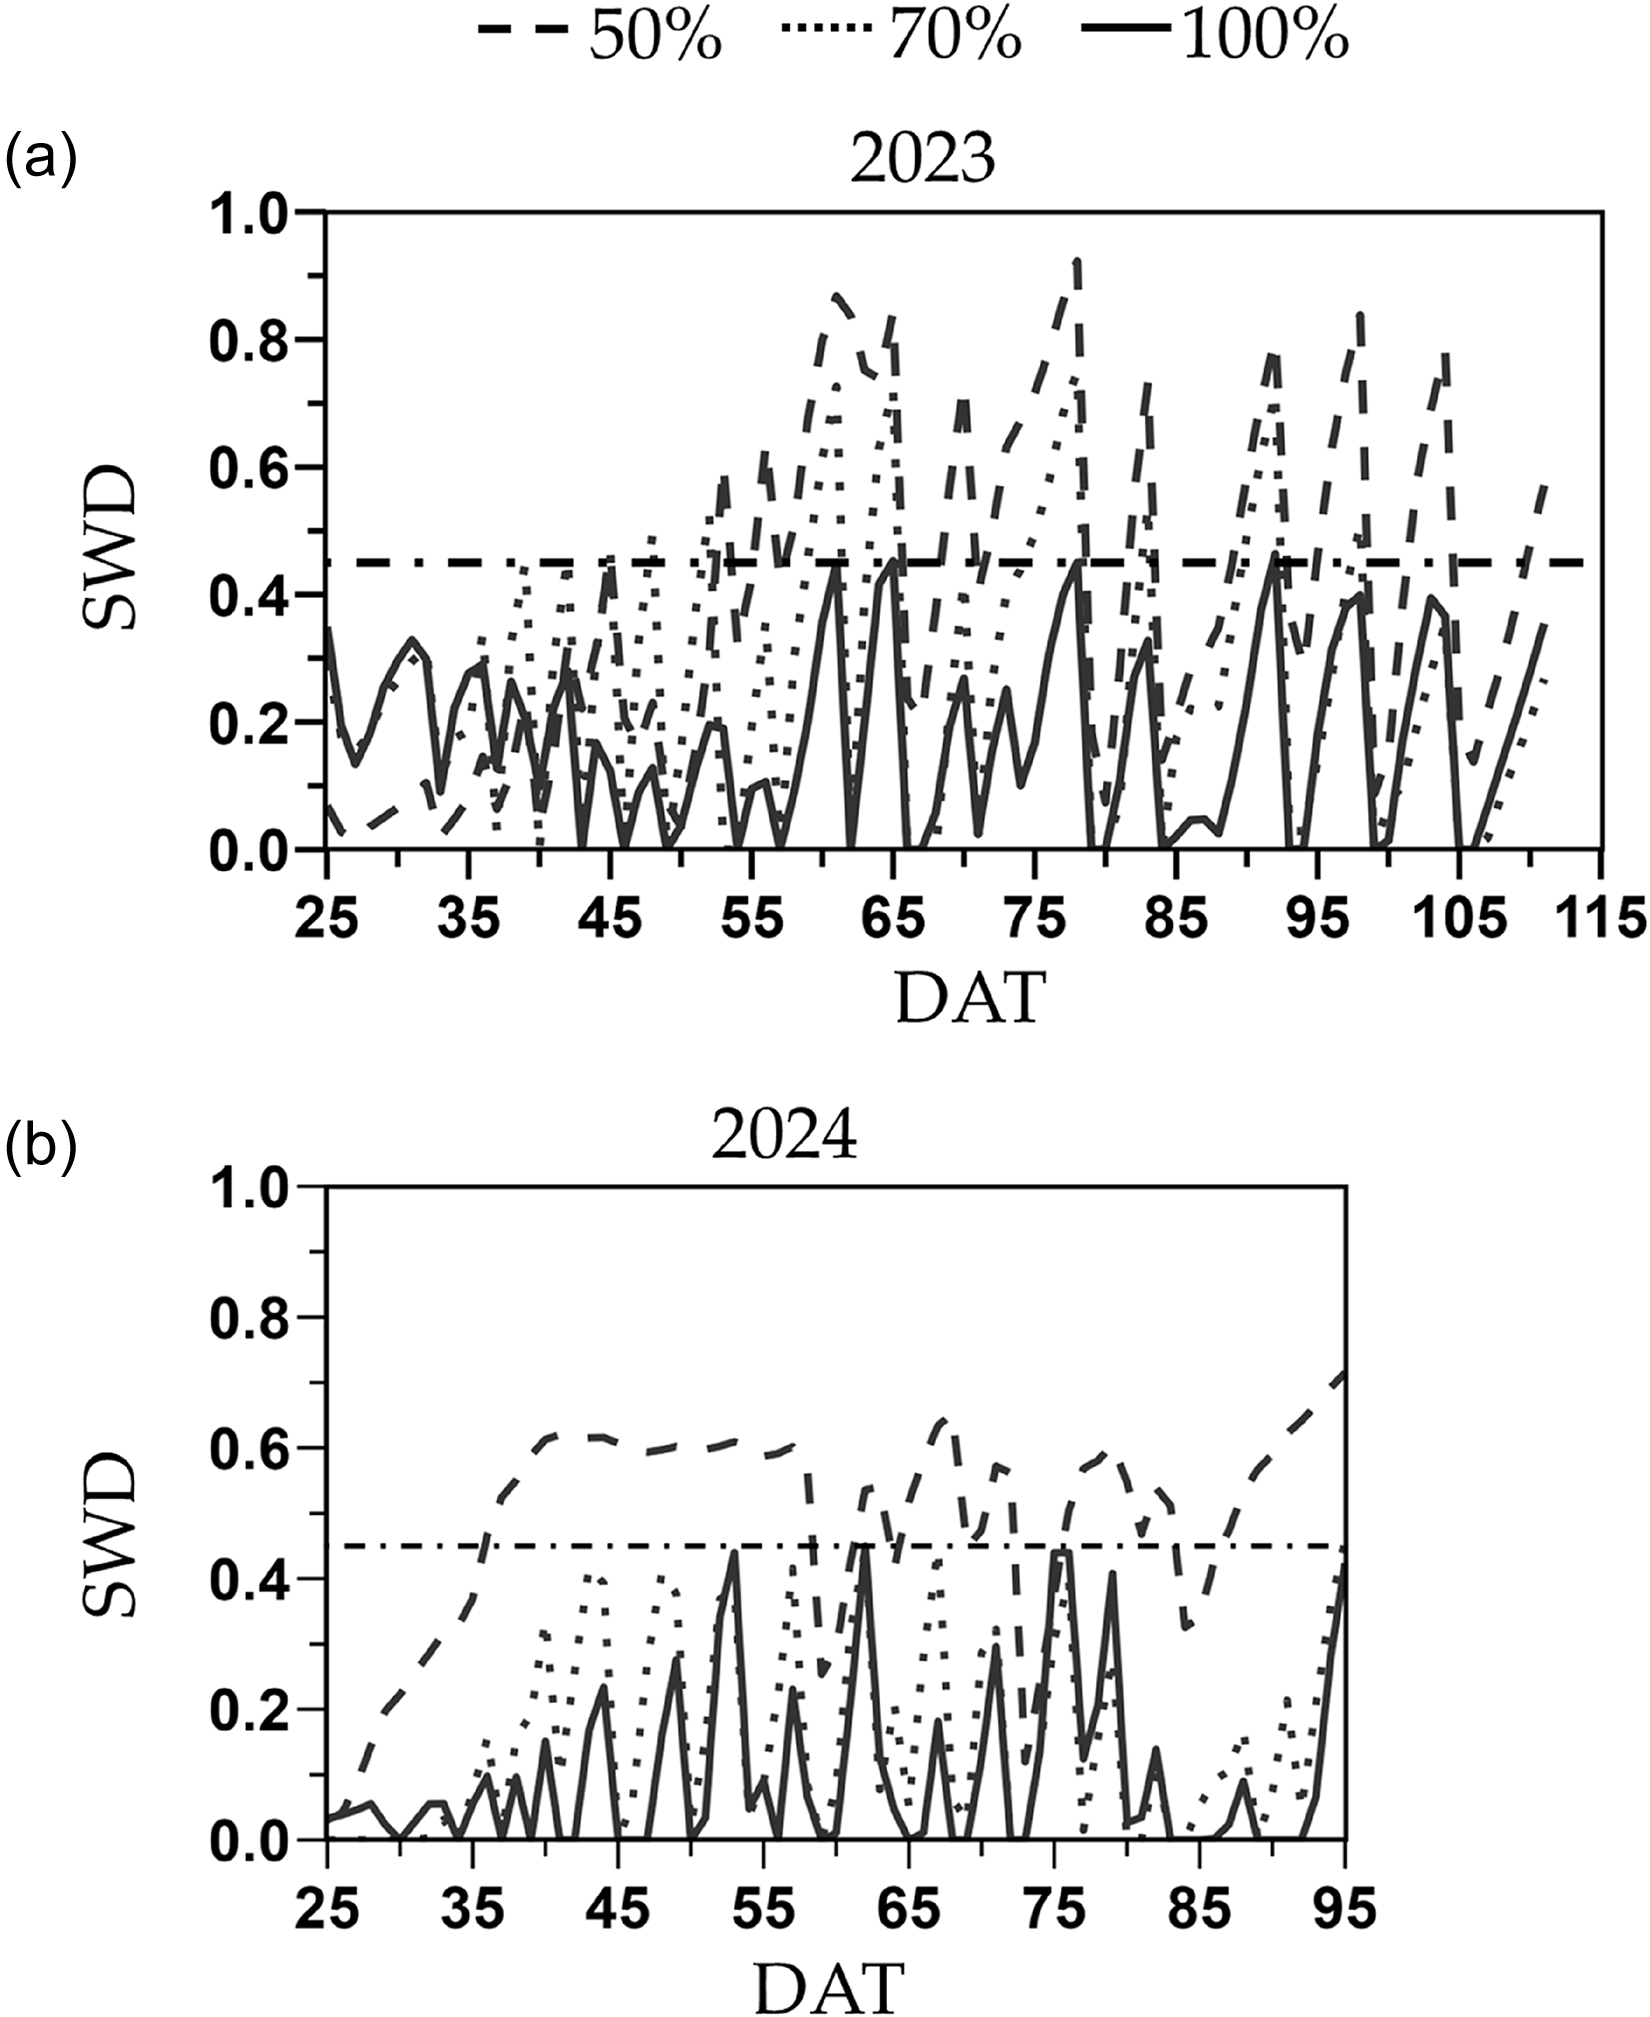
In 2023, a total of 770, 570 and 440 mm of water was applied through 21 irrigations to the full, moderate and severe deficit irrigation treatments, respectively, whereas in 2024, 540, 410 and 320 mm of water were applied through 19 irrigations, respectively (Table S1). In average, including the three weeks prior to irrigation treatment establishment, the moderate and severe deficit irrigation treatments received 25 and 42 % less water than the full irrigation treatment. Under the 100 % FC, SWD remained below the FAO-recommended threshold of 0.45 in both years (Figure 2). Under the 70 % FC, the SWD was on average 40 % higher than the 100 % FC and exceeded the 0.45 SWD threshold eight times in 2023 but none in 2024 (Figure 2). The 50 % FC treatment resulted in SWD exceeding the 0.45 threshold for extended periods of time in both years (55–95 DAT in 2023 and 35–95 DAT in 2024), reaching values above 0.8 and 0.65 in 2023 and 2024, respectively (Figure 1).
Soil water depletion (SWD) from 25 days after transplanting (DAT) until the last harvest for the 2023 (a) and 2024 (b) deficit irrigation trials. Treatments included a full irrigation (100 % field capacity; FC), and 70 % or 50 % deficit irrigation based on the water applied to the 100 % FC. The dash-dotted horizontal line represents the 0.45 maximum SWD recommended for melons by the FAO Irrigation and Drainage Paper No. 56.

Soil canopy cover and normalized difference vegetation index
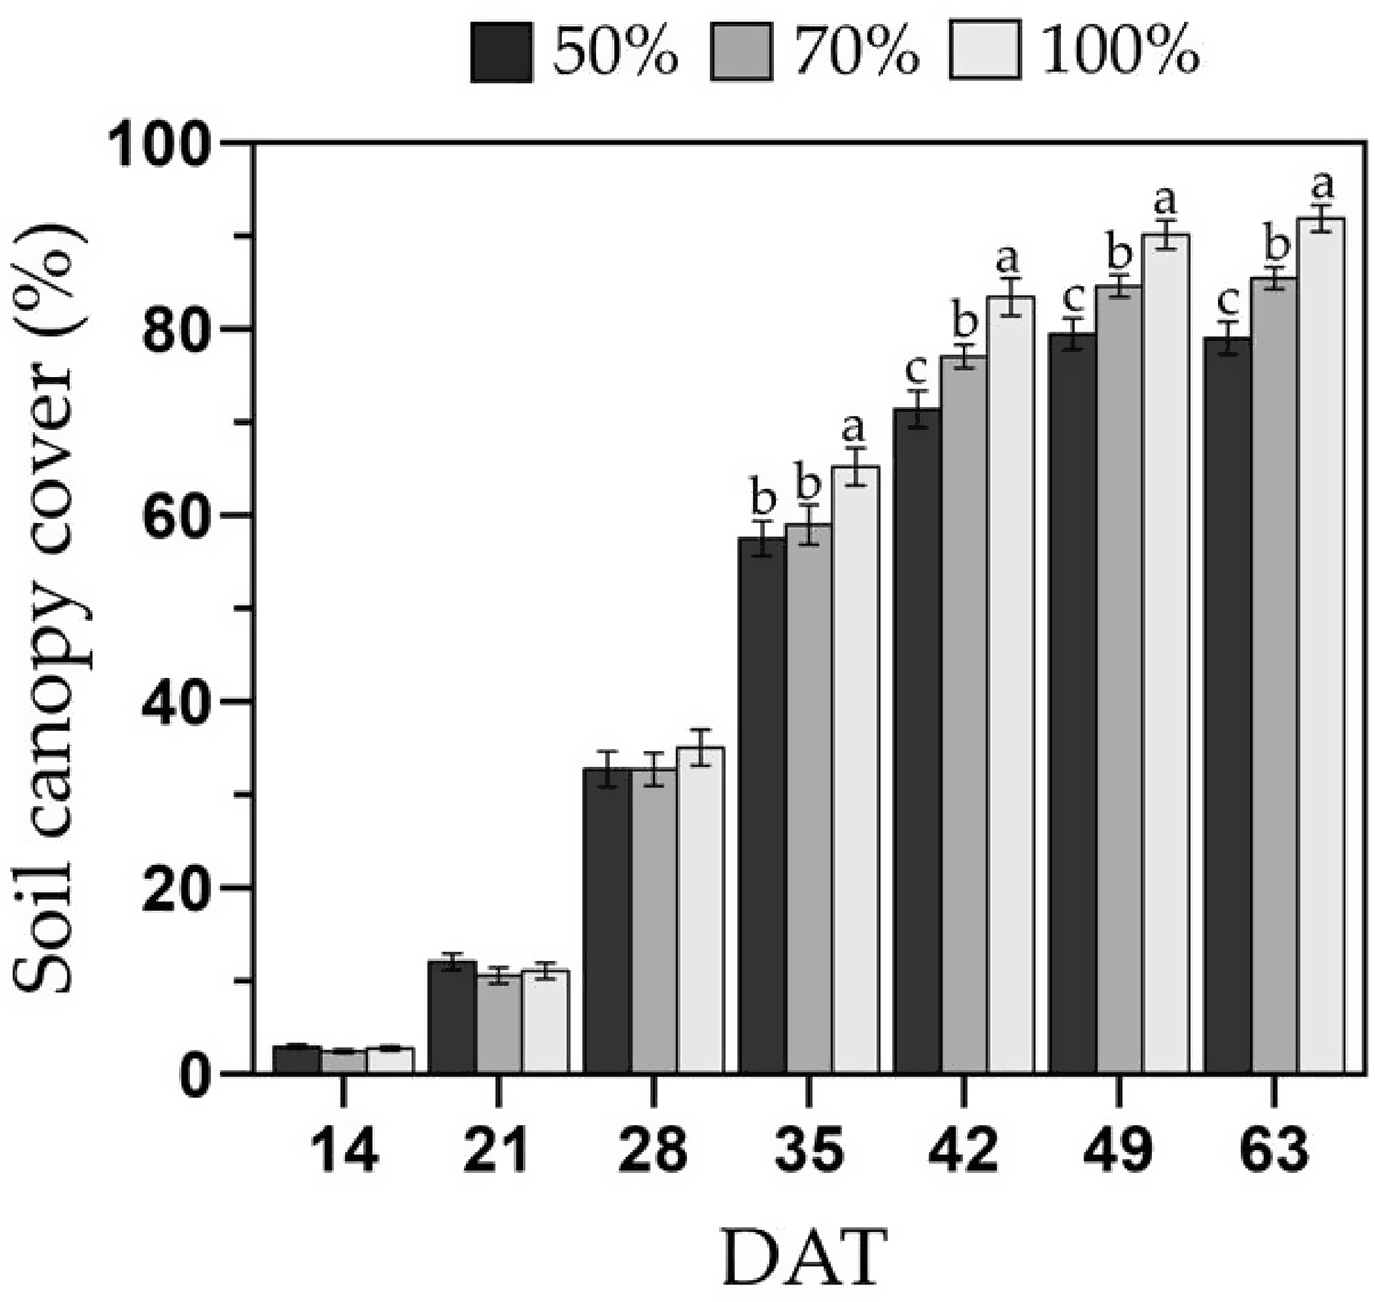
Overall, deficit irrigation reduced canopy development in melons, and grafted plants tended to have larger canopies (P = 0.057). No interactions between irrigation treatment and year or phenotype were observed (P = 0.11 and 0.51, respectively). Canopy development differences were first observed at 35 DAT, when the 100 % FC had a 10–12 % larger soil canopy cover than the 70 and 50 % FC treatments (Figure 3). After 42 DAT, the 70 % FC had 8 % larger soil canopy cover than the 50 % FC, but 8 % lower than the 100 % FC treatment. Differences in canopy cover between irrigation treatments remained similar until the initiation of harvest. The maximum canopy development was reached between 49 and 63 DAT with 90, 84 and 79 % of soil canopy cover for the 100, 70 and 50 % FC treatments, respectively. Grafted plants exhibited 25 % larger soil canopy cover than ungrafted ones at 21 and 28 DAT (all irrigation treatments), under comparable soil moisture content as irrigation treatments began at 21 DAT. By 35 DAT, grafted plants had 12 % greater canopy cover than ungrafted ones only under the 100 % FC treatment, and no differences in soil canopy cover between phenotypes were observed after this date.
Soil canopy cover from 14 to 63 days after transplanting (DAT) of the melon cultivar Sarah’s Choice (grafted and ungrafted plants combined). Treatments included a full irrigation (100 % field capacity; FC), and 70 % or 50 % deficit irrigation based on the water applied to the 100 % FC. Values are mean ± SE of two field trials. Means followed by different letters are significantly different at P < 0.05. Mean comparisons are within each DAT.

NDVI increased over time from 0.7 to 0.9, but no differences were observed between irrigation and phenotype treatments, apart from 42 and 49 DAT when plants were reaching full canopy development (Figure S1). At this stage, NDVI in the 100 % FC was 2 % higher than the 50 % FC treatment although values were still relatively high for all treatments. NDVI decreased after the canopy was fully developed at 63 DAT (NDVI of 0.86 in average).
Plant water status and leaf gas exchange
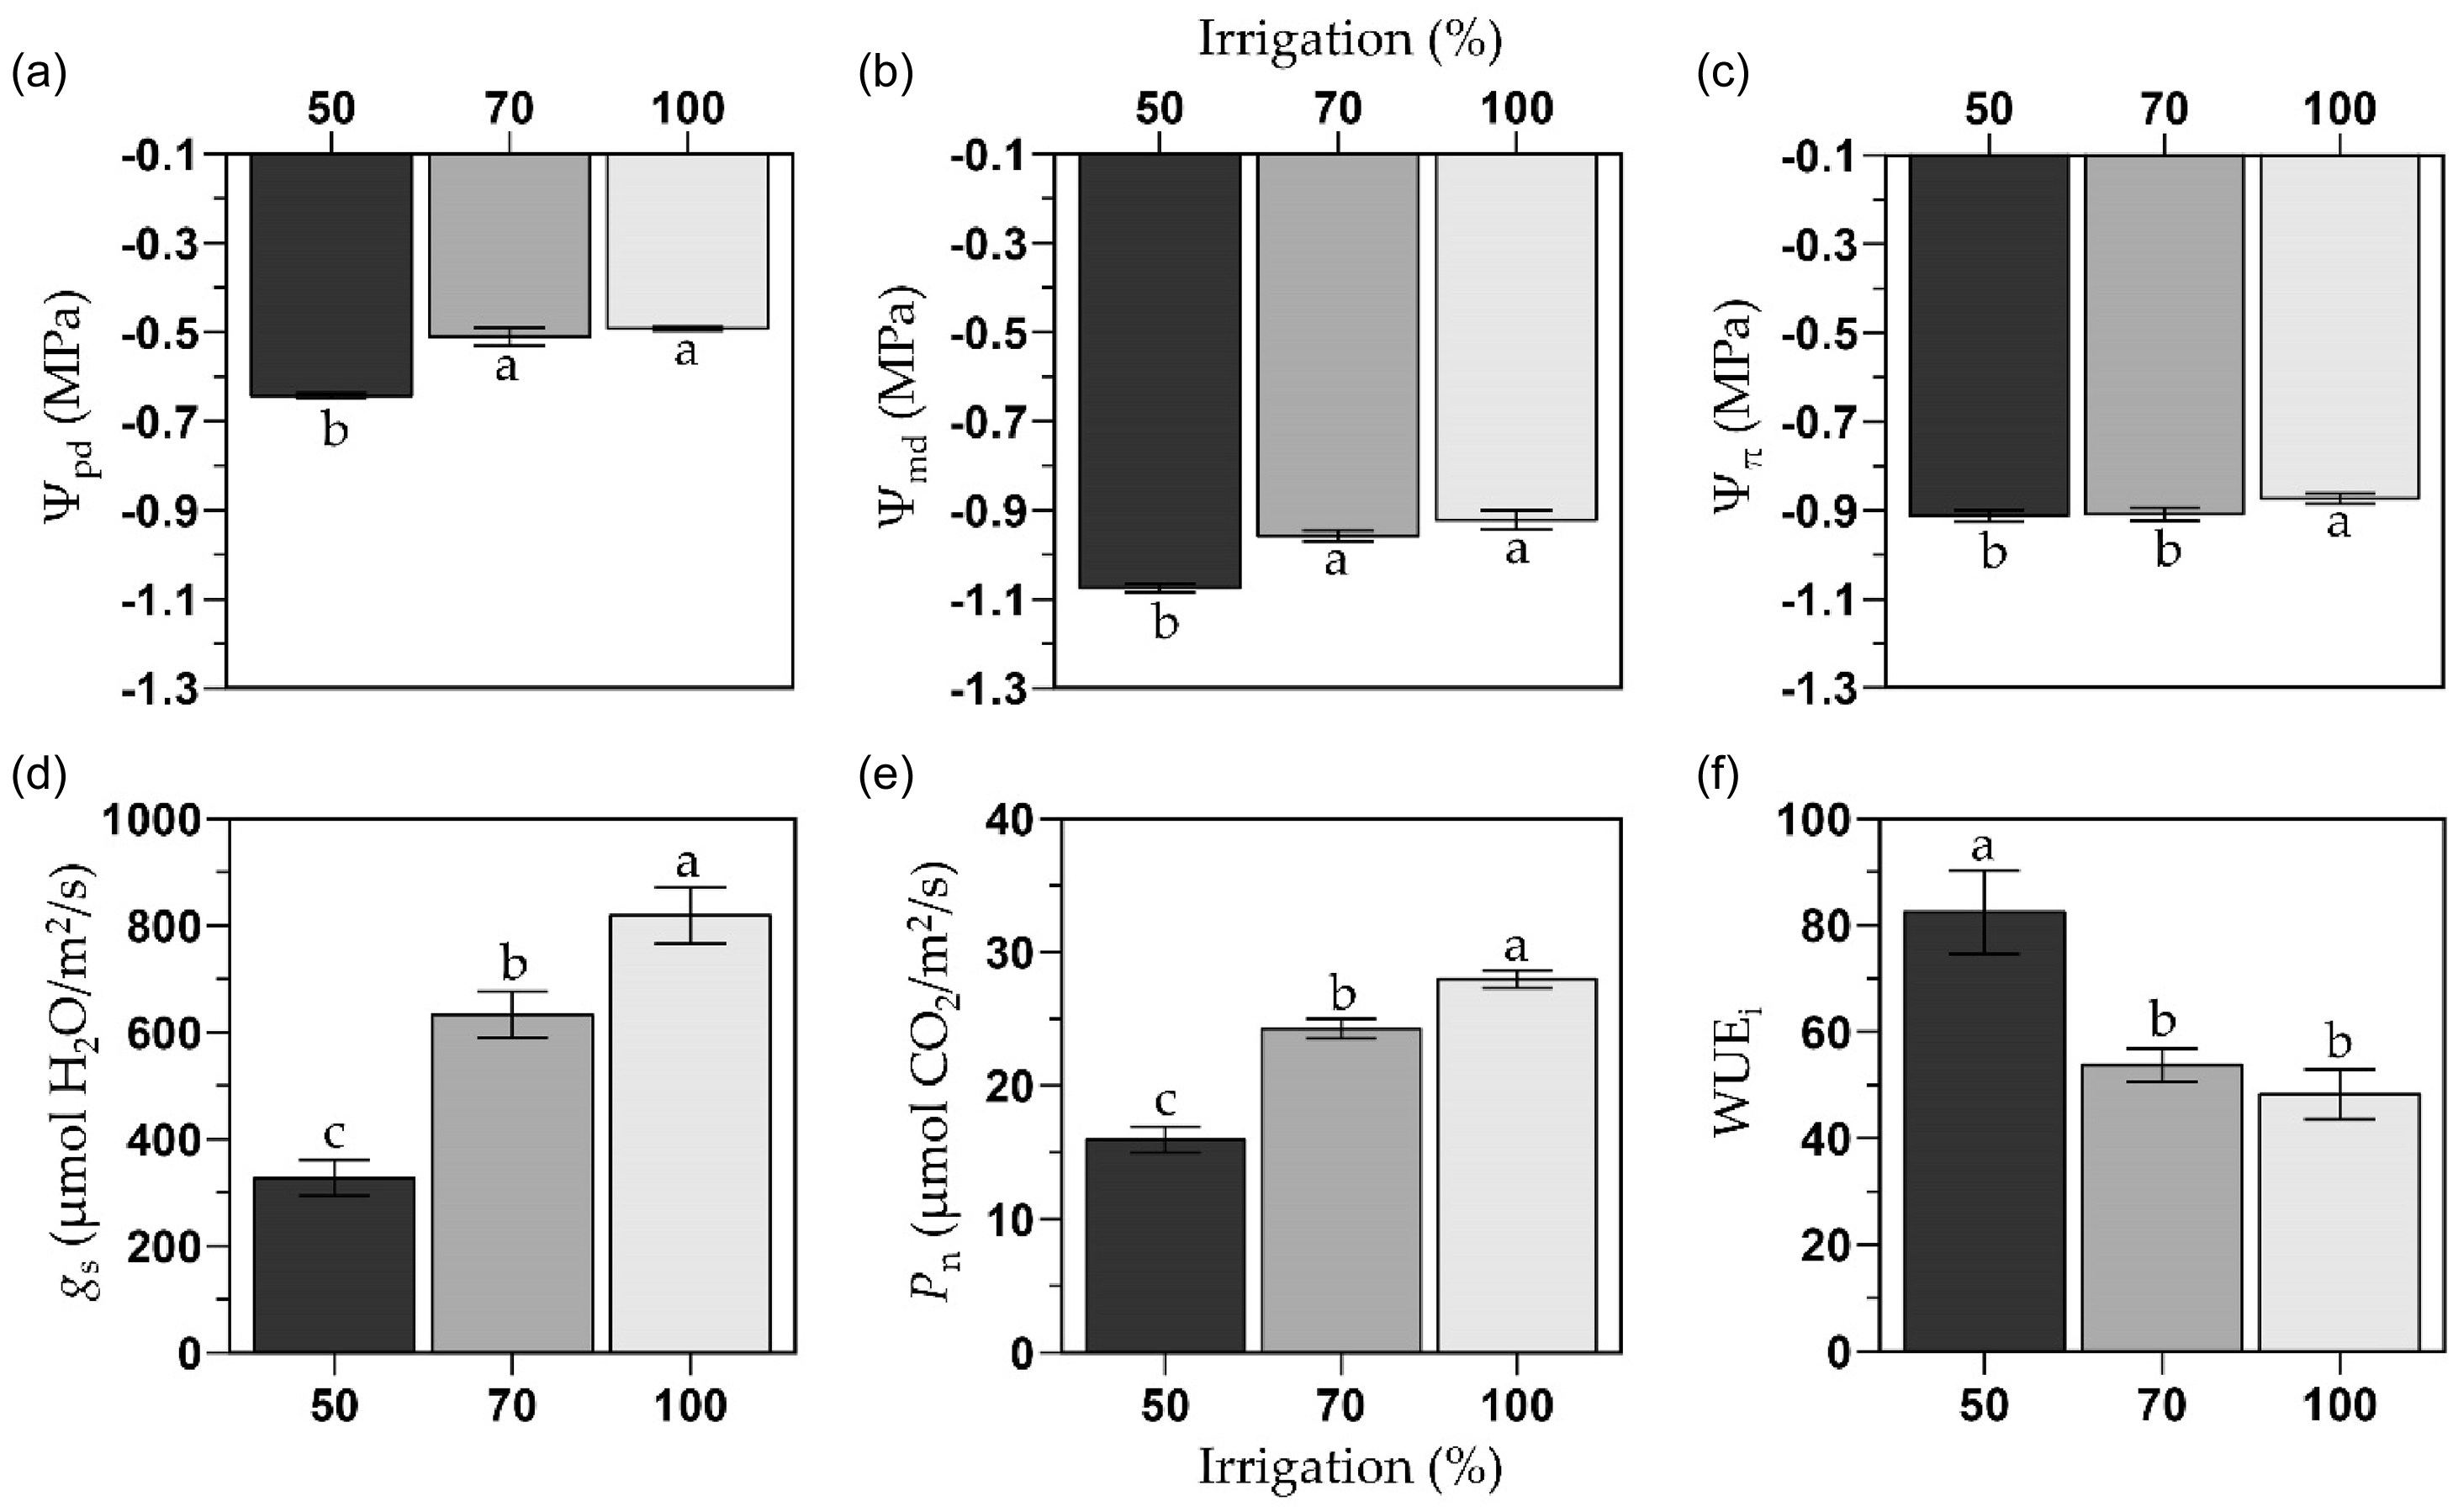
Overall, deficit irrigation decreased plant water status (Ψpd, Ψmd and Ψπ) and leaf gas exchange (g s and P n). A year by irrigation interaction was observed for Ψmd (P = 0.031), and DAT was significant except for Ψpd (P = 0.089), but with no defined temporal trend for the measured variables (Figure S2). Grafting had no effect on any variable (i.e., plant water status and leaf gas exchange). The Ψpd and Ψmd were similar between the 100 and 70 % FC treatments (Ψpd: −0.50 MPa, Ψmd: −0.94 MPa; Figure 4a and b), but under the 50 % FC, both Ψ (Ψpd: −0.64 MPa, Ψmd: −1.1 MPa) were on average 28 and 17 % lower than the other two irrigation treatments, respectively. For all irrigation treatments, the Ψmd was always 40 % lower than the Ψpd. The highest Ψπ was observed in plants under the 100 % FC treatment (Ψπ: −0.86 MPa), whereas Ψπ was 5 % lower for both deficit irrigation treatments (Ψπ: −0.90 MPa; Figure 4c).
Predawn water potential (Ψpd; a), midday water potential (Ψmd; b), leaf osmotic potential (Ψπ; c), stomatal conductance (g s; d), photosynthetic rate (P n; e), and intrinsic water use efficiency (WUEi; f) of the melon cultivar Sarah’s Choice (grafted and ungrafted plants combined). Treatments included a full irrigation (100 % field capacity; FC), and 70 % or 50 % deficit irrigation based on the water applied to the 100 % FC. Values are mean ± SE of two field trials (one per year). Means followed by different letters are significantly different at P < 0.05.

On average, the highest g s was observed in plants under the 100 % FC (796 µmol H2O/m2/s), followed by the 70 % FC (607 µmol H2O/m2/s) which was 34 % lower than the 100 % FC, and the 50 % FC (276 µmol H2O/m2/s) which was 65 and 55 % lower than the 100 % and 70 % FC treatments, respectively (Figure 4d and e). Similar to g s, the highest P n was observed in plants under the 100 % FC (27.5 µmol CO2/m2/s), followed by the 70 % FC (23.7 µmol CO2/m2/s) which was 14 % lower than the 100 % FC, and the 50 % FC (14.7 µmol CO2/m2/s) which was 47 and 38 % lower than the 100 and 70 % FC treatments, respectively. Over time, leaf gas exchange did not show a consistent pattern due to drought-stress acclimation. The only consistent change was that the g s and P n of the 50 % FC became consistently lower than the 100 % FC treatment by the initiation of harvest (Figure S2). As a result of reductions in leaf gas exchange, the WUEi of the 50 % FC treatment (86.0 µmol CO2/mmol H2O) was 74 and 55 % higher than the 100 % and 70 % FC treatments (49.4 and 55.2 µmol CO2/mmol H2O, respectively; Figure 4f).
Yield and crop water productivity
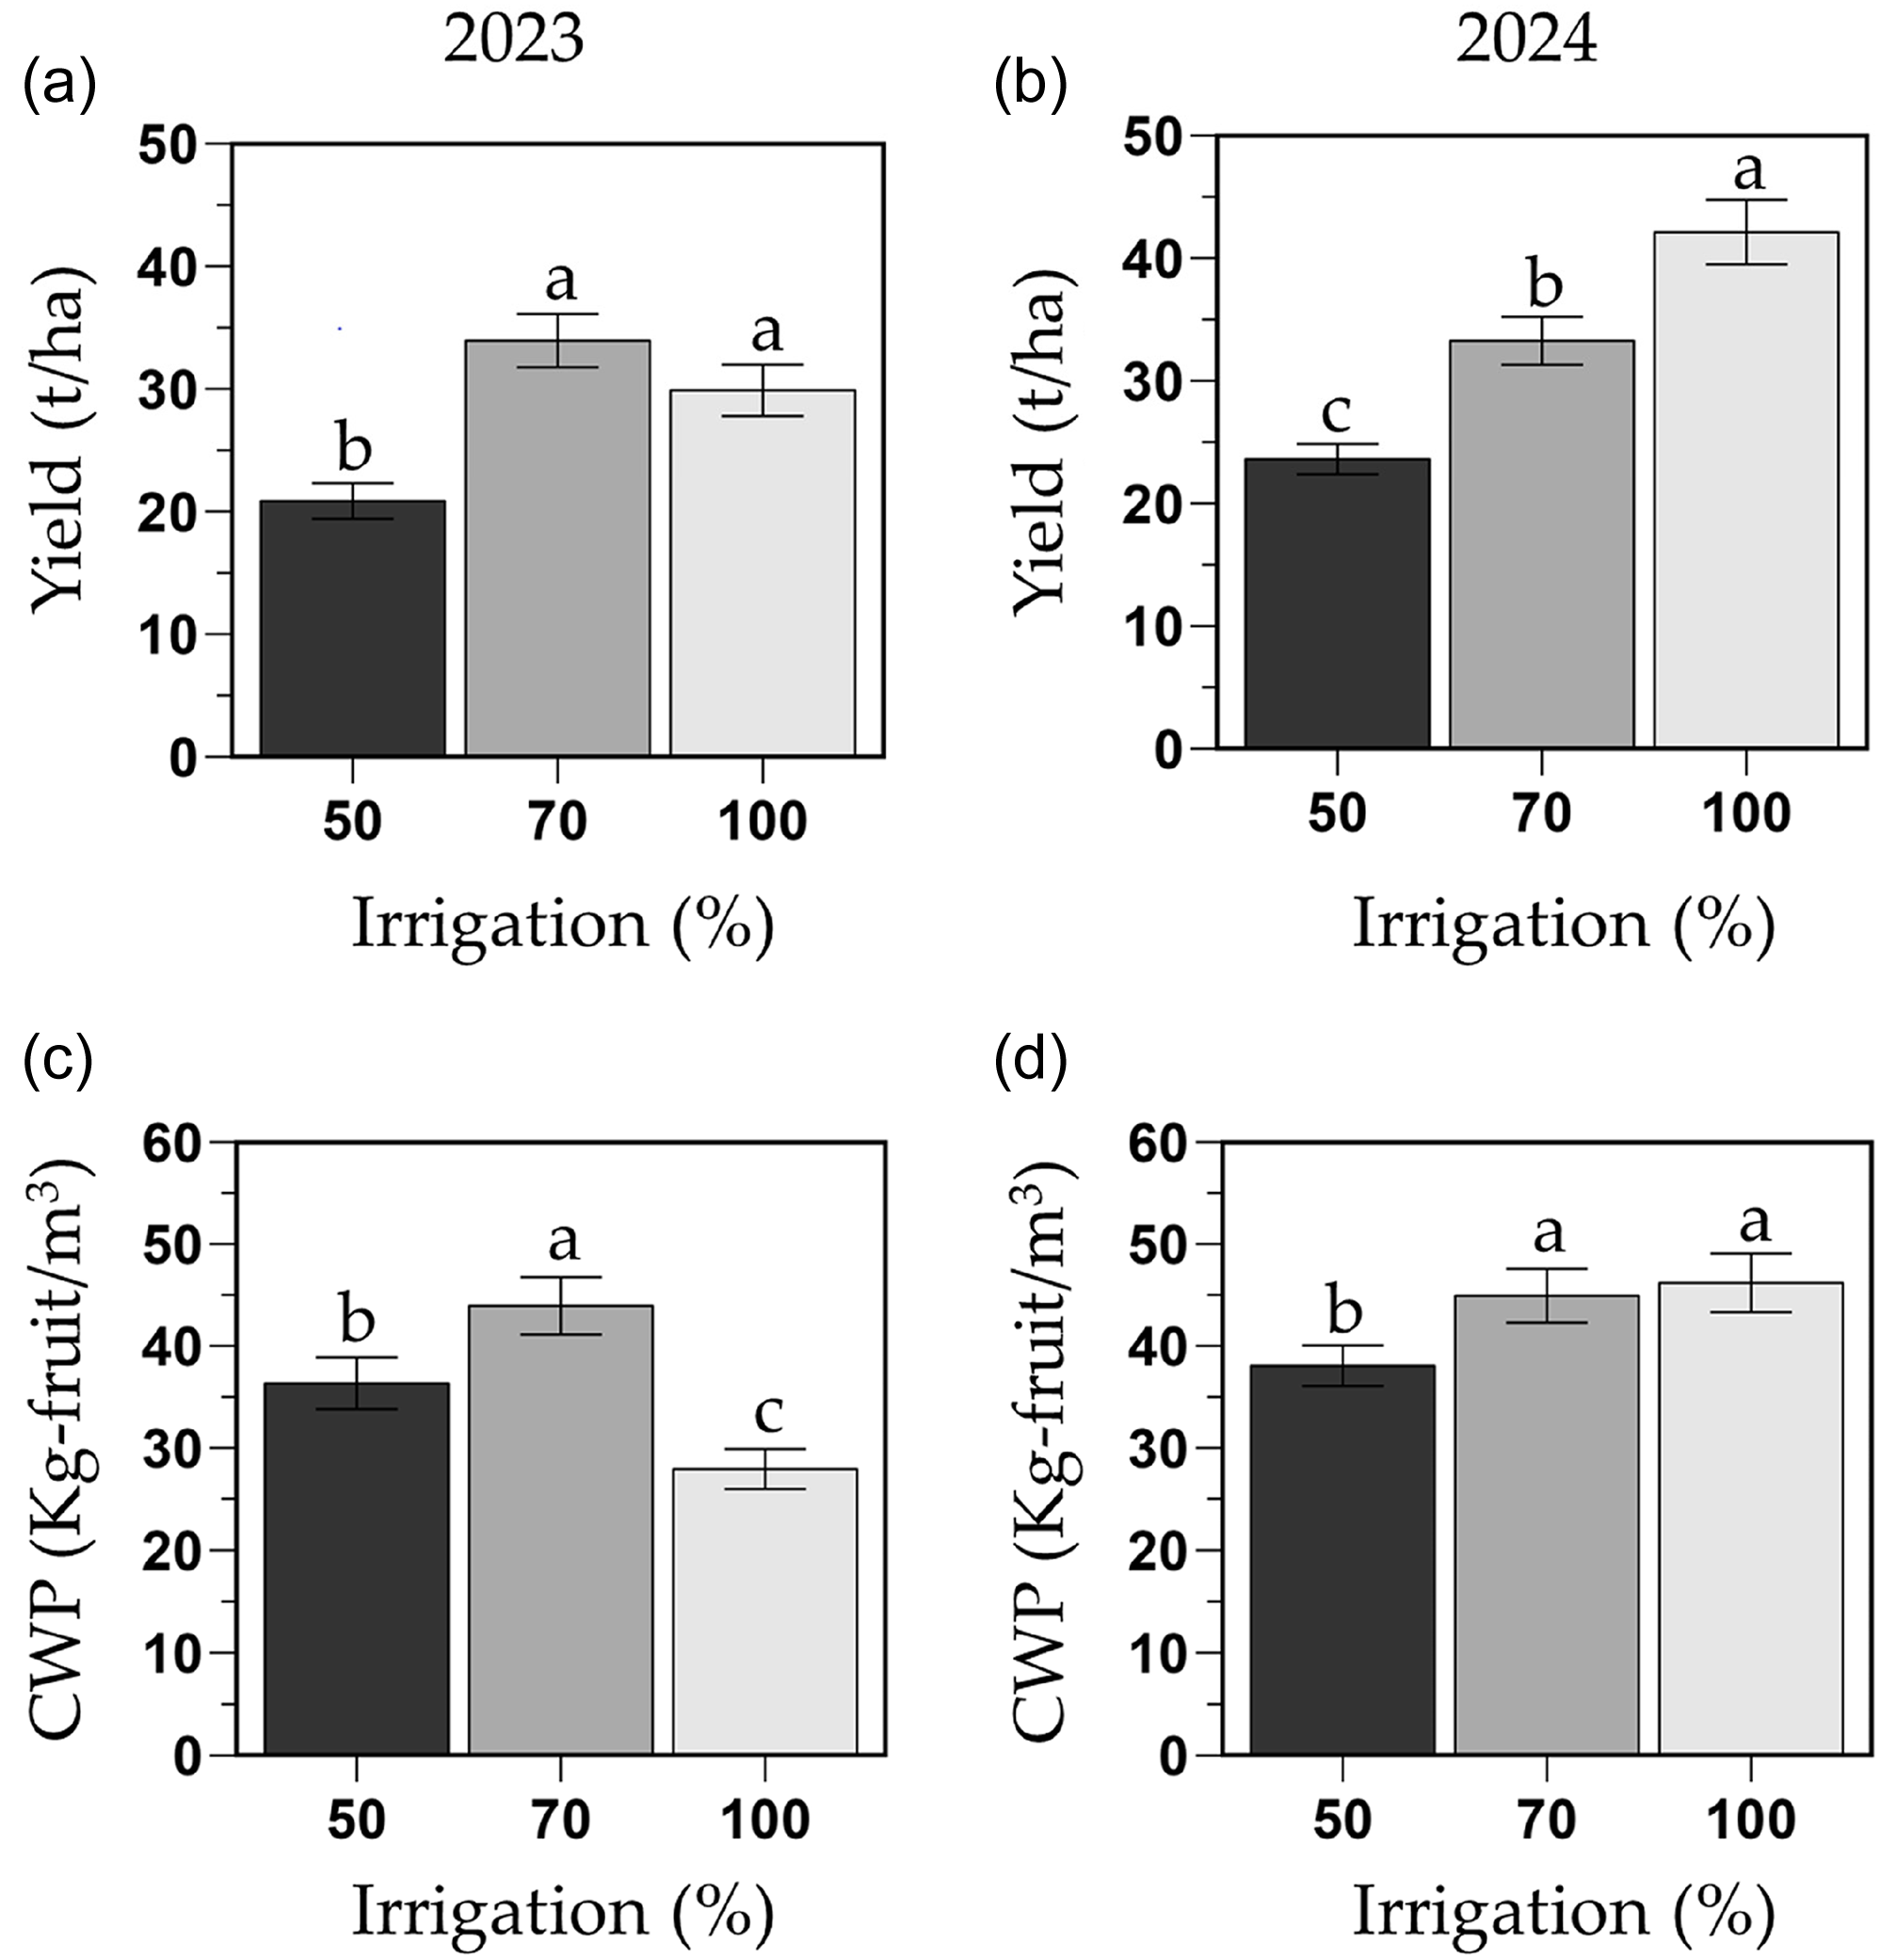
Overall, total yield of the 50 % FC was consistently lower than the other two irrigation treatments, while the performance of the 70 % and 100 % FC irrigation treatments was influenced by year (i.e., irrigation by year interaction; P = 0.004; Figure 5). In 2023, the total yield of the 100 and 70 % FC (29.8 and 33.9 t/ha, respectively) were similar, but the yield of the 50 % FC (20.8 t/ha) was 31 % lower than the full irrigation treatment (Figure 5a). In 2024, the yield in the 100 % FC (42.1 t/ha) was 21 and 44 % higher than the 70 and 50 % FC treatments (33.2 and 23.6 t/ha, respectively; Figure 5b). In addition, total yield was higher in grafted phenotypes (grafted: 32.6 t/ha; ungrafted: 28.6 t/ha) and significantly in the 100 % FC treatment where grafted plants had a 30 % higher yield than ungrafted plants in year 2024 (47.5 and 36.6 t/ha, respectively; Figure S3B). No other yield differences were observed due to phenotype, regardless of year or irrigation treatment.
Total harvestable fruit yield (t/ha; a and b) and crop water productivity (CWP; kg fruit/m3 H2O; C and D) of the melon cultivar Sarah’s Choice (grafted and ungrafted plants combined). Treatments included a full irrigation (100 % field capacity; FC), and 70 % or 50 % deficit irrigation based on the water applied to the 100 % FC. Values are mean ± SE of two field trials (2023: a and c; 2024: b and d). Means followed by different letters are significantly different at P < 0.05.

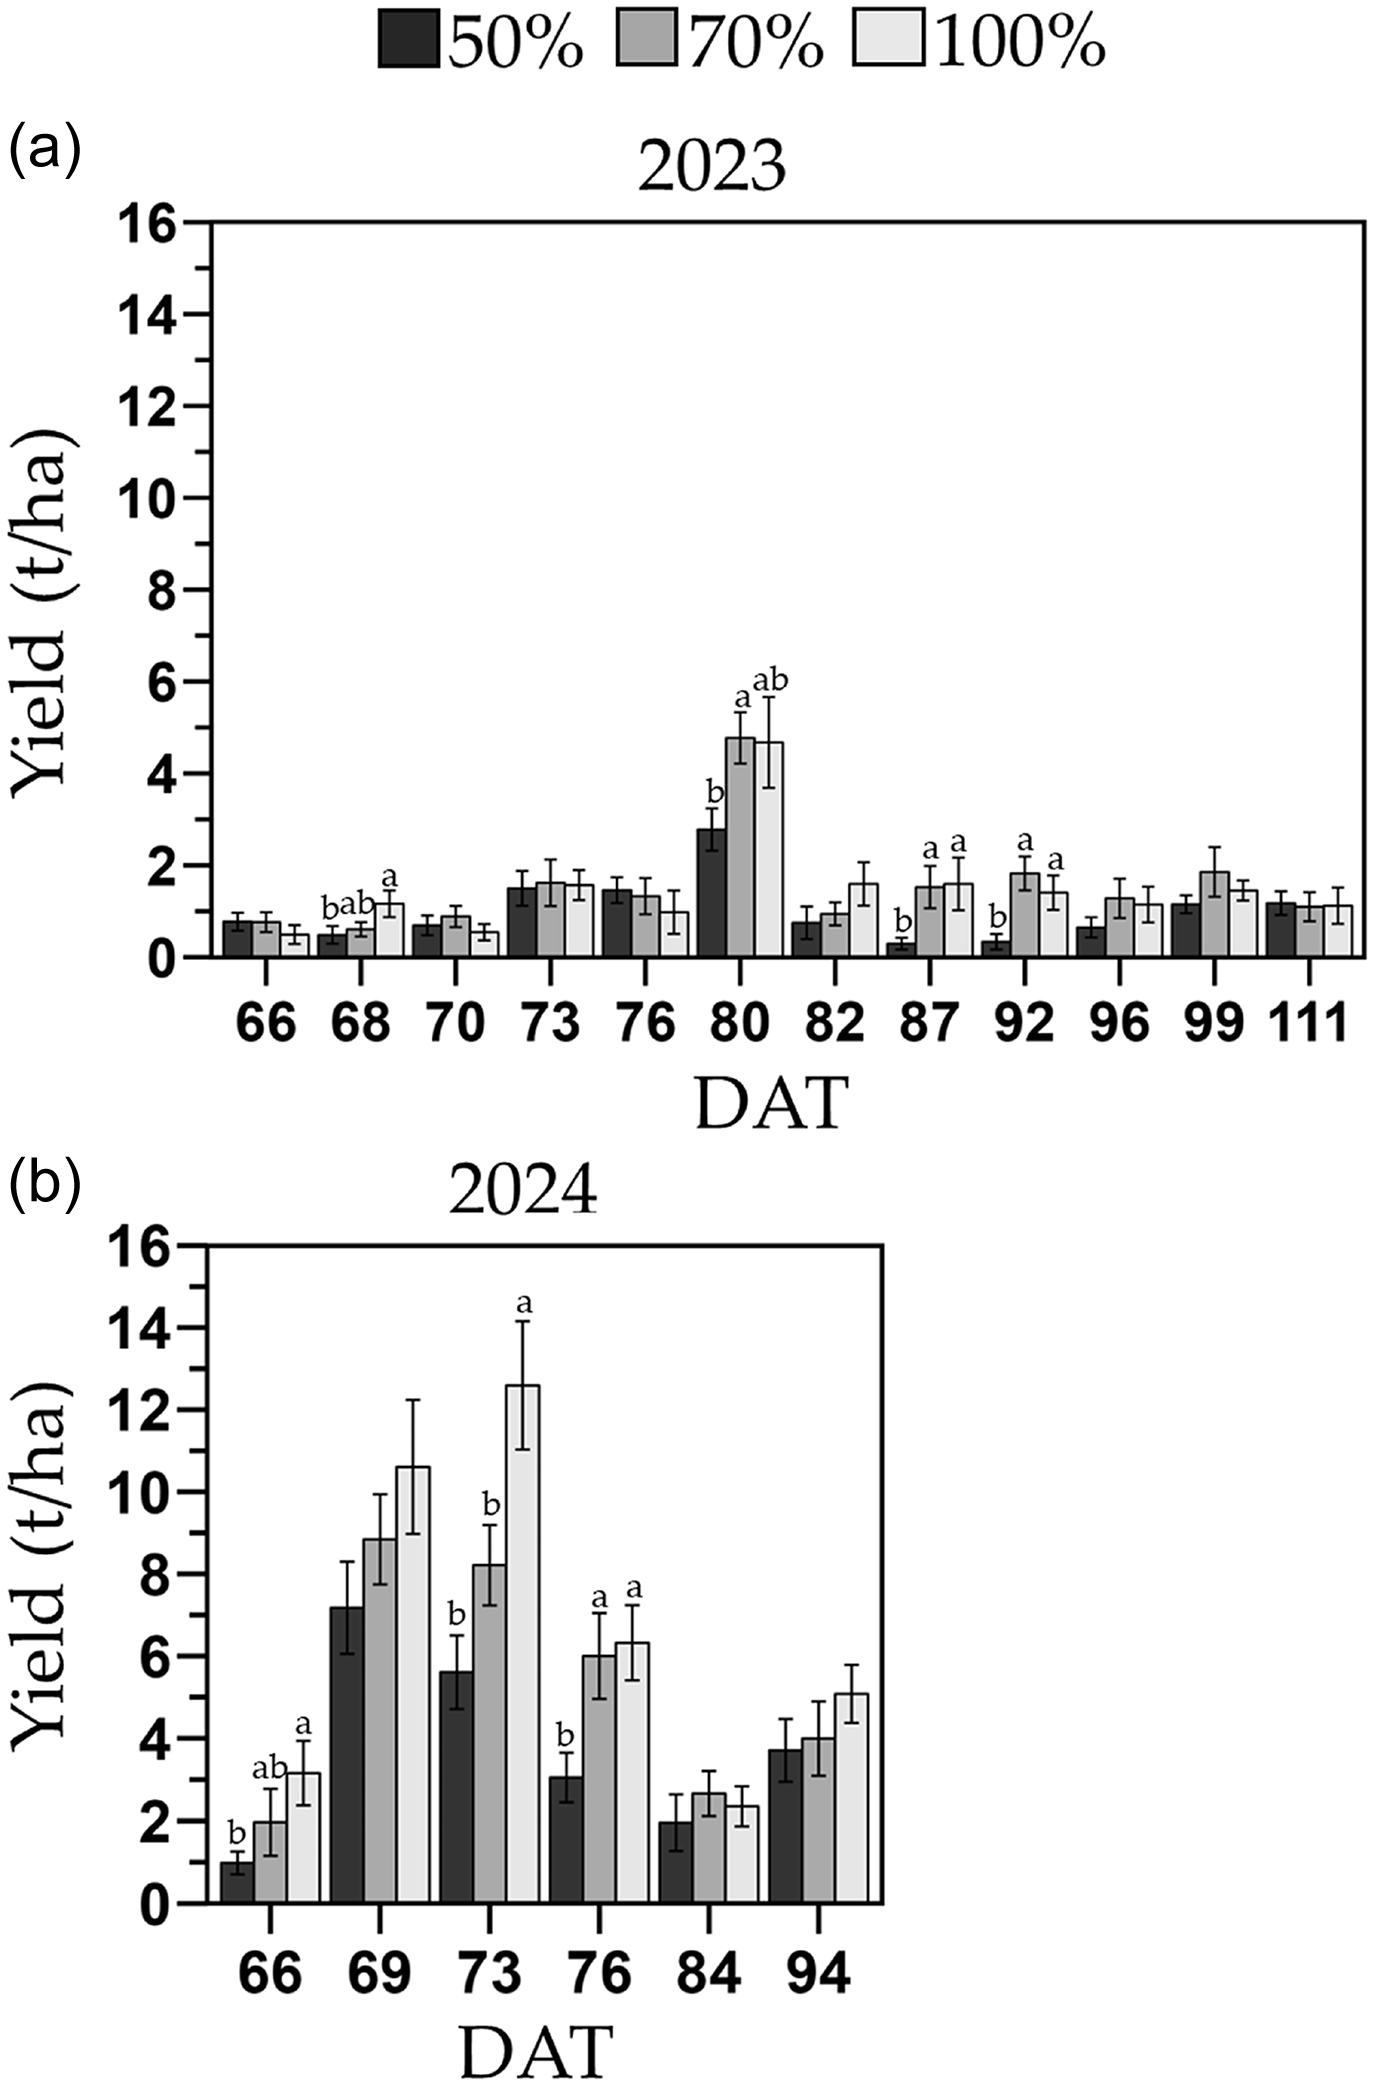
Within individual harvests, plants in the 100 % and 70 % FC treatments yielded over 50 % higher than the 50 % FC treatment during the early harvest periods (2023: 68–92 DAT and 2024: 66–76 DAT; Figure 6). In 2023, peak yield occurred at the sixth harvest out of the 12 total harvests, whereas in 2024, the highest yield was observed between the second and third harvest out of the six total harvests.
Production over time of the melon cultivar Sarah’s Choice (grafted and ungrafted plants combined) during the 2023 (a) and 2024 (b) trials. Treatments included a full irrigation (100 % field capacity; FC), and 70 % or 50 % deficit irrigation based on the water applied to the 100 % FC. Values are mean ± SE. Mean comparisons are within each day after transplant. Means followed by different letters are significantly different at P < 0.05.

Overall, the CWP in the 70 % FC was consistently higher than the 50 % FC treatment, but the CWP of the 100 % FC was the lowest in 2023 and similar to the 70 % FC treatment in 2024 (i.e., irrigation by year interaction; P < 0.001). In 2023, the 70 % FC had the highest CWP (43.9 kg fruit/m3 H2O), followed by the 50 % FC (36.3 kg fruit/m3 H2O) which was 24 % lower than the 70 % FC, and the 100 % FC (27.9 kg fruit/m3 H2O) which was 36 % and 23 % lower than the 70 % and 50 % FC, respectively (Figure 5c). However, in 2024, the CWP of the 100 % FC and the 70 % FC (46.1 and 44.9 kg fruit/m3 H2O, respectively) were similar, whereas the CWP of the 50 % FC (38.0 kg fruit/m3 H2O) was about 18 % lower than the other two irrigation treatments (Figure 5d). In addition, the overall CWP of grafted phenotypes was 13 % higher than the ungrafted plants (grafted: 42.0 kg fruit/m3 H2O; ungrafted: 37.2 kg fruit/m3 H2O) (Figure S3 C and D). In 2024, under the 100 % FC treatment, the grafted phenotype had 30 % higher CWP (52.1 kg fruit/m3 H2O) than the ungrafted one (40.2 kg fruit/m3 H2O) (Figure S3B). No other CWP differences were observed due to phenotype, regardless of irrigation treatment.
Fruits per plant, fruit weight and quality (Brix°)
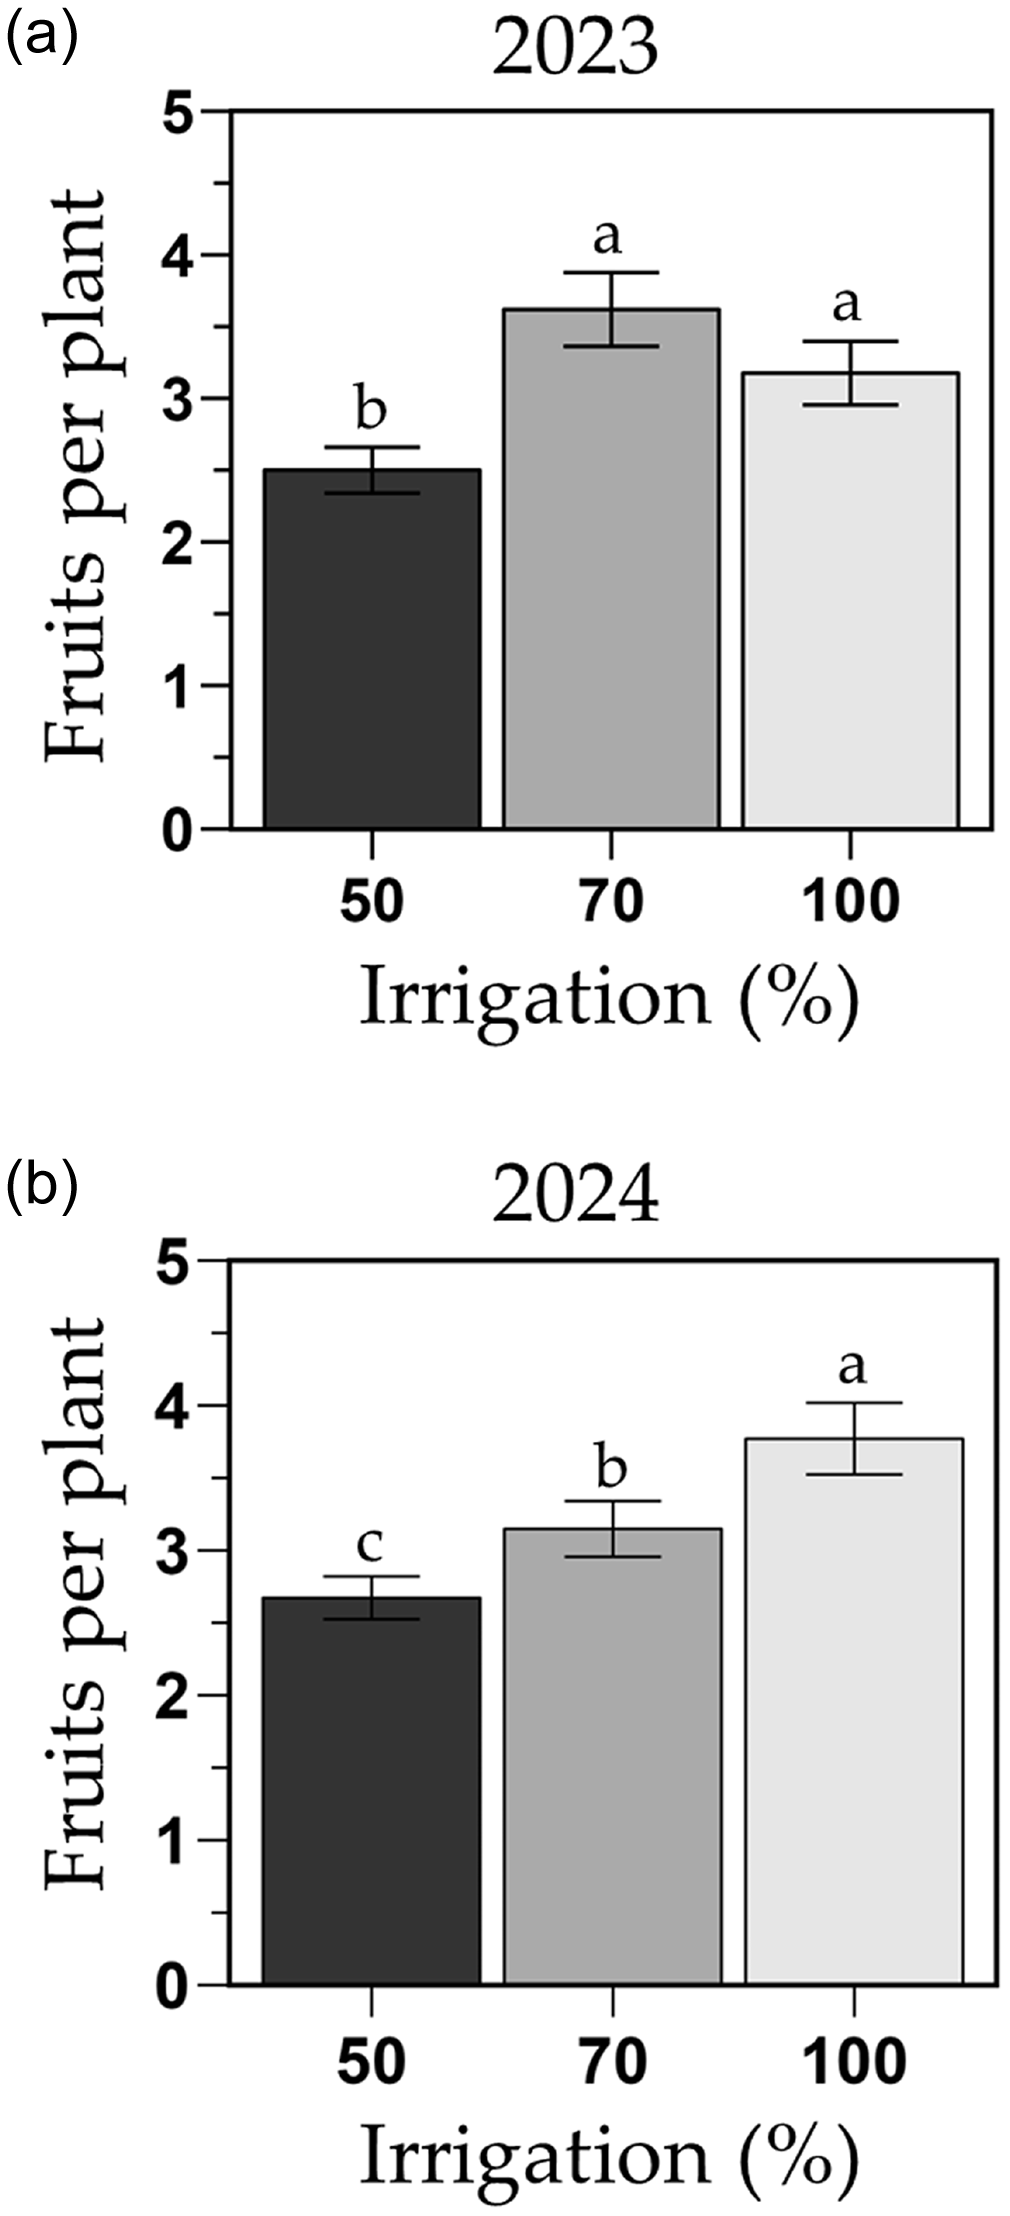
The number of fruits per plant was influenced by the irrigation treatments although dependent on year (i.e., irrigation by year interaction; P = 0.039). This interaction was mainly driven by an 18 % increase in fruits per plant in the 100 % FC treatment from year 2023 to 2024 (Figure 7). In 2023, plants under the 100 and 70 % FC treatments produced similar number of fruits (3.2 and 3.6 fruits/plant; respectively), whereas the 50 % FC (2.5 fruits/plant) produced 22 % less fruits than the 100 % FC (Figure 7a). In 2024, the 100 % FC treatment had more fruits per plant (3.8 fruits/plant) than the other two irrigation treatments (Figure 7b), mainly due to the grafted phenotype producing 27 % more fruits (4.2 fruits/plant) than the ungrafted one (3.3 fruits/plant; Figure S4). In 2024, the 70 % FC produced 18 % less (3.1 fruits/plant) than the 100 % FC (3.8 fruit/plant), and the 50 % FC (2.6 fruits/plant) produced 29 and 13 % less fruits per plant than the 100 and 70 % FC, respectively.
Fruits per plant of the melon cultivar Sarah’s Choice (grafted and ungrafted plants combined) during the 2023 (a) and 2024 (b) trials. Treatments included a full irrigation (100 % field capacity; FC), and 70 % or 50 % deficit irrigation based on the water applied to the 100 % FC. Values are mean ± SE. Means followed by different letters are significantly different at P < 0.05.

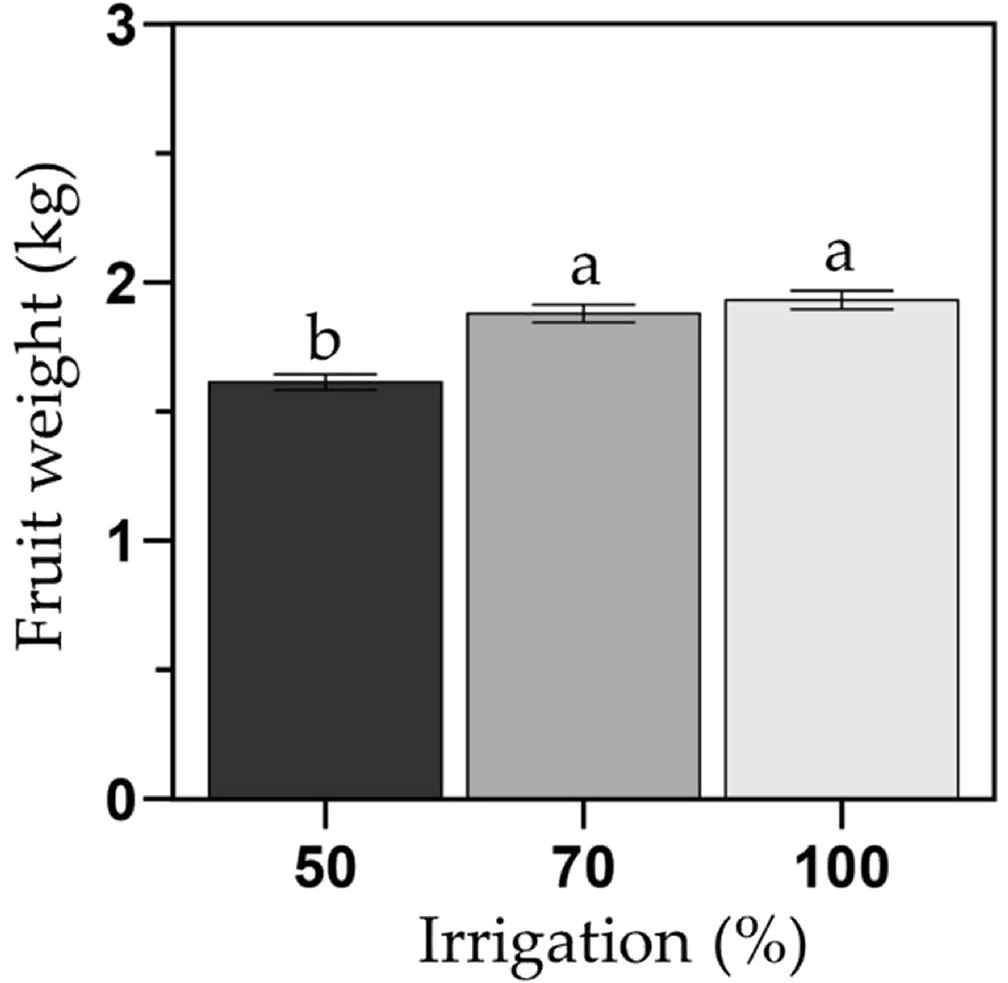
Fruit weight was similar between the 100 % and 70 % FC (1.93 and 1.87 kg/fruit), but 17 % lower in the 50 % FC (1.61 kg/fruit) than the 100 % FC treatment (Figure 8). Fruit weight remained similar between years and no differences between grafted and ungrafted phenotypes were observed (Figure S5).
Average fruit weight (kg) of the melon cultivar Sarah’s Choice (grafted and ungrafted plants combined). Treatments included a full irrigation (100 % field capacity; FC), and 70 % or 50 % deficit irrigation based on the water applied to the 100 % FC. Values are mean ± SE of two field trials (one per year). Means followed by different letters are significantly different at P < 0.05.

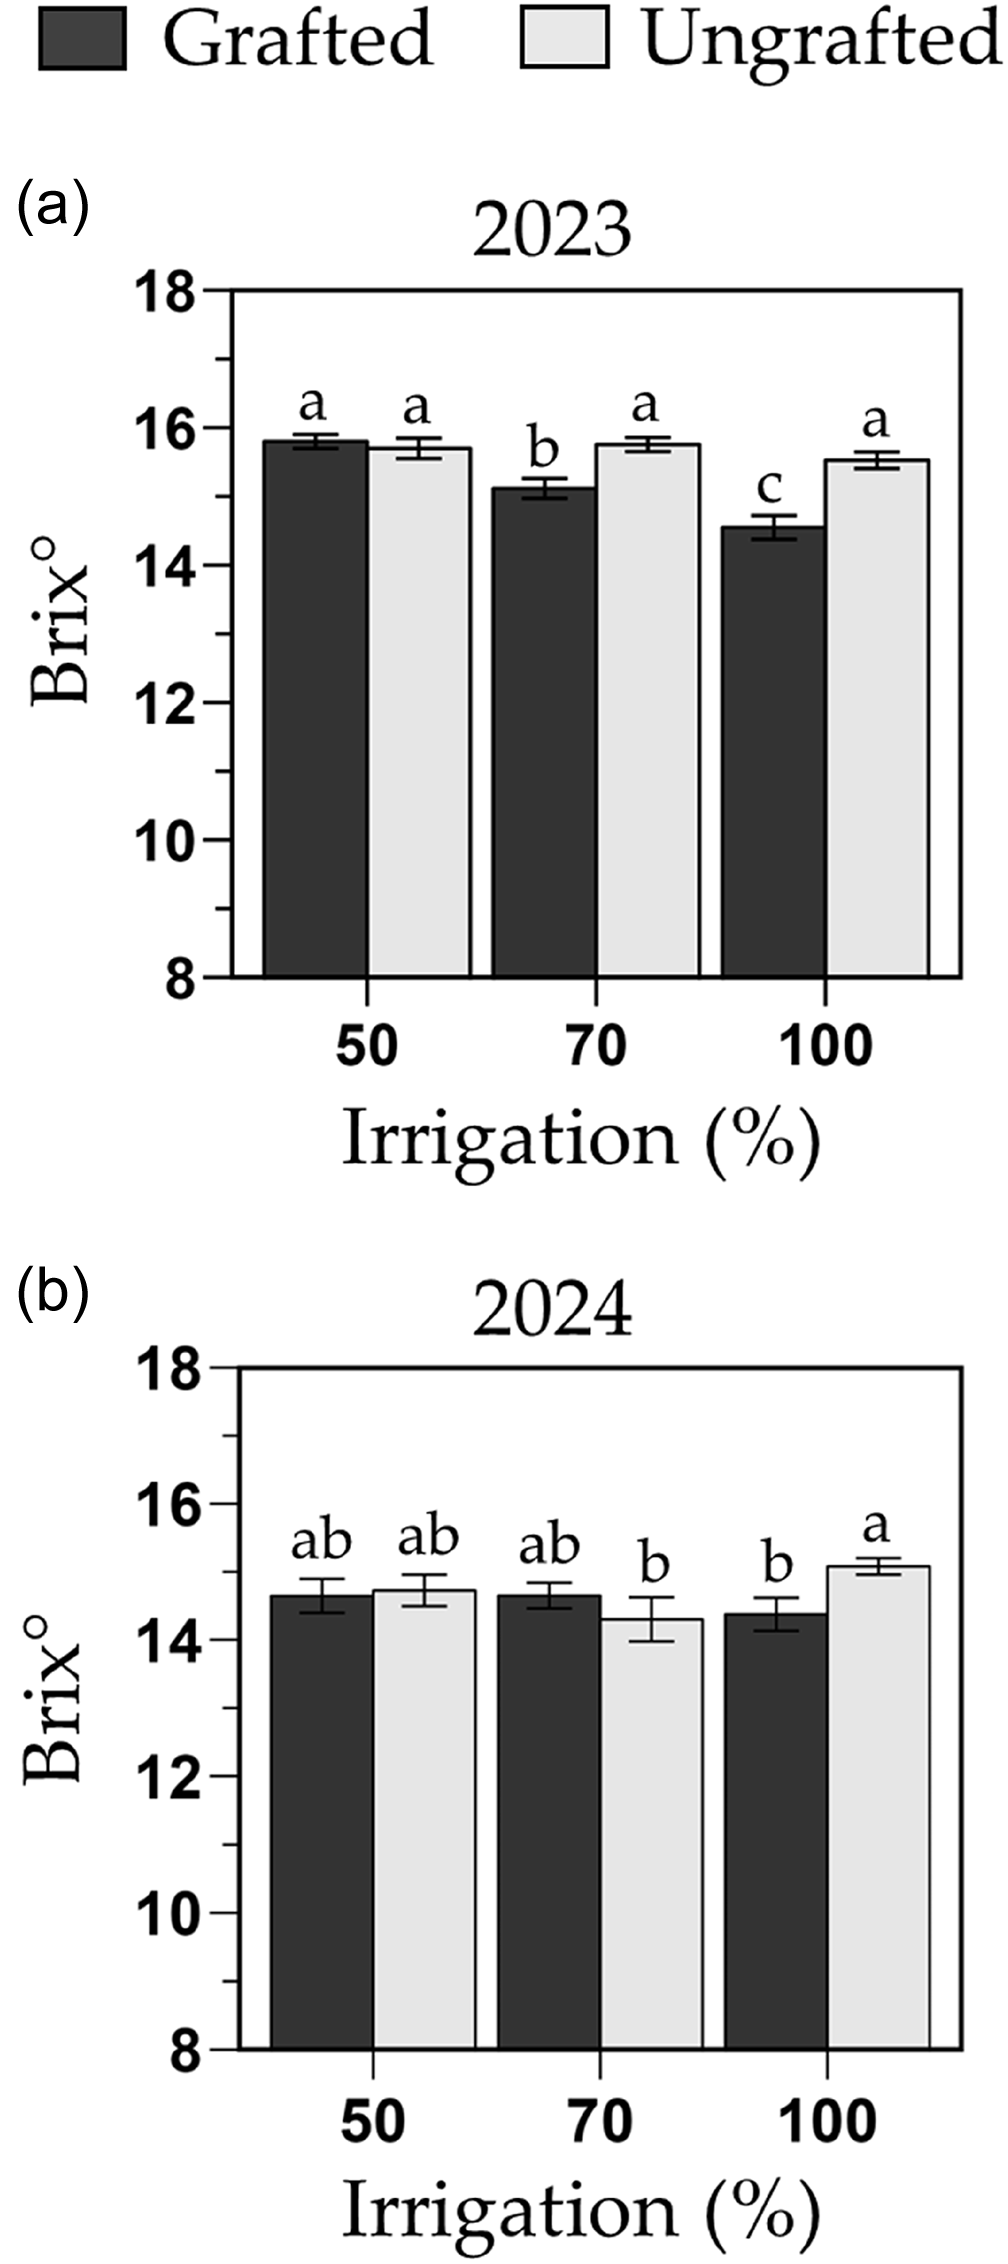
Fruit quality was affected by irrigation, phenotype and year, and significant interactions between irrigation and year or phenotype were observed (P = 0.007 and <0.001, respectively). In 2023, fruit quality of grafted plants in the 70 and 100 % FC decreased by 4 and 8 % (15.1 and 14.5 Brix°, respectively) compared to any other irrigation by phenotype treatment combination (average 15.7 Brix°; Figure 9a). In 2024, ungrafted plants in the 100 % FC treatment had one of the highest fruit qualities (15.1 Brix°), which was 5 % higher than grafted plants in the 100 % FC (14.4 Brix°) and ungrafted plants in the 70 % FC (14.3 Brix°; Figure 9b). Despite these variations, all melons met USDA fancy grade standards (i.e., Brix° > 11) in both years (Kleinhenz and Bumgarner, Reference Kleinhenz and Bumgarner2012).
Soluble solid content (Brix°) of the melon cultivar Sarah’s Choice grafted onto Carnivor rootstock, and the ungrafted cultivar during the 2023 (a) and 2024 (b) trials. Treatments included a full irrigation (100 % field capacity; FC), and 70 % or 50 % deficit irrigation based on the water applied to the 100 % FC. Values are mean ± SE. Means followed by different letters are significantly different at P < 0.05.

Discussion
The current study shows that moderate deficit irrigation (70 % FC) in melons improved the effective use of water as plants maintained a similar water potential to the control treatment and the reductions in leaf gas exchange had none or a small impact on yield, depending on year. The consistent application of 30 % less water than the 100 % FC treatment maintained plants under a water-consumptive response even though years differed in ETc and SWD levels. In contrast, the severe deficit irrigation (i.e., 50 % FC) caused prolonged and excessive SWD and triggered a drought response that resulted in a low plant water status, a water-conservative response (e.g., low g s and P n) and yield reductions. Overall, the current study shows that melons can cope with a constant, moderate deficit irrigation throughout the growing season and increase CWP with a low risk of compromising yield.
The first observable impact of deficit irrigation was a decrease in canopy development, as soil moisture decreased from the pre-treatment irrigation, due to limitations in water uptake that reduced the plant water status. Under severe deficit irrigation, the soil matric potential (Ψsoil) declined below −0.63 MPa (i.e., ≥0.45 SWD), lowering the plant water status to similar levels at predawn (Ψpd: −0.64 MPa), and even lower during the day. In cotton and grapevine, Ψpd below −0.5 MPa was associated with a reduced P n and yield (Chastain et al., Reference Chastain, Snider, Collins, Perry, Whitaker, Byrd, Oosterhuis and Porter2016; Tomaz et al., Reference Tomaz, Martínez and Pacheco2021). As canopies grew, the unmet transpiration demands resulted in Ψmd that compromised plant physiological performance as it approached the turgor loss point. For melons, the lowest Ψmd under a terminal drought was determined to be −1.3 MPa (di Santo et al., Reference di Santo, Knipfer and Barrios-Masias2025), close to the Ψmd reached under the severe deficit irrigation treatment in the current study. Low soil moisture availability results in fine root damage (e.g., lacunae formation at Ψsoil > −0.6 MPa; Cuneo et al., Reference Cuneo, Knipfer, Brodersen and McElrone2016) and earlier root suberization, which can lower root hydraulic conductivity and compromise root water uptake capacity even when soil moisture content increases (Barrios-Masias et al., Reference Barrios-Masias, Knipfer and McElrone2015; Bonarota et al., Reference Bonarota, Toups, Bristow, Santos, Jackson, Cramer and Barrios-Masias2024). In the current study, it is possible that in addition to having lower soil moisture availability, the 50 % FC treatment had reductions in root hydraulic conductivity that further compromised water uptake and resulted in lower Ψmd and g s as plants coped with turgor loss due to high daily ETc (≥7 mm/day).
Under the moderate deficit irrigation, g s decreased by 34 % compared to the control treatment, and this stomatal regulation was partly responsible for the 14 % decrease in P n, which reflects the asynchronous drought response in leaf gas exchange, commonly observed in several crops (tomato: Barrios-Masias and Jackson, Reference Barrios-Masias and Jackson2016; melon: Sarabi et al., Reference Sarabi, Fresneau, Ghaderi, Bolandnazar, Streb, Badeck, Citerne, Tangama, David and Ghashghaie2019; grapevine: Bonarota et al., Reference Bonarota, Toups, Bristow, Santos, Jackson, Cramer and Barrios-Masias2024). The drought response may have included hydraulic or chemical root-to-shoot signalling (e.g., ABA) to reduce stomatal conductance and increase resistance to water loss (watermelon: Li et al., Reference Li, Mo, Cui, Yang, Guo, Wei, Yang, Zhang, Ma and Zhang2019; tomato: Hernandez-Espinosa and Barrios-Masias, Reference Hernandez-Espinoza and Barrios-Masias2020; cotton: Ma et al., Reference Ma, Yuan, Mithöfer, Geilfus and Dodd2024). Depending on the intensity of the drought stress, stomatal regulation may constrain P n to levels that impact the overall plant performance. The prolonged drought of the 50 % FC treatment severely limited leaf gas exchange although it increased WUEi, but the trade-off was a reduction in canopy development, total carbon assimilation and yield. In addition to reducing water loss by stomatal regulation, plants may respond with either osmotic adjustment or changes in cell wall elasticity to maintain cell turgor and physiological functioning (Kusvuran, Reference Kusvuran2012; Lambers et al., Reference Lambers, Chapin and Pons2008). In melons, the strategy to prevent turgor loss is dependent on variety (Fila et al., Reference Fila, Zeinalipour, Badeck, Delshad and Ghashghaie2019), and in the current study, the small changes in leaf osmotic potential were indicative of a passive increase in solutes due to leaf water loss rather than an active drought response mechanism (di Santo et al., Reference di Santo, Knipfer and Barrios-Masias2025). Yet, plants under the moderate deficit irrigation maintained their water uptake capacity, likely due to maintenance of root hydraulic conductivity (grapevine: Barrios-Masias et al., Reference Barrios-Masias, Knipfer and McElrone2015) and root osmotic adjustment (barley: Afshari-Behbahanizadeh et al., Reference Afshari-Behbahanizadeh, Akbari, Shahbazi and Alahdadi2014), which resulted in Ψpd similar to the control treatment even when SWD was, on average, 40 % higher than the control treatment.
The reductions in plant growth, due to drought stress, impacted the plant reproductive stage and impaired fruit set and development as a result of the plant lower carbon assimilation capacity and reduced cell turgor. In addition, the lower soil moisture content may have decreased nutrient uptake as nutrient mobility decreases by 10- to 100-fold from Ψsoil of −0.1 to −1.0 MPa, which were reached under the severe deficit irrigation treatment (Contreras et al., Reference Contreras, Plaz, Lao and Segura2012; Lambers et al., Reference Lambers, Chapin and Pons2008). This could explain the slight increase observed in NDVI for the 100 and 70 % FC treatments, suggesting a higher canopy nitrogen content than in the severe deficit irrigation treatment (Plett et al., Reference Plett, Ranathunge, Melino, Kuya, Uga and Kronzucker2020); although NDVI values above 0.75 may be less reliable in predicting nitrogen and chlorophyll content (rice: Padilla et al., Reference Padilla, Teresa Peña-Fleitas, Gallardo and Thompson2014; melon: Rehman et al., Reference Rehman, Borja Reis, Akbar and Linquist2019; tomato: Bonarota and Barrios-Masias, Reference Bonarota and Barrios-Masias2024). As reductions in nutrient uptake and carbon assimilation may have hindered crop development under the 50 % FC treatment, a delay in the appearance of female flowers, and reduction in nectar production and pollination likely compromised fruit set, frequently occurring with the increase in air temperature in the Summer season (Kirnak and Dogan, 2009; Barman et al., Reference Barman, Tenhaken and Dötterl2024; Kuscu and Turhan, Reference Kuscu and Turhan2022; Yavuz et al., Reference Yavuz, Seymen, Yavuz, Çoklar and Ercan2021). Moreover, plants coping with drought consume more of the assimilated carbon for respiration demands associated with ameliorating stress damage (e.g., photoinhibition), and this can reduce photosynthate allocation to the fruit sink (Fabeiro et al., Reference Fabeiro, Martõ, De, Olalla and De Juan2002; Lambers et al., Reference Lambers, Chapin and Pons2008; Yavuz et al., Reference Yavuz, Seymen, Yavuz, Çoklar and Ercan2021).
Although grafting improves plant performance in several vegetable crops (e.g., melon: Ezzo et al., Reference Ezzo, Mohamed, Glala and Saleh2020; tomatoes: Bristow et al., Reference Bristow, Hernandez-Espinoza, Bonarota and Barrios-Masias2021; watermelon: Mohamed et al., Reference Mohamed, Mennat-Allah, Khalid, Elwan and Abdel-Salam2021), in the current study, grafting did not show a consistent benefit as its performance was more dependent on environmental factors. Grafted plants under well-irrigated conditions produced a higher yield during the 2024 trial, which was a year with fewer extreme temperatures than in 2023 (e.g., late Spring frost) that allowed earlier transplanting under more favourable conditions for crop establishment. A delay of ten days in transplanting can reduce the period of growth and development by seven days (Franczuk et al., Reference Franczuk, Rosa, Kosterna-Kelle, Zaniewicz-Bajkowska and Panasz2017), which may have been the case for the 2023 trial. In 2024, the rootstock may have conferred faster root growth under suboptimal soil temperatures, which are common in this high desert region (tomato: Bristow et al., Reference Bristow, Hernandez-Espinoza, Bonarota and Barrios-Masias2021), and enhanced water and nutrient uptake in otherwise low stress conditions (Hong et al., Reference Hong, Liu, Li and Li2006; Colla et al., Reference Colla, María, Suárez, Cardarelli and Rouphael2010; Poor, Reference Poor2015; Shrestha et al., Reference Shrestha, Mattupalli and Miles2022). Fast plant establishment and canopy development can produce female flowers earlier and result in a longer flowering period with more fruit set (Sankhala et al., Reference Sankhala, Verma, Nandre, Vadodaria, Joshi and Rathod2019), which was likely the case for grafted plants in 2024. Moreover, the number of female flowers is a trait more dependent on environmental factors rather than genetic influences from the rootstock (Sharma et al., Reference Sharma, Leskovar, Crosby and Ibrahim2020). Although, in other studies, melon grafting was reported to increase plant size and yield under deficit irrigation (Ezzo et al., Reference Ezzo, Mohamed, Glala and Saleh2020; Mohamed et al., Reference Mohamed, Mennat-Allah, Khalid, Elwan and Abdel-Salam2021), in the current study, the rootstock had a limited capacity to offset prolonged water stress. In addition, grafting on squash hybrids is known to cause reductions in fruit quality in some rootstock-scion combinations (Zhao and Guan, Reference Zhao and Guan2018; di Santo and Barrios-Masias, Reference di Santo and Barrios-Masias2024), and this was observed in grafted plants under lower drought stress conditions (i.e., 100 % FC). Fruit development under water stress can increase the amount of osmolytes, such as sugar and proline, in fruits and improve the total soluble solids, which was an overall response in the current study as irrigation deficit intensified (Barzegar et al., Reference Barzegar, Lotfi, Rabiei, Ghahremani and Nikbakht2017; Ercan et al., Reference Ercan, Sonmez, Kabaş, Kabas, Calık Zyambo, Gölükcü and Paraschiv2024).
Conclusion
Our research highlights the potential of a consistent, moderate deficit irrigation (i.e., 70 % FC treatment) as a sustainable water management strategy for melon production. The increase in CWP of the 70 % FC treatment resulted in a 25 % reduction in irrigation water with minimal yield decline compared to the full irrigation treatment. Our data on plant water relations show that melons were able to physiologically acclimate and maintain a water-consumptive response even when SWD was higher than the recommended 0.45. Although grafting and environmental conditions affected crop performance, these results provide a further understanding of melon physiological drought responses and insights for developing irrigation strategies to mitigate the impacts of drought in crop production.
Supplementary material
The supplementary material for this article can be found at https://doi.org/10.1017/S0021859626100665.
Acknowledgements
We would like to thank Syngenta (Greensboro, North Carolina) for providing the rootstock seeds and the technical assistance of Zachary Heinhold and Gabi Franco.
Author contributions
HdS: formal analysis, investigation, methodology, writing – original draft and writing – review and editing. FBM: conceptualization, investigation, methodology, project administration, supervision, writing – original draft and writing – review and editing. All authors discussed the results and contributed to the final manuscript.
Funding statement
This material is based upon work that is supported by the National Institute of Food and Agriculture, U.S. Department of Agriculture, under award number 2019-38640-29880 through the Western Sustainable Agriculture Research and Education program under project number SW20-918, and by the Nevada DRIVE program at UNR.
Competing interests
The authors declare there are no conflicts of interest.
Ethical standards
Not applicable.


 Open access