


1. Introduction
1.1. Background & motivation
Finite Element (FE) simulation has been a cornerstone of engineering analysis since the 1970s, evolving with computational advancements and becoming integral to automotive product development (Reference Liu, Li and ParkLiu et al., 2022). Within the established Product Development Process (PDP), three-dimensional (3D) Computer-Aided Design (CAD) combined with FE analysis enables iterative design and virtual validation, strongly correlating with physical crash tests (Reference Mario, Dietrich, Gfrerrer and LangMario et al., 2013;Reference Yadav and PradhanYadav & Pradhan, 2014; Reference Borsotto, Jansen and TholeBorsotto et al., 2018). Vehicle safety encompassing active and passive measures relies heavily on crash simulations for design validation (Fatfouta, 2020). Despite widespread adoption, FE workflows face significant bottlenecks in CAD pre-processing, mesh generation, and data transfer between CAD and CAE domains, driven by complexity, computational cost, and tool integration challenges (Reference Koch, Mattern and BitscheKoch et al., 2018; Reference Knehler, Thiele, Matthus and FriedrichKnehler et al., 2018). Manual simplification of detailed CAD models remains time-intensive and expertise-driven (Reference LualdiLualdi, 2024).
Key requirements and motivation

Late-stage engineering changes in PDP are costly and time-consuming (Reference Altner, Redinger, Valeh, Kevin, Neckenich, Rapp, Winter and AlbersAltner et al., 2022). Numerous local modifications such as hole repositioning or reinforcement additions in Body-in-White (BIW) structures occur under tight timelines. These changes, while minor in topology, require FE model updates and simulations, adding to development delays (Reference LualdiLualdi, 2024). Consequently, there is a growing need for decision-support systems that leverage historical design variations and simulation data to predict the impact of local changes, enabling early insights and reducing reliance on full-scale crash simulations. The key targets and motivation for the research paper are stated in the (Table 1).
The focus is on CAD design and its structural crash simulations especially for automotive Body-in-White (BIW).
1.2. Research Objectives
This work aims to address the challenges associated with evaluating the impact of local geometry changes on FE simulation results given only the CAD data as input. Specifically, we seek to:
-
1. Develop methods to detect and represent local geometric modifications across design iterations.
-
2. Design a training pipeline that maps CAD geometry changes to corresponding variations in FE results, thereby quantifying their “impact.”
2. State of the art and research gap
2.1. State of the art
The bigger vision of this research falls in the category of developing automated decision support systems in product development process (PDP) process. In the context of crash analysis and safety validation, closely related work is of (Fatfouta, 2020). This Ph.D. work addresses the research gap concerning the representation of knowledge related to FE results and the support of simulation-aided design using an ontology-based knowledge management system. To characterize impact of a geometrical change, extracting knowledge from simulation results is a crucial task (Fatfouta, 2020). Reference Pakiman, Garcke and SchumacherPakiman et al. (2023) show a structured way to represent crash simulation data in graph data model. To facilitate data analysis and machine learning on FE simulation data, Reference Iza-Teran and GarckeIza-Teran et al. (2019) proposed low dimensional representation of simulation data in spectral domain. This enables comparison of simulations in the spectral domain based on selected finite element (FE) results. Their method takes FE models as input whereas the current research focus is on CAD data input.
CAD data has to be prepared fit for FE simulation, which involves necessary simplification and meshing. (Reference Feng, Zhou and LiFeng, 2020) proposes an automated approach to detect critical features relevant for FE simulation. Surrogate modeling also referred to as meta-modeling has been widely adopted to approximate high-fidelity simulation behaviour, enabling rapid evaluation of design variants and supporting efficient decision-making during iterative design cycles (Reference Queipo, Haftka, Shyy, Goel, Vaidyanathan and Kevin TuckerQueipo et al., 2005).
(Reference Whalen and MuellerWhalen & Mueller, 2021) categorize surrogate-modeling approaches into two main types:
-
1. Parametric feature-based models, which represent designs using fixed-length vectors of predefined parameters (e.g., thickness, hole diameter). While effective, these models constrain the design space and rely heavily on expert-defined features.
-
2. Non-Parametric models, which learn directly from geometric data without requiring, handcrafted parameters. These models, often termed as geometry-aware surrogates, utilize representations such as shape descriptors, point clouds, signed distance functions, and graphs.
Recent advances in geometric deep learning (GDL) (Reference Bronstein, Bruna, LeCun, Szlam and VandergheynstBronstein et al., 2017) have enabled learning on non-Euclidean domains, offering more natural and flexible representations of geometry. These techniques open new possibilities for capturing complex shape variations and learning the impact of geometry changes on simulation outcomes.
Different approaches are used to represent geometry and give input to non-parametric models mentioned above. Discrete surface meshes usually obtained by triangulating procedure captures the topological information of 3D geometries. Shape descriptors operating on triangular meshes based on discrete differential geometry concepts provides a rich set of tools for analysing triangulated meshes. Key geometric properties such as geodesic distances (shortest paths on surfaces) and curvature (variation in surface normal) are commonly used to characterize shape features. For example: (Reference Li and FanLi & Fan, 2013) employed principal curvature directions for feature detection. (Reference Wang and SolomonWang & Solomon, 2019) demonstrated the use of the Laplace-Beltrami spectrum for shape analysis, where eigen-decomposition enables projection of functions onto intrinsic and extrinsic shape bases. Reference Harik, Shi and BaekHarik et al. (2017) applied heat kernel signatures to detect features in CAD geometries. (Reference Vijai Kumar and VuikKumar & Vuik, 2021) show a way to identify holes in the discretized geometry using Gaussian curvature evaluated at each vertex position. Extracting features using deep learning methods directly from CAD data specifically from Boundary Representation (BREP) is recently received attention, overview of the same is described in the detailed survey conducted by (Reference Heidari and IosifidisHeidari & Iosifidis, 2024). Extracting shape embedding from BREP data tuned for specific downstream task is shown by (Reference Jayaraman, Sanghi, Lambourne, Willis, Davies, Shayani and MorrisJayaraman et al., 2021) using graph neural network architecture. GDL has motivated research in classification and segmentation tasks for CAD geometries example for machining part feature recognition (Reference Colligan, Robinson, Nolan, Hua and CaoColligan et al., 2022), (Reference Lambourne, Willis, Jayaraman, Sanghi, Meltzer and ShayaniLambourne et al., 2021). (Reference Ghaffarishahri and RivestGhaffarishahri & Rivest, 2020) describe automatic detection of engineering features on aerospace sheet metal parts given CAD geometry in Standard for the Exchange of Product (STEP) format.
2.2. Discussion & research gap
Considering the key motivations outlined in (Table 1), the objective of this research is to establish a robust and explicit link between CAD and CAE for analysing the impact of geometric modifications and enabling a learning pipeline capable of accurately predicting structural crash behaviour. Geometry aware surrogate modeling, as discussed in the previous section, is closely related to this objective. Reference Cunningham, Simpson and TuckerCunningham et al. (2019) show an approach to obtain shape embedding in a latent space from a point cloud representation of 3D geometry, which can be further used as input to predict simulation performance metric. Other approaches employ FE mesh data directly as input to the geometric deep learning architectures. However, for automotive structural components with complex designs, such methods require high mesh or sampling density, leading to substantial computational cost.
Architectures such as PointNet++ (Reference Qi, Yi, Su and GuibasQi et al., 2017), offer partial mitigation by processing point-cloud data while incorporating neighbourhood information to encode local geometric features. More recent work, such as that of Reference Nabian, Chavare, Akhare, Ranade, Cherukuri and TadepalliNabian et al. (2025), investigates FE mesh based learning methods for predicting crash responses and demonstrates an efficient approach for operating directly on BIW structures using their FE mesh. To the best of our knowledge, direct mapping of CAD geometrical changes to structural behaviour remains an open research question, thereby defining the current research gap addressed in this work.
The primary focus of current research therefore shifts toward leveraging CAD geometry as the starting point and identifying suitable data structures to predict FE performance indicators without generating a full mesh or performing detailed FE analysis. Achieving this would enable the integration of predictive models directly within early design stages of CAD systems, supporting rapid design and performance feedback loops. Furthermore, most existing literature on encoding CAD information focuses on classification or segmentation tasks.
In the following sections, we address the key aspects necessary to achieve the research objectives:
-
1. Characterization of geometry change impact - We analyse how variations in CAD geometry influence structural crash simulation outcomes.
-
2. Approaches to map CAD & CAE - We propose a training pipeline for predicting geometry change impact on FE result and explore the parametric domain common to CAD & FE model.
-
3. Foundational concepts for capturing geometry information - We experiment with fundamental approaches for encoding geometric features to capture local changes and propose feature extraction method suitable for designed training pipeline.
3. Characterization of geometry change impact
3.1. Local geometry changes in automotive sheet metal parts
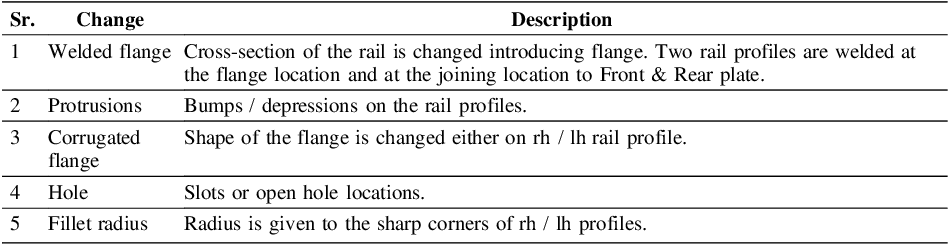
This study focuses on sheet metal components within the Body-in-White (BIW) structure, which are characterized by their thin profiles and manufacturing via sheet forming processes. During product development, these parts often undergo local geometric modifications, which may or may not significantly affect simulation outcomes. As an example, CAD geometries and simulations developed by T. Pohl (Reference Pohl, Schumacher and BeyerPohl et al., 2024) are investigated. These simulations are for a beam model made from two C section parts, connected by spot-welds. This model represents a segment of a front rail structure. Most basic version of this design is rectangular profile section with front and rear plates. Design version with different parts and geometrical features is depicted in (Figure 1). In the context of crash safety validation, specific engineering features such as holes or reinforcements are deliberately introduced to influence energy absorption behaviour (Reference Pohl, Schumacher and BeyerPohl et al., 2024). The base rail is modified by adding a hole, bead and changing its position. Other changes are given in Table 2.
Front Rail assembly with part labels and geometry changes performed

Geometrical changes in Rail assembly

In crash analysis, the most important FE parameters evaluated are by CAE engineers are the intrusion or the relative displacement, acceleration, plastic strains, von Mises stress and time histories of sectional forces and internal energy (Reference Pakiman, Garcke and SchumacherPakiman et al., 2023). The FE model for the simulation files is front impact on a rigid wall with specified impact velocity. By keeping all other parameters constant and only introducing a geometric variation in the designs, for e.g. introducing hole, significantly changes the results. Example is shown in (Figure 2), which compares base line version without hole to versions with hole placed in two positions. Plastic strain contours and maximum values, along with deformation modes, are presented for both the initial impact and final deformation stages.
Front rail crash simulation setup. Three design variations of Front rail namely: rail with hole at the front side (top), without hole (middle), rail with hole at the back side (bottom)

These results demonstrate that the presence and position of geometric features can significantly influence finite element (FE) outcomes, including strain distribution and deformation modes, due to changes in crash load paths along the structure. In practical scenarios, successive design iterations such as current and predecessor versions are often closely similar, with local changes introduced for various reasons, including adjustments to connected component sizing or deliberate modifications to influence crash behaviour. In real-world applications, such local changes are either implemented by the CAE team or introduced through new design versions.
3.2. Observations
Comparative study of geometry change impact on FE results

The design variants showing local geometric changes (Table 3) are compared against FE results to quantify their influence. Plastic strain and section force at the rail section are evaluated following the procedure in (Reference Pohl, Schumacher and BeyerPohl et al. (2024)), by averaging values at selected control points. Global internal energy and maximum deformation at the final time step are also considered. The comparison against the baseline configuration without protrusion, fillet radius, or corrugated flange reflects typical predecessorstage design iterations in the automotive PDP. The results in (Table 3) indicate that local geometric modifications can produce notable differences in crash response. Here, impact is classified as “high” when a metric increases substantially relative to baseline, “low” when deviations remain moderate, and “no impact” when results are nearly unchanged. For instance, introducing a fillet radius caused significant increases in plastic strain and total deformation, while modifying the corrugated flange mainly altered section force. In contrast, adding a small protrusion has minimal influence on most metrics, aside from a slight rise in plastic strain. These findings show that even small geometric variations can strongly affect certain crash indicators while leaving others largely unaffected. Traditionally, such observations require full FE simulations or depend on expert judgement, making consistent prediction difficult. Moreover, no single metric or threshold captures the overall structural behaviour change. Therefore, a composite metric combining multiple crash indicators is better suited as the label within a learning framework for predicting the impact of CAD geometry changes on crash performance.
4. Mapping CAD to CAE
4.1. Parametric domain in CAD & FE model
CAD geometry & FE mesh basic difference & conceptual illustration of parametric map

CAD and FE models both rely on parametric domains: CAD uses NURBS surfaces defined by knots and control points, while FE analysis maps the physical domain to a unit parametric space via iso-parametric elements (Reference Dow and DowDow, 1999). Because both describe geometry through intrinsic coordinates, CAD parametrization naturally aligns with analysis formulations and underpins developments such as Iso-geometric Analysis (IGA) (Reference Hughes, Cottrell and BazilevsHughes et al., 2005). Although this work does not explicitly exploit full CAD-FE equivalence, the CAD parametric domain provides a consistent and structured basis for defining the geometrydriven data representations used in this study.
4.2. Design of impact prediction pipeline
Geometry change impact predictor pipeline. Given CAD geometry & FE results for previously performed simulation runs as input training problem is designed

Figure 4 Long description
A diagram of a geometry change impact predictor pipeline. The diagram is divided into three main sections: A. Geometry change analysis, B. FE simulation analysis, and C. Change impact predictor. Panel A, Geometry change analysis, starts with CAD geometry and involves capturing geometry information, designing a data model, and feature encoding. Capturing geometry information includes extracting CAD model data and identifying features that represent geometry changes. Designing a data model involves storing CAD topology, geometry change features, and FE property-related information. Feature encoding includes selecting a suitable encoder architecture and extracting trainable features from geometry and FE data. Panel B, FE simulation analysis, begins with FE results and involves defining a change impact metric. Panel C, Change impact predictor, involves formulating a machine learning problem with inputs of encoded geometry change features and outputs of predicted impact on FE results.
To study how CAD geometry changes affect FE results, we propose a threestage impactprediction pipeline (Figure 4). Part A focuses on constructing a geometryaware data structure that captures the shape and topology of CAD models with local design variations. Part B formulates the FE target by combining relevant simulation outputs into a composite impact metric. Part C defines the corresponding machinelearning task by pairing geometric encodings with FEderived metrics.
As this work does not present full learningpipeline results, the pipeline is introduced as a conceptual framework. The paper further concentrates on Part A, where the central objective is to identify a data structure and encoder capable of operating directly on CAD geometry. Leveraging the shared parametric domain between CAD and FE models provides a consistent basis for capturing geometry and FE response relationships, forming the foundation for future implementation of the complete change - impact prediction pipeline.
5. Foundational concepts for capturing geometry information
To extract features from CAD geometry that effectively detect and represent local shape changes, we discuss two complementary approaches. The first relies on geometry processing of triangular meshes using discrete differentialgeometry operators. The second operates directly in the CAD domain. Based on our experiments, we identify the UVgraph representation as a suitable data structure for Part A of the proposed impactprediction pipeline, as it captures local geometric variations in a structured and scalable manner. Moreover, some of the key concepts from first approach could be used in combination with the default second approach by modifying UV-graph features.
5.1. Experimentation on triangular meshes
Since sheet metal parts in FE models are represented by their mid-surface, we use this mid-surface and apply triangulation for testing purposes, ensuring adequate mesh quality. Using Python and the libigl (Reference Panozzo, Jacobson, Jakob and PuppoPanozzo & Jacobson, 2019) library, discrete approximations of Gaussian and Mean curvature are computed. Surface curvature quantifies local bending: Gaussian curvature is the product of principal curvatures, while Mean curvature is their average (Reference Magid, Soldea and RivlinMagid et al., 2007). At geometry boundaries, curvature values are typically high, which can be exploited to detect holes. Mean curvature also increases where principal curvature changes significantly, such as at bends or protrusions. (Figure 5) illustrates curvature-based feature extraction on an actual sheet metal part from an automotive Body-in-White (BIW). During development, hole positions and bend sizes often vary; curvature analysis on a triangulated mid-surface enables accurate hole detection and bend characterization.
Gaussian (left) and Mean (right) curvature on an actual BIW structural part. Gaussian curvature values can highlight holes whereas Mean curvature values could signal bends, protrusions

As curvature values are fundamental geometric descriptors, scalar contour maps can be generated using advanced techniques such as Heat Kernel Signature (HKS). With sufficiently high mesh quality, these methods can capture shape characteristics and support comparison of different geometry versions, provided correspondence between surfaces is established. ShapeDNA (Reference Reuter, Wolter and PeineckeReuter et al., 2006) is a well-known method for computing shape differences. However, curvature values are sensitive to mesh quality, and achieving correspondence between complex automotive geometries remains challenging.
5.2. Experimentation in parametric domain of CAD geometry
Building on the shared concept of parametric representation in both CAD and FE models, this experiment evaluates the feasibility of extracting geometric features directly from the CAD parametric space. Reference Jayaraman, Sanghi, Lambourne, Willis, Davies, Shayani and MorrisJayaraman et al. (2021) propose discretizing the underlying U, V (where U and V are the two intrinsic surface coordinates) domain into structured 1D and 2D grids for curves and surfaces, respectively. Following this methodology, the present study examines a selected face from an actual BIW sheetmetal component across two design versions.
For each version, the chosen face is discretized into a uniform 20×20 sampling pattern in the U and V directions, yielding 400 grid points. Edges forming the boundary of the face are discretized along a 1D U grid with 10 equally spaced samples per edge. This approach captures both interior and boundary characteristics in a consistent, parametric manner. As illustrated in (Figure 6), computing the U, V grids for the two design versions reveals substantial geometric differences. The introduction of a protrusion in Design Version 2 increases the total number of valid interior points (i.e., points passing the masking operation) and adds new connecting edges to the face boundary. Because each sampled point stores its coordinate and normal vector, the discretized grid implicitly encodes the face’s shape. Similarly, sampling along the connected edges records detailed boundary geometry, enabling a faithful representation of topological and local curvature effects. The details of changes observed in number of sampling points inside the face and change in number of connected edges due to addition of geometrical feature is given in following (Table 4).
Comparison of U,V discretization of face & edge for selected face in two design versions

5.3. Discussion & learnings
Curvaturebased geometric comparison methods offer valuable insights but require a consistent point-to-point mapping between geometries, which is challenging when CAD models differ in discretization. Representing the geometry in the underlying CAD parametric space provides a robust alternative: uniform sampling in the U, V domain captures face and edge characteristics independently of the mesh. In UVbased representations, sampled points and optional additional features are stored either at face nodes or along edges within the face adjacency graph structure proposed by Reference Jayaraman, Sanghi, Lambourne, Willis, Davies, Shayani and Morris Jayaraman et al. (2021) . This graph encodes both geometric and topological information such as face types, edge connectivity, and wireloop relationships, which together preserve the structural identity of the CAD model.
UVdomain discretization of an automotive CAD face with and without protrusion: 20×20 surface grid (blue), 10point edge grid (red), masked outsideface points in Design Version 2 (light grey), and edgetangent vectors (red). The discretized face is highlighted in light orange

A key advantage of the UV-graph representation is its compatibility with graph neural network architectures that accept variable numbers of nodes and edges. UV-Net (Reference Jayaraman, Sanghi, Lambourne, Willis, Davies, Shayani and MorrisJayaraman et al. (2021)) is particularly well-suited for this purpose: its encoder can process heterogeneous CAD entities directly, extracting latent features from UV-sampled faces and edges without requiring a homogenized mesh. Consequently, the architecture naturally adapts to geometry changes, which manifest as local or global modifications in the graph structure. Despite these advantages, applying UV-graphs to large and complex automotive components introduces scalability challenges. Highly featured sheet-metal parts may contain hundreds of small faces, resulting in dense, memory-heavy graphs. Future work should therefore consider graph simplification strategies such as manually or (automatically) grouping non-critical faces into higher-level shells to achieve more computationally manageable representations without losing engineering relevance. Integration with automatic feature detection schemes for sheet metal parts, as discussed by Reference Ghaffarishahri and RivestGhaffarishahri & Rivest (2020) can be leveraged in this case. Furthermore, node features can be enriched by incorporating curvature descriptors, local thickness information, or other mechanical performance indicators at the sample-point level. Such enhancements align with the limitations and future recommendations highlighted by Reference Jayaraman, Sanghi, Lambourne, Willis, Davies, Shayani and MorrisJayaraman et al. (2021) and may improve downstream predictive performance.
Overall, the UVparametric representation provides a consistent, topologypreserving framework for processing CAD geometries in learningbased pipelines. When combined with UVNet, UVgraphs form a suitable data structure for multiple downstream tasks:
-
• Classification - for organizing or tagging geometries based on localized or global design changes.
-
• Regression - for directly predicting engineering metrics such as FEbased impact measures.
-
• Segmentation - for identifying and labeling relevant faces or edges of the geometry.
This multipurpose capability positions UVgraphs and UVNet as promising tools for geometryaware machinelearning workflows in automotive structural design.
6. Conclusion
This study addresses the challenge of learning the relationship between CAD geometry changes and their impact on FE simulation results. Analysis of automotive crash scenarios reveals that relying on a single FE metric is insufficient to capture the true effect of geometric modifications. Instead, an aggregated impact characterization combining multiple physically relevant simulation parameters is essential for accurate representation. Such composite metrics provide a robust foundation for machine learning models, enabling AI-driven decision support during re-simulation.
Building on our experiments for capturing local geometric changes, the present work positions the proposed geometry impact prediction pipeline as a conceptual framework rather than a fully validated learning system. The paper focuses specifically on Part A of the pipeline, establishing how CAD geometry can be represented and encoded in a form suitable for downstream prediction tasks. The discussion of the shared CAD and FE parametric space serves a conceptual basis for this choice and motivates the exploration of UV-based graph representations as a structurally consistent and flexible encoding strategy. By clarifying the geometric foundations and demonstrating the suitability of UV-domain discretization for capturing local shape variations, this study sets the groundwork for future implementation and validation of the complete learning pipeline.









 Open access

