
2.1 Introduction
As we define in Chapter 3, humans hunt wildlife to procure meat for their own consumption or to sell, to enjoy recreation, to remove animals that are dangerous to humans or domestic animals, or to eliminate pests that destroy crops or kill livestock. Though we describe the different modalities of hunting in Chapter 3 in this book, we do not explicitly deal with sports, recreational or trophy hunting (Baker Reference Baker1997; Lindsey et al. Reference Lindsey, Roulet and Romanach2007; Naidoo et al. Reference Naidoo, Weaver, Diggle, Matongo, Stuart-Hill and Thouless2016). We focus on the hunting of animals for food. This is a practice that occurs throughout the globe, within different ecosystems, and by different groups of peoples. The meat of hunted wild animals provides nourishment for many millions of people (see Chapter 1).
Any treatise on wild meat hunting by humans could embrace a multitude of settings, from the Arctic, through temperate climates to tropical forests, and many cultures. Here, we concentrate on documenting and discussing the hunting of animals for food in the tropical and subtropical regions of the world. These regions occupy 40% of the Earth’s surface area and contain 36% of the Earth’s landmass. They are the most important areas in the globe in terms of biodiversity (Brown Reference Brown2014) and are inhabited by the largest proportion of humans who still depend on wildlife as a source of food. This dependence on wild meat has been recently highlighted in the debate fostered by the COVID-19 pandemic in which some discussants suggest the permanent banning of wildlife consumption so as to prevent further public health threats (see Yang et al. Reference Yang, Liu, Li and Zhang2020). As argued by Medeiros Jacob et al. (Reference Medeiros Jacob, Feitosa and Albuquerque2020) and others (SWM Sustainable Wildlife Management Programme 2020), prohibiting hunting of wildlife for food in developing countries that rely on wild meat to subsist, will compromise the status of food and nutrition security of many people (Booth et al. Reference Booth, Clark and Milner-Gulland2021; FAO Reference Adu, Asafu-Adjaye and Hagan2019).
To clearly define the environmental conditions in which our analyses of wild hunting are based we first define the climatic envelope which determines the tropics and subtropics. We then highlight the main biomes found in these areas, namely tropical and subtropical forests and open grasslands, and proceed to present an overview of the availability of huntable animals found in these habitats. Because mammals are the most important hunted group, most of our analyses refer to these. We also focus our descriptions of wildlife communities and hunting primarily on African and South American habitats since 94% of all publications (over 500 since the 1980s, see Chapter 1) focused on these two continents; only 6% were on Asia. We proceed by summarizing the anthropogenic pressures acting on biodiversity worldwide. We describe the available data on wild meat use in the tropics and subtropics compared to other parts of the world, and underline how pressures from growing populations in these areas can jeopardize the future of wildlife and impact the food security for many millions of humans. We end the chapter by introducing the consequences of overhunting on wild animals, which cause defaunation. The latter topic will be dealt in more detail in Chapter 6 and will examine the impact of the loss of wild animals on the functioning of ecosystems.
2.2 Defining Tropics and Subtropics
Understanding the extension of the global regions in which we concentrate our attention in this book allows us to appreciate better the variety of environments in which animal prey populations thrive and how this in turn determines the hunting methods and approaches developed by humans to access wild meat. As shown in Chapter 1, the reliance of humans on wild meat, in comparison to plant foods, varies latitudinally across the globe: it is in the tropical and subtropical regions that the greatest wild meat extraction is realized. Defining what we mean by the tropics is relatively straightforward. These are the regions of the planet close to the Equator whose main climatic characteristics are determined by the overhead sun. Numerous authors, primarily German scientists, have defined the tropics (e.g. Köppen, von Wissman, Troll & Paffen, Lauer & Frankenberg, Flohn, and Huang, all in Domroes Reference Domroes2003; Holdridge Reference Holdridge1978; Trewartha Reference Trewartha1968), using climatic features, chosen for their correlation with the distribution of important crops or major vegetation types. Bioclimatic definitions, such as multiple possible values of absolute minimum temperature, mean temperature of the coldest month, heat sum, mean annual temperature or a greater diurnal than annual temperature range, have been widely accepted. However, using the biologically arbitrary ‘solar’ definition removes the problem that emerges from temperature-based definitions (Domroes Reference Domroes2003).
Even though the subtropics are universally recognized as the zones immediately north and south of the tropic zone, precisely defining the subtropics is more difficult (Corlett Reference Corlett2013b). The term subtropics can be used to describe the regions outside, but bordering, the tropics though the main disagreement is with the poleward limits. Some authors, physical geographers in particular, have set broad limits, extending to 35° or 40°, or have defined the limits climatically (e.g. Marsh & Kaufman Reference Marsh and Kaufman2012; Petersen et al. Reference Petersen, Trapaso and Gabler2010). According to the Köppen or Köppen-Geiger climate classification (Peel et al. Reference Peel, Finlayson and McMahon2007), subtropical climates extend to 45°N in some places, but this scheme has been recently modified by removing the colder half of this broad belt. The northern limit of the subtropics has also been set by Griffiths (Reference Griffiths1976) using a coldest month mean of 6°C, rather than Köppen-Geiger’s 3°C. By contrast, Trewartha (Reference Trewartha1968) used eight months above 10°C.
Köppen’ s definition of the subtropics does not include arid climates, whereas Griffiths used the same temperature scale as the other climates. Holdridge (Reference Holdridge1978) employed equal logarithmic divisions of the mean annual temperature (the mean with all temperatures <0°C adjusted to 0°C and >30°C adjusted to 30°C) to classify into ‘life zones’, splitting the 12–24°C zone into two (subtropical and warm temperate) at the frost line. As a result, most of the area of ‘subtropical’ life zones lies within the solar tropics.
For our purposes here, we regard the subtropical areas as the regions from about 10°N and S of the tropic zone. Here the sun is never directly overhead, summer days are longer, so weather can be even hotter. Winter is relatively warm, though the nights are long relative to the tropic zone. The subtropics are geographic and climate zones located roughly between the tropics at latitude 23.5° (the Tropic of Cancer and Tropic of Capricorn) and temperate zones (normally referring to latitudes 35–66.5°) north and south of the Equator.
2.3 Main Biomes within the Tropics and Subtropics
The World Wide Fund for Nature Terrestrial Ecoregions map delimits 14 major biomes within which as many as 867 distinct terrestrial ecoregions are found (Olson et al. Reference Olson, Dinerstein and Wikramanayake2001). Biomes range from the wettest of forest types to the driest and hottest desert conditions. Six major biomes out of the 14 are found within the geographical limits of the subtropics and tropics, as we define above. These include: (1) tropical and subtropical moist broadleaf forests (also referred to as evergreen wet and moist forests, and both types denominated as rainforests, see also below), (2) tropical and subtropical dry broadleaf forests, (3) tropical and subtropical coniferous forests, (4) tropical and subtropical grasslands, savannas and shrublands, (5) Mediterranean forests, woodlands and scrub and (6) deserts and xeric shrublands. In this book we focus only on tropical and subtropical forests, savannas and shrublands since wild meat is crucial to many inhabitants of these biomes.
The largest expanses of land within the tropics and subtropics belt are occupied by the two main tropical broadleaf forest formations and by open habitats (Fig. 2.1). Tropical and subtropical moist broadleaf forests are found in large, discontinuous patches along the equatorial belt and between the Tropics of Cancer and Capricorn. These forests are characterized by low variability in annual temperature and high levels of rainfall (>200 cm annually). Forest composition is dominated by semi-evergreen and evergreen deciduous tree species. These trees number in their thousands and contribute to the highest levels of species diversity in any terrestrial major habitat type. Biodiversity is highest in the forest canopy. These forests are home to half of the world’s species. They are found around the world, particularly in the Indo-Malayan Archipelagos, the Amazon Basin, and Central and West Africa.
Distribution of the three main biomes found within the tropics and subtropics belt. (a) tropical and subtropical moist broadleaf forests, (b) tropical and subtropical dry broadleaf forests and (c) tropical and subtropical grasslands, savannas and shrublands.

Tropical and subtropical dry broadleaf forests occur in southern Mexico, southeastern Africa, the Lesser Sundas, central India, Indochina, Madagascar, New Caledonia, eastern Bolivia and central Brazil, the Caribbean, valleys of the northern Andes, and along the coasts of Ecuador and Peru. Though these forests occur in climates that are warm year-round and may receive several hundred centimetres of rain per year, they are subject to long dry seasons which last several months and vary with geographic location. These seasonal droughts impact all animals and plants in this biome. As an adaptation to seasonal droughts, deciduous trees predominate. The most diverse dry forests in the world occur in southern Mexico and in the Bolivian lowlands. Dry forests of the Pacific Coast of northwestern South America are unique due to their isolation and have a high endemism. Similarly, subtropical forests of Maputoland-Pondoland in southeastern Africa are diverse and include many endemics. The dry forests of central India and Indochina are notable for their diverse large vertebrate faunas. Dry forests of Madagascar and New Caledonia are also highly distinctive for a wide range of taxa and at higher taxonomic levels. Dry forests are highly sensitive to excessive burning and deforestation; overgrazing and exotic species can also quickly alter natural communities.
Tropical and subtropical grasslands, savannas and shrublands include large expanses of land in the tropics that do not receive enough rainfall to support extensive tree cover. They are characterized by rainfall levels between 90 and 150 cm per year. However, there may be great variability in soil moisture throughout the year. Grasses dominate the landscape, and large grazing mammals have evolved to take advantage of the ample primary productivity in these habitats. The typical large aggregations of grazers and their associated predators track seasonal rainfall or migrate to new areas during periodic droughts.
2.4 Wildlife Communities in Tropical and Subtropical Habitats
The geographical pattern of increasing biodiversity from the poles to the equator is one of the most pervasive features of life on Earth. That biodiversity is greatest in the tropics has been known for more than three centuries by Western science ever since European explorers and traders returned from Africa, Asia and the Americas with thousands of specimens of previously unknown kinds of animals and plants. Within the last few decades, this latitudinal diversity gradient (LDG), as referred to by biogeographers is better understood, though a number of hypotheses have proliferated to explain the reasons for this (see Brown Reference Brown2014). The LDG occurs in nearly all kinds of organisms – plants, animals and microbes – and environments – terrestrial, freshwater and marine. It is now clear that the tropics also harbour the most diverse genomes, clades of higher taxa (e.g. Lomolino et al. Reference Lomolino, Riddle and Brown2010; Willig et al. Reference Willig, Kaufman and Stevens2003), and even languages and cultures of subsistence human societies (Collard & Foley, Reference Collard and Foley2002a; Gavin & Stepp Reference Gavin and Stepp2014; Pagel & Mace Reference Pagel and Mace2004). The pattern is ancient, apparent in the fossil record dating back hundreds of millions of years (e.g. Crame Reference Crame2001; Crane & Lidgard Reference Crane and Lidgard1989; Stehli et al. Reference Stehli, Douglas and Newell1969).
Any explanation for the LDG essentially revolves around the balance between new species being added via speciation and the loss of species due to extinction or emigration (Gaston Reference Blackburn and Gaston1996, Reference Akçakaya and Sjögren-Gulve2000). Reasons as to why the tropics are highly speciose have generated more than 25 different mechanisms to explain systematic latitudinal variation (Brown et al. Reference Brown, Lomolino and E-mail2000). They include explanations based on chance, historical perturbation, environmental stability, habitat heterogeneity, productivity and interspecific interactions. Many of these mechanisms merely offer different levels of explanation but a number are not mutually exclusive.
One factor known to be important in determining latitudinal gradients in species richness is the relationship between the number of species in an area and ambient available (‘usable’) environmental energy. This energy is usually estimated from models or indirectly from other variables, and often used interchangeably with ‘net primary productivity’. Although much debated, at a relatively local scale (spatial resolution and extent) species richness increases from low to moderate levels of energy and then declines again towards high levels of energy (Evans et al. Reference Evans, Greenwood and Gaston2005). At least across temperate to polar areas, at geographical scales, there is substantial evidence for a broadly positive monotonic relationship between species richness and energy availability (Blackburn & Gaston Reference Blackburn and Gaston1996). For plants, the best correlates are measures of both heat and water (such as actual evapotranspiration and net primary productivity), whereas for terrestrial, and perhaps marine, animals the best correlates are measures of heat (such as mean annual temperature and potential evapotranspiration). The explanation for the broadly positive relationship between species richness and energy availability at geographical scales are believed to be reasonably straightforward (Hawkins et al. Reference Hawkins, Albuquerque and Araújo2007). Greater energy availability is assumed to enable a greater biomass to be supported in an area. In turn, this enables more individual organisms to coexist, and thus more species at abundances that enable them to maintain viable populations. The result is an increase in species richness with energy availability. This assumes a basic equivalence between species in their energetic requirements at different levels of energy availability.
A good measure of the energy stored as biomass by plants or other primary producers and made available to the consumers in the ecosystem is the net primary productivity (NPP) (Tallavaara et al. Reference Tallavaara, Eronen and Luoto2018). This is the gross primary productivity minus the rate of energy loss to metabolism and maintenance (Fig. 2.2a). Reflecting the NPP across the globe is the distribution of biodiversity (Fig. 2.2b) showing the concentration of species along the tropics and subtropics.
Global distribution of (a) net primary production (NPP) and (b) biodiversity (combined plant, mammal and bird richness). NPP was calculated as the climatic NPP using the empirical Miami model (Leith Reference Lieth1973). Overall biodiversity values were generated from the combined mammal, bird, and vascular plant richness. See Tallavaara et al. (Reference Tallavaara, Eronen and Luoto2018) for more details.

2.5 Wildlife Biomass and Primary Productivity
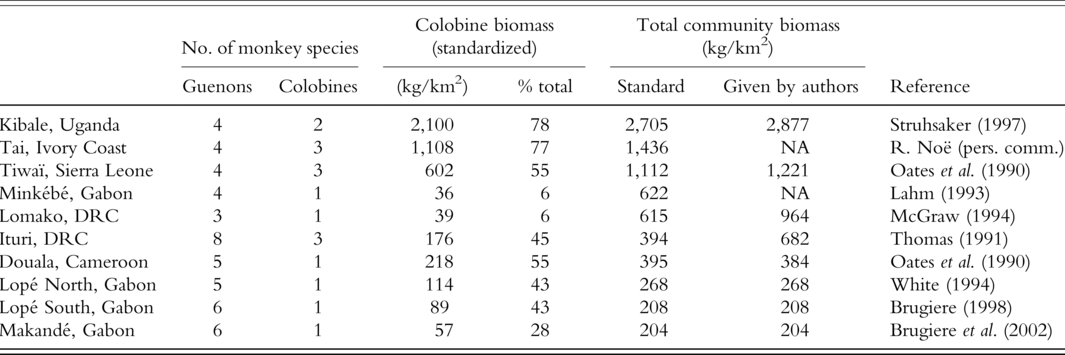
Because species diversity is greatest in the tropics and subtropics, there is a greater variety of animals that are hunted by humans living in these regions compared to other parts of the world (see Redmond et al. Reference Redmond, Aldred, Jedamzik and Westwood2006). Even though a wider range of taxa are consumed in the tropics and subtropics, indeed anything from caterpillars and land snails to the largest land mammal, the elephant, as already mentioned in Chapter 1, mammals of an average adult body mass equal to or greater than 1 kg are the mainstay of most hunts (Robinson & Bennett Reference Robinson and Bennett2004). These groups of species, nonetheless, vary in their standing biomass, that is the total amount of living material in a specified population at a particular time (Table 2.1), related to the energy available in the ecosystems they inhabit. Mammalian standing biomass can be predicted from total rainfall, seasonality of rainfall, latitude, altitude and edaphic conditions.

In all sites hunting is negligible, so mammals are assumed to be at or near carrying capacity (K). Blanks indicate that the biomass of this taxon at the site was negligible; question marks indicate that biomass was not specified.
Plant biomass, and therefore primary productivity, is negatively correlated with rainfall. In areas with rainfall above 4,000 mm, under conditions of low seasonality and at low altitudes, ‘evergreen wet forests’ appear. As rainfall declines to 2,000–4,000 mm, ‘moist forests’ are typical, and ‘dry forests’ are found at 1,000–2,000 mm. Savanna, scrub and even dry woodlands appear between 100 mm and 1,000 mm of rainfall, but little plant biomass can be found under arid conditions of less than 100 mm of rainfall a year. Rainfall, and in consequence primary productivity, affects the standing biomass of mammalian species, and thus availability of the main hunted animals, as shown by Robinson and Bennett (Reference Robinson and Bennett2004). But the three most important taxa for human consumption, that is, large-bodied ungulates, primates and rodents, occur at contrasting comparative and absolute densities in different ecosystems in relation to rainfall. Higher primate biomass is typical of areas with higher rainfall (more forested zones) but ungulate biomass declines with rainfall, where higher biomass is typical of open habitats (in which rainfall is intermediate (Mandujano & Naranjo Reference Mandujano and Naranjo2010; Robinson & Bennett Reference Robinson and Bennett2004); Fig. 2.3). Overall mammalian biomass increases with rising rainfall but drops as forest canopy occupies habitat suitable for herbivorous ungulates. In evergreen wet and moist forests, much of the plant biomass is inedible to most mammals because lignins (tree trunks) are indigestible and toxic plant secondary compounds are found in leaves (McKey et al. Reference McKey, Gartlan, Waterman and Choo1981;Waterman & McKey Reference Waterman and McKey1989; Waterman et al. Reference Waterman, Ross, Bennett and Davies1988). In tropical forests, most primary production is in the canopy and is only consumed by relatively small mammals, such as primates, sloths and rodents; food availability for large ungulates in tropical forests is low (e.g. Glanz Reference Glanz, Leigh, Rand and Windsor1982; Hart Reference Hart, Robinson and Bennett2000). From data available from various sources, mammalian standing biomass varies from 16,404 ± 13,494 kg/km2 in grasslands, 12,665 ± 6989 kg/km2 in deciduous dry forests and grassland savannas through 1,844 ± 918 kg/km2 in moist forests to 909 ± 52 kg/km2 in dry forests (Mandujano & Naranjo Reference Mandujano and Naranjo2010; Robinson & Bennett Reference Robinson and Bennett2004; Fig. 2.4).
Relationship between rainfall (mm) and standing biomass (kg/km2) for: (a) primates; (b) ungulates and (c) rodents. All species are > 1 kg.

Mean total mammalian biomass (kg/km2) according to habitat types. Habitat: WF, evergreen wet and moist forest; DF, deciduous dry forest; GS, grassland savanna.

As previously suggested by Eisenberg (Reference Eisenberg, Soulee and Wilcox1980) and confirmed by Robinson and Bennett (Reference Robinson and Bennett2004) the association between mammalian biomass and rainfall is non-linear. In this relationship, mammalian standing biomass in areas receiving below 100 mm of rainfall is low, but grasslands and tropical dry forests with rainfall above 500 mm can support large mammalian biomasses ranging from 15,000 to 20,000 kg. However, Mandujano and Naranjo’s (Reference Mandujano and Naranjo2010) analysis of variation in ungulate biomass across a rainfall gradient showed that rainfall was a good predictor of ungulate biomass in Neotropical ecosystems compared to palaeotropical ones under similar precipitation regimes but it did not correctly predict observed ungulate biomass at local level if data outside the Neotropics were included in the model. This overappraisal particularly affected predicted ungulate biomass in Neotropical dry forests since these ecosystems sustain different ungulate biomass values even when rainfall is similar. Mandujano and Naranjo’s (Reference Mandujano and Naranjo2010) study suggests that even though overall relationships between rainfall (as a surrogate of productivity) and ungulate (or overall mammalian) biomass can be confirmed using data for different regions of the world, differences in the composition of the mammalian communities at a local level are important to understand. In the Neotropics, ungulate aggregations are of species with similar diet compositions resulting from the loss of large, native grazers during the Pleistocene thus maintaining ungulate richness and standing biomass relatively low. These historical transitions should be accounted for when comparing data sets from different regions (Mandujano & Naranjo Reference Mandujano and Naranjo2010).
2.6 Available Huntable Mammalian Biomass Variation
2.6.1 General
Almost all mammals of the 28 orders (over 5,400 species) have forest representatives (Corlett & Hughes Reference Corlett, Hughes, Corlett and Bergeron2015). Different types of forests are occupied by an assortment of species of varying body sizes, and a large number of them play important ecological roles. Species richness of the large orders is greatest in the tropics (Rolland et al. Reference Rolland, Condamine, Jiguet and Morlon2014), and over 120 mammals have been recorded from the richest tropical rainforest sites (e.g. Corlett & Primack Reference Corlett and Primack2011; Happold Reference Happold1996; Voss & Emmons Reference Voss and Emmons1996). Outside Africa, tropical forests in other continents have lost large mammals since the Middle Pleistocene (Corlett Reference Corlett2013a), and the number of threatened species has accelerated in recent decades (Di Marco et al. Reference Di Marco, Boitani and Mallon2014; Hoffmann et al. Reference Hoffmann, Belant and Chanson2011). Understanding the composition and organization of extant tropical mammalian communities in different regions of the world can provide valuable insights not only on the drivers of species diversity but also on which animals are available to hunters and what methods hunters would need to use (see Chapter 3). In this section, we describe the characteristics of mammal faunas in rainforests in the tropics and their differences across the globe.
Despite not being a highly productive environments in terms of hunted mammal biomass, tropical forests, as demonstrated by Jetz and Fine (Reference Jetz and Fine2012), possess one of the highest numbers of vertebrate species because these biomes are highly productive (they are warm and have high rainfall), cover large areas and have a long evolutionary history. Studies of the differences and similarities in the mammalian faunas found in tropical forests worldwide are instructive to understand huntable biomass and hunter strategies. In a fine-scale study, using standardized camera trap data from the Tropical Ecology, Assessment and Monitoring (TEAM) Network (TEAM Network 2011), Rovero et al. (Reference Rovero, Ahumada and Jansen2020) compared mammal species community composition in 16 tropical rainforests in protected areas in Latin America, Africa and Southeast Asia. Their results indicated a surprising similarity in the composition of trophic guilds of the studied communities as well as body mass distributions. Further analyses showed that the average community mass (i.e., large animals were less common) was negatively related to proximity to human settlements (see Chapter 6 for more on this topic). Rovero et al. (Reference Rovero, Ahumada and Jansen2020) uncovered both a similarity in functional composition and sensitivity to changes among the mammal communities found in each site, despite taxonomic dissimilarities and variation in habitat and in anthropogenic pressures. These findings validate the broader-scale study by Penone et al. (Reference Penone, Weinstein and Graham2016) and an earlier meta-analysis by Fa and Purvis (Reference Fa and Purvis1997) of the similarities between tropical forest mammal communities in different realms.
As Rovero et al. (Reference Rovero, Ahumada and Jansen2020) has pointed out, similar habitat characteristics and anthropogenic pressure induce comparable functional responses in mammal communities in tropical rainforests where they exploit resources in similar ways (Jetz & Fine Reference Jetz and Fine2012; Ricklefs Reference Ricklefs2010). It is therefore not unexpected to find that tropical forest vertebrates with similar ecological roles on different continents possess similar morphological features, an observation made as early as the 1970s by Bourlière (Reference Bourlière, Meggers, Ayensu and Duckworth1973). However, a conspicuous difference between the tropical forest faunas of Asia, Africa and Central and South America is in the number of vertebrates that evolved specialized locomotory adaptations such as gliding membranes or prehensile tails (Emmons & Gentry Reference Emmons and Gentry1983). Most gliding vertebrates are found in the Asian tropics, most with prehensile tails in the Neotropics, and few of either in Africa. Such differences in arboreal vertebrate locomotion modes are likely to have resulted from adaptations to contrasting forest structures in different parts of the world. Emmons and Gentry (Reference Emmons and Gentry1983) explicitly suggested that liana scarcity in tropical Asia aids gliding and high liana densities in tropical Africa correlates with no specialized locomotory adaptations, whereas the presence of many palms, an intermediate number of lianas and even the abundance of more fragile branches in the Neotropics favours prehensile tails.
Although differences and similarities exist among taxonomic groups in how they adapt to living in tropical forests, species numbers are not just determined by the availability of energy in the system but the past climatic changes as drivers of mammalian evolution (see Moreno Bofarull et al. Reference Moreno Bofarull, Royo, Fernández, Ortiz-Jaureguizar and Morales2008). Local environmental factors and anthropogenic pressures also differentiate communities uniquely.
2.6.2 Comparing Continents
More refined censusing techniques, such as the more cost-effective camera trapping (such as in Rovero et al. Reference Rovero, Ahumada and Jansen2020), reveal more precisely, the distribution and abundance of medium to large mammals in tropical forests worldwide. Measuring the standing biomass of medium to large mammals in Neotropical and Palaeotropical forests (but also grasslands) has been of interest to scientists attempting to better understand similarities and differences of faunas living in these habitats. As early as the 1980s, Eisenberg (Reference Eisenberg, Soulee and Wilcox1980) was one of the first to gather and review information on numbers and biomass of mammals in habitats as distinct as the Venezuelan llanos grasslands or Sri Lankan forests (McKay & Eisenberg Reference McKay, Eisenberg, Geist and Walther1974). Analyses of ungulate biomass and species composition in different habitats, such as Eisenberg and Seidensticker’s (Reference Eisenberg and Seidensticker1976) study in southern Asia, taken from census data national parks and wildlife sanctuaries in India, Nepal, Sri Lanka and Indonesia (Java), were significant in advancing our understanding of Asian faunas. Eisenberg and Seidensticker (Reference Eisenberg and Seidensticker1976) observed that information on numbers and biomass of mammals in Asian habitats fell behind African studies. These authors suggested that factors including funding difficulties, research politics and a relatively small number of scientists at the time engaged in long-term research projects were to blame. Although, of course, much more research has been conducted in Asia in recent times, as indeed in other tropical areas, data on mammalian standing biomass in Asian forests is still limited. Part of the reason for this is that research on this topic has been superseded by more elaborate studies employing camera trapping techniques to answers more pressing questions such as the impact of defaunation, for example studies in Malaysian Borneo (Brodie et al. Reference Brodie, Giordano, Zipkin, Bernard, Mohd-Azlan and Ambu2015) and Northeast China (Feng et al. Reference Feng, Sun and Li2021), or human–wildlife conflict affecting high-profile species (e.g. Wang et al. Reference Wang, Feng and Yang2017). These recent studies rely on advances in non-invasive survey methods and statistical modelling techniques to address the status of mammalian communities and guild conservation actions.
Although research on mammalian faunas in tropical forests is currently much more focused, comparisons of existing data on population densities of individual species or groups and estimates of total mammalian biomass data are still valuable. The caveat, of course, is that these tropical areas have without doubt been affected by human actions and the precise numbers will not be the same as when the studies were undertaken. Given that available estimates on mammalian species composition and standing biomass within tropical forests are mostly for African lowland forests, particularly for the Congo Basin, and for forests in the Amazon Basin, in this section we will review these data to comprehend the availability of mammal meat to hunters. Here we present information on non-volant medium and large-sized terrestrial mammals that are hunted for wild meat (see Chapter 1). Bats, which are the most widespread mammals in the world, are not included in our review, since although hunted and consumed, are relatively less important (except one or two species that flock in large numbers) and often not included in forest animal censuses.
There is an overall similarity in the numbers of mammal families, genera and species inhabiting tropical forests in South America, Africa and Southeast Asia (Corlett & Hughes Reference Corlett, Hughes, Corlett and Bergeron2015). Native rodents, a group widely distributed throughout the world like bats, are important as wild meat, particularly the larger species. Ungulates inhabit most forests, but primates only naturally occur in warmer regions: both groups are important providers of wild meat. Elephants, which are still hunted, and their relatives were once widely distributed throughout most climates and regions of the globe until the late Pleistocene when the megafaunal extinctions took place, except in tropical and subtropical forests of Asia and Africa where they are now confined. True insectivores are also widespread in forests in the tropics, except in New Guinea, Australia and Madagascar, and are restricted to the northern Andes in South America. Carnivores and all other orders are geographically more restricted, although many are regionally important.
More than 90% of the non-volant mammalian faunas in the tropical forests of South America (Amazon) and Africa (Congo Basin) are endemic at the species level; 29% and 54% of the families are exclusive to Africa and the Neotropics, respectively (Fa & Peres Reference Fa, Peres, Reynolds, Mace, Redford and Robinson2001). Marsupials, edentates, pangolins, aardvarks, elephants and hyraxes are represented in only one continent. Forest mammalian communities in Africa possess the highest species richness in the world, paralleled only by some communities in Asian forests. By comparison, South American communities, despite their similar latitudinal position have a much lower species richness. These differences have been related not just to current determinants but to biogeographic-historic factors. Overall the difference in mammal composition between the two regions is related to the high diversification of large mammals in Africa, which greatly contributes to the high local community richness in this region. The absence of extant large mammals in the South American region is the result of Pleistocene–Holocene extinctions, which affected large mammals all over the world. Since the late Miocene and through the Pliocene, a decrease in the abundance of large mammal species has been observed in almost all regions except Africa (Nieto et al. Reference Nieto, Hortal, Martínez-Maza, Huber, Sinclair and Lampe2007).
Overall, larger-bodied taxa, even excluding the elephant (>1,000 kg), are characteristically more common in Africa than in the Neotropics (Fa & Purvis Reference Fa and Purvis1997). There is a wider size range of diurnal primates, lorisids, squirrels, carnivores and hornbills in African forests compared with their ecological analogues in the Neotropics, namely capuchin monkeys (primates), didelphid possums, raccoons and toucans (Cristoffer Reference Cristoffer1987). The largest Neotropical forest mammal is the lowland tapir (over 50 kg) whereas 13 frugivorous and browsing mammals can be assigned to this size class in African forests.
In the Neotropics, the more modest cervid radiation contrasts with that of African bovids where more than 20 species occupy equatorial forest environments (Kingdon et al. Reference Kingdon and Hoffmann2013). Indeed, the most species-rich Neotropical forests typically contain only five sympatric ungulates (i.e., two peccary species, two brocket deer species and the South American tapir), whereas as many as 10 ungulate species (Cephalophus spp., Tragelaphus spp., Neotragus spp., Hyemoschus sp., Potamochoerus sp., Hylochoerus sp., Syncerus sp.) can inhabit African forests. A similar phenomenon can be observed among the primates. In South America, prehensile-tailed (ateline) genera (members of subfamily of New World monkeys that includes the various spider and woolly monkeys) rarely exceed 10 kg, whereas several living or extinct Palaeotropical primate genera exceed 100 kg, including Pongo in Southeast Asia, Gorilla in mainland Africa, and Archaeoindris and other giant lemurs in Madagascar (Peres Reference Peres1994). This difference cannot be explained as an artefact of a less complete primate fossil record in the Neotropics (Fleagle et al. Reference Fleagle, Kay, Anthony, Madden, Cifelli and Flynn1997). The largest known New World primate species was a giant ateline from the Plio-Pleistocene boundary equivalent in size to only twice the weight of modern woolly spider monkeys (Hartwig & Cartelle Reference Hartwig and Cartelle1996). In any case, environmental changes since then could have altered selection pressure on body size differentially.
Average body mass of present-day non-volant forest mammals in African rainforests is 37.45 ± 17.19 kg, n = 284 (data from Kingdon Reference Kingdon1997), significantly larger than those in Amazonian rainforests of 4.80 ± 1.44 kg, n = 192 (data from Da Fonseca et al. Reference Da Fonseca, Herrmann, Leite, Mittermeier, Rylands and Patton1996). More large-bodied species are found in Africa compared to the Neotropics; in African forests 60% of species are >1 kg and 22% are > 10 kg, whereas in the Neotropics the equivalent figures are 38% and 7% (Fa & Peres Reference Fa, Peres, Reynolds, Mace, Redford and Robinson2001). Furthermore, whilst the body size of mammalian primary consumers of a forest in northeast Gabon (n = 66 species) are uniformly distributed across five orders of magnitude (Emmons et al. Reference Emmons, Gautier‐Hion and Dubost1983), those of a typical terra firme forest of central Amazonia are markedly skewed towards small- and mid-sized species (Peres Reference Peres, Fleagle, Janson and Reed1999b). These continental patterns are also reflected in the larger size of fruits consumed by vertebrate frugivores occurring in tropical Africa and Asia, i.e., the tropics of the Old World, compared with those in the Neotropics (Mack Reference Mack1993). Various ecological hypotheses have been proposed to account for the narrower size range of Neotropical birds and mammals (Cristoffer Reference Cristoffer1987; Fleming et al. Reference Fleming, Breitwisch and Whitesides1987; Terborgh & Van Schaik Reference Terborgh, Van Schaik, Gee and Giller1987). However, differences between African and South American species assemblages may be related to the impact of humans on forest habitats and their faunas during the Pleistocene–Holocene. The postulated overkill of most South American Pleistocene megafauna by the earliest human colonists did not occur in Africa, where human hunters and large vertebrates evolved side by side (see Section 6.1). Nevertheless, extinctions of large-bodied mammals have occurred in all continents during the Holocene (Turvey & Fritz Reference Turvey and Fritz2011), with such losses impacting ecosystem structure and function (Malhi et al. Reference Malhi, Doughty, Galetti, Smith, Svenning and Terborgh2016).
Although cause and effect may be confounded, forest structure could also have contributed to the contrast in size structure of the mammal fauna between continents. In Africa, forest elephants and other large mammals play a key role in the functioning and structure of rainforests (Malhi et al. Reference Malhi, Doughty, Galetti, Smith, Svenning and Terborgh2016; Prins & Reitsma Reference Prins and Reitsma1989; Western Reference Delaporte, Peeters, Simoni and Piot1989). In the large gaps created by logging or natural disturbance these mammals are attracted to areas with dense stands of herbaceous growth (Chapman & Chapman Reference Chapman and Chapman1997). Gaps in African forests may also be more long-lived, allowing herb and shrub layers to take hold in favour of large terrestrial browsers due to a lack of aggressive colonizing tree species that can take advantage of large gaps, unlike Neotropical ones (Struhsaker et al. Reference Struhsaker, Lwanga and Kasenene1996). Neotropical forests also appear to be generally more ‘fragile’ than those in Africa (Emmons & Gentry Reference Emmons and Gentry1983), since megaherbivores like forest elephants have a long history of structural influence on vegetation (Tutin et al. Reference Tutin, White and Mackanga‐Missandzou1997). Although tapirs can excavate salt-licks and selectively kill understorey saplings (Montenegro Reference Montenegro2004), large forest ‘landscapers’ that can uproot small and medium-sized trees are conspicuously absent in the Neotropics.
Average total crude primary consumer biomass of non-volant mammals in African forest sites (mean ± SD = 2,848 ± 1,129 kg/km2, n = 9) far exceed that in Neotropical sites (1,109 ± 245 kg/km2, n = 5) (Fa & Peres Reference Fa, Peres, Reynolds, Mace, Redford and Robinson2001). Biomass figures taken from these areas may not necessarily be representative of forests in the whole region, since there are considerable differences in soil type, elevation and climate. For example, total biomass among different sites within the Lopé Reserve (White Reference White1994) and the Virungas (Plumptre Reference Plumptre1991) in Africa, varied between 1,000 and 6,000 kg/km2. This enormous range in productivity was attributed largely to differences in densities of ungulates and elephants (Barnes Reference Barnes1993). However, in some areas duikers can attain a biomass higher than that of elephants (Dubost Reference Dubost1978, Reference Ayres and Ayres1979), where human disturbance is minimal (e.g. Yao et al. Reference Yao, Bitty and Kassé2017). Primates have been observed to dominate the mammalian biomass in several other sites (Oates et al. Reference Oates, Whitesides and Davies1990), probably typical of tropical rainforest communities, where folivorous primates are most abundant (colobines, Colobus and Procolobus spp., in mainland Africa and howler monkeys in South America). Primates are the most significant arboreal consumers in rainforests in Africa (Emmons et al. Reference Emmons, Gautier‐Hion and Dubost1983; Oates et al. Reference Oates, Whitesides and Davies1990) and South America (Peres Reference Peres, Fleagle, Janson and Reed1999b). Although significant variations at intra- and the intercontinental levels do occur primate biomass is highest in sites with low levels of hunting and logging. In Central African forests primate biomass can vary from approx. 700 kg/km2 (Thomas Reference Thomas1991) in the Ituri Forest, DRC, to ca. 3,000 kg/km2 in the Kibale Forest, Uganda, just 250 km to the East of Ituri (Struhsaker Reference Struhsaker1975, Reference Alvard, Robinson and Kaplan1997). Similar differences exist in Southeast Asia (Gupta & Chivers Reference Gupta, Chivers, Fleagle, Janson and Read1999) and South America (Peres Reference Peres1997, Reference Alvard1999b).
Factors that determine the density of primate populations are difficult to identify because primate communities in rainforests include species with diversified niches (Fleagle & Reed Reference Fleagle and Reed1996). Primate biomasses are the result of complex interactions among the composition, seasonal behaviour and structural heterogeneity of vegetation and soil conditions, intercommunity competition, disease and parasitic pressures, and historical events (Chapman et al. Reference Chapman and Chapman1999; Oates et al. Reference Oates, Whitesides and Davies1990). Although a broad link can be established between ecological variables (e.g. food supply) and primate abundance, the picture is complicated by the influence of human disturbance (logging and hunting), and historical and biogeographical factors (Oates Reference Oates1995). The considerable variation in primate density and biomass across a wide range of non-hunted and lightly hunted forest sites in Africa (n = 7; Chapman et al. Reference Chapman and Chapman1999), and South America (n = 29; Peres Reference Peres, Fleagle, Janson and Reed1999b) is therefore not surprising. However, overall primate community biomass in Africa is on average significantly larger than that in the Neotropics: African forests sustain a mean primate density of 194.8 (± 210.5) individuals/km2 (range 53–657 individuals/km2), and a mean biomass of 857.8 ± 839.2 kg/km2 (range 318– 2,710 kg/km2), whereas South American sites exhibit much lower densities (123.6 ± 78.1 individuals/km2, range 24–355 individuals/km2) and biomass of 277.0 ± 177.7 kg/km2 (range 70–953 kg/km2). In general, most African forest sites are dominated by folivorous colobines, thus inflating figures of the number of animals present and their biomass. In Africa and Asia, colobines account for an average of 60% (range 28–91%, n = 10) of the primate community biomass (Bourlière Reference Bourlière1985; Oates et al. Reference Oates, Whitesides and Davies1990). In Neotropical forests, the equivalent arboreal folivores often represent over half of the biomass of non-volant mammals (Eisenberg & Thorington Reference Eisenberg and Thorington1973; Peres Reference Peres1997).
Many case studies suggest that the quality, quantity and seasonal availability of food are the most important proximate factors that limit primate populations (Chapman & Chapman Reference Chapman and Chapman1999; Gupta & Chivers Reference Gupta, Chivers, Fleagle, Janson and Read1999; Mendes Pontes Reference Mendes Pontes1999; Milton Reference Milton, Leigh, Rand and Windsor1982; Peres Reference Peres1994, Reference Alvard, Robinson and Kaplan1997). Because of the alternation of dry and wet seasons in rainforests, the availability of plant reproductive and vegetative parts is irregular and induces periods of abundance and scarcity of food for consumers (Gautier-Hion et al. Reference Gautier-Hion, Emmons and Dubost1980; van Schaik et al. Reference Van Schaik, Terborgh and Wright1993). In addition, long-term studies underscore interannual variability in production of plant foods (Gautier-Hion et al. Reference Gautier-Hion, Duplantier and Quris1985; Struhsaker Reference Struhsaker1997; Tutin & Fernandez Reference Tutin and Fernandez1993). However, in Africa, Chapman et al. (Reference Chapman and Chapman1999) indicated that forest type correlates better with primate biomass than does forest productivity (as gauged from rainfall); biomass in the wettest locality (Douala-Edea, Cameroon) with 4,000 mm of rainfall is six times lower than that of Kibale (1,662 mm). Differences in primate biomass in these two localities are marked by contrast in the abundance of colobines. Folivorous primates are likely to be regulated by the lowest level of food availability rather than by the overall level of productivity (see e.g. Tutin et al. Reference Tutin, White and Mackanga‐Missandzou1997). Moreover, colobine populations have been shown to be limited by leaf quality, especially during periods of food scarcity (Davies Reference Davies, Conner and Oates1994; Ganzhorn Reference Ganzhorn1992). In forests dominated by leguminous trees of the Caesalpiniaceae (which do not produce succulent fruitsbut often containing secondary vegetation of trees with fleshy fruits, as in Makandé, Gabon, primate community biomass has been shown to be one of the lowest in Central Africa (Table 2.2).
Peres (Reference Peres, Robinson and Bennett1999a) has shown that forest type, hydrology and geochemistry were key determinants of primate biomass in Amazonia. Thus, forests on nutrient-rich soils, and perhaps with a higher fruit production, sustain a greater primate biomass, even when differences in hunting pressure are considered (Peres Reference Peres, Fleagle, Janson and Reed1999b). Total annual food abundance but particularly seasonal availability has been shown to determine the biomass and species richness of frugivorous primates on three continents (Hanya et al. Reference Hanya, Stevenson and van Noordwijk2011). Using data from fruit fall from South American, African and Asian sites, best-fit models for predicting primate biomass included total annual fruit fall (positive), seasonality (negative) and biogeography (Old World>New World and mainland>island), explaining 56–67% of the variation (Fig. 2.5). For the number of species, the best-fit models include seasonality (negative) and biogeography (Old World>New World and mainland>island) but not total annual fruit fall. Annual temperature has additional effects on primate biomass when the effects of fruits and biogeography are controlled, but there is no such effect on species richness.
Effect of (a) annual fruit fall and (b) seasonality of fruit fall (assessed by the coefficient of variation of the 12 consecutive/average of 12 months’ data) on the number of frugivorous primate species. Closed symbols indicate New World, and open symbols indicate Old World.

Studies in Africa, however, have suggested that soil chemistry is less important than growth stage, heterogeneity, taxonomic composition and history of the vegetation in determining the abundance of colobines (Oates et al. Reference Oates, Whitesides and Davies1990). In fact, Maisels et al. (Reference Maisels, Gautier-Hion, Sprent and McKey1994) and Maisels and Gautier-Hion (Reference Maisels, Gautier-Hion, Sprent and McKey1994) showed that the primate biomass can still be high in forests on nutrient-poor white-sand soils, where legume seeds and young leaves become prominent in their diets. The foraging plasticity of African monkeys may also explain why no clear relationship between frugivore primate biomass (guenons and mangabeys) and fruit availability has been found (Tutin et al. Reference Tutin, White and Mackanga‐Missandzou1997); frugivorous primates will increase their seed and leaf intake in forests where fleshy fruits are less diverse or absent (Brugiere et al. Reference Brugiere, Gautier, Moungazi and Gautier-Hion2002; Maisels & Gautier-Hion Reference Maisels, Gautier-Hion, Sprent and McKey1994).
The distribution of mammalian biomass in rainforests, according to whether the species belong to arboreal or terrestrial guilds, differs significantly between continents. African forests are dominated by terrestrial species, whereas this trend is reversed towards arboreal taxa in Neotropical forests (Fig. 2.6).
Relationship between the crude standing biomass of arboreal and terrestrial mammals in Neotropical and African forest sites. BCI, Barro Colorado Island, Panama; Tei, Teiú, Brazil; Tin, Tinigua, Brazil; Uru, Urucú, Brazil; CC, Cocha Cashu, Peru; Gua, Guatopo, Venezuela; Mas, Masaguaral, Venezuela; Acum Acurizal, Brazil; Itu, Ituri, Democratic Republic of Congo; Gab, Makokou, northeast Gabon; O-M., Ogooué-Maritime, Gabon; Vir, Virungas, Rwanda; L(g), Lopé Reserve, galleries and bosquets; L(m), Lopé Reserve Marantaceae forest, Gabon; L(c), Lopé Reserve, closed canopy forest, Gabon; L(s), Lopé Reserve, Sacoglottis forest, Gabon.

Arboreal species account for more than 20% of the mammalian biomass in the few African forests surveyed to date, whereas this figure is typically 50–90% in the Neotropics. As a point of contrast, the terrestrial community of mammals in seasonally dry forests in the Amazon is more abundant than the arboreal one, with ungulates contributing to the bulk of the biomass, because of the strong seasonality. In Maracá in the Brazilian Amazon (Mendes Pontes Reference Mendes Pontes2004), biomass, due to the contribution of large mammals, was much higher (2,613 kg/km2 in mixed forest, and 4,351 kg/km2 in terra firme forest) than in the less seasonal Amazonian forests mentioned above. This study confirms that the animals surviving in larger numbers in these highly seasonal forests, where food productivity may be very low during the dry season, are those that have larger home ranges and travel longer distances in search of food.
The structure and distribution of plant production in these forests may explain, to some extent, the spread of mammalian consumers. In general terms, continuous close-canopy forests, which are more typical of the Neotropics, will have more of their plant production in the tree canopy (Fittkau & Klinge Reference Fittkau and Klinge1973; Lowman & Schowalter Reference Lowman and Schowalter2012), thus serving primarily the resource base of arboreal vertebrates. On the other hand, the terrestrial mammal biomass is expected to increase as large canopy gaps become increasingly common, allowing greater primary productivity for understorey shrubs and herbaceous layer. This trend is clearly uncovered when South American semi-open forest sites are compared with those under closed canopy (cf. Peres Reference Peres, Fleagle, Janson and Reed1999b). Indeed, these appear to converge with African forests in terms of their terrestrial mammal biomass. Canopy structure at these sites is far more heterogeneous, allowing a greater proportion of total solar radiation to filter through to the understorey and ground layers, favouring the primary production that sustains the large-bodied terrestrial fauna. Although large frugivores and browsers occur at relatively low densities in both Neotropical (Peres Reference Peres, Fleagle, Janson and Reed1999b; Robinson & Redford Reference Robinson and Redford1986) and African forests (Fa & Purvis Reference Fa and Purvis1997), these taxa can adjust to a relatively low quality diet, and hence harvest a greater fraction of the forest primary production. As we shall see, African forests should be able to sustain a relatively higher harvest rate per unit area, particularly at the higher end of the prey size spectrum, because they can support a far greater number of large-bodied herbivores.
2.7 Pressures Affecting Wild Species
Estimates of the percentage of Earth’s surface that is directly influenced by activities of modern humans, in particular agriculture, grazing, forestry and logging, mining, infrastructure expansion and urban development, vary but are all alarmingly high (Box 2.1). By now, we have directly modified and transformed more than half of the Earth’s land surface through agriculture and forestry, jointly modifying 47% of the land (Hooke & Martín-Duque Reference Hooke and Martín-Duque2012). Only less than quarter of terrestrial, ice-free lands shows no evidence of alteration and can thus still be considered ‘wildlands’ (Ellis & Ramankutty Reference Ellis and Ramankutty2008). Daily (Reference Daily1995) estimates that approx. 43% of the surface experienced degradation by the mid 1990s and Bai et al. (Reference Bai, Dent, Olsson and Schaepman2008) contend that approximately a quarter of the global land area has already been degraded.
The framework of planetary boundaries includes the Biodiversity Intactness Index (BII) that estimates changes in community structure at a biome or ecosystem level from pre-industrial times until now (Steffen et al. Reference Steffen, Richardson and Rockstrom2015b). Pre-industrial levels result in a BII of 100%, values below 100% reflect reduced abundance of a taxonomically and ecologically broad set of species in an area and values above 100% reflect increases in the abundance of those species due to anthropogenic modifications to ecosystems. Because the relationship between BII and earth system responses remains poorly understood a preliminary boundary at 90% with a very large uncertainty range (90–30%) has been proposed (Steffen et al. Reference Steffen, Richardson and Rockstrom2015b). The global BII indicates that 75% of all loss occurred from the nineteenth century onwards and the value for 2015 is 78.5%, thus below the ‘safe operating space’ in the planetary boundaries (Hill et al. Reference Hill, Gonzalez and Sanchez-Ortiz2018). There is large regional variation but the BII is below 90% in all regions except Central Africa. The average for tropical forest biomes was 57.3% in 2001 and this fell to 54.9% by 2012 (Palma et al. Reference Palma, Hoskins and Gonzalez2021).
The most authoritative assessment of extinctions and extinction risks comes from the Red List prepared and regularly updated by the International Union for Conservation of Nature (IUCN) (IUCN Reference Barychka, Mace and Purves2020a). On average, about a quarter of assessed animal and plant species are threatened with extinction unless action is taken to stem their decline. Across the assessed groups of amphibians (40% threatened), birds (14%), conifers (34%), mammals (25%), reef corals (33%) and selected crustaceans (27%), more than 28,000 species are susceptible. No global estimates of past extinctions and current extinction risks exist for the most diverse, species rich and biologically important group – the insects. The most detailed data comes from selected insect orders from the Red List for Europe where 9.2% of bee species, 8.6% of butterflies and 17.9% of saproxylic beetles are threatened with extinction (Nieto & Alexander Reference Nieto and Alexander2010; Nieto et al. Reference Nieto, Roberts and Kemp2014; Swaay et al. Reference Van Swaay, Cuttelod and Collins2010). In terrestrial vertebrates, 322 species are listed by the IUCN as having become extinct with another 279 species either ‘extinct in the wild’ or listed as ‘possibly extinct’ since 1500 (Ceballos et al. Reference Ceballos, Ehrlich, Barnosky, Garcia, Pringle and Palmer2015). During the same time period, approx. 1.4% of species of birds and mammals, the two best known groups, have become extinct, most of them since the beginning of the twentieth century. At least 3.1% of frogs have disappeared since the 1970s (Alroy Reference Alroy2015). These values are likely underestimates in particular because of time lags in confirming extinction events and taxonomic uncertainties, especially in less well-investigated groups, such as reptiles and amphibians. The number of eukaryotic species remains uncertain and it is conservatively estimated between 7.5 and 10 millions of which approx. 11,000–58,000 species are being lost annually (Dirzo et al. Reference Dirzo, Young, Galetti, Ceballos, Isaac and Collen2014; Mora et al. Reference Cascio, Bosilkovski, Rodriguez-Morales and Pappas2011). The global rate of extinctions exceeds by about 100–1,000 times the background rate of extinctions over past millennia indicating that we are at the start of the sixth mass extinction (Ceballos et al. Reference Ceballos, Ehrlich, Barnosky, Garcia, Pringle and Palmer2015; Pimm et al. Reference Pimm, Jenkins and Abell2014). This estimate is likely an underestimate too because it does not include unknown extinctions, which are likely high for poorer known taxa and even for well-known ones. Moreover, the estimates do not include accrued extinction debt (Kuussaari et al. Reference Kuussaari, Bommarco and Heikkinen2009) nor the negative trajectories of widespread population declines and extirpations even in species that are currently considered of low conservation concern (Ceballos et al. Reference Ceballos, Ehrlich and Dirzo2017; Dirzo et al. Reference Dirzo, Young, Galetti, Ceballos, Isaac and Collen2014).
Over the last century, terrestrial and coastal marine ecosystems have experienced significant reductions of quality and extent, and the losses are continuing. Excluding Antarctica and regions with predominantly rock and ice, only 23% of the world’s terrestrial expanses remain as wilderness areas that remain fairly free from direct human impact (Watson et al. Reference Maxwell, Fuller, Brooks and Watson2016). Most of the remaining wilderness areas occur in remote or inhospitable areas, such as northern North America, Siberia, Sahara and the Australian dry ecosystems. ‘Fairly free’ means that there are no areas in the world free of direct or indirect human impacts, especially since microplastics are now found in the most remote regions of Antarctic ocean and the deep sea, areas which are generally considered to be still pristine (Reed et al. Reference Baker and Manwell2018). A staggering 10% of terrestrial wilderness areas have been lost worldwide over the last two decades, especially in the Amazon Basin with 30% loss and Central Africa with 14% loss (Watson et al. Reference Maxwell, Fuller, Brooks and Watson2016). At the same time, protection has been achieved for only half of the area that has been lost. Examples from wetland and forest areas highlight the extent of losses.
A survey of 189 reports of change in wetland areas from around the world demonstrated that as much as 87% has been lost since the beginning of the eighteenth century (Davidson Reference Davidson2014). Losses accelerated during the twentieth and early twenty-first centuries with 64–71% of wetlands being lost since the beginning of the twentieth century. The extent of such dramatic loss of wetlands has also been confirmed by the Wetland Extent Trend Index (Dixon et al. Reference Dixon, Loh, Davidson, Beltrame, Freeman and Walpole2016), which is another approach to estimate global change in wetland areas. This index is based on time-series reports of 1,100 wetlands from around the world. For the period 1970–2008 wetland declines vary between regions, from about 50% in Europe to about 17% in Oceania with an average decline of approx. 30% (Dixon et al. Reference Dixon, Loh, Davidson, Beltrame, Freeman and Walpole2016).
Between 1990 and 2015, the total forest land area in the world dropped by 1–31% while the area of planted, secondary forest increased from 2% to 7% for the same period (Payn et al. Reference Payn, Carnus and Freer-Smith2015). Indicators relating to land-system change, expressed as the area of forested land as percentage of original forest cover, have reached and partially exceeded the precautionary safe boundary proposed by the framework of planetary boundaries (Steffen et al. Reference Steffen, Richardson and Rockstrom2015b). This framework defines a safe operating space for humanity regarding global biophysical processes. It uses deforestation as a key variable for land-use change because forest cover losses play a crucial role in understanding how anthropogenic land-system change affects biophysical climate regulation exceeding the importance of other biomes. The exact danger point for the reduction of forests that risks dangerous reduction in biotic regulation of global climate remains uncertain and has been estimated between 54% and 75% globally. The current value is 62%, thus indicating that deforestation is in a zone of uncertainty and increased risk of dangerous reduction in biotic regulation of global climate. So far, South America and the western parts of North America remain in the safe zone, northern North America, Northern Asia and Europe are in the zone of uncertainty and increased risk, but Africa and Southeast Asia are beyond the zone of uncertainty and are, therefore, at high risk.
Extinction debt refers to the future extinction of species due to events in the past. These species are impacted by past habitat loss, habitat alterations or invasions of non-autochthonous competitive species and are likely to become extinct in the future even without further deteriorating conditions. It is only the implementation of conservation measures that can remove them from the extinction vortex (Kuussaari et al. Reference Kuussaari, Bommarco and Heikkinen2009). Estimates of current extinction debts range from 9% to 90% of current local species richness (Figueiredo et al. Reference Figueiredo, Krauss, Steffan‐Dewenter and Sarmento Cabral2019). For example, deforestation in the Amazon has led to the local extinctions of 1% of species, but a further 80% or more extinctions are predicted from historical habitat loss (Wearn et al. Reference Wearn, Reuman and Ewers2012). Projections of the total period required to settle an extinction debt can extend to 1,000 years (Figueiredo et al. Reference Figueiredo, Krauss, Steffan‐Dewenter and Sarmento Cabral2019).
An analysis of nearly half of the described vertebrate species shows that there has been around 32% average decline in abundance and range size during the twentieth century (Ceballos et al. Reference Ceballos, Ehrlich and Dirzo2017). All of the 177 intensively monitored mammal species have lost 30% or more of their geographic ranges and severe range declines of more than 80% were observed in more than 40% of species (Ceballos et al. Reference Ceballos, Ehrlich and Dirzo2017). Invertebrates are less well known but long-term monitoring data on a sample of 452 invertebrate species around the world indicate an overall 45% drop in abundance over the past 40 years albeit with large variance between insect orders (Dirzo et al. Reference Dirzo, Young, Galetti, Ceballos, Isaac and Collen2014). Indirect estimators of population declines using a variety of indices show similar declines. For example, the Living Planet Index (LPI), points to a 58% decline in vertebrate species between 1970 and 2012 (McRae et al. Reference McRae, Deinet and Freeman2017).
Extrapolating to the future, the Geometric Mean Abundance Index, which is similar to the LPI, indicates that population abundance will decline by a further 18–35% while extinction risk increases for 8–23% of the species (Visconti et al. Reference Visconti, Bakkenes and Baisero2016). This model predicts future scenarios based on the extent of suitable habitat, projected land-cover and land-use and using different assumptions about species responses to climate change under the business-as-usual scenario.
2.8 Global Consumption of Wild Meat and Future Trends
Estimates of country-wide levels of wild meat consumption are scarce. Commonly used global datasets, such as the Food and Agriculture Organization of the United Nations (FAO) food balance sheets, have been applied to regional assessments (see Ziegler Reference Ziegler2010 for Central Africa). These databases, although suffering from some limitations in terms of their accuracy, can still be used to compare annual consumption of wild meat in comparison to domestic meats for a number of countries. Using the Global Expanded Nutrient Supply (GENuS) database (Smith et al. Reference Malhi, Doughty, Galetti, Smith, Svenning and Terborgh2016) amounts of wild meat (referred to as ‘game meat’ in the database) and domestic meats (Table 2.3) indicate that there is significant variation in amounts consumed by country, although the data contained in GENuS may underestimate wild meat consumption as it may not capture some types of wildlife consumed for food such as farmed reptiles, and there may have been reporting biases which vary by country, especially in places where wild meat is an informal sector or hunted illegally. The most significant difference can be seen when tropical and subtropical country data are compared with the other countries. In tropical/subtropical countries consumption of wild meat averaged 2.01 g/person/day compared to 4.88 g/person/day of domestic meats (only those countries are included where wild meat is also consumed). By contrast, in non-tropical/subtropical countries, an average of 22.48 g/person/day of domestic meats was typical, but only 0.79 g/person/day of wild meat/ was consumed. Wild meat consumed in tropical/subtropical countries accounted from 2.8% to 78.2% of all meats consumed, whereas in non-tropical/subtropical countries it was 0.0% to 8.0%. A quarter (25.8%) of consumed meat in tropical/subtropical countries was from wild meat, but only 1.2% in those non-tropical/subtropical countries where any wild meat was eaten. Cote d’Ivoire, Botswana, Republic of Congo, Cameroon, Ghana and Rwanda rely on wild meat for more than 35% of their protein intake. The dependence on wild meat in tropical/subtropical countries is orders of magnitude greater than in other parts of the world. These figures, although tentative, suggest that any increases in consumer populations would put even more pressure on the supplying wildlife.
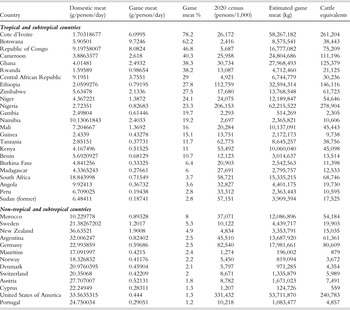
Protein from domestic meat (summed over different types of domestic animals; excluding offal) and game meat worldwide. Protein data from Smith Reference Malhi, Doughty, Galetti, Smith, Svenning and Terborgh2016. Population census data from UN Department of Economic and Social Affairs, 2021. The cattle equivalent of is based on the average carcass weight of 326.8 kg from 436 young bulls of 15 Western European breeds, including specialized beef and dairy breeds and local breeds (Albertí et al. Reference Albertí, Panea and Sañudo2008) minus 30% for weight loss due to bones, trimming, shrinkage and other losses in the distribution system (Putnam & Allshouse Reference Putnam and Allshouse1999).
Countries with game consumption, but less than 1% of domestic meat: Belgium, Bulgaria, China, Czech Republic, Finland, France, Greece, Iran, Ireland, Italy, Kazakhstan, Lithuania, Luxembourg, Malta, Netherlands, Poland, Romania, Russian Federation, Senegal, Slovakia, Slovenia, Spain, Tunisia, United Arab Emirates, United Kingdom, Uruguay.
Countries without game consumption: Albania, Australia, Azerbaijan, Bahamas, Bangladesh, Bosnia and Herzegovina, Cabo Verde, Canada, Ecuador, Estonia, Georgia, Haiti, Hungary, Indonesia, Jordan, Kuwait, Kyrgyzstan, Latvia, Lebanon, Mauritania, Nepal, Republic of Korea, Republic of Moldova, Saudi Arabia, Serbia, Thailand, Yemen.
If the amounts of wild meat eaten in each country are converted – for illustrative purposes – to cattle equivalents (see Table 2.3 for the conversion), then between 2,300 and 260,000 national cattle equivalents would be necessary to replace wild meat with domestic meat. As the cattle equivalent includes only slaughtered cattle, many more would need to be raised to achieve this number. Significant amounts of land would be needed to be converted to agriculture to raise that number of domestic animals. The required land conversion would not only destroy the habitat for the very same species that a conversion to domestic meat would aim to address, but it would increase zoonotic risk through habitat conversion and degradation (Chapter 7). Moreover, the required additional cattle raising would produce a significant carbon footprint and greenhouse gas emissions and would, thus, add to climate change (Nunes et al. Reference Nunes, Peres, Constantino, Fischer and Nielsen2021)
2.9 Overhunting: The Consequences of Increasing Demand
Evidence of increasing demand for wild meat, not just to supply the burgeoning numbers of potential consumers in rural areas but also to source urban markets is mounting throughout the tropics and subtropics. Such rise in hunting pressure, particularly on mammals, which are the most important source of wild meat as mentioned above, will increase the risk of extinction for many hunted species. Comparative studies have shown that extinction risk varies markedly across taxa and that species’ biological characteristics can be an important determinant of this variation (Isaac & Cowlishaw Reference Cowlishaw, Mendelson and Rowcliffe2004). An analysis of threat information gathered for more than 8,000 species in the IUCN Red List by Maxwell et al. (Reference Maxwell, Fuller, Brooks and Watson2016) revealed that by far the biggest drivers of biodiversity decline are overexploitation, agriculture and forestry. Of these 8,000 or so species, 19% (1,680) were directly affected by hunting and close to half (3,986) simultaneously by overexploitation and agricultural activity (Maxwell et al. Reference Maxwell, Fuller, Brooks and Watson2016).
A global assessment of the impact of the hunting of species for wild meat consumption (and in some cases for medicinal products) has been more explicitly undertaken for terrestrial mammals (Ripple et al. Reference Ripple, Abernethy and Betts2016). The overall conclusion of this analysis was that a large number of terrestrial mammals are experiencing a massive collapse in their population sizes and geographical ranges around the world as a result of overhunting. Ripple et al. (Reference Ripple, Abernethy and Betts2016) identified 301 mammal species for which a primary threat is hunting by humans. This group of heavily hunted mammals represents 12 of the 26 extant terrestrial orders, approximately 7% of all assessed terrestrial mammals and approximately 26% of all threatened terrestrial species worldwide. Endangerment categories for these 301 species include 115 vulnerable (VU = 38%), 114 endangered (EN = 38%) and 72 critically endangered (CR = 24%). Orders with the most species threatened by hunting include primates (Primates, 126 species), even-toed ungulates (Cetartiodactyla, 65 species), bats (Chiroptera, 27 species), diprotodont marsupials (Diprotodontia, 26 species), rodents (Rodentia, 21 species) and carnivores (Carnivora, 12 species). Orders with the highest percentages of species threatened by hunting include pangolins (Pholidota, 100%), platypus and echidnas (Monotremata, 60%), odd-toed ungulates (Perissodactyla, 50%), primates (31%) and even-toed ungulates (30%). Mammal species threatened by hunting consist predominantly of ungulates for large-sized mammals (more than 10 kg), primates for medium-sized mammals (1–10 kg) and bats for small-sized mammals (less than 1 kg) (Fig. 2.7).
Defaunation Index (DI) for different trophic groups: (a) carnivores, (b) herbivores, (c) frugivores and (d) insectivores. The dashed grey line indicates the mean DI across the pantropical forest zone. The y-axes have different scales.

Almost all (95%) of the 301 threatened mammal species are affected by humans hunting these species for their meat, most of these species occurring in Africa, South America and particularly Southeast Asia (Ripple et al. Reference Ripple, Abernethy and Betts2016). Other reasons for hunting, such as the consumption of body parts for traditional medicine, for the pet trade or for ornamental use of body parts, were less common. Primates (n = 25) and ungulates (n = 25), but also various other taxa such as carnivores (n = 8) and pangolins (n = 8) were affected by use for medicinal purposes. Live trade mostly includes primates (n = 31), while ornamental uses (ivory, horns, antlers, skins etc.) largely involve ungulate (n = 17), carnivore (n = 7) and primate (n = 6) species.
Studies that have attempted to upscale local data with models based on quantitative relationships between impacts on wildlife populations and the main drivers of hunting pressure have resulted in useful impact maps. Regional impact maps for the entire Congo Basin (Ziegler et al. Reference Sandalj, Treydte and Ziegler2016) and for the Brazilian Amazon (Peres et al. Reference Endo, Peres and Haugaasen2016), described in Chapter 6, are excellent extrapolations of landscape use by hunters. Although similar analyses have not been undertaken for Southeast Asia, a simple model of hunter accessibility by Dieth and Brodie (Reference Deith and Brodie2020) has proved valuable in understanding and predicting threats from hunting for Malaysian Borneo. At a global scale, Benítez-López et al. (Reference Benítez-López, Santini, Schipper, Busana and Huijbregts2019) have modelled hunting-induced mammal defaunation in the tropics to predict large-scale biodiversity loss, particularly in understudied areas. Using data for the main drivers of hunting, the authors developed a modelling framework based on a suite of important socioeconomic drivers of hunting pressure and taking into account the vulnerability of species to hunting. These drivers included hunters’ accessibility to wildlife resources via road development and settlement establishment, hunters’ preferences for certain species and proximity to urban markets (Benítez-López et al. Reference Benítez-López, Alkemade and Verweij2010, Reference Allan, Venter and Watson2017). Additional factors are human population growth and subsequent increases in wild meat demand, socioeconomic status, food security and governmental controls on hunting via law enforcement in protected areas. Subsequently, these models were used to map defaunation gradients across the tropics and to quantify the magnitude and spatial extent of the population declines of 3,923 mammal species. The declines were averaged across species into a Defaunation Index (DI) (Chapter 5). Areas with a DI > 0.1 (more than 10% average reduction in mammal abundance across all species) were considered to be partially defaunated, and areas with DI >0.7 to be severely defaunated. Defaunation hotspots were identified in areas where at least one third of the species had declines >70%. After overlaying the defaunation maps with intact forest (IF) (Potapov et al. Reference Potapov, Hansen and Laestadius2017) and human footprint (HF) (Allan et al. Reference Allan, Venter and Watson2017), the extent to which pristine landscapes could be defaunated are even clearer.
An average abundance decline of 13% across all tropical mammal species was estimated, with medium-sized species being reduced by >27% and large mammals by >40%. Mammal populations were predicted to be partially defaunated in approx. 50% of the pantropical forest area (14 million km2), with severe declines in West Africa. Moreover, 52% of the IFs and 62% of the wilderness areas are partially devoid of large mammals, and hunting may affect mammal populations in 20% of protected areas in the tropics, particularly in West and Central Africa and Southeast Asia. Declines (shown in Fig. 2.8) were more severe for carnivores (DI: 0.24 ± 0.2, median: 0.19) and herbivores (DI: 0.22 ± 0.2, median: 0.17) than for frugivores (DI: 0.09 ± 0.1, median: 0.03) and insectivores (DI: 0.06 ± 0.1, median: 0.02).
Human population sizes predicted by the FAO (2021) for 2020 to 2050.

In a meta-analysis of 82 studies on 254 mammal and 1,640 bird species from across the tropics, Osuri et al. (Reference Osuri, Mendiratta, Naniwadekar, Varma and Naeem2020) assessed the effects of hunting, forest degradation and forest conversion, on measures of abundance for tropical mammal and bird species of different dietary guilds and IUCN conservation status groups. They found that mammal species across dietary guilds either declined or did not change, on average, in response to the three drivers, with hunting having the most consistent negative impacts on carnivores, frugivores, herbivores/granivores, large-bodied species and species of high conservation importance. By contrast, bird species declined most strongly in response to forest conversion, with responses varying widely across different dietary and conservation importance groups and not consistently related to body size. The results of this analysis reveal that hunting, forest degradation and conversion are associated with distinct types of defaunation of mammal and bird species and are therefore likely to have distinct implications for animal-mediated interactions and processes, ecosystem functions and conservation of tropical forests. A follow-up study by Gallego-Zamorano et al. (Reference Gallego‐Zamorano, Benítez‐López, Santini, Hilbers, Huijbregts and Schipper2020), to understand how land use and hunting and their combined impacts affect tropical mammals found that, as expected, land use is the main driver reducing the distribution of the 1,884 studied mammal species. Yet, hunting pressure also causes considerable additional reductions in large-bodied species’ distributions by 29% on average. Hence, large mammals suffered a disproportionate amount of area loss from both pressures combined. Areas of the world that were more affected by land use and hunting (hotspots) were the Gran Chaco, the Atlantic Forest and Thailand. In contrast, the Amazon and Congo Basins, the Guianas and Borneo were identified as coldspots. Any effort to protect tropical mammals must ensure that conservation policies address both pressures simultaneously, as their effects are highly complementary.
Importantly, we can safely assume that demand for wild meat, and thus the risk for over-exploitation will increase over the next decades. Figure 2.8 shows the changes in human populations for Central Africa, Southeastern Asia and South America, stratified according rural and urban populations predicted by the FAO (2021). Increases in rural populations are predicted to be high for Africa, slight for South America and slightly decreasing in Southeastern Asia. This indicates that the highest urgency to develop mechanisms to reduce wild meat in rural settings will be for Africa in order that the problem does not escalate. Policies and management to control and decrease wild meat demand for urban areas must be very different than for that for rural areas because of the different driving factors for wild meat consumption (Chapter 6). Figure 2.8 shows high urgency to address urban wild meat consumption on all continents because of the foreseen increases in human numbers on all of these continents, but especially in Africa.


 Open access