




Introduction
North American forests have experienced widespread landscape change from industrial development (Pickell et al. Reference Pickell, Andison and Coops2013, Reference Pickell, Hermosilla, Coops, Masek, Franks and Huang2014, Reference Pickell, Andison, Coops, Gergel and Marshall2015). These changes affect plant (Carroll et al. Reference Carroll, Grey, Anderson, Anderson and Fisher2025), amphibian (Pollet & Bendell-Young Reference Pollet and Bendell-Young2000, Hannon et al. Reference Hannon, Paszkowski, Boutin, DeGroot, Macdonald and Wheatley2002, Melvin & Trudeau Reference Melvin and Trudeau2012), bird (Knight et al. Reference Knight, Brigham and Bayne2021, Crosby et al. Reference Crosby, Leston, Bayne, Sólymos, Mahon and Toms2023, Kalukapuge et al. Reference Kalukapuge, Leston, Martínez-Lanfranco and Bayne2024) and mammal communities (Fisher et al. Reference Fisher, Grey, Anderson, Sawan, Anderson and Chai2021, Fisher & Ladle Reference Fisher and Ladle2022, Barnas et al. Reference Barnas, Ladle, Burgar, Burton, Boyce and Eliuk2024). Industrial development also impacts Indigenous communities that live, gather and hunt in these landscapes. Although Indigenous territories are recognized through Numbered Treaties and the Canadian Constitution Act, inconsistent implementation of these agreements has often limited Indigenous authority over land and resource management (Starblanket Reference Starblanket2019). This highlights the need for Indigenous-led monitoring and decision-making to ensure resource development better aligns with community priorities. In the traditional territories of Blueberry River First Nation, the cumulative impacts of development were determined to be an infringement of Treaty 8 rights (Stoymenoff Reference Stoymenoff2021, Hamilton & Ettinger Reference Hamilton and Ettinger2023), and other communities were further motivated to investigate the effects of development on their own territories (Fisher et al. Reference Fisher, Grey, Anderson, Sawan, Anderson and Chai2021, Barnas et al. Reference Barnas, Ladle, Burgar, Burton, Boyce and Eliuk2024, Carroll et al. Reference Carroll, Grey, Anderson, Anderson and Fisher2025).
In the boreal plains, the mechanisms driving changes in wildlife communities extend far beyond habitat loss. Linear features (e.g., seismic lines) create cleared areas that allow predators to move faster (Dickie et al. Reference Dickie, Serrouya, McNay and Boutin2017, Reference Dickie, McNay, Sutherland, Cody and Avgar2020), increasing predation rates on prey (McKenzie et al. Reference McKenzie, Merrill, Spiteri and Lewis2012, Boucher et al. Reference Boucher, Anderson, Ladle, Procter, Marshall and Kuzyk2022), and they have facilitated coyote (Canis latrans) expansion (Hody & Kays Reference Hody and Kays2018, Fisher & Ladle Reference Fisher and Ladle2022, Clarke et al. Reference Clarke, Bron, Carlson, Labiy, Penno and Webster2025). Patches of forest removed for timber and industrial activities replace natural, more nutrient-poor forage with rich early-seral forage for herbivores, which is one of the main drivers of white-tailed deer (Odocoileus virginianus) expansion (Darlington et al. Reference Darlington, Ladle, Burton, Volpe and Fisher2022, Fuller et al. Reference Fuller, Frey and Fisher2023, Stevenson et al. Reference Stevenson, Johnson, Finnegan and Rea2025). Although restoration of linear features has been attempted to a limited degree, the outcomes for wildlife have been mixed (Beirne et al. Reference Beirne, Sun, Tattersall, Burgar, Fisher and Burton2021, Dickie et al. Reference Dickie, Sherman, Sutherland, McNay and Cody2022), and boreal forest regrowth is slow, such that these changes are likely to persist for decades.
Indigenous communities experiencing industrial disturbance to their territories face several challenges when trying to make effective conservation decisions. The most fundamental challenge lies in understanding the magnitude of changes to wildlife communities. While substantial research has examined the effects of industrial development on wildlife in Canada, these efforts have historically excluded the people most affected. Shifting Western scientific practices from knowledge extraction to knowledge co-production with Indigenous communities is essential for reconciliation (Wong et al. Reference Wong, Ballegooyen, Ignace, Johnson and Swanson2020), and this should ensure that Indigenous voices – whose priorities may differ from those of industry or government – are heard and empowered in environmental decision-making (Jacob et al. Reference Jacob, Moore, Fox, Sunter, Gauthier, Westwood and Ford2018). Furthermore, much of the existing ecological research stems from the oil-sands in north-east Alberta (Fisher & Burton Reference Fisher and Burton2018, Roberts et al. Reference Roberts, Bayne, Beausoleil, Dennett, Fisher and Hazewinkel2022) and the foothills region on the east slopes of the Rocky Mountains (MacDonald et al. Reference MacDonald, Bartels, Macdonald, Pigeon, MacNearney and Finnegan2020, Finnegan et al. Reference Finnegan, Viejou, MacNearney, Pigeon and Stenhouse2021, McKay & Finnegan Reference McKay and Finnegan2022). However, the landscape and extent of disturbance in the central Alberta foothills, which lies between these regions, differ from those of these other areas, and the effects of disturbance on wildlife cannot be reliably extrapolated from one landscape to another (Barnas et al. Reference Barnas, Ladle, Burgar, Burton, Boyce and Eliuk2024). Seated in the upper and lower foothills of north-central Alberta, the mammal community includes both Rocky Mountain species and boreal species.
Community members of Swan River First Nation (SRFN) have noted declines in mammal populations that they have relied upon for generations. SRFN is a Woodland Cree community (https://srfn.ca/about/) and signatory to Treaty 8. Their social organization and seasonal movements are closely tied to harvesting wildlife and aquatic resources across their traditional territory, including hunting, fishing and trapping practices year-round. SRFN’s vision is to ‘restore balance to the land by following in the footsteps of our ancestors and fulfilling our inherent responsibilities through Wahkohtowin’ – a Cree philosophy representing kinship, interconnectedness and the relationships between people, animals, land and water. Wildlife changes were identified through on-the-land observations by Elders, Knowledge-Keepers (Elders recognized for deep knowledge in a particular area) and other SRFN members and documented through Traditional Land Use (TLU) studies conducted with SRFN Land & Environment Stewardship Office. Concerns regarding changes to the wildlife in their territory were passed to SRFN leadership in town hall meetings, and these concerns compelled them to undertake community-based research in their traditional territory. We co-produced this research under a Reciprocal Knowledge Partnership Approach outlined in Appendix S1.
SRFN community members used remote camera traps (Kays et al. Reference Kays, Kranstauber, Jansen, Carbone, Rowcliffe, Fountain and Tilak2009, O’Connell et al. Reference O’Connell, Nichols and Karanth2011) to provide data on species occurrence (Burton et al. Reference Burton, Neilson, Moreira, Ladle, Steenweg and Fisher2015, Fisher Reference Fisher2025). In this co-produced paper, we used those camera trap data, informed by community knowledge, to weigh evidence for several hypotheses. First, we hypothesized (1) that the density of disturbance patches (e.g., well pads, timber harvest cutblocks) would be associated with increased occurrence of herbivores because these features provide resource subsidies through early-seral forage for herbivores (Routh & Nielsen Reference Routh and Nielsen2021). We also hypothesized (2) that the density of linear features such as seismic lines, which provide travel corridors for predators (Dickie et al. Reference Dickie, Serrouya, McNay and Boutin2017, Reference Dickie, McNay, Sutherland, Cody and Avgar2020), would be associated with increased occurrence of predators and decreased occurrence of herbivores, which may avoid these areas due to predation risk. Given observations by members of SRFN of substantial declines of moose within their territory, we further hypothesized (3) that, for moose specifically, detrimental anthropogenic disturbances would outweigh any positive resource subsidies associated with development.
Materials and methods
Study area, site selection and study design
The 3000-km2 study area is in and around the SRFN’s traditional territory (Wildlife Management Unit 350) in central Alberta and includes Grizzly Ridge Traditional Use Preserve (TUP) in west-central Alberta, Canada (Fig. 1 & Appendix S1: Study area). To understand the cumulative effects of disturbance on wildlife, the SRFN co-authors of this paper held community meetings in which Elders, Knowledge-Keepers and other land users in the community identified preliminary focal areas that hold cultural and traditional significance, and which also varied in landscape disturbance. These areas were mapped (Appendix S1 Fig. S1) and discussed with community members during a Knowledge-Keeper meeting to provide input on the proposed study design. This ensured that site selection reflected both community priorities and ecological considerations. These insights formed the basis for the study design (full details in Appendix S1: Study design). Briefly, we overlaid a grid of 1-km × 1-km cells across spatial data layers in GIS (ArcGIS; Esri, Redlands, CA, USA) and used stratified random sampling, constrained by site access, to select sampling cells. One Reconyx Hyperfire II Professional remote camera (Holmen, WI, USA) was deployed at each camera site.
Map of the study area and camera locations including Swan River First Nation (SRFN) and reserves and SRFN Grizzly Ridge Traditional Use Preserve (TUP).

Generalized linear mixed models of species–landscape relationships
We quantified natural and anthropogenic variables that SFRN team members identified as possibly contributing to changes in wildlife communities. We calculated the proportion of landscape features within 20 concentric circular buffers (250–5000 m in 250-m increments; sensu Fisher et al. Reference Fisher, Anholt and Volpe2011) around each camera site using publicly available spatial data (Alberta Biodiversity Monitoring 2010, 2025) (Appendix S1: Model covariates). We used species detection data to generate a proportional binomial response variable that we termed ‘occurrence frequency’ (e.g., 1,11 = detected 1 of 12 months; 5,7 = detected 5 of 12 months). We considered non-detection to reflect true absence or temporary lack of site use rather than systematic detection error (Appendix S1: Occurrence frequency).
As responses to landscape features can vary with scale (Holland et al. Reference Holland, Bert and Fahrig2004, Reference Holland, Fahrig and Cappuccino2005, Jackson & Fahrig Reference Jackson and Fahrig2015, Dyck et al. Reference Dyck, Arthurs, Barnas, Braun, Marks, Smith and Fisherin press), we employed a multi-scale approach, whereby we first selected the most appropriate buffer size for each species based on model performance and then modelled species occurrence frequency as a function of covariates extracted at that spatial scale. For both steps, we modelled species’ occurrence frequency as a function of one or more covariates using generalized linear models (binomial errors, logit link; Equation 1): ${\eta _i} = {\beta _0} + \;{\beta _1} \times {X_1} + \;{\beta _2} \times {X_2} + \ldots + {\beta _n} \times {X_n}$ $logit\left( {{\theta _i}} \right) = {\rm{\;}}{\eta _i}$ $Monthly\;species\;occurrenc{e_i}\; \sim \;\rm{{Bernoulli}}\left( {{\theta _i}} \right)$
where $\eta$
is the linear predictor,
$\eta$
is the linear predictor, ${\beta _0}$
is the intercept and
${\beta _0}$
is the intercept and ${\beta _n} \times {\rm{\;}}{X_n}$
represents the fixed effects of covariates of interest for the ith observation (i.e., a unique camera site–month combination; Appendix S1: GLMMs). All models were fitted using the package lme4 (Bates et al. Reference Bates, Mächler, Bolker and Walker2015), and all data formatting, analysis and visualization was conducted in R version 4.2.3 (R Core Team 2019).
${\beta _n} \times {\rm{\;}}{X_n}$
represents the fixed effects of covariates of interest for the ith observation (i.e., a unique camera site–month combination; Appendix S1: GLMMs). All models were fitted using the package lme4 (Bates et al. Reference Bates, Mächler, Bolker and Walker2015), and all data formatting, analysis and visualization was conducted in R version 4.2.3 (R Core Team 2019).
To evaluate our hypotheses, we applied a common set of a priori models to all species (Appendix S1 Table S2) at the best-supported buffer size for each species (Appendix S1: Multi-scale approach), including models representing effects of disturbance patches, linear features and relevant land-cover covariates, as well as an intercept-only null model for comparison (Appendix S1 Table S2). Model support was evaluated using the Akaike Information Criterion corrected for small sample sizes (AICc; Burnham & Anderson Reference Burnham and Anderson2002). For interpretation, we report odds ratios derived from model coefficients, where values >1 indicate positive associations with occurrence and values <1 indicate negative associations with occurrence.
Results
A summary of detections, selected spatial scales and species retention based on model fit is provided in Appendix S1 (Wildlife data, Spatial scales).
Predators’ responses to landscape features
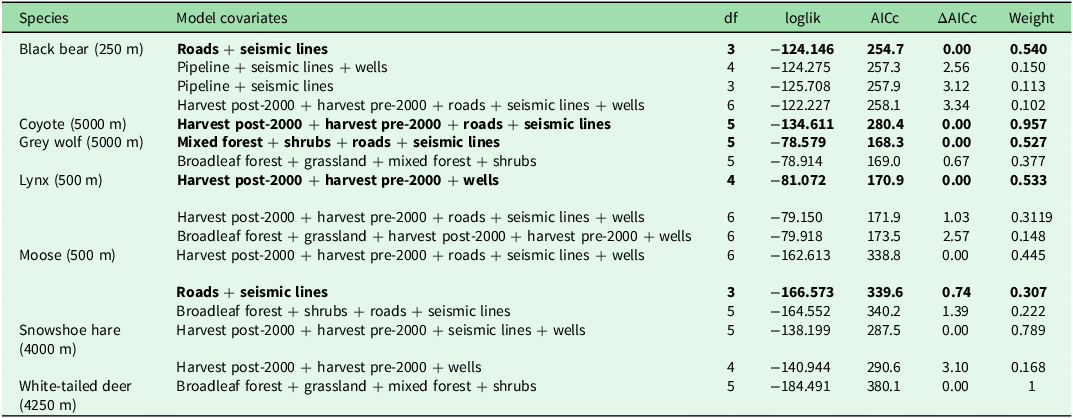
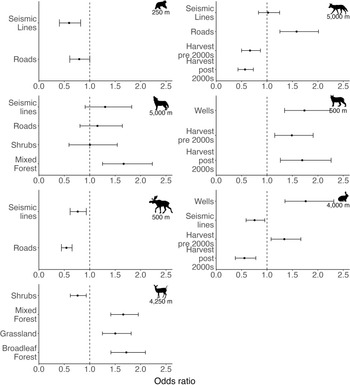
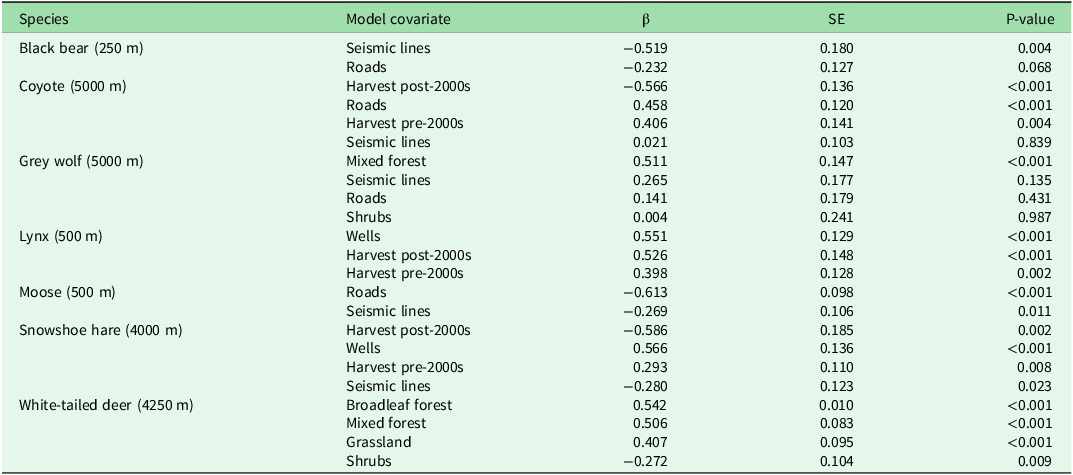
Black bear (Ursus americanus) occurrence frequency was best predicted by the density of linear features within 250 m of cameras (Table 1), specifically seismic lines and roads, which both had negative effects on bear occurrence (Fig. 2 & Appendix S1 Fig. S5), with the effect of seismic lines (β = −0.52, SE = 0.18, p = 0.004) being greater than that of roads (β = −0.23, SE = 0.13, p = 0.068; Table 2).
Model selection table for generalized linear models predicting the relative abundance of seven terrestrial mammals in Swan River First Nation (Alberta, Canada). Species are listed alphabetically, with the best-supported buffer sizes used to extract proportions of each of the covariates in each model given in parentheses. Models are listed in descending order of fit based on Akaike information criterion corrected for small sample size (AICc), with model covariates, degrees of freedom (df), log likelihood (loglik), delta AICc (ΔAICc) and model weights provided. Bold models indicate those models that were chosen as the best-supported models for interpretation and visualization. We present models with ΔAICc ≤ 4; the full candidate model set is provided in Appendix S1 Table S3.

Odds ratio (OR) plots for the best-supported generalized linear models predicting the relative abundance of seven terrestrial mammals in the Swan River First Nation (SRFN) wildlife monitoring study (Alberta, Canada). Covariates in the best-supported model for each species are listed on the y-axis; all covariates represent the proportion of that feature within a selected buffer (250–5000 m), which was determined for each species using a model selection approach. ORs are plotted as points with 95% confidence intervals (CIs). ORs > 1 indicate a positive effect on occurrence frequency, ORs < 1 indicate a negative effect on occurrence frequency and ORs = 1 indicate an uncertain effect on occurrence frequency; a wider CI indicates less certainty regarding the direction/magnitude of the effect, while a narrower CI indicates greater certainty regarding the direction/magnitude of the effect.

Model summaries for the best-supported generalized linear models predicting relative abundance of seven terrestrial mammals in Swan River First Nation (Alberta, Canada). Species are listed alphabetically, with the best-supported buffer size used to extract proportions of each of the covariates given in parentheses. Individual covariates are listed in order of decreasing effect size based on the standardized beta coefficients (β). Also reported are the standard error (SE), and p-value for each covariate in the best-supported model.

Lynx (Lynx canadensis) occurrence frequency was best predicted by patch disturbance features (e.g., timber harvest and wells; Table 1), which had positive effects on lynx occurrence (Fig. 2, Table 2 & Appendix S1 Fig. S6). Wells had the greatest effect (β = 0.55, SE = 0.13, p < 0.0001), followed by harvest post-2000 (β = 0.53, SE = 0.15, p = 0.0004) and harvest pre-2000 (β = 0.40, SE = 0.13, p = 0.002; Table 2). This model was selected over a more complex competitive model with ΔAICc = 1.03 (Table 1).
Coyote occurrence frequency was best predicted by multiple types of anthropogenic disturbance features (Table 1). Timber harvest, both pre- and post-2000, had negative effects on coyote occurrence, with similar effect sizes for each period (harvest pre-2000: β = –0.41, SE = 0.14, p = 0.004; harvest post-2000: β = −0.57, SE = 0.14, p < 0.0001; Table 2), while roads had an equally strong positive effect (β = 0.46, SE = 0.12, p = 0.0001; Table 2). Seismic lines had a negligible effect on coyote occurrence (β = 0.02, SE = 0.10, p = 0.84; Fig. 2, Table 2 & Appendix S1 Fig. S7).
Grey wolf (Canis lupus) occurrence frequency was best predicted by both natural landscape features (shrub and mixed forest) and linear features (seismic lines and roads; Table 1) although all had relatively greater uncertainty than covariates for the other species (Fig. 2 & Table 2). Shrub had a negligible effect (β = 0.004, SE = 0.24, p = 0.987), while seismic lines (β = 0.26, SE = 0.18, p = 0.13) and roads (β = 0.14, SE = 0.18, p = 0.431) had weak positive effects on wolf occurrence frequency (Fig. 2, Table 2 & Appendix S1 Fig. S6). Mixed forest was the only covariate with a clear positive effect on wolf occurrence frequency (β = 0.62, SE = 0.16, p < 0.0001; Fig. 2, Table 2 & Appendix S1 Fig. S8). This model was within ΔAICc = 0.67 of a model including only natural features, but as both had the same number of parameters and most variables in the latter had negligible effects, we focused on the better-fitting model (Table 1).
Herbivores’ responses to landscape features
Moose occurrence frequency was also best predicted by linear features (i.e., seismic lines and roads; Table 1), and both had negative effects on moose occurrence, with the effect of roads (β = −0.61, SE = 0.10, p< 0.0001) being greater than that of seismic lines (β = −0.27, SE = 0.11, p = 0.011; Fig. 2, Table 2 & Appendix S1 Fig. S9). Although this model had the second-lowest AICc, it was selected as the most parsimonious among three competitive models (Table 1).
Snowshoe hare (Lepus americanus) occurrence frequency was best predicted by multiple types of anthropogenic disturbance features, including linear features (e.g., seismic lines and roads) and timber harvest (Table 1). Seismic lines and harvest post-2000 had negative effects on hare occurrence, with the effect of seismic lines (β = −0.28, SE = 0.12, p = 0.023) being smaller than that of harvest post-2000 (β = –0.59, SE = 0.19, p = 0.002; Table 2). Interestingly, harvest pre-2000 had an opposite, positive direction of effect (β = 0.29, SE = 0.11, p = 0.008; Table 2). Wells also had a positive effect on hare occurrence (β = 0.57, SE = 0.14, p < 0.0001), and this was greater than the effect of harvest pre-2000 (Fig. 2, Table 2 & Appendix S1 Fig. S10).
White-tailed deer occurrence frequency was best predicted by a suite of natural features, including broadleaf forest, mixed forest, grassland and shrub (Table 1), which all had positive effects on deer occurrence, except for shrub (β = −0.27, SE = 0.10, p = 0.009; Table 2 & Appendix S1 Fig. S11). Broadleaf forest (β = 0.54, SE = 0.10, p < 0.0001), mixed forest (β = 0.51, SE = 0.08, p < 0.0001) and grassland (β = 0.41, SE = 0.09, p < 0.0001) had similar effect sizes, but decreasing slightly in respective order (Fig. 2 & Table 2).
Discussion
The SRFN community observed declines in wildlife species, including snowshoe hares, moose, wolves, lynx and bears, relative to past conditions, which they attributed to widespread industrial development on their traditional territories. This co-produced research supported these observations, revealing several negative effects of anthropogenic development on key mammal populations.
Moose are an important subsistence species for many Indigenous communities in Canada (Popp et al. Reference Popp, Priadka and Kozmik2019, Priadka et al. Reference Priadka, Moses, Kozmik, Kell and Popp2022, Reference Priadka, Moses, Kozmik, Kell and Popp2024), not only culturally and spiritually, but also for food security and sovereignty (Carroll et al. Reference Carroll, Grey, Anderson, Anderson and Fisher2025). In line with SRFN observations, we observed that moose occurrence frequency declined with increasing road and seismic line density, similarly to conclusions from a study in Whitefish Lake First Nation territory to the north (Fisher et al. Reference Fisher, Grey, Anderson, Sawan, Anderson and Chai2021, Carroll et al. Reference Carroll, Grey, Anderson, Anderson and Fisher2025). Linear features facilitate predator movement and access by out-of-community hunters and increase collision risk, and they are therefore likely to be perceived as risky and so avoided. Conversely, anthropogenic patch features were positively related to moose, as these areas offer increased forage (Routh & Nielsen Reference Routh and Nielsen2021). Although the lowest-AICc model included both feature types, the smaller effect sizes for patch features indicate weaker effects than linear features. We conclude that linear features exert strong negative effects on moose site use, whereas any positive effects of patch features were comparatively minor. These findings align with SRFN community observations and TLU reports that industrial disturbances cumulatively reduce moose occurrence. With linear features identified as a mechanism behind the observed steep moose declines in neighbouring British Columbia (Kuzyk et al. Reference Kuzyk, Hatter, Marshall, Procter, Cadsand and Lirette2018, Boucher et al. Reference Boucher, Anderson, Ladle, Procter, Marshall and Kuzyk2022), the growing intensity of this type of landscape change represents another ecological risk to mammal populations upon which the Indigenous people depend.
SRFN members noted the scarcity of grizzly bears on the landscape – a species of great cultural importance to the community – and our research corroborated these observations (Appendix S1 Figs. S2–S4). Grizzly bears are of conservation concern across western Alberta (Nielsen et al. Reference Nielsen, Stenhouse and Boyce2006, Hughes et al. Reference Hughes, Yarmey, Morehouse and Nielsen2020), where forest harvesting and roads have adversely impacted populations (Berland et al. Reference Berland, Nelson, Stenhouse, Graham and Cranston2008, Proctor et al. Reference Proctor, McLellan, Stenhouse, Mowat, Lamb and Boyce2020, McKay & Finnegan Reference McKay and Finnegan2022). The low number of detections (n = 151) and naïve occupancy (0.16) for grizzly bears suggest potential population limitations in this system (Appendix S1 Figs. S3 & S4).
As seen elsewhere in the boreal forest, black bears responded negatively to the linear features of roads and seismic lines (Fisher & Burton Reference Fisher and Burton2018, Fisher et al. Reference Fisher, Grey, Anderson, Sawan, Anderson and Chai2021). These are often used by people and probably represent a perceived mortality risk, as is common throughout their range (Brody & Pelton Reference Brody and Pelton1989, Kasworm & Manley Reference Kasworm and Manley1990, Zeller et al. Reference Zeller, Wattles, Conlee and Destefano2021). As a generalist and opportunistic predator that relies less on meat than other carnivores (Raine & Kansas Reference Raine and Kansas1990, Popp et al. Reference Popp, Hamr, Larkin and Mallory2018), black bears may be less inclined to use linear features for movement, as the potential for energetic reward does not outweigh the associated risk of human encounter.
We had hypothesized that the effects of anthropogenic development on mammal species observed in boreal and mountain systems might also be seen in this transitional foothill ecosystem. However, species responses varied considerably from those of boreal and montane landscapes, despite similar analytic approaches (Fisher & Wilkinson Reference Fisher and Wilkinson2005). These differences corroborate recent multi-landscape research, wherein mammalian response to anthropogenic change has been context-dependent (Granados et al. Reference Granados, Sun, Fisher, Ladle, Dawe and Beirne2023, Barnas et al. Reference Barnas, Ladle, Burgar, Burton, Boyce and Eliuk2024, Burton et al. Reference Burton, Beirne, Gaynor, Sun, Granados and Allen2024). A few of our predictions were consistent with observations from mountain and boreal landscapes. For example, coyote occurrence frequency increased with roads – a pattern that has been observed repeatedly across the continent (Fisher & Burton Reference Fisher and Burton2018, Hody & Kays Reference Hody and Kays2018, Clarke et al. Reference Clarke, Bron, Carlson, Labiy, Penno and Webster2025). The positive – although weaker – effect of seismic lines is also consistent with mountain (Heim et al. Reference Heim, Fisher, Volpe, Clevenger and Paczkowski2019) and boreal systems (Clarke et al. Reference Clarke, Bron, Carlson, Labiy, Penno and Webster2025), suggesting that linear features provide a consistent mechanism for coyote expansion and persistence. We predicted that early-seral forage would boost small- and mid-sized mammal prey in cutblocks, making these areas attractive to predators, but this was not observed. Timber harvest generally did not explain herbivore occurrence, except for in snowshoe hares, which showed a mixed response depending on block age rather than a clear benefit from early-seral forage. While lynx occurrence increased with cutblock density, this did not track with their primary prey: snowshoe hares. Coyote occurrence was negatively associated with timber harvesting, contrary to predictions from previous research (Fisher & Wilkinson Reference Fisher and Wilkinson2005). One explanation for this is that harvest blocks may attract herbivores and predators at finer scales but may not provide enough sustained high-quality forage to drive detectable changes in monthly occurrence. Alternatively, structural changes following harvest may reduce cover and increase perceived predation risk, limiting prey use of these areas and in turn reducing their attractiveness to predators.
In contrast to coyotes, wolves were only weakly associated with linear features, and variation in occurrence frequency was best explained by natural and not anthropogenic features. Although linear features are positively associated with wolf occurrence elsewhere, this effect diminishes with wolf culls (Dickie et al. Reference Dickie, Serrouya, McNay and Boutin2017, Baillie-David et al. Reference Baillie-David, Volpe, Burton and Fisher2024), and wolf control measures proximal to the study may have dampened this relationship. Furthermore, linear features in open conifer foothill forests may not provide the same travel subsidy benefit as they do in dense difficult-to-travel boreal forests. These results underscore the context-dependent nature of predator responses to anthropogenic disturbance.
The occurrence frequency of the lynx – a snowshoe hare specialist predator (Murray et al. Reference Murray, Boutin and O’Donoghue1994, O’Donoghue et al. Reference O’Donoghue, Boutin, Krebs and Hofer1997, Reference O’Donoghue, Boutin, Krebs, Murray and Hofer1998) – was positively associated with patch features, including wells and timber harvest blocks. This pattern probably reflects prey responses to early-seral vegetation in these features. Lynx and hares both selected wells, consistent with findings from Whitefish Lake First Nation territories to the north, where hares capitalize on early-seral forage in these openings (Fisher et al. Reference Fisher, Grey, Anderson, Sawan, Anderson and Chai2021). In the SRFN territory, hare and lynx occurrence was positively associated with older timber harvest blocks (>25 years; harvest pre-2000), whereas younger harvest blocks (0–25 years; harvest post-2000) were negatively associated with hare occurrence but positively associated with lynx occurrence. This is probably due to the high abundance of small mammal prey, particularly rodents, in these early-seral stages (Fisher & Wilkinson Reference Fisher and Wilkinson2005). Together, these results support the anthropogenically mediated predator–prey spatial relationship observed in other regions, in which human-created clearings influence both prey availability and lynx space use (Fisher et al. Reference Fisher, Grey, Anderson, Sawan, Anderson and Chai2021).
The most striking departure from mammal responses to disturbance elsewhere in the boreal forest was observed for white-tailed deer. In the SRFN territory, the occurrence frequency of white-tailed deer was best explained by natural land-cover features: landscapes composed of greater proportions of broadleaf forest, mixed forest and grassland and lower proportions of shrub cover had higher predicted deer occurrence. In the neighbouring boreal plains, deer strongly select for anthropogenic features that provide early-seral forage, which are otherwise scarce in mature boreal forests (Fisher & Burton Reference Fisher and Burton2020, Darlington et al. Reference Darlington, Ladle, Burton, Volpe and Fisher2022, Fuller et al. Reference Fuller, Frey and Fisher2023). In these central foothills landscapes, browse is naturally more abundant, and it appears that anthropogenic features are not as important for maintaining persistent populations. White-tailed deer are nonetheless expansionist neonatives to Canadian ecosystems, and they have been linked to declines in biodiversity across their range (Côté et al. Reference Côté, Rooney, Tremblay, Dussault and Waller2004, Côté Reference Côté and DG2011). Increases in deer abundance are also attributed to increases in wolf populations (Latham et al. Reference Latham, Latham, McCutchen and Boutin2011) and subsequent declines in caribou through apparent competition (Holt Reference Holt1977, DeCesare et al. Reference DeCesare, Hebblewhite, Robinson and Musiani2010). Thus, the widespread presence of white-tailed deer on the territory (naïve occupancy of 97%) represents an ecological risk.
Study limitations
Our response variable was designed to measure mammal spatial distribution rather than short-term behavioural responses. The primary goal of SRFN members was to identify how specific features influence overall species occurrence across the territory over a long timescale to inform planning and negotiations. If finer temporal responses are of future interest, shorter deployment periods could measure temporary absences induced by behavioural site choice and shorter-term movement dynamics. Furthermore, we sampled over an annual timeframe, but sweeping changes to communities are best documented by long-term monitoring. We recommend that a multi-year sampling programme be continued to better understand changes to wildlife communities and to contextualize what those changes mean for Treaty 8 rights of ‘meaningful access’ to subsistence hunting.
Conclusions
Mammal occurrence generally declined with increasing industrial land use, with some positive relationships arising that signal clustering of species in response to development. Our research corroborates concerns of the SRFN community regarding the sustainability of key species, especially moose. We also demonstrate that mammal responses to anthropogenic disturbance in the boreal foothills differ in important ways from those documented elsewhere in the boreal plains. These differences highlight the risks of assuming that disturbance–response relationships are generalizable across regions, and they reinforce the need for regional-scale ecological research to inform management. Integrating Indigenous knowledge and priorities is essential in this process, as Indigenous communities have place-based expertise, cultural connections and stewardship responsibilities that provide critical insights into long-term ecological change. Co-produced knowledge can support community-led monitoring and stewardship initiatives, as well as provide evidence to guide negotiations with industry and government. Our results highlight the negative impacts of industry on several culturally important species that should be considered in future land-use planning and development activities. By grounding conservation planning and policy in both local empirical ecological evidence and Indigenous-led decision-making, management strategies can better address the specific ecological risks and cultural priorities of the landscapes in question, ensuring that conservation actions are both ecologically effective and socially just.
Supplementary material
To view supplementary material for this article, please visit https://doi.org/10.1017/S0376892926100423.
Data availability
The analysis was conducted in R, and data and code are available on GitHub (https://github.com/marissadyck/Swan_River_First_Nation_camera_project); additionally, a PDF of the analysis is provided (Appendix S2). All relevant data are cited in-text or provided in the GitHub repository with the exception of raw data files with sensitive information and raw images, which are the property of Swan River First Nation (see the CARE Principles for Indigenous Data Governance: https://www.gida-global.org/care). Please contact Swan River First Nation co-authors with further questions regarding access to these datasets.
Acknowledgements
We gratefully acknowledge Kaine Giroux, Kris Willier and Styles Giroux from SRFN for valuable assistance with data collection, and we thank Fabian Grey (Whitefish Lake First Nation) and Emeral Arthurs (University of Victoria) for technical assistance. We acknowledge the contributions of Abbie Stewart, Shannon Gavin, Dr Brian Kopach and Erin Marshall (MSES) for their support in project design and initiation.
Author contributions
Conceptualization and study design were led by TB and JW, with supporting contributions from MAD, KD and JTF. Data collection was led by TB, with equal contribution from JW. Data analysis was led by MAD, with support from ED and KG and supervision from JTF. Manuscript writing was led by MAD, with equal contributions to manuscript editing and revision from TB, ED, KG, JW and JTF. Funding acquisition was carried out by TB, KG, JW and JTF. All authors contributed critically to the manuscript and approve of submission.
Financial support
Funding for this project was provided through the Terrestrial Cumulative Effects Initiative from Environment and Climate Change Canada (ECCC). MAD and JTF were supported in part by the Oil Sands Monitoring Program.
Competing interests
The authors declare none.
AI generative statement
AI was used solely for minor language and formatting edits.



 Open access

