


Introduction
During the coronavirus disease 2019 (COVID-19) pandemic, a drastic decline in acute respiratory infection (ARI) among children, such as seasonal influenza and respiratory syncytial virus (RSV) infection, was observed in many countries [Reference Bardsley1–Reference Li5]. Gastroenteric infections and pneumococcal disease were also reported to decline during the pandemic [Reference Danino6–Reference van de Berg11], whereas sexually transmitted diseases and vector-borne diseases, such as malaria and dengue fever, were reported to increase [Reference Jayaraj12–Reference Prasertbun14]. Additionally, multiple countries reported an increase in various infectious diseases in their surveillance system after the COVID-19 pandemic [Reference Prasertbun14–Reference Li19].
These epidemiological changes were attributed to non-pharmaceutical interventions (NPIs), which reduced direct contact among people and human mobility, thereby suppressing the transmission of diseases [Reference Li5, Reference Danino6]. The degree of changes in disease incidence was largely attributed to the transmission route, and respiratory infections were mostly affected by NPIs [Reference Brett and Rohani20]. At the same time, the relaxation of NPIs led to a resurgence of respiratory infectious diseases, particularly among children [Reference Li5]. Thus, the incidence of child infectious disease declined in the early stage of the pandemic and increased at the later stage [Reference Yang21].
The NPIs apparently create an immunity debt among the young population, as they were not exposed to or infected with common paediatric infectious diseases during their infancy and early childhood [Reference Bardsley1, Reference Brett and Rohani20, Reference Foley22]. Although the Japanese government did not impose nationwide NPIs or school closures for a long time, local governments occasionally alerted their residents to take social distancing measures depending on the local COVID-19 epidemic patterns. The impact of the immunity debt should be evaluated to understand the impact of public health measures for future pandemics [Reference Billard and Bont23].
RSV is a common cause of respiratory infection among children under 2 years old, and transmission typically peaks in winter. Pharyngoconjunctival fever caused by adenovirus is common among children under 5 years old, with the epidemic typically peaking in the summer. Group A Streptococcus (GAS) pharyngitis is common among school-going children, and the epidemic peaks in winter and early summer. Seasonal influenza is likely to be transmitted among school-going children and typically peaks in winter. So far, RSV infections have drawn considerable attention globally [Reference Bardsley1–Reference Trenholme3, Reference Foley22, Reference Billard and Bont23] as well as in Japan [Reference Ujiie24–Reference Hirae, Hoshina and Koga26] due to their significant impact on the healthcare system; however, studies describing changes in disease burden by age group have been scarce. The impact of the pandemic on the epidemiology of adenovirus and GAS infections was assessed [Reference Karapati27–Reference Cohen31]; however, the age distribution of the cases was not often evaluated.
This study aimed to measure the changes in the incidence of four paediatric ARI during and after the COVID-19 pandemic by age, using national surveillance data and electronic health records in 23 primary clinics in Japan. Combining four diseases that affect different age groups, this study aimed to quantify the immunity debt formulated by NPIs in the paediatric population.
Materials and methods
Study design and population
We conducted a retrospective observational study to measure the weekly incidence of four paediatric infectious diseases: RSV, adenovirus (pharyngoconjunctival fever), GAS, and influenza infection. The study included children younger than 15 years old. We extracted the sentinel surveillance data from the Japanese Surveillance System, called National Epidemiologic Surveillance of Infectious Diseases (NESID), between Epi-week 1 in 2014 and Epi-week 52 in 2024. In Japan, there were over 5000 sentinel sites, comprising primary- and secondary-level facilities nationwide as of 2024. They report notifiable diseases every week. RSV, adenovirus, GAS, and influenza infections were confirmed by a rapid diagnostic test at each sentinel site, and test-positive cases (confirmed cases) were reported to the NESID.
Additionally, we collected electronic health records in 23 paediatric clinics, known as CAPS CLINIC. CAPS CLINIC operates multiple primary-care facilities in urban areas, and 23 facilities included in this study were located across Tokyo, Saitama, Chiba, and Kanagawa prefectures, the most populous residential areas in Japan (Supplementary Figure S1). We collected the records of individuals with a diagnosis of ARI and four diseases between 1 January 2014 and 31 December 2023. We extracted clinical diagnoses, symptoms, and laboratory results of patients who visited 23 facilities. All patients’ medical charts were stored electronically in the shared system in those clinics. ARI cases were defined as the patients whose diagnosis included one of the following: ‘upper airway infection’, ‘pharyngitis’, ‘adenitis’, ‘bronchitis’, ‘bronchiolitis’, ‘pneumonia’, or whose symptoms included one of the following: ‘fever’, ‘cough’, or ‘sore throat’. Rapid diagnostic tests were conducted at each clinic. We included patients who met the criteria of ARI and those who were diagnosed with ‘RSV infection’, ‘adenovirus infection’, ‘GAS infection’, or ‘influenza’ and had confirmed test-positive results.
Statistical analysis
With the NESID data, we conducted an interrupted time series (ITS) analysis using a quasi-Poisson regression model to quantify changes in the incidence of each disease. The outcome variables were the weekly number of RSV, adenovirus, GAS, and influenza cases. The predictors included calendar time (week), Fourier harmonic terms (i.e. sine and cosine curves) for the annual seasonality, a dummy variable of national holidays to account for weeks that could decrease the number of reported cases from sentinel sites or increase the number of cases in primary clinics that open during weekends and holidays. This specification was intended to capture major temporal dependency in the data, though residual autocorrelation was not formally evaluated or explicitly modelled. In addition, to account for the level changes in the incidences, we included two dummy variables, which represent (1) during-COVID-19 period, and (2) after-COVID-19 period. We defined (1) during-COVID-19 period as the time after 7 April 2020 (Epi-week 15) when the first ‘state of emergency’ was declared in Tokyo, Osaka, and several major cities, and (2) after-COVID-19 period as the time after 21 March 2022 (Epi-week 11), when the COVID-19 ‘specific containment effort’ was lifted. Then, the interaction term between the dummy variables and calendar time was also included to account for the trend changes in the incidences. Finally, the total number of sentinel sites reported in that week was also included as an (log-transformed) offset term. The detailed description is included in the Supplementary Material.
Additionally, age-stratified analyses were also conducted using the same modelling framework. Specifically, 0, 1, and 2 years for RSV, and 0–4, 5–9, and 10–14 years for adenovirus, GAS, and influenza, considering the age-specific disease burden of each disease. The estimates derived from the models after Epi-week 15, 2020, were used as counterfactual predictions of diseases and compared with the observed incidences. Absolute and relative changes in the number of cases in each disease and age group during and after NPIs were calculated with prediction intervals at the 95% level by year [Reference Farrington32, Reference Yoneoka, Kawashima and Tagami33]. The Epi-weeks 15 to 14 of the next year were used as a 1-year season to compare changes in all four diseases simultaneously.
We repeated the same ITS analyses using data from CAPS CLINIC with another outcome variable: the proportion of test-positive cases of each infectious disease among the entire ARI cases by week. Finally, to validate the generalizability of the 23 CAPS CLINICs towards the general population, we compared the weekly number of diagnosed cases of four diseases in CAPS CLINICs with the sentinel surveillance data using the cross-correlation function (CCF). The best lag time was measured to assess the difference between the two. All analyses were conducted with R software (version 4.2.2).
Ethical approval was obtained from the Ethics Committee at the National Institute of Infectious Diseases (NIID) (Ref No. 1658, 1908). All clinical records in the CAPS CLINICs were anonymized and shared with the NIID for analysis.
Results
Between 2014 and 2024, 1356495 RSV, 819733 adenovirus, 3079071 GAS, and 10071103 influenza-infected cases younger than 15 years old were reported through the surveillance system. RSV infections were predominantly identified among those younger than 2 years old. Adenovirus infection mostly affected those aged 0–4 years, GAS and influenza primarily affected children aged 5–9 years (Supplementary Table S1a). At 23 CAPS CLINICs, a total of 1392840 patients younger than 15 years old were diagnosed with ARI between 2014 and 2023. Among them, 2032 RSV, 8256 adenovirus, 14282 GAS, and 53714 influenza infections were diagnosed. The proportion of RSV cases among total ARI was highest in 0-year-olds, that of adenovirus in 2- to 4-year-olds, that of GAS in 5- to 9-year-olds, and that of influenza in 10- to 14-year-olds (Supplementary Table S1b, Supplementary Figure S2).
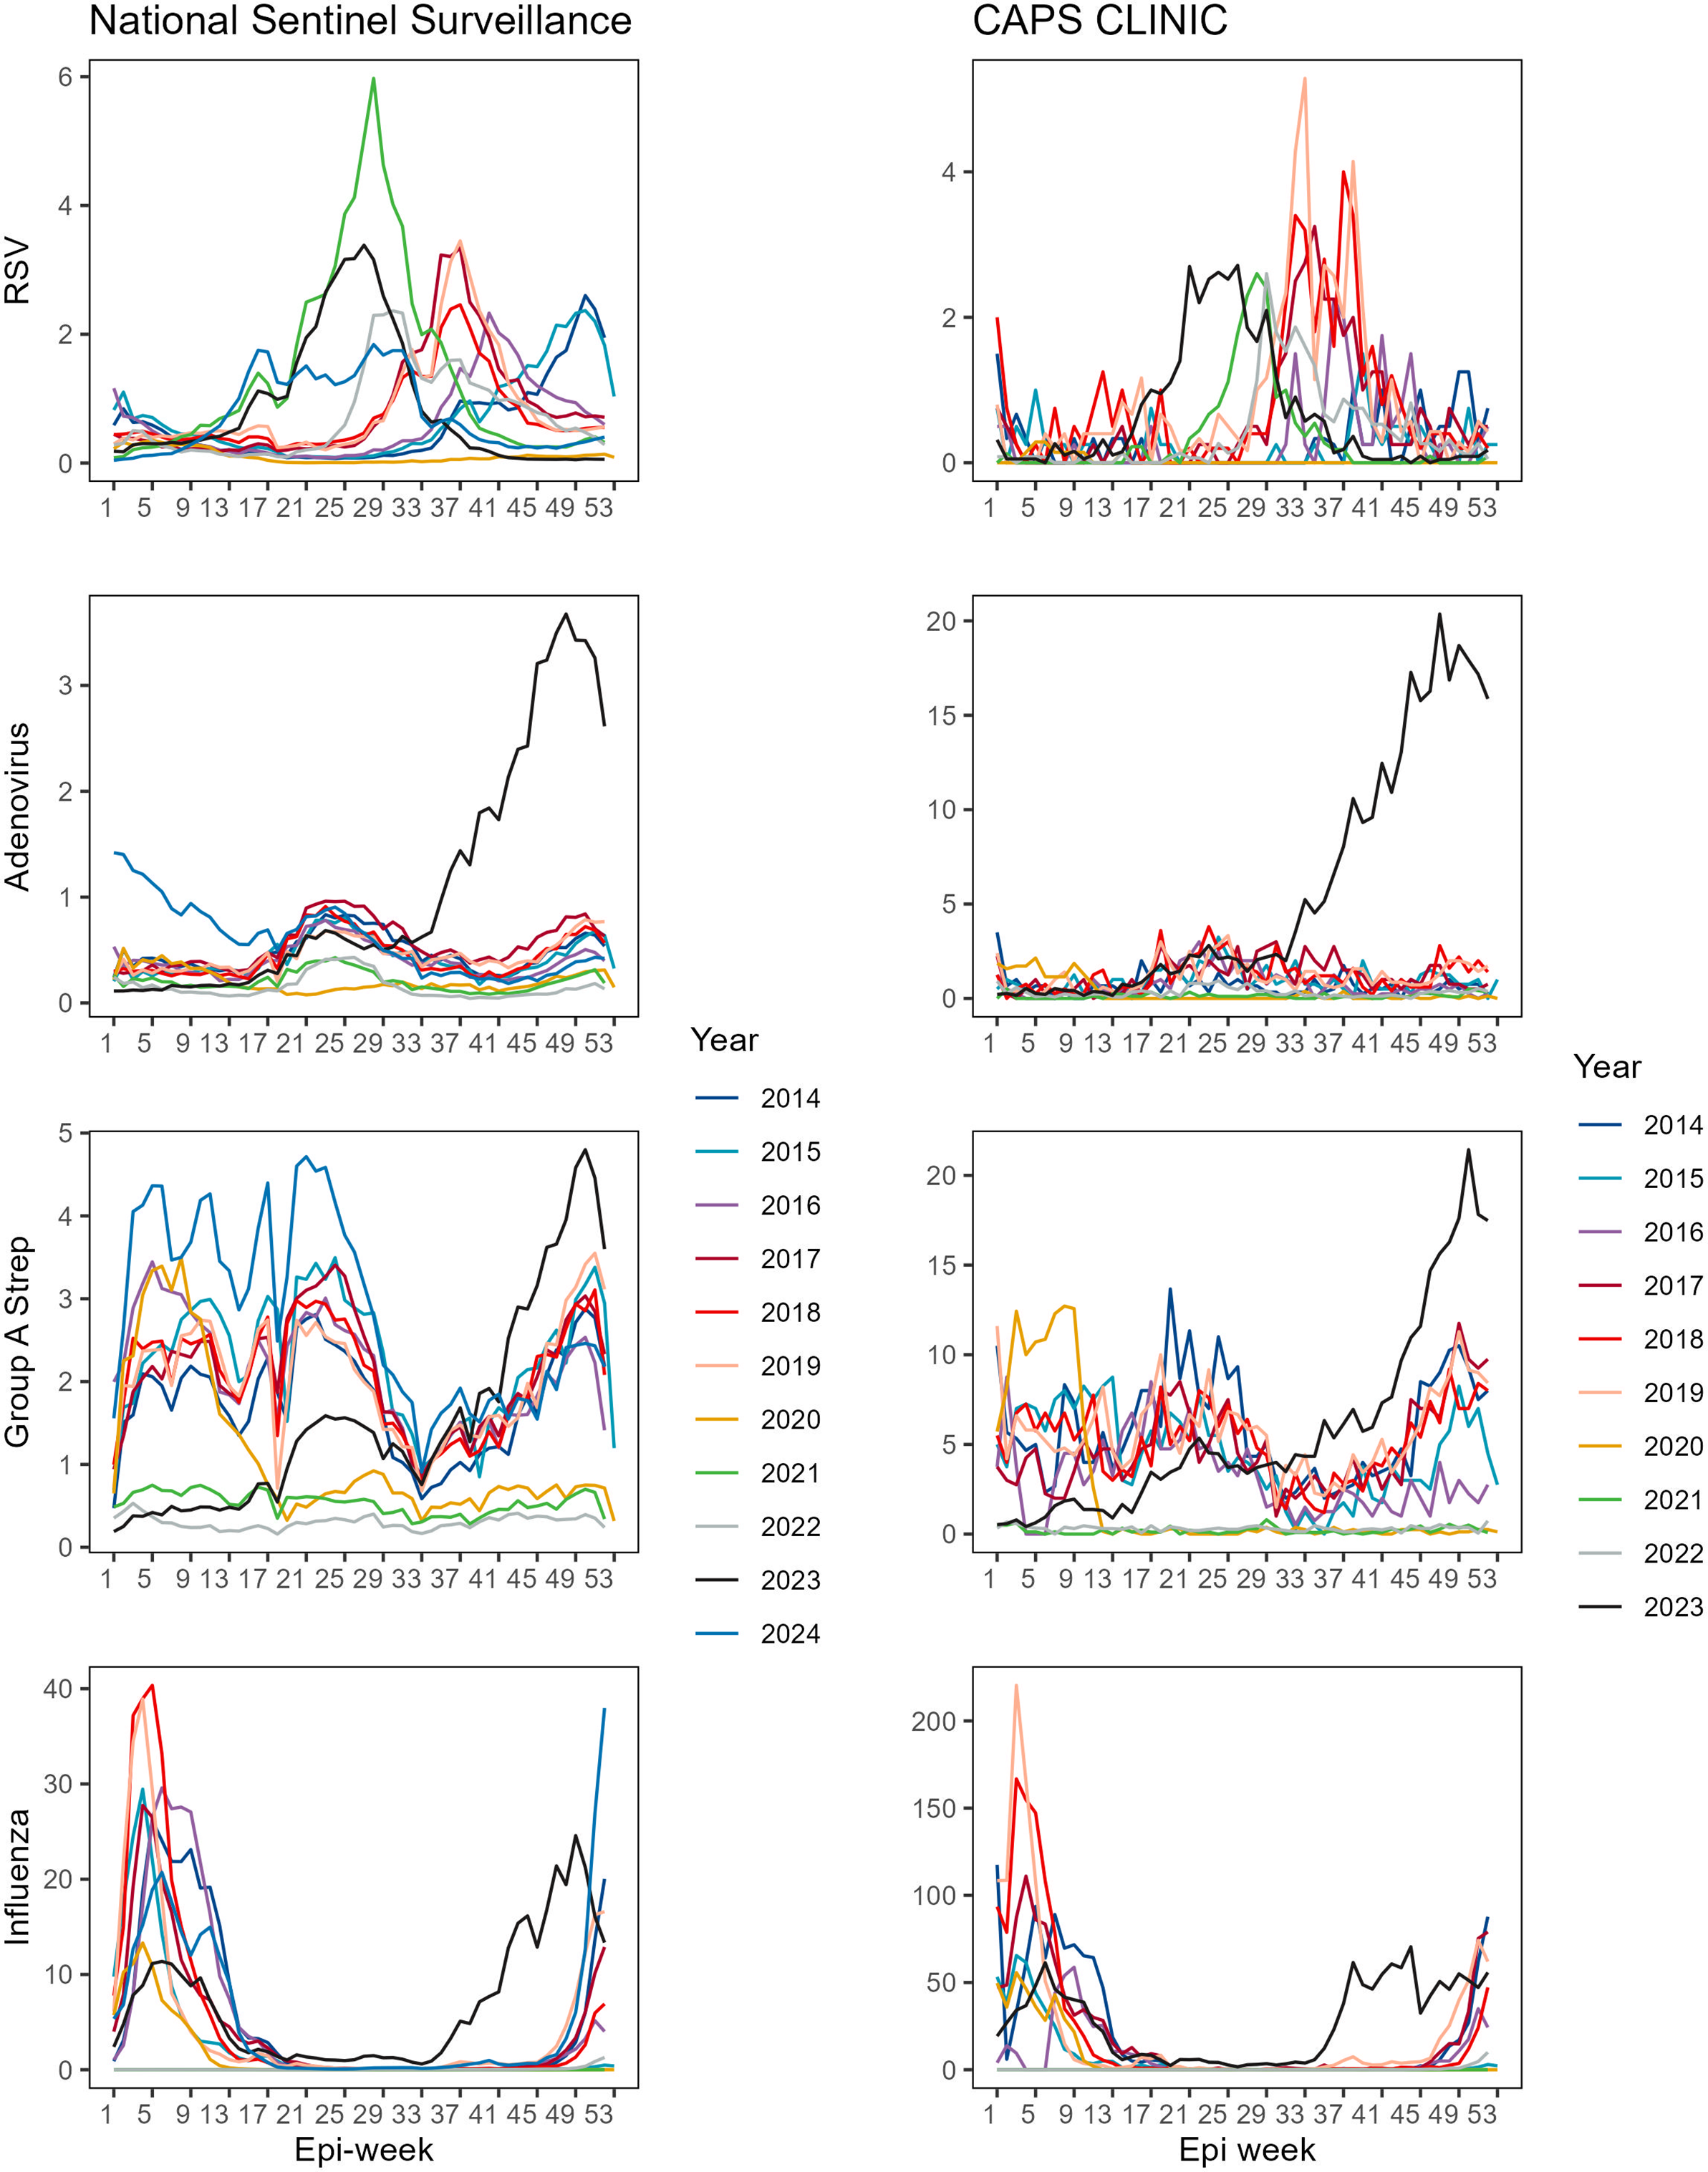
The national surveillance data show that the peak of RSV used to be Epi-week 50 as seen in 2014 and 2015, and it gradually shifted towards summer, specifically to Epi-week 37 in 2017–2019. Furthermore, the peak of RSV infection was observed early in the season, that is, Epi-weeks 27–30 after 2021. Adenovirus and GAS infections exhibit two peaks at Epi-weeks 20–23 and 50–51 each year, and these peaks have remained unchanged since 2021. For influenza, the peak was normally at Epi-weeks 5–6; however, the peak was observed in Epi-week 49 during the 2022–2023 season. The data from the CAPS CLINIC show similar trends, except for RSV infection. There is no prominent peak in the number of RSV cases in 2021 in the clinic’s data. RSV cases per clinic were lower than the reported cases per sentinel site, whereas the number of diagnosed cases per facility was four to five times higher than those for sentinel surveillance sites in adenovirus, GAS, and influenza infection (Figure 1).
Seasonal trend of RSV, adenovirus, Group A strep and influenza in surveillance data and CAPS CLINIC.

Figure 1 Long description
Top row: R S V trends. Left panel (National Sentinel Surveillance) shows a sharp peak in 2021 (green) around epi-week 27, with other years showing lower, broader peaks. Right panel (CAPS CLINIC) shows multiple peaks, with 2017 (red) and 2021 (green) having the highest values around epi-weeks 33 to 41. Second row: Adenovirus. Left panel shows a steady increase in 2024 (black) from epi-week 25 onward, surpassing previous years, which remain relatively flat. Right panel shows a similar sharp rise in 2024, with other years clustered at lower values. Third row: Group A Strep. Left panel shows 2024 (black) rising sharply after epi-week 37, while 2015 (blue) and 2017 (red) have earlier peaks. Right panel shows 2024 (black) with the highest late-year increase, other years are lower and more variable. Bottom row: Influenza. Left panel shows high peaks in 2017 (red) and 2018 (blue) early in the year, with 2024 (black) rising at the end. Right panel shows 2017 (red) with the highest early peak, 2024 (black) rising late, and other years with lower, earlier peaks. Legends at the bottom of each column identify years by color.
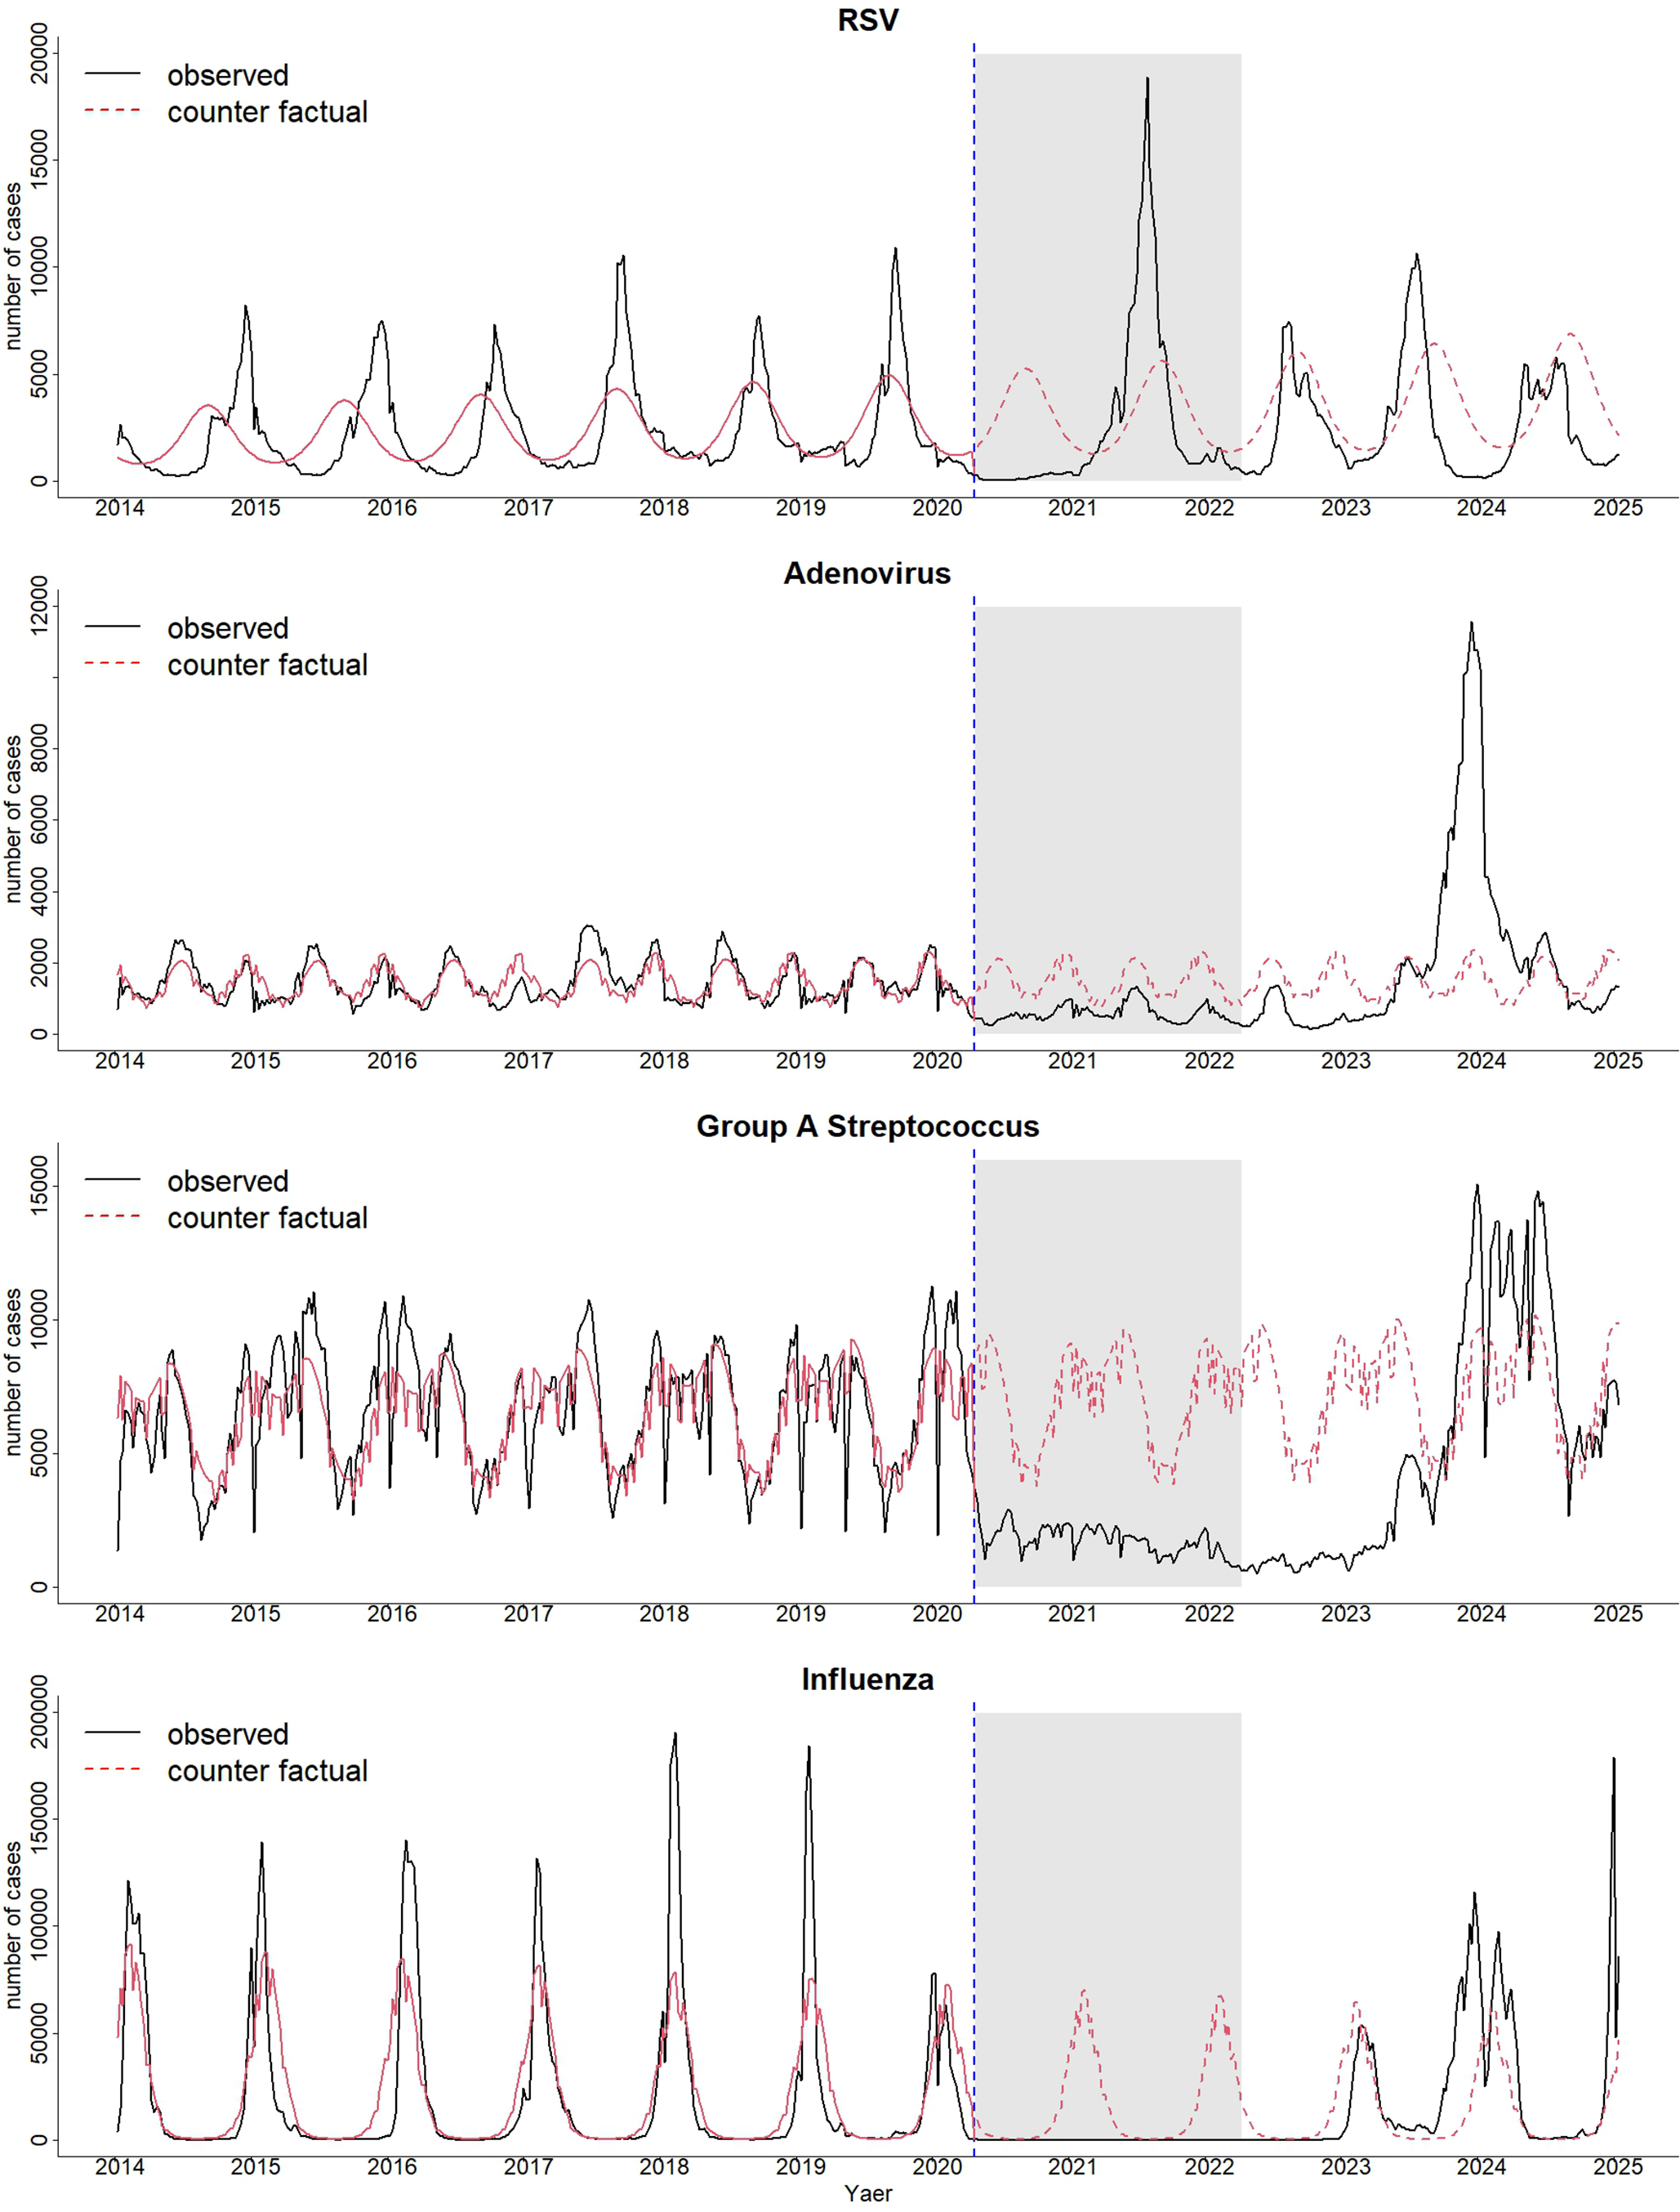
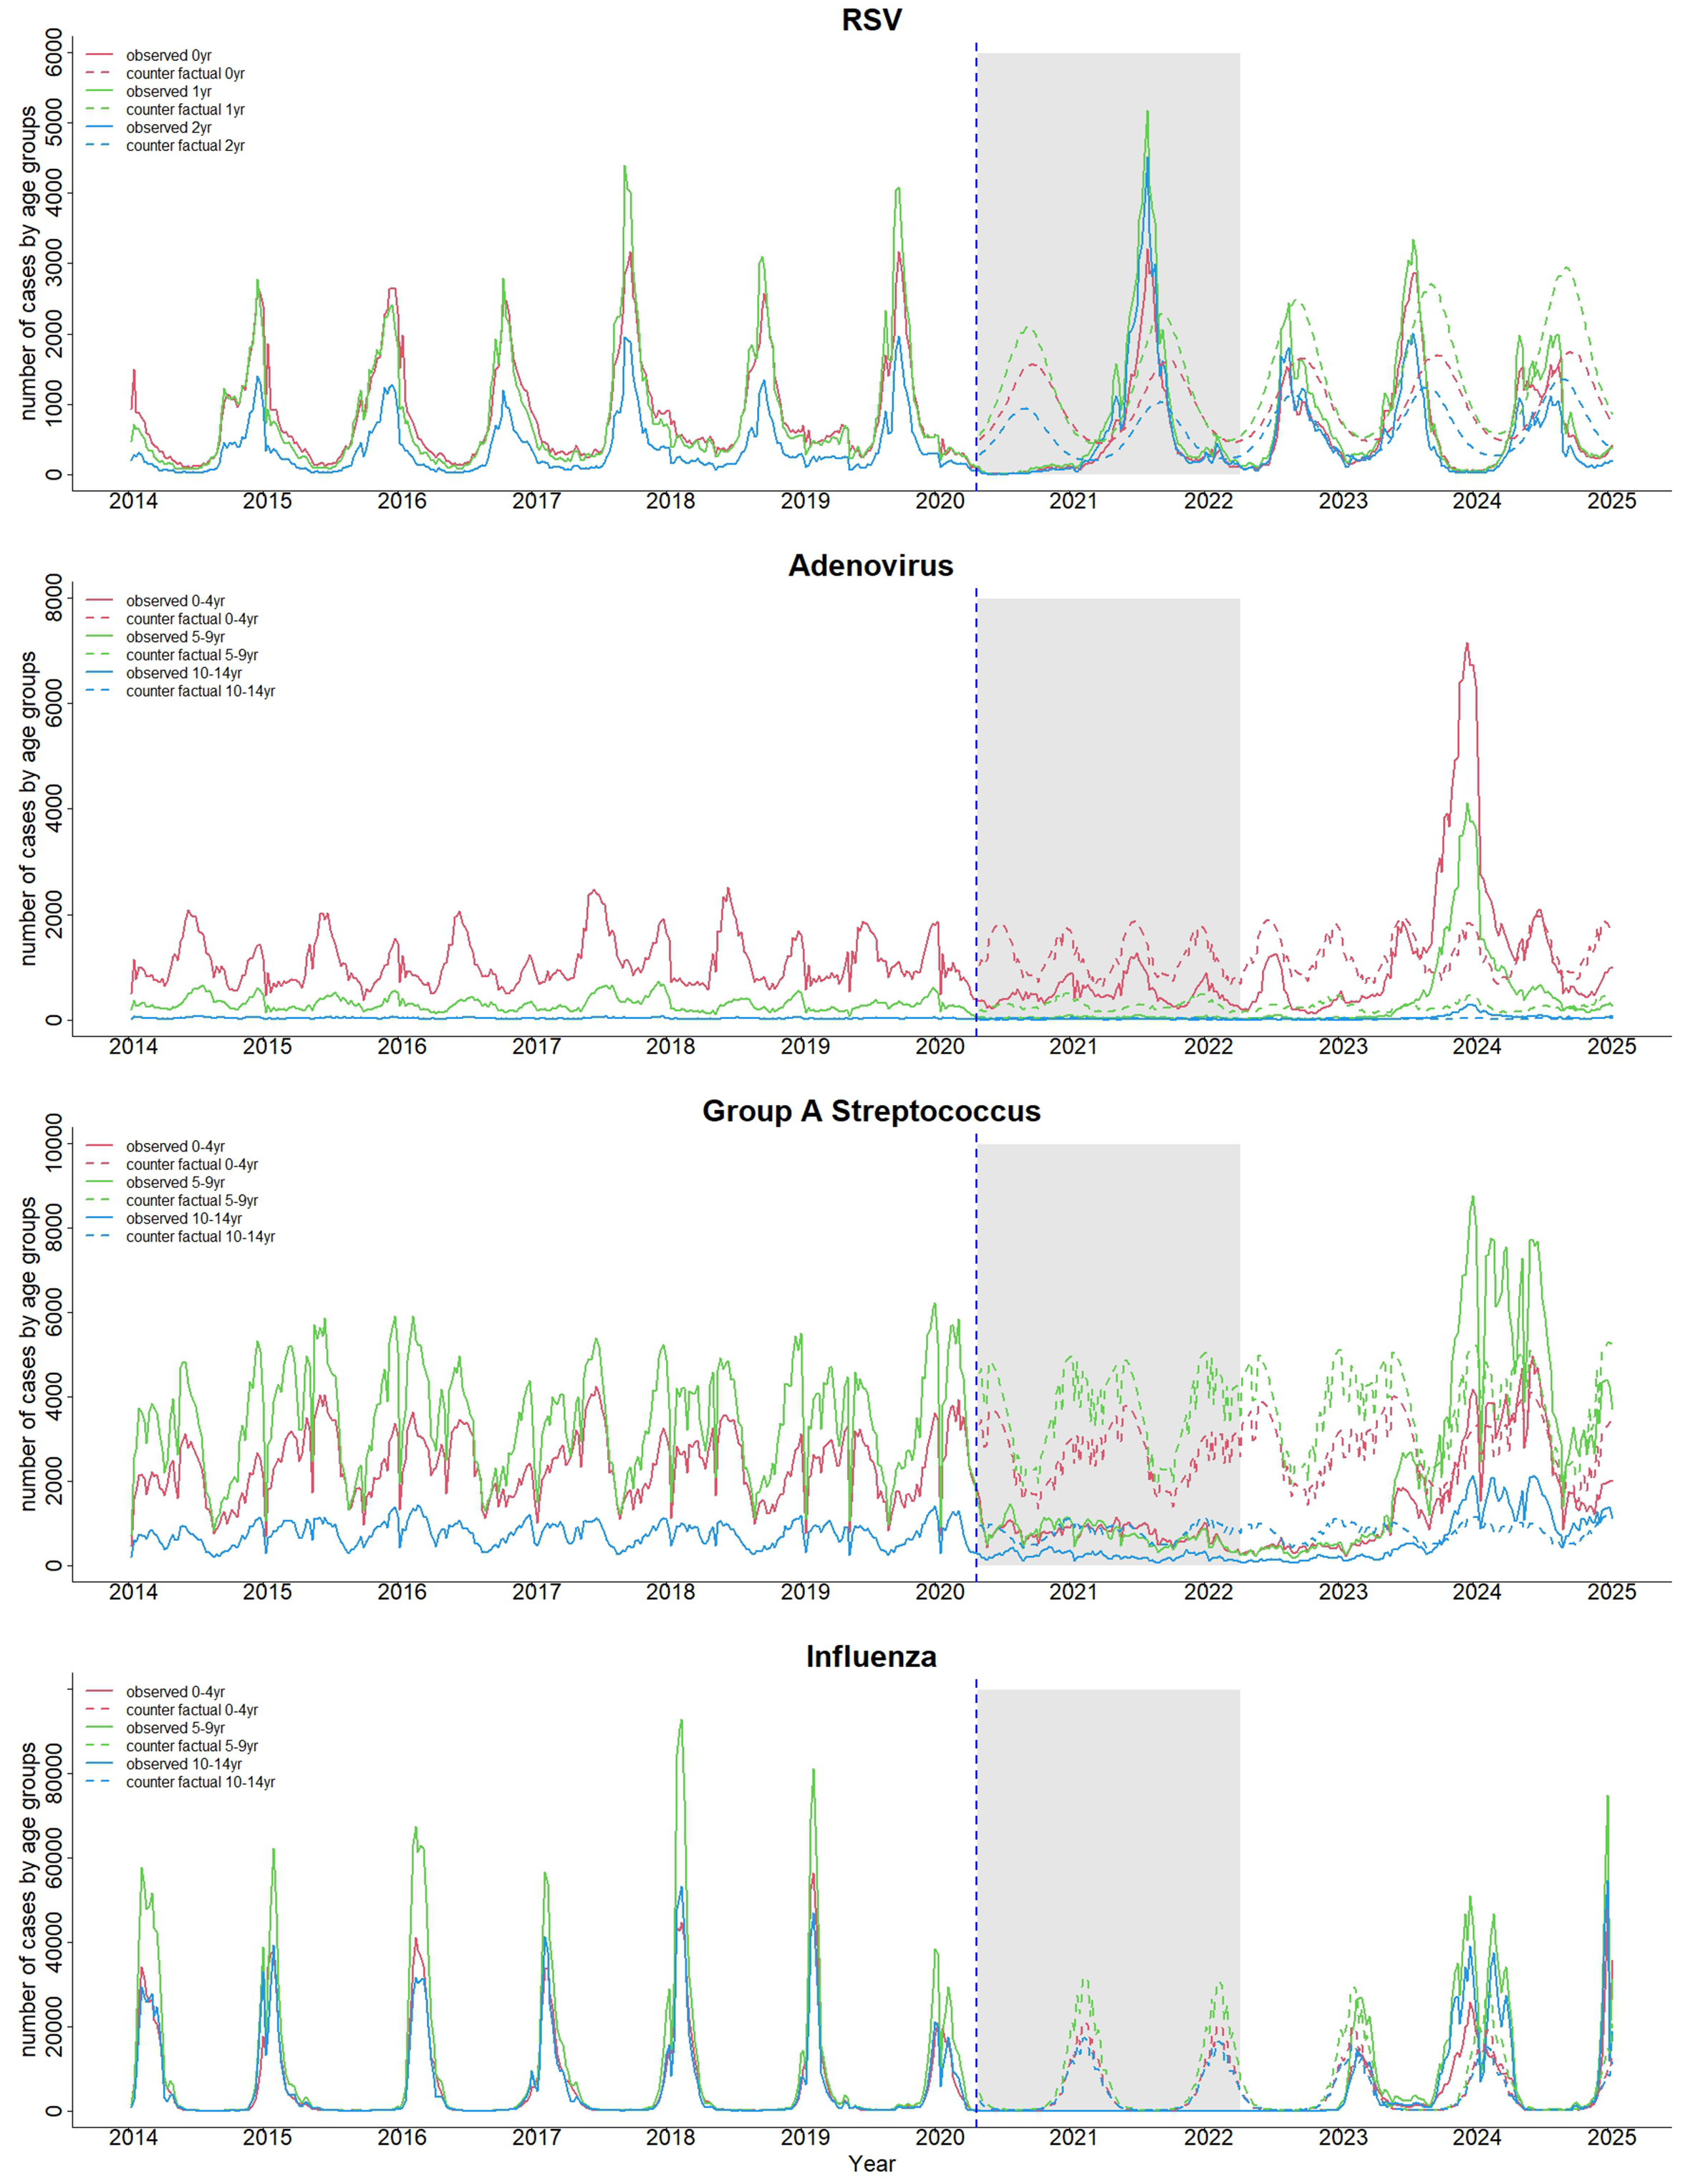
The results of both ITS analyses using the NESID data show that the number of adenovirus, GAS, and influenza cases was strongly suppressed between Epi-week 15, 2020, and Epi-week 33, 2023. After that, the number of cases increased dramatically towards the end of 2023. While RSV cases increased in 2021, the number of cases in 2022 and 2023 was lower than the predicted number (Figure 2). The results of ITS analyses by three age groups show a similar decline and increase trend with the total number of cases (Figure 3).
Observed and counterfactual case numbers for four pathogens between 2014 and 2024.

Figure 2 Long description
The top panel shows RSV cases with a solid black line for observed and a dashed red line for counterfactual. From 2014 to early 2020, both lines follow a seasonal pattern, peaking annually. After the blue dashed line at 2020, observed cases drop sharply, then spike in 2021 within the shaded region, exceeding counterfactual predictions, and fluctuate through 2025. The second panel for Adenovirus shows consistent low-level seasonality until 2020, then a brief drop, followed by a sharp observed spike in 2022, again surpassing counterfactual estimates. The third panel for Group A Streptococcus shows pre-2020 seasonal peaks, a marked drop in observed cases after 2020, then a delayed resurgence with higher peaks in 2023 and 2024 compared to counterfactual. The bottom panel for Influenza displays strong annual peaks before 2020, a near disappearance during the shaded pandemic period, and a return to seasonal peaks after 2022, with observed values diverging from counterfactual. All panels use the same x-axis (years) and y-axis (number of cases), with the shaded region marking the pandemic period.
Observed and counterfactual cases by age groups for four pathogens between 2014 and 2024.

Figure 3 Long description
The top panel shows R S V with annual peaks in all age groups until 2020, a sharp drop during the shaded pandemic period, then a large spike in 2021, followed by resumed seasonality. Observed and counterfactual lines are shown for age groups 0 to 4 years, 5 to 9 years, and 10 to 14 years, with observed lines solid and counterfactual dashed. The second panel, adenovirus, displays lower, irregular peaks, with a marked increase in observed cases for 0 to 4 years after 2022, exceeding counterfactual predictions. The third panel, Group A Streptococcus, shows moderate peaks pre-2020, a drop during the pandemic, then a pronounced surge in observed cases for 0 to 4 years and 5 to 9 years after 2022, surpassing counterfactuals. The bottom panel, influenza, features strong annual peaks in all age groups pre-2020, a near absence during the pandemic, and a return to seasonality post-2022, with observed and counterfactual lines closely aligned. All panels use the same color scheme for age groups and line types for observed versus counterfactual data.
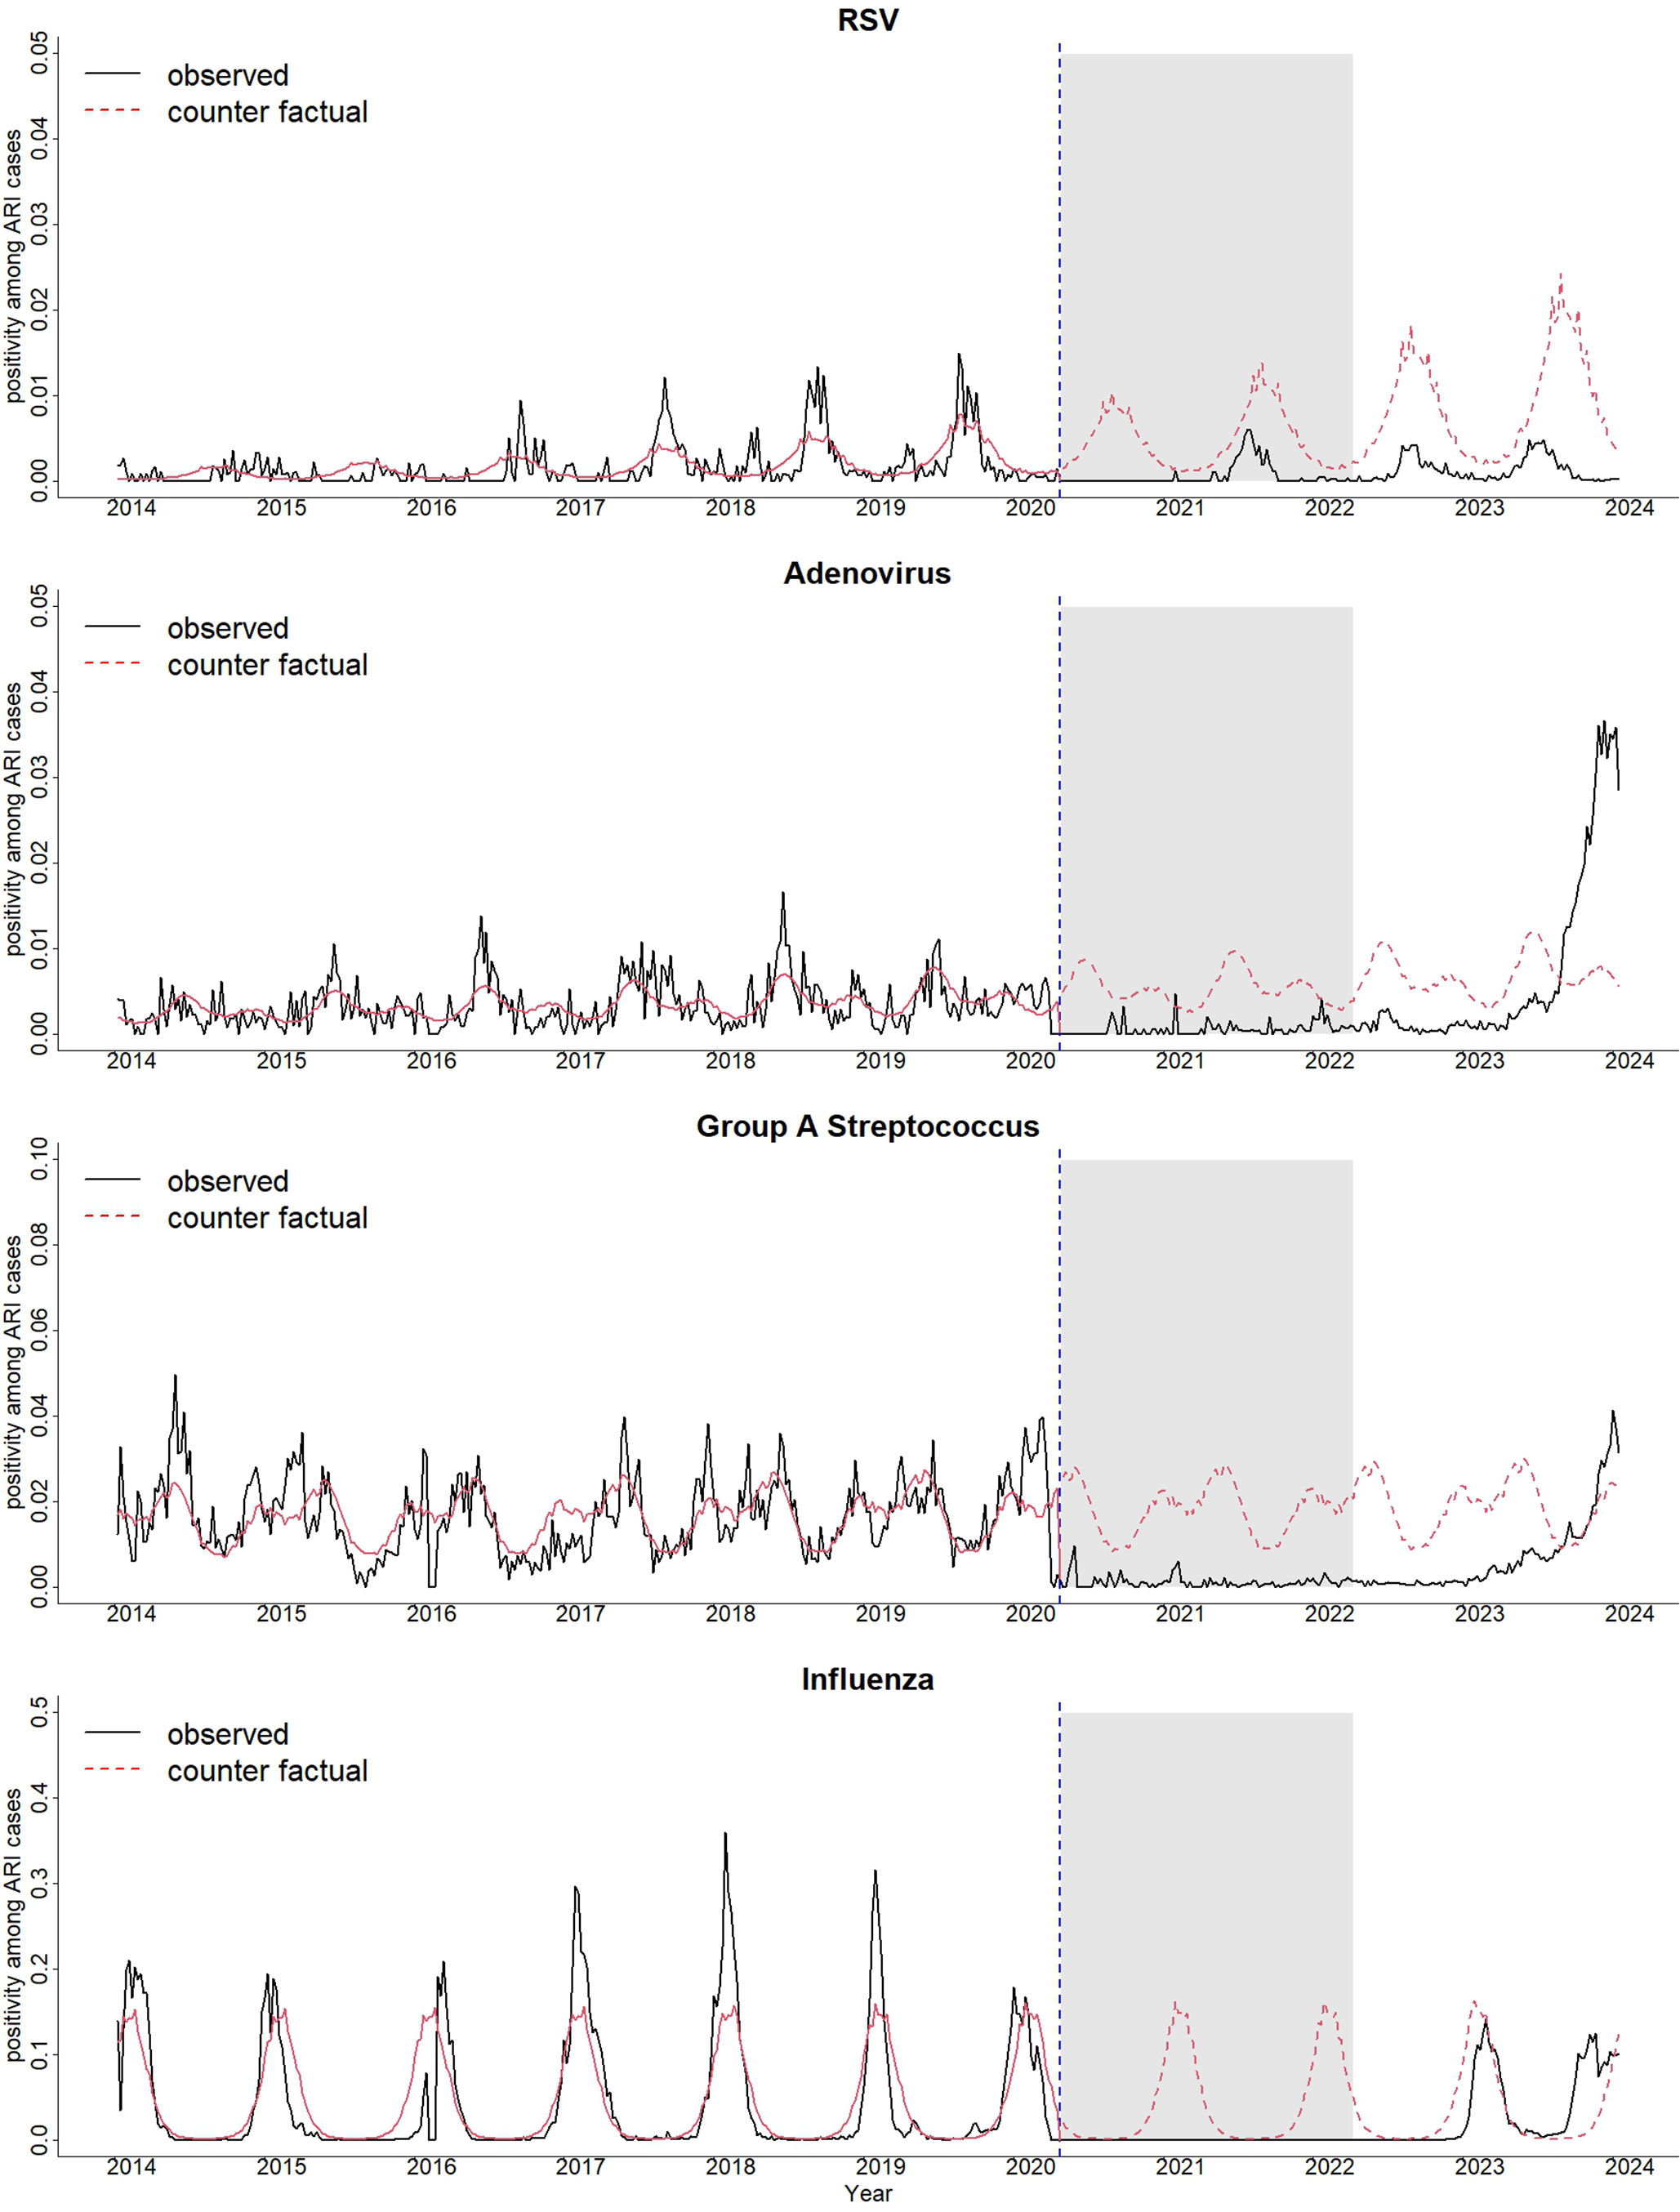
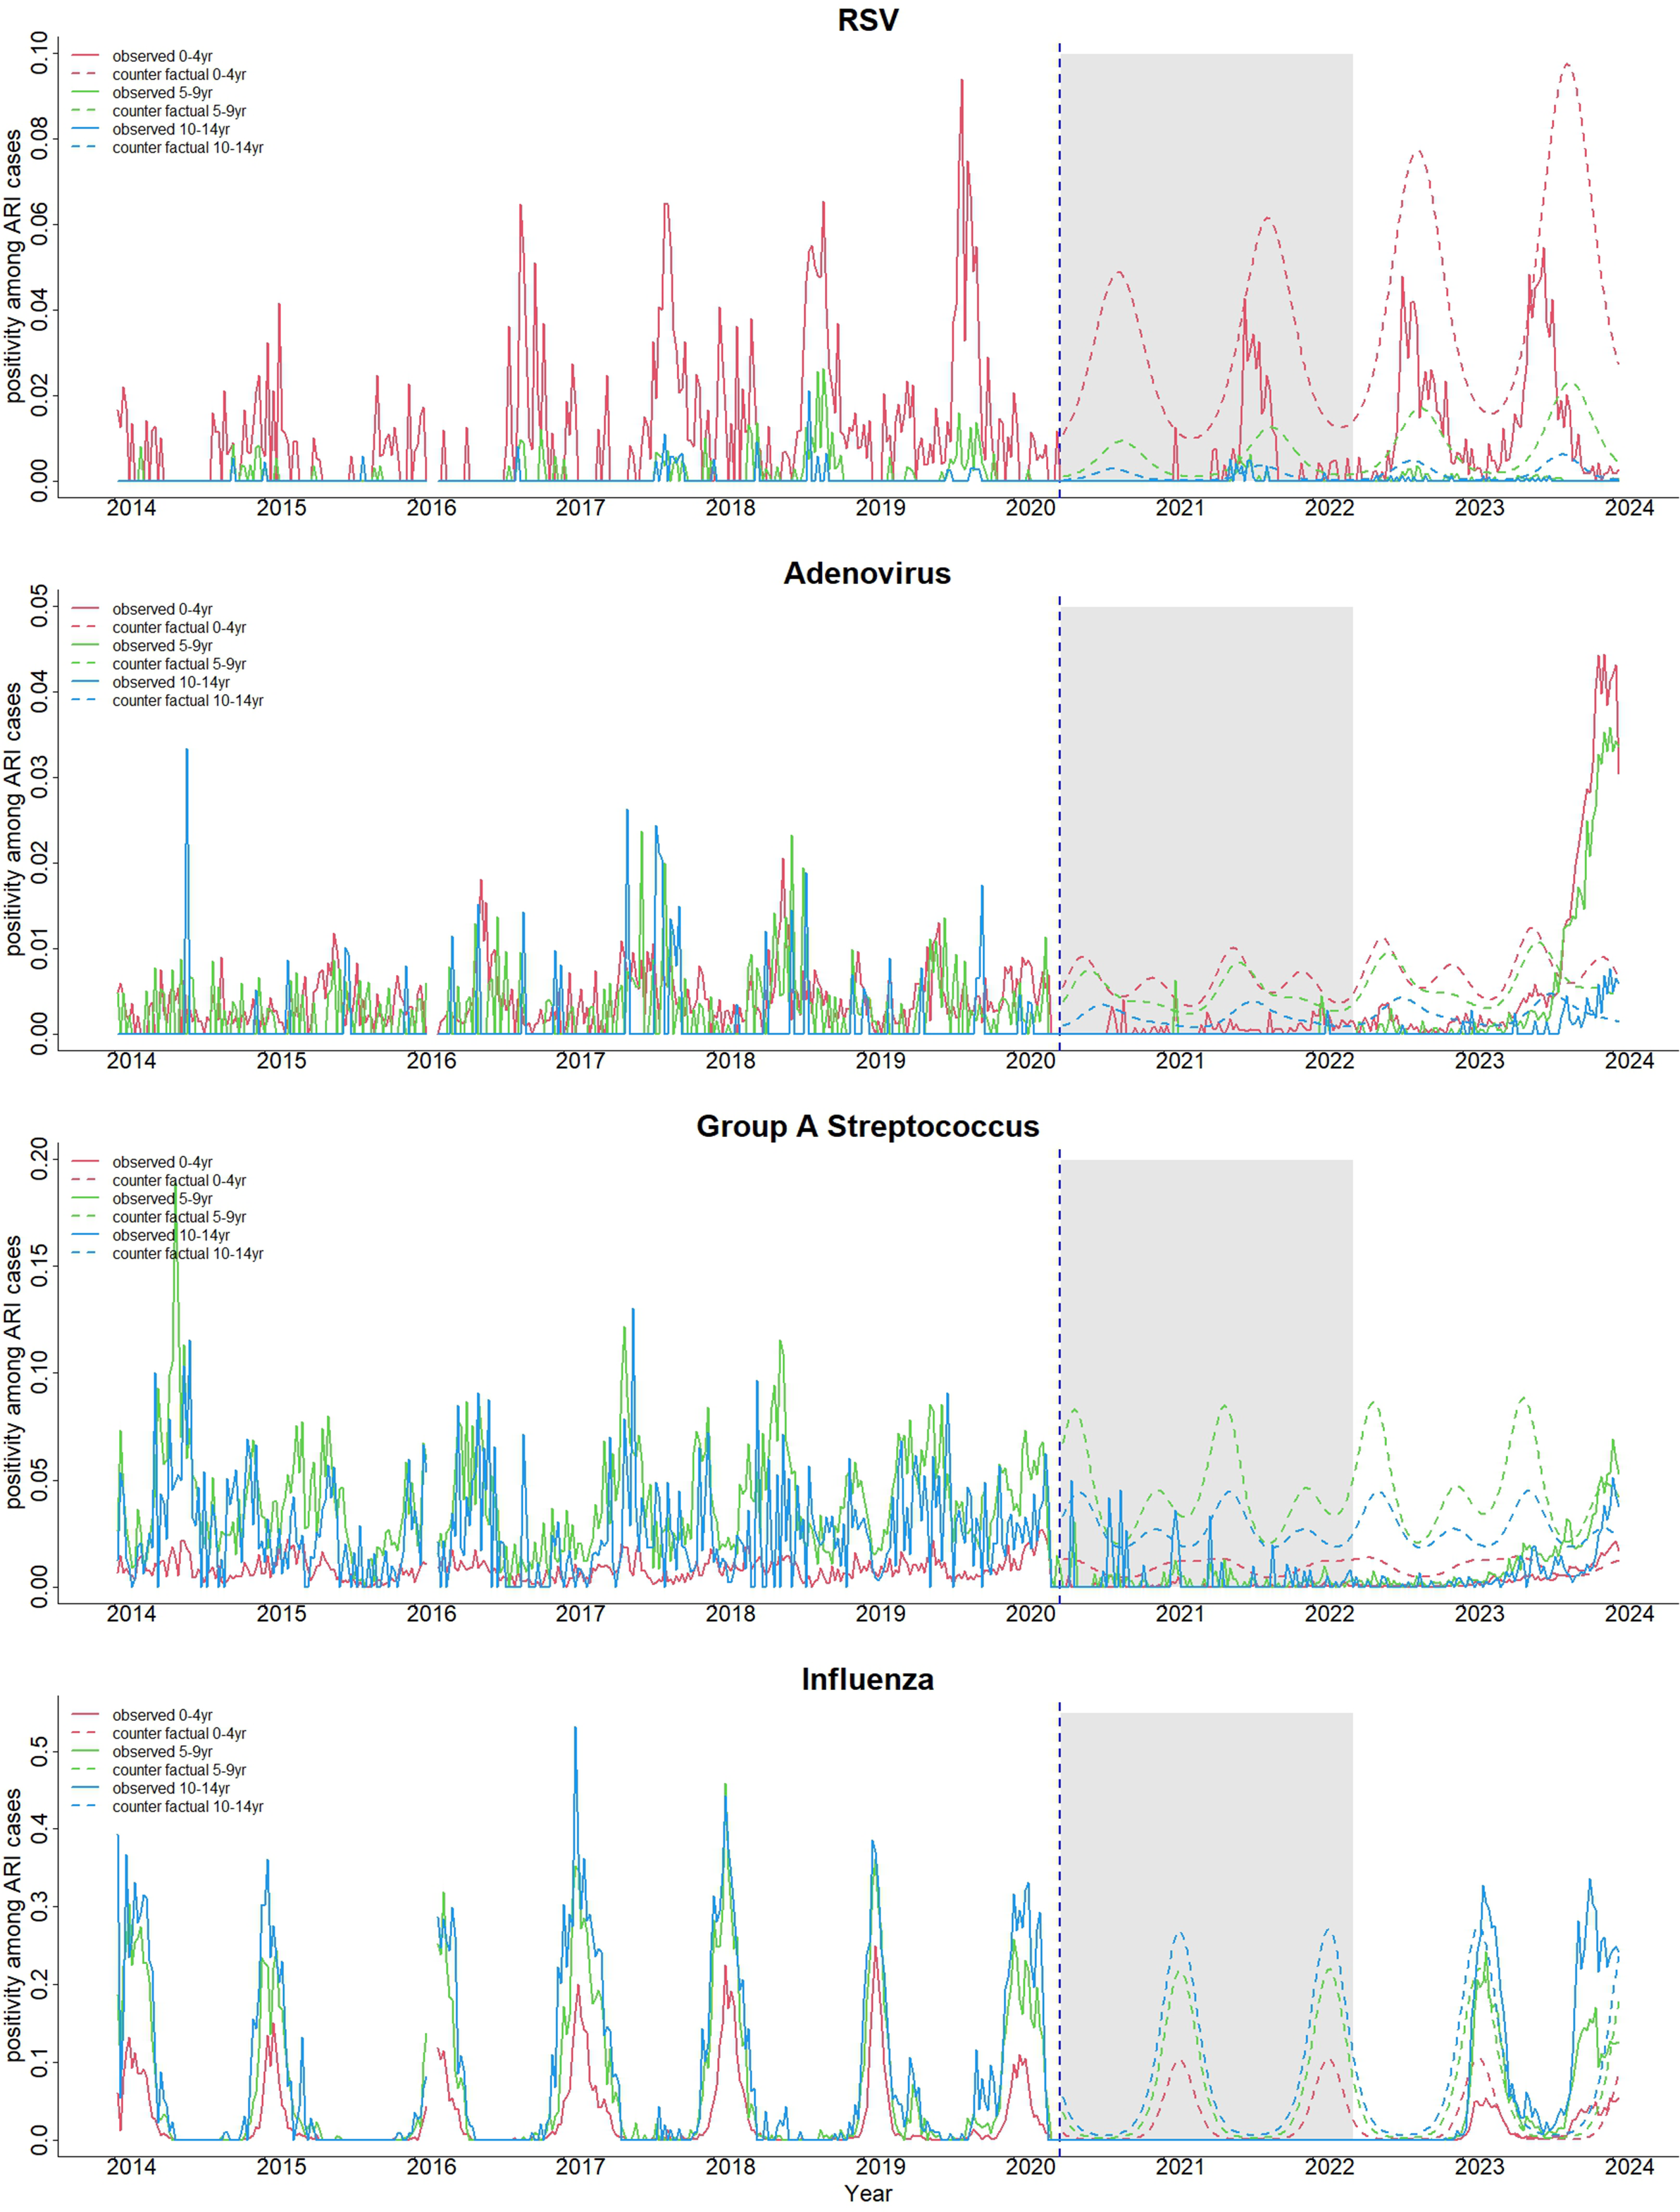
The same trends in the proportion of positive cases of four diseases among ARI were observed in the records of 23 clinics, except for RSV. A notable increase in RSV positivity was not observed in 2021 in the clinics (Figure 4). RSV accounted for 5–10% of total ARI cases among infants during the peak season, while the positive proportion of RSV among children aged 1 and 2 years old was less than 2%. Adenovirus accounted for between 1% and 2% of ARI cases across all age groups. GAS accounted for approximately 10% of ARI among children aged 5–9 years. Influenza accounted for nearly 50% of ARI among children aged 10–14 years in influenza seasons. During the implementation of the NPIs, the positive proportion of adenovirus, GAS, and influenza declined. After 2023, the positive proportion of adenovirus increased among those aged 0–4 and 5–9 years, that of GAS increased among those aged 5–9 and 10–14 years, and that of influenza increased among those aged 10–14 years (Figure 5).
Observed and counterfactual positivity rates of four pathogens among all ARI cases.

Figure 4 Long description
From top to bottom: The first panel shows R S V positivity rates with observed values (solid black) and counterfactual (dashed red). Both lines track closely until 2020, after which observed rates drop sharply and remain low through the shaded region (2020–2022), then rise again but stay below counterfactual projections. The second panel for Adenovirus shows similar tracking until 2020, then observed rates drop and remain low during the shaded period, but spike sharply upwards in 2023–2024, exceeding counterfactual. The third panel for Group A Streptococcus shows observed and counterfactual lines closely matched until 2020, then observed rates drop to near zero during the shaded period, rising again in 2023–2024. The fourth panel for Influenza shows strong seasonal peaks in both lines until 2020, after which observed rates drop to near zero during the shaded region, then resume seasonal peaks but at lower amplitude than counterfactual. All panels use the same x-axis (year) and y-axis (positivity among A R I cases), with a vertical dashed line marking 2020 and a shaded region spanning 2020–2022.
Observed and counterfactual positivity rates of four pathogens among all ARI cases by age groups.

Figure 5 Long description
The top panel shows R S V positivity rates for age groups 0 to 4, 5 to 9, and 10 to 14 years, with observed data as solid lines and counterfactual as dashed lines. Peaks occur before 2020, then a drop during the shaded pandemic period, followed by a resurgence. The second panel, Adenovirus, shows low rates until a sharp rise in observed 0 to 4 year group after 2022, while counterfactual lines remain low. The third panel, Group A Streptococcus, displays seasonal peaks in observed 5 to 9 year group, with a decline during the pandemic and a rise after 2022; counterfactual lines show continued seasonality. The bottom panel, Influenza, shows strong annual peaks in observed data for all age groups before 2020, a sharp drop during the pandemic, and a return to seasonality after 2022. Legends indicate line colors for each age group and line style for observed versus counterfactual. The shaded region and dashed vertical line mark the pandemic onset and period.
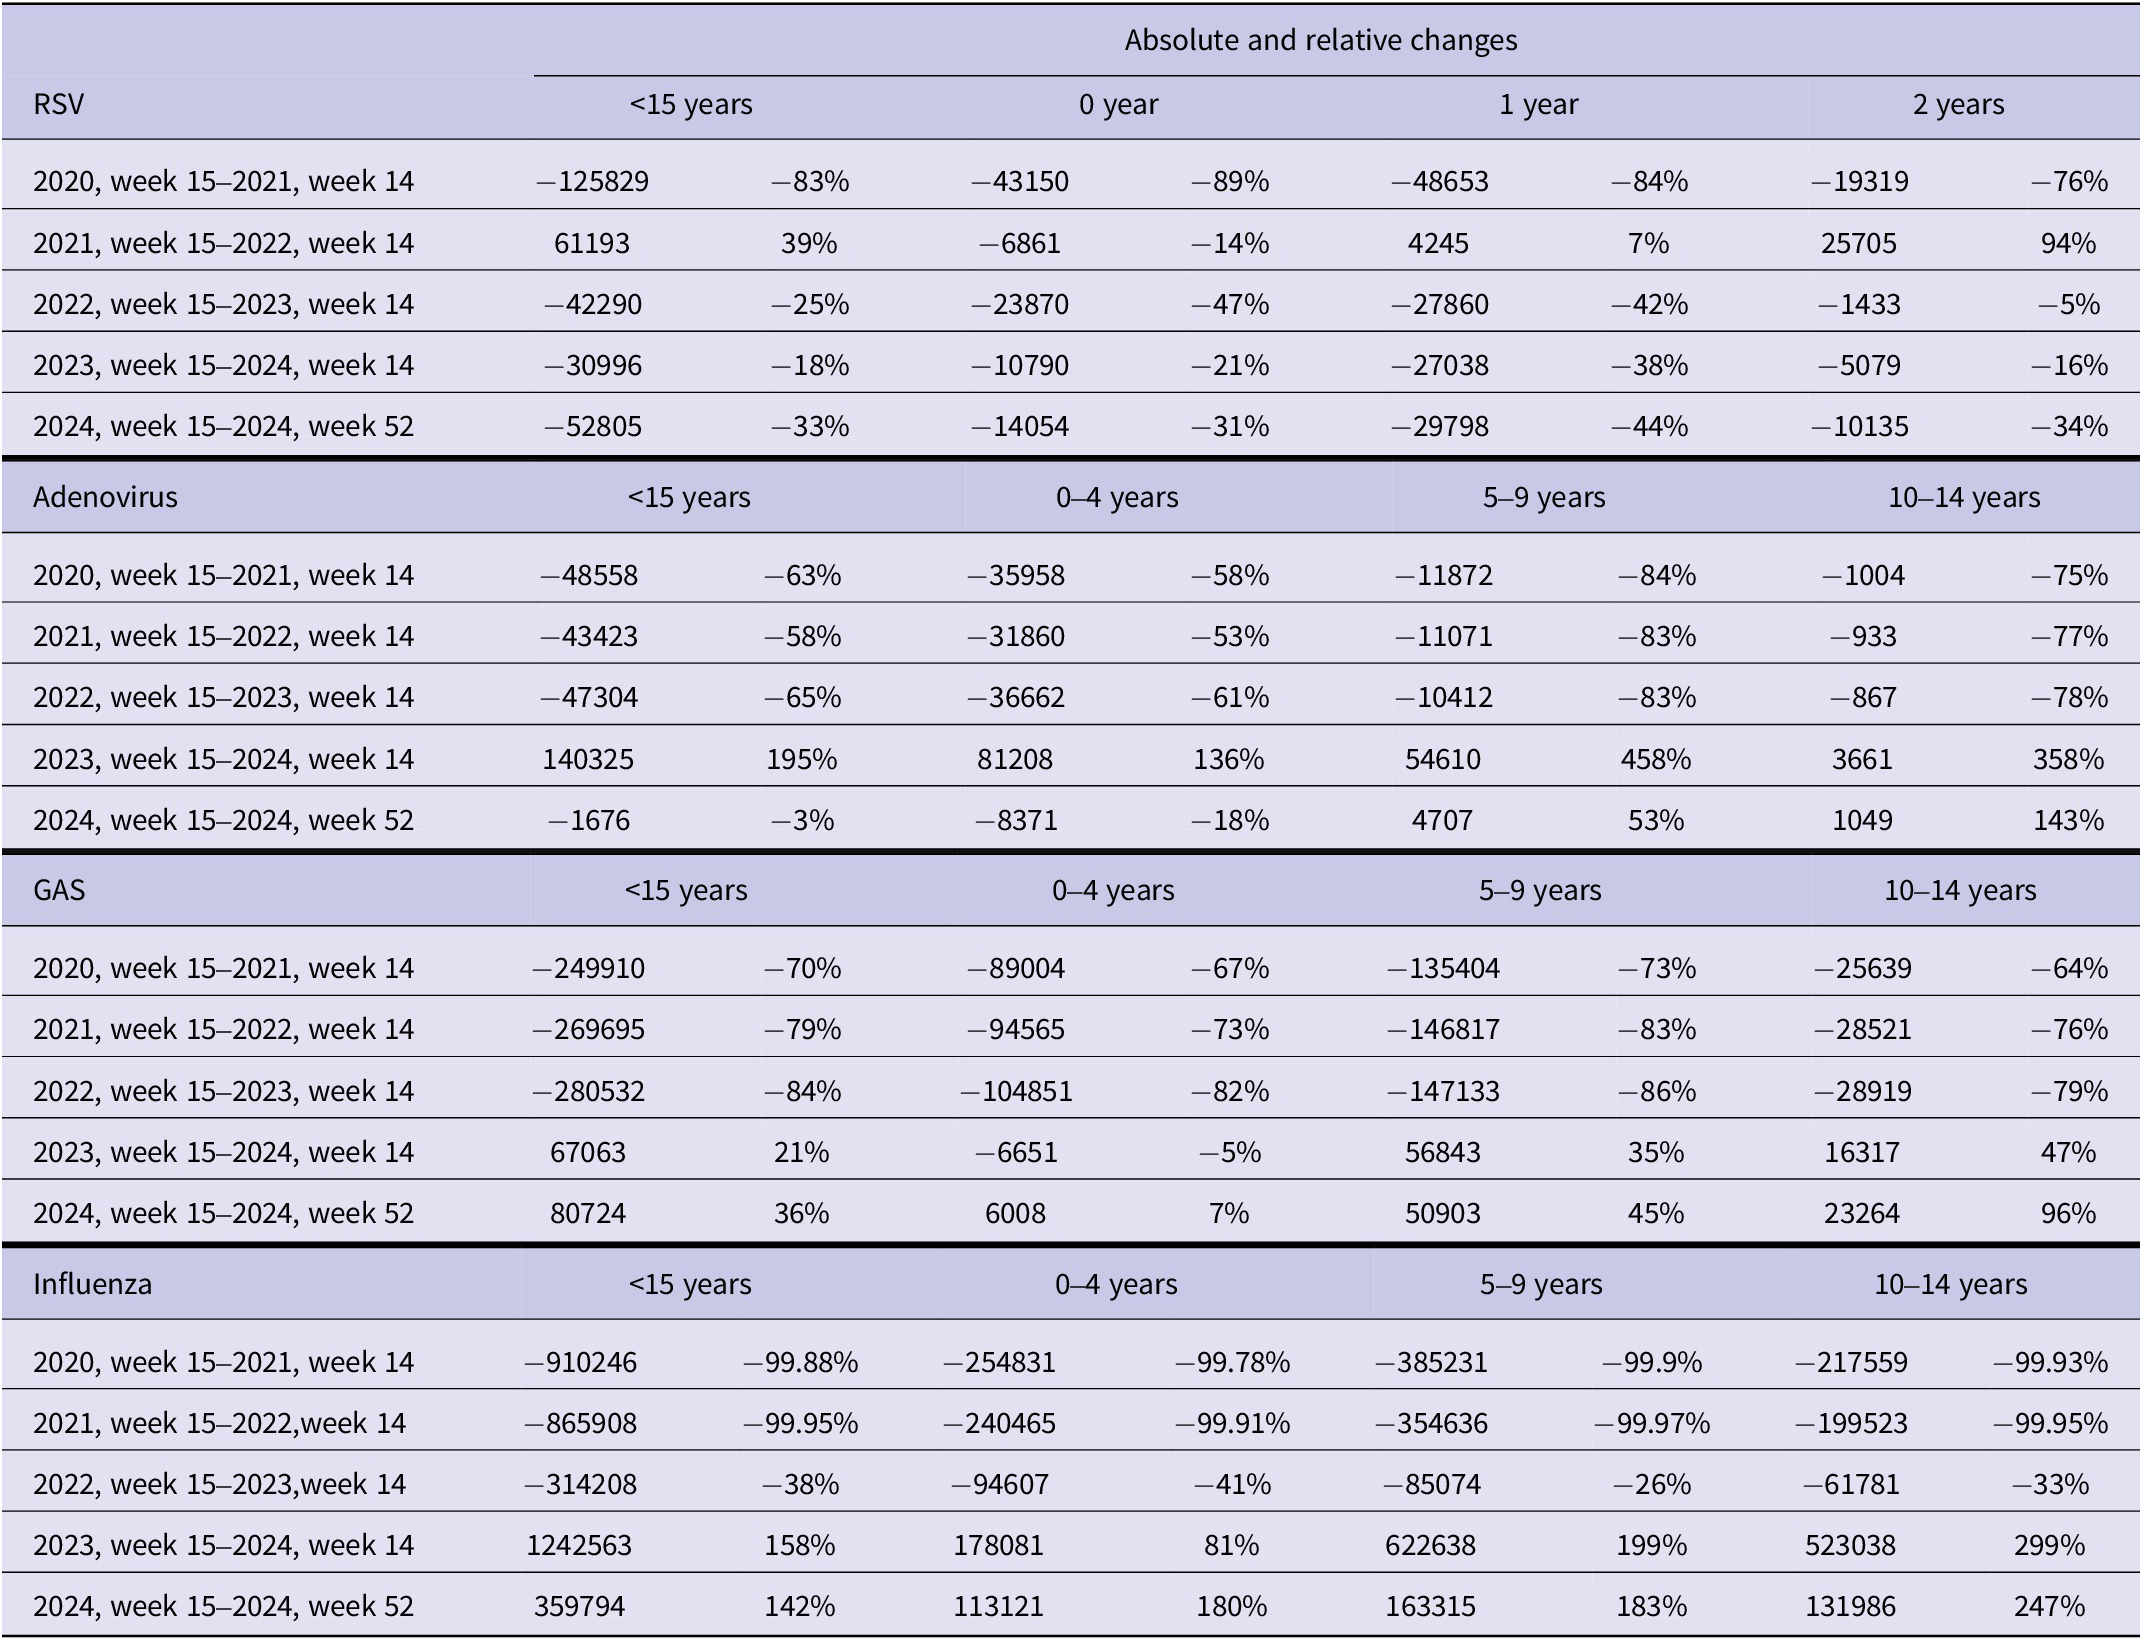
We quantified the absolute and relative changes in the number of cases of each disease by age group between Epi-week 15, 2020, and Epi-week 52, 2024, compared with the predicted counterfactual number of cases in the same period using surveillance data. RSV cases younger than 15 years old decreased by 83% in the 2020–2021 season and increased by 39% in the 2021–2022 season. The percentage increase was observed most among children aged 2 years (94%) during the same period, while the number of cases declined by 14% among infants. The number of RSV cases stayed low after 2022. The number of adenovirus cases declined by 58–68% during three consecutive seasons: 2020–2021, 2021–2022, and 2022–2023. In 2023–2024, adenovirus cases increased by 195%, with the largest relative increases observed in children aged 5–9 years (458%), followed by those aged 10–14 years (358%) and 0–4 years (136%). The number of GAS cases declined by 70–84% for the first three seasons and increased by 21% in 2024, with a 36% increase in cases among children aged 10–14 years. The number of influenza cases declined more than 99% in the first two seasons of 2020–2021 and 2021–2022. In 2022–2023, the relative decrease was 38%. Then, the number of cases increased by 158% in 2023 and 142% in 2024, with the largest increase observed in 10- to 14-year-olds (247–299%) (Table 1 and Figure 3).
The absolute and relative changes in yearly cases of respiratory syncytial virus, adenovirus, group A Streptococcus, and influenza infection compared with the predicted counterfactual number of cases

Table 1 Long description
Starting from the top, the table is divided into four main pathogen sections: respiratory syncytial virus, adenovirus, group A Streptococcus, and influenza. Each section is further split horizontally by age groups, with columns for less than 15 years, 0 year, 1 year, and 2 years for respiratory syncytial virus; less than 15 years, 0–4 years, 5–9 years, and 10–14 years for adenovirus, group A Streptococcus, and influenza. For each pathogen and age group, rows represent consecutive yearly intervals from 2020 week 15 to 2024 week 52. Absolute changes are shown as positive or negative numbers, and relative changes as percentages. For respiratory syncytial virus, the largest decrease occurred in 2020–2021 across all age groups, with a partial rebound in 2021–2022, then further decreases in subsequent years. Adenovirus shows consistent decreases until 2023–2024, when a sharp increase is observed, especially in 5–9 years (plus 458 percent), followed by mixed changes in 2024. Group A Streptococcus displays large decreases until 2022–2023, then increases in 2023–2024 and 2024, most notably in 10–14 years (plus 96 percent in 2024). Influenza cases dropped by over 99 percent in 2020–2022, then rebounded sharply in 2023–2024, with increases up to plus 299 percent in 10–14 years, and sustained high increases in 2024. All values are presented exactly as shown, with negative numbers indicating reductions and positive numbers indicating increases relative to predicted counterfactuals.
Note: The 95% prediction intervals for absolute and relative changes are summarized in Supplementary Tables S2a, S2b, S2c, and S2d.
CCF shows that four disease trends in the CAPS CLINIC were similar to those in the surveillance data. A peak of 0-week lag (no lag) existed between the two datasets (cross-correlation =0.63, 0.45, 0.63, and 0.62 for RSV, adenovirus, GAS, and influenza, respectively), indicating that they correlated well (Supplementary Figure S3).
Discussion
This study described the changes in the incidence of common paediatric infectious diseases, that is, RSV, adenovirus, GAS, and influenza infection, before, during, and after the enforcement of NPIs to control the COVID-19 pandemic. RSV infection declined in the first year of NPIs and rebounded in the second year. The other three diseases were suppressed for the first 3 years after the NPIs were imposed, and then dramatically increased in the fourth season. RSV transmission is not attributed to schooling or human mobility, as children under 1 or 2 years of age are primarily affected, and transmission typically occurs at home. Given that adenovirus, GAS, and influenza are transmitted in nurseries and schools, the number of those cases declined during the NPIs implemented. After the NPIs lifted, we observed a surge of those three diseases.
RSV mostly affected children aged 1 year, while adenovirus primarily affected those aged 0–4 years. GAS and influenza mainly affected those aged 5–9 years. It is noteworthy that the relative increase was dominant among children aged 2 years for RSV, 5–9 years for adenovirus, and 10–14 years for GAS and influenza, which were one age category older than the most affected age groups. They are referred to as an immunity debt, which was described for RSV, adenovirus, and influenza infections so far [Reference Gu30, Reference Munro and House34–Reference Leung and Su36]. Our study results also suggest the existence of an immunity debt for GAS.
GAS was relatively insensitive to the NPIs, while invasive GAS was reported to increase secondarily due to the disruptions in viral transmission dynamics [Reference Lenglart37]. Sensitivity to the NPIs and intensity of immunity debt differed by disease, which may be attributed to the transmission intensity of pathogens and the immune response in hosts [Reference Munro and House34]. Our study findings will be valuable for informing society about the timing and magnitude of the disease burden increase after the implementation of NPIs in future pandemics.
Several studies have been conducted to assess epidemiological changes in paediatric infectious diseases using national surveillance data in Japan [Reference Ujiie24–Reference Hirae, Hoshina and Koga26, Reference Komori, Mori and Naito38, Reference Sawakami39]; however, this study is the first using ITS to quantify changes in each disease during and after the COVID-19 pandemic. The difference between the observed and the predicted number of cases reflects immunity debt more accurately than compared with the average number of historical cases. While we did not consider other statistical methods, such as SARIMA, for comparison, as other studies did [Reference Liu18, Reference Li19]. Additionally, we utilized electronic health records collected from the 23 primary-care clinics. This allowed us to evaluate the proportion of positivity of the four diseases among the total number of ARI cases, which supported the findings and made them rigorous.
National surveillance data and the positive proportion of infectious diseases in 23 clinics consistently demonstrated the same trend. The data from 23 clinics showed a good correlation with surveillance data, indicating that frontline clinicians could detect changes in infectious diseases earlier than the official surveillance system. The electronic health records stored in the standard format enabled us to analyse the large dataset. Digitalized clinical records could serve as an alternative monitoring tool for infectious diseases.
On the other hand, the difference between the sentinel surveillance sites and CAPS CLINICs caused discrepancies in the results of RSV infections. RSV infection in children older than 1 year was less likely to be diagnosed at primary-level clinics, as Japanese health insurance covers the cost of rapid diagnostic tests in this age group only when hospitalization is required. Additionally, severe RSV infection in infants cannot be treated at the primary clinic. Therefore, the positive proportion of RSV was overly underestimated in the CAPS CLINIC.
The surveillance data continue showing an irregular pattern of influenza and GAS cases, as well as various other paediatric infectious diseases, such as hand–foot–mouth disease, herpangina, and Mycoplasma pneumonia. The monitoring effort should be continued to measure the longer term effects of the COVID-19 pandemic and NPIs.
This study has limitations. We used case counts in our interrupted time series analysis. The case counts are sensitive to changes in surveillance intensity, testing policies, or reporting practices over time. During the COVID-19 pandemic, nasopharyngeal and throat swab collections were avoided in many clinics; therefore, surveillance during the pandemic was less sensitive. The patients refrained from outpatient visits during the pandemic; therefore, the number of cases has been underestimated during this period. Prediction intervals for the changes in incidence were wide, which might be due to the unstable incidence during the study period.
Rapid diagnostic tests are widely used in Japanese clinical practice to diagnose RSV, adenovirus, GAS, and influenza infections. The sensitivity and specificity are not as high as PCR, which is the current gold standard diagnostic method, and potential misclassifications might exist. However, the test was usually conducted based on the epidemiological link and clinical findings, and the diagnostic patterns of those four diseases were relatively uniform across Japan.
Viral interference occurs when multiple respiratory viruses infect the host concurrently or subsequently [Reference Piret and Boivin40]. It is well-known that viral interference was observed during the influenza A (H1N1) pdm09 virus pandemic in 2009–2011. Viral interactions between SARS-CoV-2 and influenza may be a potential reason for the nearly undetectable level of influenza incidence during the 2020–2023 seasons. We were unable to distinguish viral interference from immunity debt in this study.
Influenza cases were estimated to decline, and RSV cases were estimated to increase gradually over time. This increase and decrease trend may have occurred by chance during the period of data used, resulting in a slight overestimation or underestimation of the relative increase and decrease. Although we assumed that NPIs ended in March 2022, several restrictions continued until early 2023. However, the predicted number of counterfactual cases would not be affected by the time that NPIs were over.
Over 5000 sentinel surveillance sites were operational in Japan as of 2024, which was far more than in other high-income countries. Sentinel sites consisted of primary clinics and secondary or tertiary hospitals. The number of sentinel sites was determined by each prefecture in proportion to the population. Although the site selection process was not random and potential selection bias exists, the Japanese sentinel surveillance data were likely to represent the Japanese population.
Conclusion
This study quantified the changes in RSV, adenovirus, GAS, and influenza infections during and after the NPIs. The study suggests the existence of immunity debt for these infectious diseases after the implementation of NPIs with different timing and intensity.
Supplementary material
The supplementary material for this article can be found at http://doi.org/10.1017/S0950268826101587.
Data availability statement
The National Surveillance data that support the findings of this study are openly available at our institutional website at https://id-info.jihs.go.jp/surveillance/idwr/index.html. The Clinical data that support the findings of this study are available at NYS Medical, Inc. Restrictions apply to the availability of these data and data are only available with the permission of the designated personnel.
Author contribution
Conceptualization: N.K.; Data Curation: Na.K.; Formal Analysis: N.K., S.I.; Methodology: S.I., D.Y.; Supervision: T.T., M.S.; Writing – Original Draft Preparation: N.K.; Writing – Review and Editing: Na.K., S.I., M.O., T.K., T.T., M.S.
Competing interests
The authors declare none.
Funding statement
This research did not receive any specific grant from funding agencies in the public, commercial, or not-for-profit sectors.


 Open access