


INTRODUCTION
Although therapeutic advances coupled with social and economic changes have reduced the global burden of enteric disease, diarrhoea continues to be one of the major causes of morbidity and mortality worldwide, particularly in children aged <5 years [Reference Black, Morris and Bryce1–Reference Petri3]. The major aetiological enteric pathogens resulting in diarrhoea include examples of bacteria, protozoa and viruses.
Existing studies have shown that different groups of aetiological agents causing diarrhoea show distinct seasonal patterns [Reference Checkley4, Reference Kale, Fernandes and Nobre5]. Bacterially related diarrhoea tend to occur most in warmer and wetter months, when environmental conditions favour the reproduction of pathogens spread by the faecal–oral route [Reference Georges6–Reference Samal9]. In contrast, viral diarrhoea exhibit seasonal patterns similar to respiratory infections such as influenza, i.e. peaking in winter in temperate regions [Reference D'Souza, Hall and Becker10–Reference Guerrant12].
During the last decades of the 20th century, diarrhoeal mortality patterns in Mexico have shown a dramatic quantitative change – with a greater than 90% reduction in the number of child deaths due to diarrhoea between 1979 and 2001. Diarrhoea incidence patterns have also undergone substantial qualitative changes: shifting from a spring–summer peak of mortality, most likely of bacterial origin, to a less pronounced seasonal pattern clustered in the autumn–winter period and believed to be of viral origin [Reference Gutierrez13–Reference Villa15].
By considering coincident changes in social and economic development in Mexico, there is reason to believe that this transition of predominant pathological agents causing diarrhoea has followed the evolution from the lack of clean water and sanitation facilities to the overall improvement in living conditions. This transition period also coincided with the introduction of mass immunization against measles, the promotion of oral rehydration therapy, and the important introduction of measures specifically targeting prevention of cholera, such as acceleration of improvements to sanitary conditions, chlorination of water for human consumption, and an effective prohibition on irrigating fruit and vegetables with sewage water [Reference Gutierrez13]. Studies of morbidity data of more recent years (1996–2002) in children aged <1 year reveal a higher (62–68%) proportion of diarrhoea due to rotavirus episodes in the autumn–winter period in contrast to the small proportion (6–12%) in the spring–summer period [Reference Velazquez14]. This is in agreement with several other studies showing that rotavirus diarrhoea is more related to the cooler months [Reference Pinfold, Horan and Mara16].
Nevertheless, no attempts have yet been made to study the spatial patterns of diarrhoea mortality in these two epidemiological periods in Mexico. Existing efforts have focused on the identification of populations at risk based on annual mortality statistics [Reference Cifuentes17]. As with many diseases, detecting spatial and temporal patterns is critical to aiding the identification of putative causal mechanisms and thus developing efficient prevention and control strategies.
In this paper, we investigated the spatial trends associated with the dynamics of diarrhoea mortality in the 32 Mexican states, focusing on time periods before and after an epidemiological transition (around 1991). We also investigated the extent to which climatic factors may provide a mechanistic explanation for the observed mortality patterns.
METHODS
Epidemiological data
Mexican mortality data from 1979 to 2001 were provided by the Instituto Nacional de Estadística Geografía e Informática (INEGI; National Institute of Statistics, Geography, and Informatics) who compile data from death certificates according to the World Health Organization's International Classification of Diseases (ICD; http://www.who.int/classifications/icd).
Because diagnosis of aetiological agents is frequently unconfirmed, all cases of intestinal infectious disease were considered ‘diarrhoea’ for the present study: death certificates listing ICD-9 codes 001-009 for intestinal infectious diseases from 1979 to 1994 and ICD-10 codes A00-A09 for 1995–2001 were extracted for children aged <10 years.
The records were aggregated by month and administrative state (n=32). Monthly mortality rates of diarrhoea were calculated per 10 000 inhabitants aged <10 years based on age-stratified state-specific population estimates of the relevant period.
Climatic data
Monthly climatic data were obtained from worldwide interpolated meteorological stations [Reference Mitchell and Jones18]. These monthly climatic variables were extracted from the 0·5° pixels corresponding to the capitals (i.e. where most people live) of the Mexican states for the same years as the mortality dataset. The monthly climatic indicators considered were: number of wet days; precipitation; averages of daily mean, maximum, and minimum temperatures; and vapour pressure. Elevation was also available at the same resolution.
Time periods
The timing of decline in paediatric diarrhoea mortality rates varied across Mexico (Fig. 1 b), but was observed in most states by 1995. Visual inspection of the entire series shows that the intermediate period (1989–1994) was characterized by a transitional, ill-defined pattern between the summer and winter peaks (Fig. 1 a, b). We therefore excluded these years from the analyses to better characterize the differences between the two distinct epidemiological periods (i.e. 1979–1988 and 1995–2001).
(a) Monthly time-series of diarrhoea mortality rates per 10 000 Mexican children aged <10 years, 1979–2001. (b) State-specific rates, sorted by the latitude of their capitals, from north to south (y axis). Rates are indicated by grey shading, with darker shading corresponding to higher mortality rates.

National seasonality
To explore temporal differences in diarrhoea mortality patterns, we conducted a separate seasonality analysis for each time period, 1979–1988 and 1995–2001, summed for the whole country. Each time period was subjected to a seasonal decomposition using locally weighted polynomials (LOESS) [Reference Cleveland19]. This removed the decreasing trend from both time periods and produced a smoothed approximation of the regular seasonal oscillations between months by removing extreme observations (>6 times the standard deviation) (see Supplementary Fig. S1, online).
Annual and bi-annual Fourier harmonics were fitted to the seasonal component of the mortality data to generalize the seasonal pattern and reduce the dimensions since rather than require data points for each month the time-series could be approximated with the phase (timing) and amplitude (magnitude) of just two harmonics [Reference Rogers, Hay and Packer20].
Parameters describing the fitted Fourier series were swapped between the two time periods to test for significant differences. The phase and amplitude of the annual and bi-annual harmonics were each exchanged, one at a time, between the two Fourier series and the resultant profile compared to that which best fitted each time period using a Kolmogorov–Smirnov test.
Spatial patterns of diarrhoeal mortality
In the earlier epidemiological period (1979–1988) a well-defined geographical pattern of mortality was observed when the timing of peak mortality was plotted for each state. Therefore, for each state the mortality rate data from this earlier period was subjected to seasonal decomposition and Fourier approximations (using annual and bi-annual harmonics) fitted as described above.
We examined the role of different climatic factors using a general geographically weighted panel approach [Reference Baltagi21, Reference Elhorst22] as follows:

where M it is the diarrhoea mortality rate in state i at time t; X is a series of independent variables at state i and time t; α and β are the regression parameters (global mean and predictor coefficients, respectively); u i is an error term that captures the state-specific unobserved effects and e it represents all other unobserved effects (assumed to be normally distributed and independent). Panel regressions are routinely longitudinal data with repeated observations for different units [Reference Baltagi21], in this case treating states as the units, each with fixed effects each and a repeated measure of the mortality through time. The spatial extension to the panel regression takes into account the additional autocorrelation resulting from spatial proximity.
A high degree of spatial correlation was found in both mortality rates and the monthly climatic data, such that the error terms are not likely to be independent, but spatially correlated. This was incorporated into the model through a weights matrix W ij, where the impact of an observation in location i on the observation in location j is assumed to be a continuous function of the distance between these locations.
For each climatic variable, the timing of the minimum and maximum values were calculated and their correlation to the timing of peak diarrhoeal mortality estimated (Supplementary Table S1, online). Of the climatic variables available, four measured different aspects of temperature (daily mean, monthly minimum and maximum and the average daily range) and were highly correlated to one another. Of these four, the daily mean temperature showed the highest correlation to diarrhoeal mortality. Similarly, the remaining three variables are aspects of precipitation (precipitation, number of wet days, and vapour pressure). Of these precipitation variables, again highly correlated to one another, the timing of the minimum of log precipitation had the greatest correlation to mortality and least correlation to mean temperature. Based on this, the panel regression was constructed using the daily mean temperature and the log mean monthly precipitation. Quadratic terms for the immediate (i.e. t 0) were tested for both temperature and precipitation, as was an interaction between the two, none of which proved significant (Supplementary Table S2, online).
Comparison of the timing of peak values for diarrhoeal mortality rate, daily mean temperature and minimum precipitation suggested a lag between climatic variables and mortality. In order to formally analyse the monthly lag between mortality and temperature we assessed model performance with different temporal lags (inclusion of 1- to 11-month lags).
Analytical software
Analyses, graphics, and statistical tests were conducted using Excel (Microsoft Corp., USA), and customized programs developed in Matlab (The MathWorks Inc., USA). Spatial panel regressions were performed with the Spatial Econometrics toolbox [Reference LeSage and Pace23].
RESULTS
Time periods
The times-series of diarrhoeal mortality in children aged <10 years for the whole of Mexico shows a substantial decrease in mortality between 1979 and 2001 (Fig. 1 a). Although the profile of mortality changed each year there was a tendency in the earlier period of the time-series for a single annual peak occurring in the summer months. By the end of the time-series this was no longer the case and a distinctly bi-modal pattern is visible, with the larger of the two peaks occurring in the winter months.
The rate of diarrhoeal mortality was not uniformly distributed across the Mexican states and the time-course of the decrease in mortality was similarly heterogeneous (Fig. 1 b).
National seasonality
Comparison of a smoothed and generalized annual pattern between the early (1979–1988) and later (1995–2001) periods of the national time-series highlighted the significant shift in the timing of mortality (Fig. 2). The early period was characterized by a single annual peak occurring at the end of July and remained high in the late autumn months. The later period was distinctly bi-modal, largely because the amplitude of the summer peak had decreased relative to the rest of the year and had shifted to late January, but the smaller summer peak still coincided with the period of high mortality found in the 1980s. This is illustrated by the misalignment of the annual and bi-annual harmonics in the later period combined with the relative dominance of the bi-annual amplitude, whereas in the earlier period the annual harmonic was substantially larger than the bi-annual harmonic and the summer peaks of the two harmonics broadly coincided, hence magnifying the single summer peak (Table 1).
Temporally stationary seasonal patterns of the 1979–1988 (–––) and 1995–2001 (- - -) periods. Circles indicate the maxima of the two seasonal patterns, with a single peak in the earlier period, and two (approximately equal magnitude) maxima in the later period.

Summary statistics of the 1979–1988 and 1995–2001 periods, showing the amplitude and phase of the annual and biannual Fourier harmonics
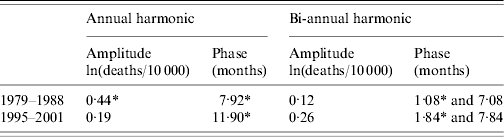
* Significantly different between periods, P<0·05 (Kolmogorov–Smirnov test).
Spatial patterns
The breakdown of the mortality time-series by state (Fig. 1b) hinted at a spatial pattern in the earlier time period, but not the latter (Fig. 3). The earliest peaks (darker shading) occurred around the Federal District (Distrito Federal) and later in states furthest away. This was more clearly illustrated using the generalized annual profiles for each state (Fourier harmonics of the seasonal profile), plotting the timing of the peak mortality against the distance from the Federal District (Fig. 4).
Spatial pattern of diarrhoeal mortality across Mexican states. Shading indicates the rank of the peak timing, where rank refers to the chronological order in which the peak occurs in the states. The Federal District is indicated by a black outline. (a) 1979–1988; (b) 1995–2001.

Plot of the timing of the peak diarrhoeal mortality per state against the distance between the capital of each state and the Federal District. Difference in shading of symbols indicates the rank of peak mortality timing (1979–1988).

The residuals of a panel regression that did not account for spatial autocorrelation achieved a Moran's I index of global autocorrelation of 0·253 (P<0·001), where 1 is perfect correlation and 0 indicates a random spatial pattern. Incorporating the spatial weights reduced the spatial correlate to 0·02 (P=0·168), justifying their inclusion and added complexity.
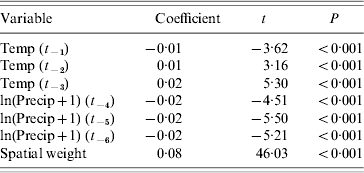
Spatially weighted panel regressions were performed using 1- to 11-month lags on both daily mean temperature and precipitation against the monthly mortality data (1979–1988). Lags that were not significant at P<0·05 were excluded. Temperature lags between 0 and 3 months were significant, as were precipitation lags of 1–6 and 8 months. Assessment of Akaike's Information Criteria (AIC) [Reference Akaike24], controlling for the number of variables, was used to reduce the number of lagged months in the final spatial panel regression to temperature at t −1 to t −3 and precipitation at t −4 to t −6. These lags corresponded to the intercepts of a linear regression between the timing of peak mortality with the maximum temperature (92 days=3 months) and minimum precipitation (160 days=5 months) (Fig. 5).
Correlation of peak diarrhoeal mortality (1979–1988) with maximum temperature and minimum precipitation.

The resulting spatial panel model achieved an r 2 of 0·782 (Table 2). In addition to the highly significant climatic variables, the spatial weighting was also highly significant. The spatial weight alone achieved an r 2 of 0·447, such that the remaining variance explained by the climatic variables could be calculated as (0·782–0·447)/(1–0·447)=0·606.
Spatial panel model using mean temperature and precipitation with 0- to 5-month lags to predict diarrhoeal mortality in Mexican states (1979–1988) (r2=0·782)
The observed spatial pattern of the timing of diarrhoeal mortality (Fig. 3) can be related to temperature and precipitation. When ranked in order of the timing of peak mortality, there is a distinct pattern across the Mexican states with mortality peaking around the Federal District (black outline) and peaking later the further away states are (Figs 4, 6). Temperature and precipitation follow a similar spatial pattern to that of diarrhoeal mortality – with the earliest peak around the Federal District and later peaks further away (Supplementary Fig. S4, online). This result may be in part related to the influence of elevation on climatic patterns driven by the weather systems from the Pacific and Gulf of Mexico.
Seasonal profiles of three states: (a) Baja California Norte, (b) Campeche, (c) Distrito Federal. Graphs indicate the seasonal profiles of temperature (……), precipitation (– · –) and mortality (–––), with symbols showing the maximum values of temperature and mortality and minimum precipitation. The map shows the geographical location and ranking of the timing of peak mortality for each state (1979–1988).

DISCUSSION
Mexico has successfully and dramatically reduced mortality from diarrhoeal disease. This reduction has resulted in a breakdown of historic patterns, in both time and space, of diarrhoeal mortality that strongly suggests an association with climatic drivers. When bacterial causes of mortality dominated in Mexico in the 1980s, we found the timing of mortality across Mexico was strongly correlated with precipitation and temperature regimens. As mortality from bacterial diarrhoea has diminished, the shifting temporal and spatial patterns of diarrhoeal mortality highlight the importance of understanding the different aetiological agents with varying responses to climatic drivers and control measures to forecast how the burden of disease is likely to change both through intervention programmes and variable weather patterns.
The ‘spring–summer season’ of diarrhoeal mortality proves a complex phenomenon in light of the diverse Mexican geography and climate. Specifically, we detected in the period from 1979 to 1988 a well-defined annual temporal gradient of summer diarrhoeal mortality that peaked earliest around Mexico City in the Federal District and the central-east and southeastern states, and peaked later towards the northwestern states at the end of the autumn season. By investigating the putative causes of this pattern, we suggest that this spreading wave reflects the onset of the best climatic conditions for bacterial diarrhoea in each region. Due to the particularities of Mexican geography and climate, these conditions fade earlier in the central region of the country (where temperature peaks in spring), leading to a wave-like pattern of when the peak occurrence is observed.
A similar spatio-temporal pattern was found in precipitation data, clearest in the timing of the minimum values that preceded the peak mortality by about 5 months. Average daily temperatures proved a weaker predictor of diarrhoeal mortality, although they tended to peak some 3 months earlier. These two climatic variables were a reliable predictor of the seasonal diarrhoeal mortality rate. The peaks and troughs of the climate data show a similar spatial pattern to the diarrhoeal mortality data with earliest peaks in and around the Federal District and later in the year towards the northwest (Supplementary Fig. S4, online). The spatial patterns of precipitation and temperature, and we hypothesize that consequently the pattern of diarrhoeal mortality, are correlated to the elevation of the state capitals, which together with the influence of the Pacific and Gulf of Mexico, is likely to strongly shape Mexican climatic patterns.
Few studies have analysed geographical differences in diarrhoea seasonality, and those few have focused specifically on diarrhoea of viral origin [Reference Suzuki25, Reference Turcios26], which occurs mainly in winter in temperate climates [Reference Turcios26–Reference Torok28]. Consequently, spatial patterns of diarrhoea mortality are poorly understood in most regions of the world [Reference Kelly-Hope29, Reference Kelly-Hope30]. Analysis of the geographical patterns of diarrhoea mortality rates in Mexico adds valuable information to previous spatial descriptions [Reference Cifuentes17] mainly for the hitherto unreported geographical structure found in summer diarrhoea, and also to the observed temporal changes in disease dynamics that have occurred in the recent decades in this country [Reference Gutierrez13, Reference Velazquez14].
Nevertheless, our study is subject to some limitations. First, all cases of deaths due to intestinal infectious disease were considered in our study as ‘diarrhoea’ (as the aetiological agent of diarrhoea is frequently not laboratory confirmed). This prevented us from analysing patterns related to specific aetiological agents (or groups of agents). Second – and common to this sort of retrospective study – the relation with climate remains in the realm of exploratory analysis and can only be suggestive of causality (needing confirmation with future studies in other regions, or prospective studies that can control/collect contemporary variables and therefore more formally test the hypothesis [Reference James and McCulloch31]).
The existence of spatial dependence in disease patterns can be examined in more detail to better understand the impact of spatial effects on causal relationships between driving factors and disease patterns. Where sampling sufficiency allows, the use of data with higher spatial resolution could provide important knowledge of the spatio-temporal patterns and dynamics of diarrhoea disease on finer spatial scales and allow valuable comparison with patterns based on more aggregated spatial units such as states. Such efforts will further strengthen the development of forecasting systems for diarrhoea [Reference Medina32] and help to understand the impact of shifts in human ecology and behaviour in different regions on disease patterns and spread [Reference Levine and Levine33].
NOTE
Supplementary material accompanies this paper on the Journal's website (http://journals.cambridge.org/hyg).
ACKNOWLEDGEMENTS
We thank Dr Jaime Sepúlveda and Dr Rafael Solano for kindly providing the mortality data and Dr Laura J. Ninger and Christine Jessup or their useful comments on the manuscript. This study was funded by the Bill and Melinda Gates Foundation and the Fogarty International Center of the National Institutes of Health as part of the Mal-ED network.
DECLARATION OF INTEREST
None.



