

1 INTRODUCTION
The first gamma-ray all-sky observations, obtained decades ago with the satellites COS-B (Hermsen Reference Hermsen1983) and Compton (Hartman et al. Reference Hartman1999), disclosed numerous sources with not known counterpart at other wavelengths, hereafter called unidentified gamma-ray sources or UNIDS. Since then, a large number of multifrequency observations have been implemented to clarify the nature of those sources (Massaro et al. Reference Massaro, D’Abrusco, Paggi, Masetti, Giroletti, Tosti, Smith and Funk2013; Paredes et al. Reference Paredes2008). Nowadays, though telescope capabilities have been largely expanded, like the source localisation, there still remain hundreds of gamma-ray sources to be identified. For instance, the third Fermi LAT catalogue (Acero et al. Reference Acero2015, around 3 000 sources, hereafter 3FGL) listed one-third of the sources with unknown counterpart at other energy range.
The identified gamma-ray sources are mostly Active Galactic Nuclei, pulsars, SNRs, and High-Mass X-ray Binaries. Many of these objects emit at radio waves, especially at low frequencies, where synchrotron radiation is stronger. This turns the radio band the most preferred to search for UNIDS counterparts.
The information collected at radio frequencies often serves to predict the behaviour of the systems in the high-energy (HE) domain, and the predictions can be compared with the observations. The same population of particles (i.e. electrons) is involved at the same time with magnetic fields, producing low energy synchrotron photons, as well as with photon fields, producing HE photons through Inverse-Compton (IC) scattering. In this way, the radio data can be used to impose severe constraints to the HE spectrum. The results will thus help to develop more complex and accurate models, leading to a fruitful iteration between theory and observations.
Some early-type (OB) stars and their descendants Wolf–Rayet stars have been indicated as putative HE emitters (Romero, Benaglia, & Torres Reference Romero, Benaglia and Torres1999). If two (or more) of those stars form a stellar system, their strong winds can interact with magnetic fields and relativistic particles, in a wind-collision region, as was described by Eichler & Usov (Reference Eichler and Usov1993). Candidates, scenarios, and conditions under which HE can be produced are given in Dougherty & Williams (Reference Dougherty and Williams2000), Benaglia et al. (Reference Benaglia, Romero, Stevens and Torres2001), Benaglia & Romero (Reference Benaglia and Romero2003), Reimer, Pohl, & Reimer (Reference Reimer, Pohl and Reimer2006), Pittard et al. (Reference Pittard, Dougherty, Coker, O’Connor and Bolingbroke2006) and Reimer & Reimer (Reference Reimer and Reimer2009). Lately, gamma-ray AGILE satellite observations allowed Tavani et al. (Reference Tavani2009), for the first time, to present evidence of HE emission from the colliding-wind binary (CWB) Eta Car, an LBV+O? system. Additional confirming evidence using Fermi LAT data (Abdo et al. Reference Abdo2010) was soon published.
After compiling radio, X-ray and gamma-ray data for OB and WR stars, De Becker & Raucq (Reference De Becker and Raucq2013) presented a very comprehensive catalogue of particle acceleration colliding wind binaries, or PACWBs, with more than 40 candidates, and discussed the main problems related to this subject. Werner et al. (Reference Werner, Reimer, Reimer and Egberts2013) modelled possible HE emission produced by WR 11 and tagged it as one of the best CWB candidates to be detected with the Fermi LAT. The latest Fermi LAT release reunited data from 2008 to 2015. Reitberger et al. (Reference Reitberger, Reimer, Reimer and Takahashi2015) derived from it an increase of the flux coming from Eta Car as the system approached periastron. Pshirkov (Reference Pshirkov2016) also analysed the 7-yr Fermi LAT data, and reported emission excess coincident with the field of the nearest WR+OB system, WR 11. He ascribed the emission to the stellar system. However, the Fermi LAT excess extends over a square degree—the maximum itself covers about 102 arcmin of the sky—encompassing hundreds of sources. And there is a significant volume of radio observations that targeted WR 11, that cover the central region of the Fermi source. I have carried out the reduction and analysis of high-resolution archive radio data of the WR 11 field, in looking for additional possible counterparts to the Fermi emission. The results are presented here.
Section 2 contains the information of the system WR 11 that is relevant to this study. Section 3 describes the archive data reduction and the stellar field in the light of the radio continuum observations. Correlation results are presented in Section 4 and discussed in Section 5. In Section 6, the main conclusions are highlighted.
2 THE STELLAR SYSTEM WR 11
The source WR 11, also known as Gamma2 Velorum or γ Vel, is a double-lined spectroscopic binary system, and the nearest CWB, composed by a WC8 and a O7.5 II-III stars. It is located at RA, Dec (J2000) = 8:09:31.95, − 47:20:11.71, at a distance of ~ 370 pc (Millour et al. Reference Millour2007), and has a period of 78.5 d (North et al. Reference North, Tuthill, Tango and Davis2007). The object was observed with the Australia Telescope Compact ArrayFootnote 1 (ATCA) (Leitherer, Chapman, & Koribalski Reference Leitherer, Chapman and Koribalski1997; Chapman et al. Reference Chapman, Leitherer, Koribalski, Bouter and Storey1999) at four bands, from 1.4 to 8.64 GHz. The measured fluxes allowed to derive a spectral index α decreasing from 1.2 to 0.3 with growing frequency. (Throughout the text, we adopted the convention S∝να, where S is the radio flux density at the frequency ν.) Based on that, Chapman et al. (Reference Chapman, Leitherer, Koribalski, Bouter and Storey1999) stated that the emission from WR 11 could have some non-thermal (NT) contribution. The system is listed in the PACWBs catalogue, along with detailed information. At X-rays, the source is detected and the emission is explained by a hot collisional plasma, the stellar winds; the low energy photons are absorbed (Schild et al. Reference Schild2004).
Optical spectro-polarimetric data of WR 11 with the ESPaDOnS Canada–France–Hawaii Telescope provided no definite detection of the magnetic field in the winds of WR 11 (de la Chevrotière et al. Reference de la Chevrotière, St-Louis and Moffat2014), but a field strength upper limit of B max ~ 500 G. Data collected after the first 2 yr by Fermi LAT were analysed (Werner et al. Reference Werner, Reimer, Reimer and Egberts2013), with negative results on a WR 11 detection. The distance from WR 11 to the closest known 3FGL source (J0800.6 − 4806, of ~ 0.3° semimajor axis) is 1.7° in the plane of the sky. Pshirkov (Reference Pshirkov2016) compiled Fermi LAT data taken from 2008 August 4 to 2015 July 1. The author reduced them with the same latest routines as the third Fermi catalogue (Acero et al. Reference Acero2015) and galaxy emission models (see also Werner et al. Reference Werner, Reimer, Reimer and Egberts2013, for details on Fermi LAT data reduction). No point sources were discovered, but a 6.1σ excess of gamma-ray emission was detected. The excess covered an area of 1 deg2, where the binary system WR 11 is close to the centre. The location of such excess is given in TS (test statistics) values, similar to probability contours. The maximum contour of 37 TS (=6.1σ) extends in a circle of 3 arcmin diameter, and encompasses WR 11 (see Figure 3 of Pshirkov Reference Pshirkov2016).
A search of the Simbad database in a 15 arcmin radius circle centred at WR 11 resulted in ~ 470 objects, including Young Stellar Objects and protostellar candidates (~ 200), stars (~ 160), and X-ray sources (~ 60). WR 11 belongs to the Vela OB2 association that gathers a hundred early-type candidate members (de Zeeuw et al. Reference de Zeeuw, Hogerwerf, de Bruijne, Brown and Blaauw1999). Pozzo et al. (Reference Pozzo, Jeffries, Naylor, Totten, Harmer and Kenyon2000) identified an association of low-mass pre-main sequence stars surrounding WR 11, showing strong X-ray emission. Many of the stars are assembled in the Gamma Vel cluster (Jeffries et al. Reference Jeffries2014). A Spitzer survey for circumstellar material around the low-mass association members reported by Hernández et al. (Reference Hernández, Hartmann, Calvet, Jeffries, Gutermuth, Muzerolle and Stauffer2008) revealed a low disc frequency.
3 THE FIELD OF WR 11 AT RADIO CONTINUUM
I searched the Australia Telescope Online Archive (ATOA, www.atnf.csiro.au/atoa) for data at the lowest frequency bands, L (1.4 GHz) and S (2.5 GHz), where NT (synchrotron) emission should be strongerFootnote 2 . The field of WR 11 was observed from 1999 to 2001, at various array configurations including 6*, 375, 1.5*, 750*, and EW352 (Project C787), often during LST ranges of a few hours. Raw data taken along 15 different days from June 12 to 2001 December 12 provided enough sensitivity and resolution to detect WR 11 and were reduced for the present study. The configuration set comprised baselines between 30 and 6 000 m; the sizes of the largest well-imaged structures were 8 and 13 arcmin at 2.5 and 1.4 GHzFootnote 3 . The observing bands, of 128 MHz bandwidths, were centred at 1.384 MHz and 2.496 MHz. The FoVs were 33 and 20 arcmin, respectively. The total time on source was ~ 12 h at each band. The source 1934 − 638 served as flux calibrator and the source 0823 − 500 was monitored as phase calibratorFootnote 4 .
The miriad package was used for data reduction, which was performed in the standard way. The best images were obtained with robust weighting, and a rms near the theoretical one at each band was attained. At the image centre, the resulting rms remained below 0.1 mJy beam−1 at each band. The synthesised beams configured at highest resolution were 11.8 arcsec × 2.7 arcsec, PA = 45.9° (S band) and 22.6 arcsec × 5.8 arcsec, PA = 43.6° (L band). The beams are very elongated because the LST ranges at most of the configurations were short (2 to 3 h), since the primary goal of project C787 was not to give the best image of the field, but to focus on WR 11. The highest-resolution images were convolved with circular beams of 24 arcsec × 24 arcsec (L band) and 12 arcsec × 12 arcsec (S band) (Figure 1).
Radio continuum emission at 1.384 GHz (left) and 2.496 GHz (right), central regions; ATOA data (project C787). The rms of each map is ⩽ 0.2 mJy beam−1. The synthesised beams are 24 arcsec × 24 arcsec and 12 arcsec × 12 arcsec. The brightest sources are marked with crosses and named S1 to S8 (see also Table 1). The dashed circles in the left image represent the Test Statistics (TS) at 20 (outer) and 25 (inner) of the Fermi LAT excess (see Pshirkov Reference Pshirkov2016: Figure 2 and Werner et al. Reference Werner, Reimer, Reimer and Egberts2013 for details).

The area to analyse was constrained by and thus circumscribed to the extension of the radio image at the larger frequency (given by its primary beam), but it agreed also with the central region of the Fermi LAT excess reported by Pshirkov (Reference Pshirkov2016); see Figure 1, left.
The ATCA data revealed no extended emission. The L-band image showed many more sources than the S-band one, at the same sky area. The search for HE counterparts was focussed on the study of the stronger sources at L band. We selected the objects detected with an integrated flux of 10 mJy or above. These values are of the order of those usually quoted for radio-gamma SED fits (e.g. del Valle & Romero Reference Valle and Romero2012). Eight sources fulfilled the mentioned condition. They are listed in Table 1, and labelled S1 to S8, in order of increasing right ascension.
Radio fluxes of the main sources in the field of WR 11.
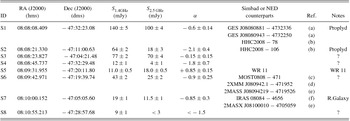
Strongest sources at 1.4 GHz. ID: name given here, coordinates, fluxes measured at L and S bands (see Section 3), corresponding spectral index α (S ν∝να), objects from web databases overlapping the sources S1 to S8 together with their references, and most possible counterpart according to this work. (a): Jeffries et al. (Reference Jeffries2014), (b): Hernández et al. (Reference Hernández, Hartmann, Calvet, Jeffries, Gutermuth, Muzerolle and Stauffer2008), (c) Jones (Reference Jones1985), (d): Watson et al. (Reference Watson2009), (e): Skrutskie et al. (Reference Skrutskie2006), (f): Helou & Walker (Reference Helou and Walker1988). Deconvolved major and minor axis from Gaussian fits are 7.1 arcsrc × 4.7 arcsec for S3, 4.1 arcsec × 1.7 arcsec for S5, and 7.3 arcsec × 2.5 arcsec for S7.
S3, S5 and S7 are discrete sources at both bandsFootnote 5 . S1, S4 and S6, two-peaked, appeared as double sources. S8 is slightly elongated to the east, and S2 presents some substructure.
The integrated fluxes were derived either by fitting Gaussians to each discrete source or by measuring the flux above the 3σ contour (1σ = 1 rms), in the higher resolution images. In the latter case, the errors quoted in the flux densities correspond to the difference between the flux above 3σ and that above 2σ.
Spectral indices were computed from the integrated flux at 1.4 GHz and 2.5 GHz for each source, as α = log(S 2/S 1)/log(ν2/ν1), and are listed in Table 1.
The system WR 11 had been also observed in 1998 February (C599) at S and L bands, at configuration 6A, 128-MHz bandwidths and same calibrators as for C787 data. I reduced the raw data corresponding to 15 h on source taken during day 27, to obtain images with the highest angular resolution possible with the ATCA and as an additional check for flux measurements and spectral index values. The synthesised beams, with robust weighting, resulted in 10 arcsec × 7 arcsec (L band) and 5 arcsec × 3 arcsec (S band), and the rms equal to 0.06 mJy beam−1.
The WR 11 field characterisation was completed with the survey of the sources above three times the larger noise at the L-band image (σ = 0.2 mJy beam−1). Table 2 lists all the sources—discrete and point-like—discovered in that way. Their fluxes were obtained by Gaussian fitting and the Simbad database was searched for possible counterpart identifications (see Table 2).
Sources detected at the 1384-MHz image central region.
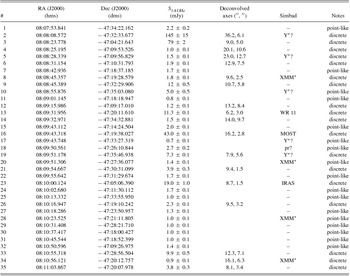
Y*?: young stellar object candidate; XMM*: 2XMM star; MOST: MOST source; pr?: pre-main sequence star candidate, IRAS: IRAS source. Source #3 is S3, source #13 is S5 and source #23 is S7, see Table 1.
4 RESULTS
Helped with Simbad and NED databases, we carried out a search of objects in 4-arcmin radius circles around sources S1 to S8, to seek information about their nature. Such search radius granted us to collect sources from web lists at the different spectral ranges, and not only the recent most accurate ones; in the case of an extended source-counterpart, we sought its extension in the literature. Figures 2 and 3 display the individual images of S1 to S8 at maximum angular resolution (data from project C599) at one frequency; the objects found at the web databases in each sub-field are also represented.
Zoom on sources S1 to S4 (images from C599 data at 1.4 GHz). Coordinates: RA, Dec (J2000). Crosses: YSO or protostellar candidates; small boxes: X-ray sources. Black circles: stars. (a): S1; contours − 3, 3, 10, 30, 90, and 200 in units of σ = 0.2 mJy beam−1. (b): S2; contours − 3, 3, 10, 20, 35, and 50 in units of σ = 0.1 mJy beam−1. (c): S3; contours − 3, 3, 10, 40, 100, 200, and 300 in units of σ = 0.15 mJy beam−1. (d): S4; contours − 3, 3, 10, 20, 30, and 50 in units of σ = 0.09 mJy beam−1.

Same as Figure 2 on sources S5 to S8 (images from C599 data at 1.4 GHz). (e): S5; contours − 3, 3, 10, 25, 55, and 90 in units of σ = 0.09 mJy beam−1. The circle represents the centre of the gamma Vel cluster. (f): S6; contours − 3, 3, 10, 30, 80, 200, and 280 in units of σ = 0.09 mJy beam−1. (g): S7; contours − 3, 3, 10, 40, 80, and 130 in units of σ = 0.09 mJy beam−1. The ellipse marks the IRAS source and the box represents the radio galaxy, see Table 1. (h): S8; contours − 3, 3, 10, 20, 30, and 43 in units of σ = 0.09 mJy beam−1.

The source S1 appears as double at both observing bands. Its spectral index is negative (− 0.6 ± 0.14). Hernández et al. (Reference Hernández, Hartmann, Calvet, Jeffries, Gutermuth, Muzerolle and Stauffer2008) listed three Young Stellar Objects superposed to S1, and named them as #74 (southern one), #78 (central one), and #81 (northern one), see Table 1 and Figure 2. According to IR (Spitzer) colours, the objects 74 and 81 are characterised as diskless; and the central object, #78, corresponds to a proplyd: an evolved disk of a low-mass star (K5 or later). The linear extension of S1, if member of the gamma Vel cluster at 370 pc, is ~ 20 000 AU. The shape of S1 agrees with a central object and two outflows, and the size is alike the proplyds with negative spectral index detected by Mücke et al. (Reference Mücke, Koribalski, Moffat, Corcoran and Stevens2002), supporting the association of #78 (hereafter HHC2008 − 78) with S1.
The source S2 shows three maxima at both frequencies, and an average spectral index α of − 2.1 ± 0.4. The size of S2, at 370 pc, is 30 000 AU. The object #106 from Hernández et al. (Reference Hernández, Hartmann, Calvet, Jeffries, Gutermuth, Muzerolle and Stauffer2008), hereafter HHC2008 − 106, superposed to S2, is associated with a proplyd of a star with photometric colours between K5 and M0 and identified as an optically thick disk.
The source S3 has no counterpart at the consulted databases and a negative spectral index, close to 0.
The source S4 presents a negative spectral index (− 1.8 ± 0.7) and appears as double, with no counterpart in the literature.
The system WR 11 is located at the centre of S5. The Gamma Vel cluster, formed by low mass stars and protostars (Jeffries et al. Reference Jeffries2014), extends around S5. The stars GES J08092860-4720178 and gamma1 Vel are nearby but detached from S5. The spectral index of this source is + 0.85 ± 0.15, as expected from thermal stellar wind(s). The radio source was detected in the AT20G survey (www.atnf.csiro.au/research/AT20G/) at 5, 8, and 19.9 GHz, with fluxes of 27 ± 2, 50 ± 3, and 86 ± 4 mJy. The corresponding spectral indices are 1.3 (between 5 and 8 GHz), and 0.6 (between 8 and 19.9 GHz). Jones (Reference Jones1985) observed the system WR 11 with MOST (band centred at 843 MHz) and measured a flux of 8.2 ± 1.0 mJy. The spectral index between 843 MHz and 1.4 GHz is 0.6 ± 0.3.
The source S6 is a double, and 2 arcmin away from WR 11. Its spectral index is negative (− 0.9 ± 0.25) and three objects are superposed to it. One is a MOST discrete source, MOST0808 − 471, with a flux of 69 ± 2 mJy (Jones Reference Jones1985). The other two, catalogued as an X-ray and an IR sources have the same coordinates, and thus could be the same object. Hernández et al. (Reference Hernández, Hartmann, Calvet, Jeffries, Gutermuth, Muzerolle and Stauffer2008) classify the IR source as a diskless YSO (#158). The spectral index of S6 between 843 MHz and 1.4 GHz is − 0.95 ± 0.15.
The source S7 correlates with the source IRAS 080484 − 4656, and the double galaxy 2MASX J08100010 − 4705059, 0.17 × 0.17 arcmin2 in size (Skrutskie et al. Reference Skrutskie2006, 2MASS). S7 shows a negative spectral index (− 0.9 ± 0.3).
Source S8 has no counterparts neither in NED nor in the Simbad databases. Its spectral index is less than − 1.5.
5 DISCUSSION
The search for counterparts of the radio sources detected in this work resulted in possible associations of S1 and S2 with YSO proplyds, S5 with the system WR 11, and S7 with a double galaxy. S6, at 2 arcmin from WR 11, is a double source with NT radiation. S4 is alike but weaker and at ~ 16 arcmin from WR 11. All detected radio sources but S5 show negative spectral indices.
The simplest hypothesis is that a single source is responsible of the excess emission detected with Fermi LAT data. Under such assumption, the two possible scenarios to analyse are whether WR 11, or another source in the field, are the radio counterpart of the Fermi source.
5.1. Sources other than WR 11 as the Fermi LAT counterparts
The positional coincidence between the source S1 and the object HHC2008 − 78, and the fact that other proplyds have been detected as radio sources at low frequencies (Masqué, Dzib, & Rodríguez Reference Masqué, Dzib and Rodríguez2014, and references therein) favours the identification of S1 with a proplyd. The same can be said of S2 and HHC2008 − 106. Proplyds were detected at more than one frequency, and some of them show a spectral index different from thermal (e.g. Mücke et al. Reference Mücke, Koribalski, Moffat, Corcoran and Stevens2002). However, none has been identified with (Fermi) gamma-ray sources (Acero et al. Reference Acero2015; Armitage Reference Armitage2015).
The 2MASS catalogue of extended sources (XSC in Skrutskie et al. Reference Skrutskie2006) suggests that 2MASX J08100010 − 4705059 is a double-lobed galaxy, based on the emission at J, K, and H s bands. The object would also be detected as the source IRAS 08084 − 4656. They are positionally coincident with the radio source S7. There are many Fermi LAT sources identified with radio galaxies, with gamma-ray fluxes of the order of the one detected by Pshirkov (Reference Pshirkov2016). We note that while the gamma ray fluxes have the same magnitude, the radio flux densities of this source is much lower than those of the Fermi confirmed radio galaxy associations. Unfortunately, since S7 is a discrete source, it is not possible to derive constraints from the radio data presented here.
The source S6 is double, extended along ~ 45 arcsec. If it is a galactic object (for instance, a microquasar), it should be detected as a stellar source too. The shape and the spectral index are consistent with those of a radio galaxy. Such object, for instance if 30-kpc long, will be at a distance of 100 Mpc, like other typical FRI or FRII galaxies. The Fermi LAT energy flux of 1.8 ± 0.6 × 10⁹ erg cm−2 s−1 quoted by Pshirkov (Reference Pshirkov2016) implies, at 100 Mpc, a luminosity of ~ 1042 erg s−1.
A radio emission spectral index of α = −0.9 yields an electron energy distribution power law of index p = 1 − 2α = 2.8, and thus a photon spectral index Γ ~ (p + 1)/2 = 1.8 (Vila & Aharonian Reference Vila, Aharonian, Romero and Benaglia2009). The flux measured here corresponds to the extended emission. For most gamma-ray radio galaxies, the major contribution to the gamma-ray emission comes from their inner jets (luminosities and gamma spectral indices of FRI and II found from Fermi LAT data are given in Grandi Reference Grandi2012, her Figure 1). S6 could be a radio galaxy, that radiates the flux detected by Fermi LAT. And S6 is, as WR 11, inside the maximum probability contour of the Fermi LAT source position.
5.2. WR 11 as the Fermi LAT counterpart
The detection of a MOST source (Jones Reference Jones1985) at the position of WR 11 allows to derive an average spectral index of + 0.6 from 0.843 to 1.4 GHz, and similar values up to 20 GHz. That NT emission is only present below 843 MHz seems unlikely (Reitberger et al. Reference Reitberger, Kissmann, Reimer and Reimer2014, Reference Reitberger, Reimer, Reimer and Takahashi2015). However, absence of NT radio emission is not an argument to reject the hypothesis of a potential association between WR 11 and the Fermi LAT source. A very low magnetic field or too short energy-loss timescales for electrons would inhibit synchrotron emission to be detected. This emission could be affected by a strong free–free absorption from a dense circumstellar matter, a small orbit size and/or a complex geometry of the system, too.
The star Eta Carinae (HD 93308) shares some features with WR 11. The wind kinetic powers are of the same order (2.8 and 1.6 × 1037 erg s−1, respectively, De Becker & Raucq Reference De Becker and Raucq2013, and references therein). The former is a LVB star with a massive unseen companion (Damineli et al. Reference Damineli2008), thus considered a CWB. Its radio emission at high-angular resolution was measured since the first times of the ATCA. Duncan & White (Reference Duncan and White2003) (see also White et al. Reference White, Duncan, Chapman, Koribalski, Humphreys and Stanek2005) pictured the radio source at 3-cm wavelength as variable between two states: one up to 4 arcmin in extent, and lower flux (~ 1 mJy) at the apastron, and another of a discrete source (extension less than 1 arcsec) and stronger (2 to 3 mJy) near periastron. The variability correlates with the binary period. The authors interpreted that the orbit of the companion is within an extended and dense medium that is being released by, and largely circumvents, the LBV. There is no signature that the variability is due to NT radio radiation.
Since Eta Car displays gamma-ray emission (Tavani et al. Reference Tavani2009; Abdo et al. Reference Abdo2010) and NT X-ray emission (Sekiguchi et al. Reference Sekiguchi, Tsujimoto, Kitamoto, Ishida, Hamaguchi, Mori and Tsuboi2009), it was included in the PACWBs catalogue (De Becker & Raucq Reference De Becker and Raucq2013). Very recently, Ohm et al. (Reference Ohm, Zabalza, Hinton and Parkin2015) presented a time-dependent model of the HE emission in Eta Car. The model achieved a good agreement with the stellar lightcurve. They found that the measured spectrum can result from accelerated protons that interact with the dense LBV wind: no emission coming from primary electrons is further needed. The gamma-ray detectability with current instruments in Ohm et al. model depends strongly on the stellar mass loss rates.
WR 11 is the second CWB with no conclusive signs of NT emission. Its mass loss rate is less than 10 times that of Eta Car (see De Becker & Raucq Reference De Becker and Raucq2013, and references therein); the primary is a WR star instead of a LBV. It was mapped as a discrete source so far (less than 1 arcsec), with no circumstellar emission. A model tailored to this system is crucial to find whether the WR stellar wind is capable of absorbing the radio NT radiation in gamma2 Velorum, and which are the processes that could give rise to the GeV excess of emission.
6 SUMMARY
Telescope data archives are a profitable source of unpublished results. The reduction and analysis of archival (ATCA) radio interferometric raw data of the field of WR 11 at 1.4 and 2.5 GHz led to the following findings.
-
1. There are tens of radio sources in the field of WR 11, unclassified and uncatalogued. One disclosed in this work and labelled S6, in principle, is a candidate to be investigated as a gamma-ray producer.
-
2. The systems WR 11 and Eta Car have some similarities but the differences—especially the mass loss rate values and the presence or absence of dense circumstellar matter—preclude the use of same frameworks.
-
3. The emission of WR 11 from frequencies above 843 MHz, up to 20 GHz, presents thermal spectral indices.
-
4. The absence of NT emission is not enough to discard WR 11 as the one producing the Fermi LAT emission excess.
Due to sensitivity issues, the 7-yr Fermi data at the position of WR 11 cannot be used to search variability that could be locked to the system phase, for instance. But the radio sources in the field can be investigated in more detail, by carrying out observations at very low frequencies and arcsec resolution. The Giant Metrewave Radio Telescope is the best suited to that aim. Radio flux variability studies of the field sources could give a hint on their nature. Together with these observational results, a model to explain the emission of WR 11 along the entire electromagnetic spectrum is needed.
ACKNOWLEDGEMENTS
The author thanks an anonymous referee, whose comments and suggestions resulted in improving the article. PB is grateful to M. Fernández López, M. De Becker, S. M. Dougherty and S. del Palacio. This research has made use of the SIMBAD database, operated at CDS, Strasbourg, France, and of the NASA/IPAC Extragalactic Database (NED) which is operated by the Jet Propulsion Laboratory, California Institute of Technology, under contract with the National Aeronautics and Space Administration. This work was supported by the FONCyT project PICT 2012-878.


