


Specific Event Identifiers
Event Type: Mass-Gathering Event
Event Onset Date: July 1-2, 2017
Location of the Event: Modena, Italy; Latitude = 44.6666667 North; Longitude = 10.916667 East; Elevation Above Sea Level = 34m
Dates of Observation Reported: July 1-2, 2017
Response Type: Medical Relief
Introduction
Events involving a high number of participants should be planned and implemented with the primary objective of guaranteeing the highest possible level of safety, which is becoming ever more essential in the recent years.Reference McCloskey, Zumla and Ippolito1–Reference Pollard, Bachmann, Greer, Way and Kman3 The Vasco Modena Park July 1, 2017 concert attracted more than 220,000 paying attendees, which was more than the resident population of Modena (Italy), the city hosting the event. This Major Planned Event (MPE) was classified as a high-risk event.Reference Lund and Turris4–Reference Alam6 Although over 95% of participants arrived on the day of concert, a considerable influx of people characterized the area of the event during the weeks leading up to July 1, 2017. This kind of event has a specific health care organization that comprises local health care assistance checkpoints called Advanced Medical Points (AMPs). It was estimated that, on average, between 0.5%-2.0% of spectators of an MPE will request some form of first aid in a time window of 24 hours; of these, approximately ten percent will need other medical care on site, and an additional one percent will require transport to a hospital.Reference Moore, Williamson, Sochor and Brady7,Reference Schwartz, Nafziger, Milsten, Luk and Yancey8
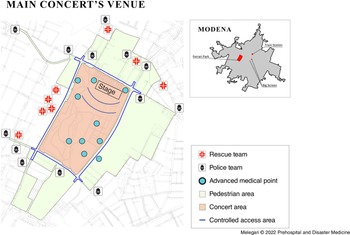
The area of the concert (Figure 1) was divided into three sectors called PITs: PIT 1 containing 40,000 people and surrounding the stage; PIT 2 hosting 40,000 people and was immediately behind PIT 1; and PIT 3, the largest area with 140,000 people, was crisscrossed by shatterproof barriers to create fragmentation of spectators and avoid pressure from the rear audience. A driveway was accessible by emergency vehicles. On-site health care resources included: 10 AMPs with a total of 168 beds, 27 Basic Life Support Defibrillator (BLSD) ambulances, two Immediate Life Support (ILS) ambulances, three Advanced Life Support (ALS) crews on foot, 280 rescuers, divided into 70 teams on foot, and two ALS vehicles. There was also a further AMP at the Emergency Service advanced management post, located in a near-by military base in case of saturation of the on-site AMPs or mass-casualty occurrence. The 70 BLSD on-foot teams consisted of four experienced emergency rescuers with automatic external defibrillators/AEDs spread within the concert area. The expected commitment of the staff was 32 hours, in addition to that required for the arrival, positioning, and return from the place of the event. The health care management during the event was structured on two levels: one adjacent to the event area, in the advanced management post in a military base, and the other at Emergency Service city headquarters, by one of the two main Modena hospitals. In case of need, patients could be evacuated from the event either by helicopter or ambulance and referred to regional hub hospitals. So called “Chill-Out” teams were present to prevent the scale-up of situations arising from substance and alcohol abuse. Support was also provided by a doctor from the Mental Health Centers, who provided dedicated support to attendees.
Main Concert Area: Detail of Restricted Rings, Police and Emergency Staff Location, and Advanced Medical Posts.
Note: Modified from: (1) Statistical service and geographic information systems of the Emilia-Romagna Region. Geoportale Emilia-Romagna. Accessed April 5, 2021. https://geoportale.regione.emiliaromagna.it/download; (2) Toscani S. Piano Sanitario Concerto VASCO Modena Park Live 2017. Published June 28, 2017. http://www.ausl.mo.it/flex/cm/pages/ServeAttachment.php/L/IT/D/1%252Fb%252F0%252FD.e3c129cc2ecf78c2dd3c/P/BLOB%3AID%3D14456/E/pdf.

The health care plan was compiled with the synergistic collaboration of all hospitals in the Province of Modena, Policlinico Teaching Hospital, Ospedale Civile Sant’Agostino Estense (OCSAE) – the trauma center and Carpi and Vignola’s hospitals, due to the recent experience in dealing with large events like the 2012 earthquake.Reference Barbieri, Melegari and Lob9 The aim of this study was describing health care management in an MPE that involved 220,000 participants, more than doubling the population of the city hosting the event.
Sources
Data were retrospectively collected from all health care registers used during the Vasco Modena Park July 1, 2017 event (Ethics Committee N° protocol 589/2019, Modena [Italy] in compliance with GDPR 679/2016 regulation); descriptive data regarding the concert; as well as all data present in paper dispatches from all AMPs during the event. All subjects were enrolled that sought and received medical assistance from 00:00am of July 1, 2017 through 8:00am of July 2, 2017. All instances that did not report the severity code were excluded. The following variables were studied: time of AMP presentation, reason for admission, severity code on admission, demographic data, medical history, vital parameters, medical treatments and procedures, medications, discharge codes, and need for hospitalization. Patients were divided into two groups: LOW-Severity (admission code green) and HIGH-Severity (admission codes yellow and red). The statistical analysis was conducted using GraphPad Prism version 8.0.0 for Windows (GraphPad Software; San Diego, California USA). The following tests were performed: Shapiro Wilk test and Student’s T-linear and non-linear regressions have been performed, where necessary, to measure associations between parameters. Otherwise, comparisons were made through non-tests parametric; the association between the binary variables was calculated using the chi-square test with Fischer correction. The comparison of paired data was made through Wilcoxon signed-rank Test. For all curves reported, the parameter R2 was calculated expression of the model’s goodness of fit. Confidence interval (CI) was calculated at 95%. The results were considered significant for a P value ≤.05.
Observations
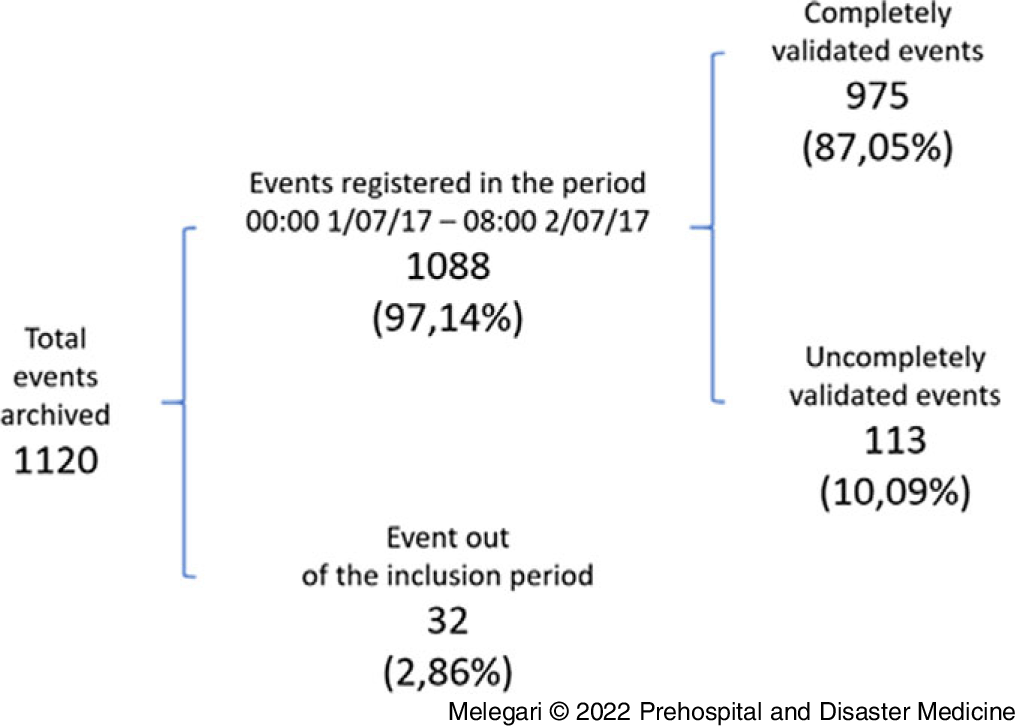
The total number was admissions to the ten AMPs was 1,120 patients, 0.51% of the participants, from June 29 through July 2, 2017 in correlation to the concert. The number of events within the inclusion period was 1,088 (97.14%), of which 879 (87.05%) had a complete set of data, equal 0.40% of the total participants (Figure 2).
Event Selection Process Results.
The total number of patients discharged by the AMPs or treated on the spot by mobile teams presents a distribution in function of time comparable to a Gaussian curve (P value <.001; Figure 3).
Total AMP-Confirmed Events from July 1-2, 2017 during Modena Park.
Abbreviation: AMP, Advanced Medical Point.
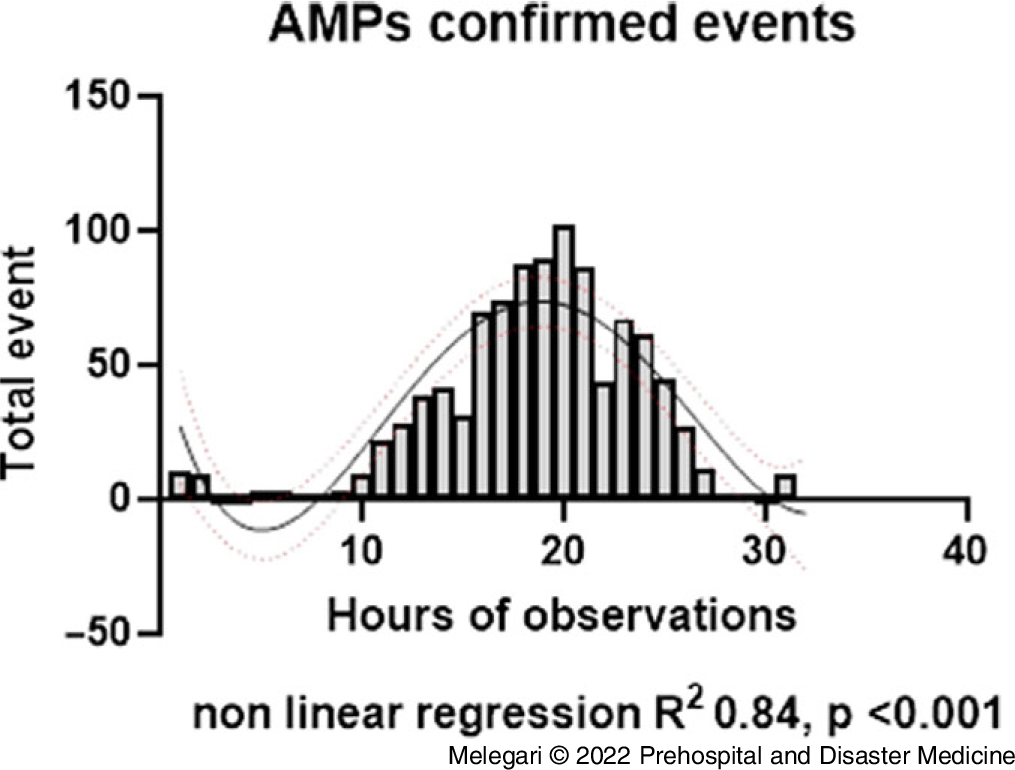
Most of the events were concentrated from 11:00am on July 1, 2017 through 3:00am on July 2, 2017. The number of events showed an upward trend, reaching a first peak (102) two hours prior to the beginning of the concert (20th hour of the MPE), and then it almost halved. A second peak on the 23rd hour of the MPE was followed by a sudden drop in admission, rebounding quickly at the end of the event, as it showed in Figure 3.
Patients with green discharge codes were 953 (97.74%), yellow were 16 (1.64%), and red were six (0.61%). A discrepancy between admission and discharge severity codes was detected, especially in the peak hours, when it reached a statistically significant difference for codes green and yellow (Table 1).
Triage Code at the First (In) and at the Second Evaluation (Out) Sorted by Time and Environmental Variables
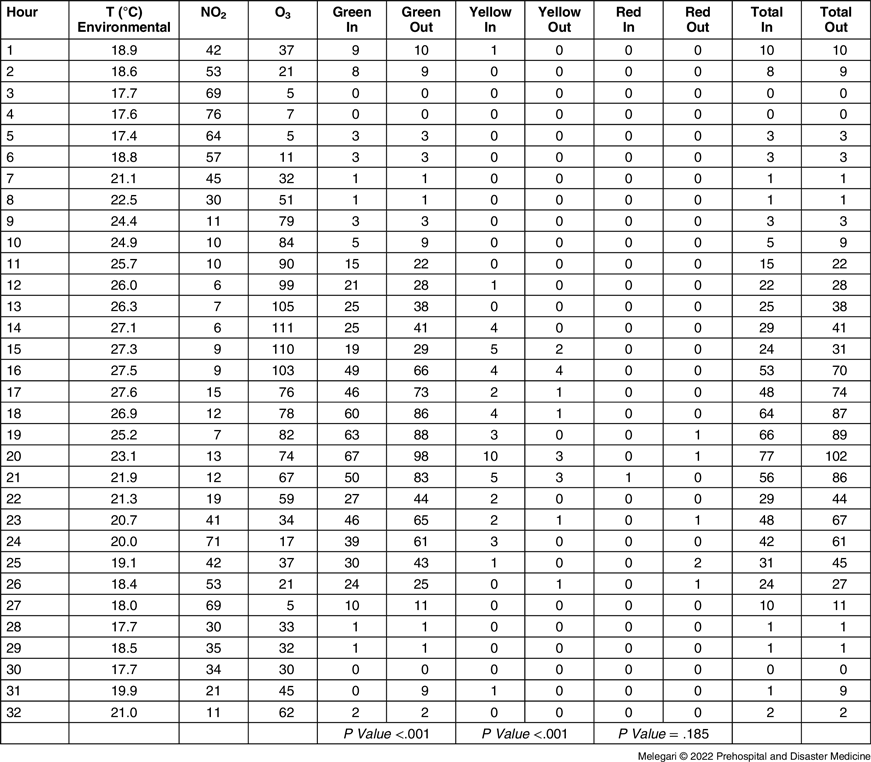
Abbreviations: NO2, nitrogen dioxide; O3, trioxygen.
The average treatment duration was 27.13 minutes (SD = 31.29; 95% CI, 24.20-30.07). The minimum and maximum duration of the interventions were zero and 170 minutes, respectively, where “zero” corresponds to immediate discharge. The treatment duration was higher in the HIGH-Severity group with a P value of .002.
The average age of the participants who sought assistance was 32.50 years (SD = 12.16; 95% CI, 31.68-33.32). The minimum and maximum ages recorded were one and 85 years, respectively. Fashion was 21 years old. The average age of patients who received a white or green admission code was 32.08 years (SD = 12.26; 95% CI, 31.05-33.11). The average age of patients who received a yellow or red severity admission code was 36.10 years (SD = 12.40; 95% CI, 32.08-40.12). The age of people who had been assigned a yellow or red triage code was greater than that of the white or green codes, with a P value of .048. The reasons for seeking assistance were headaches (164; 16.82%), pre-syncope or syncope (144; 14.77%), allergy (86; 8.82%), minor traumas (78; 7.99%), and dehydration or heat stroke (74; 7.59%); Table 2. The reasons that most likely lead to a second-level assessment were syncope or pre-syncope, nausea, vomiting, and alcohol intoxication.
Main Clinical-Instrumental Topics of Provided Care Services
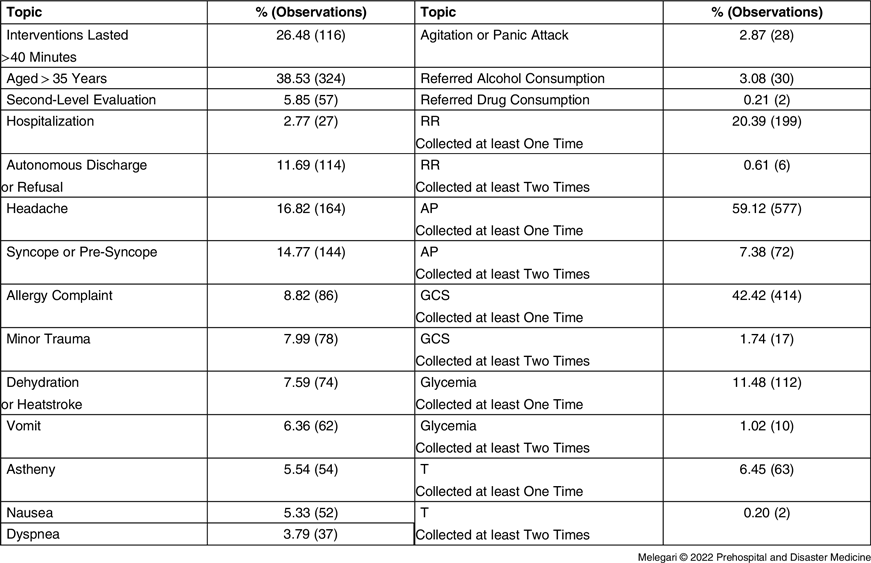
Abbreviations: RR, respiratory rate; AP, arterial pressure; GCS, Glasgow Coma Scale; T, body temperature.
Patients who needed a second-level assessment were 5.85% (57 events). HIGH-Severity patients needed a second-level evaluation in 45.45% (10 events), presenting a higher percentage (P value <.001) than 4.93% (47 events) of the total number of LOW-Severity patients. All people transferred to hub hospitals (27; 2.77%) were previously referred to the second level of evaluation; the HIGH-Severity patients were hospitalized in 31.82% of the cases. In comparison, the LOW-Severity group was hospitalized in 2.10% of the cases. The transfer to a hub hospital occurred more frequently in the HIGH-Severity group with a P value <.001.
Finally, the number of events for which an emergency vehicle had been dispatched was comparable to previous and following years (Table 3).
Number of Events for which an Emergency Vehicle had been Sent, Sorted by Triage Code and Year
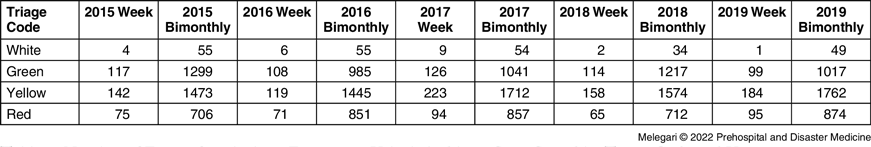
Note: Week = June 28-July 3; Bimonthly = June-July.
Analysis
The total number of participants seeking medical attention was lower than expected by McQueen, et al.Reference McQueen and Davies10 The number of LOW-Severity patients was predictable and explained by the long waiting before the event and physical fatigue. In general, the outcome of management of the MPE can be considered positive, thanks to synergistic cooperation of all the stakeholders involved.Reference Endericks11
The density of participants was seven-times higher than the urban density of Modena, but there were no severe accidents. In the months before this MPE, a terrorist attack struck a concert in Manchester (UK) wounding 250 and killing 16; a few days later in Turin (Italy), 1,600 people were wounded and two died during the public projection of the Champions League final.
The only death recorded at the concert occurred on the morning of July 1, 2017 in a trailer near the Enzo Ferrari Park, the likely cause of death was myocardial infarction. From the analysis of the curve of the treatments provided over time, the propensity to seek treatment is greatly reduced as the concert nears its beginning, as the health care needs are outweighed by the desire to attend the performance. This highlights the importance of considering the psychosocial and behavioral factors of a crowd in the health care planning and operations for this type of events.Reference Milsten, Seaman, Liu, Bissell and Maguire12,Reference Burkle and Hsu13
The outflow phase could not be fractioned as, for logistical reasons, it was unpractical to ask participants to stay at the location.
The health care system was not overloaded as the hub hospital admissions were in line with the previous years at the same date. The sheer number of admission requests can help explain the discrepancy between admission severity codes and discharge severity codes, as the main objective of initial evaluation was not under-estimating potentially severe conditions.
The adult age of the participants and the positive influx of the artist in reassuring and guiding the crowd were instrumental in reducing the number of incidents.
Limitations
This study is retrospective research; only 87% of data are complete. Results of the study do not include those who may have had injury or illness and did not seek on-site evaluation. The findings of the research were likely affected by the type of concert, as well as access to alcohol and illegal/legal drugs. It was not possible to perform an outcome analysis past the assessment at the event itself.
Conclusion
The Modena Park MPE health care management proved adequate to the number of participants and the severity of patients. Descriptive data reported add the mass-gathering database useful for further events.
Conflicts of interest/funding
The authors declare no conflicts of interest or funding.
Author Contributions
All authors were involved in the research and manuscript preparation; they approved the final draft manuscript version.


 Open access