


1. Introduction
The idea generation phase, often referred to as the conceptual or divergent stage, marks a critical point in the design process where designers explore the problem space, generate alternatives, and set up the trajectory for downstream development. The quality and diversity of ideas generated during this phase affect the innovativeness and ultimate success of the final outcome (Reference McAdamMcAdam, 2004).
What are the neural differences between high- and low- performing idea generators? This question is of interest to design pedagogy and practice. Pedagogically, this knowledge gap matters because a one-size-fits-all approach may overlook systemic cognitive differences across learners (Reference Goyibova, Muslimov, Sabirova, Kadirova and SamatovaGoyibova et al., 2025). Practically, it matters because design tools and workflows could be better tuned to scaffold the specific mental processes that drive high performance, rather than treating all designers as cognitively equivalent (Reference KalyugaKalyuga, 2008). Despite numerous research interests in how high- and low-performing designers differ in their design cognition, most studies have relied on behavioral or qualitative methods rather than neural measures. These behavioral approaches, including interview-based research (Reference Çokpekin and KnudsenÇokpekin & Knudsen, 2012; Reference Justin and GeraldineJustin & Geraldine, 2017; Reference Ridgely, Buttorff, Wolf, Duffy, Tom, Damberg, Scanlon and VaianaRidgely et al., 2020) and verbal protocol analysis (Reference Yao and ZengYao & Zeng, 2006), have identified organizational structures and cognitive strategies but cannot reveal the underlying neural mechanisms that differentiate high and low ideation performance.
To address this gap, design researchers have recently begun adopting neuroimaging tools such as EEG, fNIRS, and fMRI to investigate the cognitive processes underlying design ideation. Studies by Reference Hu and ShepleyHu and Shepley (2022) and Reference Gero and MilovanovicGero and Milovanovic (2020) explicitly argue for integrating neuroscience methods into design research to complement self-report and behavioral data, thereby potentially uncovering cognitive mechanisms of problem framing and idea generation that remain invisible to conventional observation. Neuroimaging work by Reference Saggar, Quintin, Kienitz, Bott, Sun, Hong, Chien, Liu, Dougherty, Royalty, Hawthorne and ReissSaggar et al. (2015) and Reference Goucher-Lambert, Moss and CaganGoucher-Lambert et al. (2018) further reveals distinct neural states associated with spontaneous ideation and inspiration. More recent studies employing portable fNIRS devices (Reference Shealy, Grohs, Hu, Maczka and PannetonShealy et al., 2017, Reference Shealy, Gero, Hu and Milovanovic2020) and EEG (Reference Colombo, Mazza, Cantamessa, Montagna, Monte, Ricci, Michielli and TörlindColombo et al., 2025) have advanced the field toward ecologically valid, task-based investigations that link neural activation with cognitive load, educational background, and divergent-thinking performance.
While general creativity neuroscience has established foundational patterns of cortical activity during divergent thinking, design cognition presents unique characteristics that may not be captured by abstract ideation tasks. Design problems are inherently constraint-driven and require integrating functional, aesthetic, and technical considerations while navigating trade-offs between competing requirements. Reference Vieira, Benedek, Gero, Li and CasciniVieira et al. (2022) demonstrated that different design spaces elicit distinct patterns of EEG frequency band power, with significant differences in beta and alpha bands between constrained and open design tasks. Reference Vieira, Kannengiesser and GeroVieira et al. (2023) further found that metacognitive processes showed higher power in alpha-1, alpha-2, and beta-1 frequency bands during open design tasks. Additionally, EEG studies have also examined how expertise and experience shape neural activity during design. Reference Liang, Lin, Yao, Chang, Liu and ChenLiang et al. (2017) investigated visual attention patterns in expert designers and found that the frontoparietal region was particularly activated during visual attention tasks, with distributed activation across prefrontal, frontocentral, and parietooccipital regions during visual association tasks. In a subsequent study comparing experts and novices, Reference Liang, Chang and LiuLiang et al. (2018) reported that expert designers exhibited higher spectral power levels than novices during conceptual imagination, with notable activation in prefrontal and temporal cortices.
Research has also differentiated neural signatures across different phases of the design process. Reference Jia and ZengJia and Zeng (2021) used EEG to distinguish idea generation, idea evolution, and evaluation phases in a creative design experiment. Their results revealed that alpha power decreased from rest across all three modes of thinking, with distinct patterns emerging for each phase: idea evolution showed lower decreases in lower-alpha band, while evaluation showed higher decreases in upper-alpha band over central sites compared to idea evolution. However, while these design-specific EEG studies have characterized constraints, metacognition, expertise levels, and design phases, direct EEG comparisons of high- and low-performing ideators in design contexts remain limited.
Despite advances in design-specific neuroscience, our understanding of performance differences in ideation draws primarily from general creativity research employing abstract tasks. Reference Schwab, Benedek, Papousek, Weiss and FinkSchwab et al. (2014) demonstrated systematic changes in EEG alpha power across the ideation timeline, showing that creative thought unfolds through temporally distinct neural patterns. They showed that alpha desynchronization supports semantic retrieval and memory access, while alpha synchronization reflects internally directed attention. Similarly, Reference Jauk, Benedek and NeubauerJauk et al. (2012) and Reference Benedek, Schickel, Jauk, Fink and NeubauerBenedek et al. (2014) linked increased alpha power in right parietal regions to a focused cognitive state conducive to divergent thinking, with higher creativity scores correlating with stronger frontal alpha synchronization during memory retrieval. Reference Rominger, Papousek, Perchtold, Benedek, Weiss, Schwerdtfeger and FinkRominger et al. (2019) found a U-shaped pattern of alpha power changes, indicating that individuals who produced more original ideas showed distinct cortical synchronization dynamics. Reference Chrysikou and Thompson-SchillChrysikou and Thompson-Schill (2011) compared neurophysiological correlates of creative and common object use tasks. They reported that participants with superior ideational fluency exhibited lower prefrontal cortical arousal during creative tasks, which indicated a brain state facilitating efficient retrieval and recombination of concepts.
However, these studies revealing neural signatures of ideational performance have almost exclusively employed abstract, memory-based tasks such as the Alternate Uses Task (AUT) for measuring divergent thinking. In the AUT, participants are asked to list as many alternative uses as possible for a common object (e.g., a brick or paper clip) within a few minutes. Performance is typically scored across four dimensions: fluency (number of ideas), originality (uniqueness of ideas), flexibility (variety of idea categories), and elaboration (level of detail) (Reference Madore, Szpunar, Addis and SchacterMadore et al., 2016; Reference Rominger, Papousek, Perchtold, Benedek, Weiss, Schwerdtfeger and FinkRominger et al., 2019).
While the AUT offers simplicity and strong psychometric grounding, its artificial nature limits its applicability to design research. Design problems often require integrating multiple constraints, considering user needs, and adhering to feasibility considerations (Reference Erwin, Tran and KoutstaalErwin et al., 2022; Reference Lee, Zhou, Bai, Meng, Zeng, Peng, Tong and KumadaLee et al., 2023). Recent methodological advances in design research have begun to bridge this gap by combining psychological measures of divergent thinking with more realistic, construction-oriented design tasks (Reference Hartog, Marshall, Ahad, Alhashim, Okudan Kremer, van Hell and SiddiqueHartog et al., 2020). For example, in Reference Jian, Gero, Beirne and OlechowskiJian et al. (2025), researchers combined divergent thinking measures with an IKEA Hacking task using Ikea furniture and its parts as the target. Following these developments, the present study extends traditional creativity paradigms into a design-relevant context to examine whether previously observed neural patterns of idea generation are observable under ecologically valid design conditions.
2. Methods
This study uses electroencephalography (EEG) to investigate whether high-performing and low-performing designers exhibit distinct neural signatures during a design-based ideation task. Unlike conventional memory-based AUT paradigms, our task provides higher ecological-familiarity that is better suited for design research. This paper forms part of a larger research program comparing brain activity and eye-tracking patterns during design using various design tools. The objective of this paper is to quantify how EEG patterns differ between high- and low-performing designers during creative ideation. In doing so, we aim to shed light on the neural mechanisms that distinguish successful idea generators in a design-relevant context.
2.1. Participants
Twenty-eight participants (14 male, 14 female, M = 20.46 years, SD = 2.62) took part in the study. All participants were undergraduate or graduate students in Mechanical and Industrial Engineering Department and received monetary compensation for their participation.
Participants were fluent or native-like in English to ensure full comprehension of task instructions and verbal explanations during the design process, and were right-handed, as assessed by self-report, to control for variability in neural activity associated with hemispheric dominance. Exclusion criteria ruled out individuals with a history of neurological or psychiatric disorders to preserve EEG data quality, as well as those with uncorrected visual impairments that could interfere with visual perception or eye-tracking accuracy. All participants provided informed consent prior to participation, and the study protocol was approved by the University’s Research Ethics Board.
2.2. Design task
Each participant completed a concept generation task based on the IKEA Hacking paradigm. In this task, participants were presented with an image and the corresponding parts list of an existing IKEA furniture item (e.g., a stool, shelf, or table). They were instructed to generate as many alternative uses or redesigns as possible for the given furniture piece within the allotted time. Before the task began, participants were explicitly told to continue sketching and thinking of new ideas for the entire duration, even if they felt they had “finished” early. Participants were told to use at least three of the provided parts in each concept and were permitted to cut, modify, or reattach components in any configuration. The goal was to encourage divergent thinking and creative reinterpretation of everyday objects.
2.3. EEG recording and apparatus
During both design sessions, participants wore a 20-channel EEG cap (Advanced Brain Monitoring, ABM) to record continuous neural activity. The electrodes were positioned according to the international 10–20 system, covering frontal, central, parietal, occipital, and temporal regions (Fp1/2, F3/4, Fz, C3/4, Cz, P3/4, Pz, O1/2, T3/4/5/6, etc.). The reference electrode was placed at the mastoid, and electrode impedance was maintained below 10 kΩ throughout data collection. EEG signals were recorded at a sampling rate of 256 Hz using the iMotions platform.
2.4. Pre-processing procedure
EEG preprocessing was conducted in MATLAB using the EEGLAB 2025 toolbox (Reference Delorme and MakeigDelorme & Makeig, 2004). Raw data were sampled at 256 Hz and re-referenced to the common average after standard preprocessing steps adapted from current best-practice guidelines (Reference DelormeDelorme, 2023; Reference Coelli, Corda and BianchiCoelli et al., 2025).
Data were band-pass filtered (0.5–40 Hz) and notch-filtered (58–62 Hz) to remove slow drifts, high-frequency noise, and power-line interference. Artifact Subspace Reconstruction (ASR) was applied with default thresholds (burst = 20, window = 0.25) to correct transient artifacts and identify bad channels. Channels flagged as flat (> 4 s) or poorly correlated (< 0.9) with neighbors were removed and subsequently interpolated using spherical splines to restore a consistent 20-channel montage.
Independent Component Analysis (ICA, Picard algorithm) was then performed after rank-reduction via PCA. Components were automatically classified with ICLabel, and those with ≥ 90 % probability of representing non-neural sources (eye, muscle, cardiac, or line noise) were rejected. Finally, segment-level artifact rejection removed 1-s epochs exceeding ±100 μV. After preprocessing, an average of 1.83 ± 1.26 channels per recording were rejected and interpolated, and 1.58 ± 0.90 ICA components were removed as artifacts. Power spectral density was computed from the cleaned EEG in Section 2.6.
To assess whether EEG data quality differed systematically by performance group, we compared preprocessing QC metrics (percent data retained, number of channels rejected/interpolated, number of ICA components removed, and number of retained 1-s epochs) between High vs Low performers within the pen-and-paper (PP) condition. No group differences were observed for any QC metric (Welch t-tests: all p ≥ .55; BH-corrected p ≥ .98), suggesting that performance-group EEG effects are unlikely to be explained by differential artifact rejection or data retention.
2.5. Ideation performance analysis
Design performance was evaluated using three divergent-thinking metrics: fluency, flexibility, and originality. Fluency was defined as the number of distinct ideas generated by each participant. Flexibility represented the number of idea categories in a participant’s output. Two trained research assistants (RAs) and the first author jointly coded 25% of the ideas to establish the coding scheme. The RAs then independently coded the remaining data, and the first author reconciled all discrepancies to finalize category assignments. Originality was calculated based on the relative frequency of each idea among all participants. Specifically, originality for an idea was defined as 1/f, where f is the frequency of that idea type across the entire dataset. Each participant’s average originality was computed by taking the mean of their individual idea originality scores.
To derive an overall ideation performance index, fluency, flexibility, and originality were min–max normalizing to a 0–100 range. A composite performance score was then computed as the mean of the three normalized metrics. Participants were subsequently split at the median composite score to form high- and low-performance groups for between-group EEG comparisons. A median split was used as a transparent grouping strategy that yields balanced group sizes and reduces sensitivity to extreme values. We note that dichotomizing a continuous score can reduce information; accordingly, we report effect sizes alongside p-values and examine performance as a continuous predictor in follow-up analyses.
2.6. Data analysis
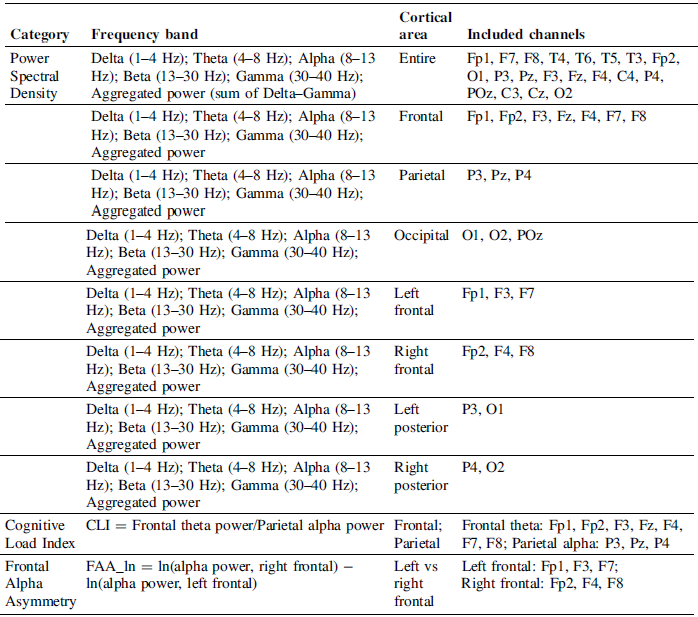
Power Spectral Density (PSD) Analysis: EEG signals were analyzed using spectral decomposition to examine frequency-specific neural activity during the ideation task. PSD was estimated from the artifact-cleaned continuous EEG using Welch’s method (pwelch, MATLAB) on non-overlapping 1-s Hamming-tapered windows, and spectra were averaged across windows for each participant. The EEG features used as dependent variables and their channel assignments are summarized in Table 1.
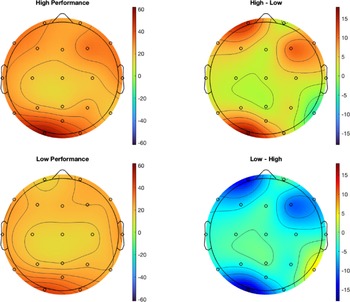
Topographic Visualization: To visualize the spatial distribution of spectral power, topographic heatmaps were generated for each group and frequency band. Group difference maps (High – Low; Low – High) were computed by subtracting the averaged PSD values across electrodes. These visualizations provided a qualitative overview of activation patterns to complement the quantitative comparisons.
Group-level comparisons were performed using Welch’s independent-sample t-tests between high- and low-performance groups for each frequency band and electrode cluster. Multiple-comparison corrections were applied using both Holm–Bonferroni and Benjamini–Hochberg (BH) procedures. Effect sizes were calculated using Cohen’s d to estimate the magnitude of group differences.
EEG features with cortical areas and channel

Table 1 Long description
The table has 10 rows and 4 columns. The columns are labeled Category, Frequency band, Cortical area, and Included channels. The table summarizes EEG features with cortical areas and channel assignments. Row 1: Category, Power Spectral Density; Frequency band, Delta (1-4 Hertz); Theta (4-8 Hertz); Alpha (8-13 Hertz); Beta (13-30 Hertz); Gamma (30-40 Hertz); Aggregated power (sum of Delta-Gamma); Cortical area, Entire; Included channels, Fp1, F7, F8, T4, T6, T5, T3, Fp2, O1, P3, Pz, F3, Fz, F4, C4, P4, POz, C3, Cz, O2. Row 2: Category, Power Spectral Density; Frequency band, Delta (1-4 Hertz); Theta (4-8 Hertz); Alpha (8-13 Hertz); Beta (13-30 Hertz); Gamma (30-40 Hertz); Aggregated power; Cortical area, Frontal; Included channels, Fp1, Fp2, F3, Fz, F4, F7, F8. Row 3: Category, Power Spectral Density; Frequency band, Delta (1-4 Hertz); Theta (4-8 Hertz); Alpha (8-13 Hertz); Beta (13-30 Hertz); Gamma (30-40 Hertz); Aggregated power; Cortical area, Parietal; Included channels, P3, Pz, P4. Row 4: Category, Power Spectral Density; Frequency band, Delta (1-4 Hertz); Theta (4-8 Hertz); Alpha (8-13 Hertz); Beta (13-30 Hertz); Gamma (30-40 Hertz); Aggregated power; Cortical area, Occipital; Included channels, O1, O2, POz. Row 5: Category, Power Spectral Density; Frequency band, Delta (1-4 Hertz); Theta (4-8 Hertz); Alpha (8-13 Hertz); Beta (13-30 Hertz); Gamma (30-40 Hertz); Aggregated power; Cortical area, Left frontal; Included channels, Fp1, F3, F7. Row 6: Category, Power Spectral Density; Frequency band, Delta (1-4 Hertz); Theta (4-8 Hertz); Alpha (8-13 Hertz); Beta (13-30 Hertz); Gamma (30-40 Hertz); Aggregated power; Cortical area, Right frontal; Included channels, Fp2, F4, F8. Row 7: Category, Power Spectral Density; Frequency band, Delta (1-4 Hertz); Theta (4-8 Hertz); Alpha (8-13 Hertz); Beta (13-30 Hertz); Gamma (30-40 Hertz); Aggregated power; Cortical area, Left posterior; Included channels, P3, O1. Row 8: Category, Power Spectral Density; Frequency band, Delta (1-4 Hertz); Theta (4-8 Hertz); Alpha (8-13 Hertz); Beta (13-30 Hertz); Gamma (30-40 Hertz); Aggregated power; Cortical area, Right posterior; Included channels, P4, O2. Row 9: Category, Cognitive Load Index; Frequency band, CLI = Frontal theta power/Parietal alpha power; Cortical area, Frontal; Parietal; Included channels, Frontal theta: Fp1, Fp2, F3, Fz, F4, F7, F8; Parietal alpha: P3, Pz, P4. Row 10: Category, Frontal Alpha Asymmetry; Frequency band, FAA_In = ln(alpha power, right frontal) - ln(alpha power, left frontal); Cortical area, Left vs right frontal; Included channels, Left frontal: Fp1, F3, F7; Right frontal: Fp2, F4, F8.
3. Results
3.1. Descriptive data
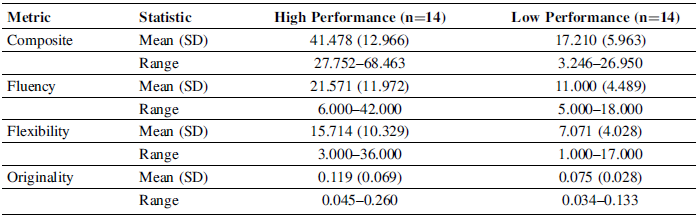
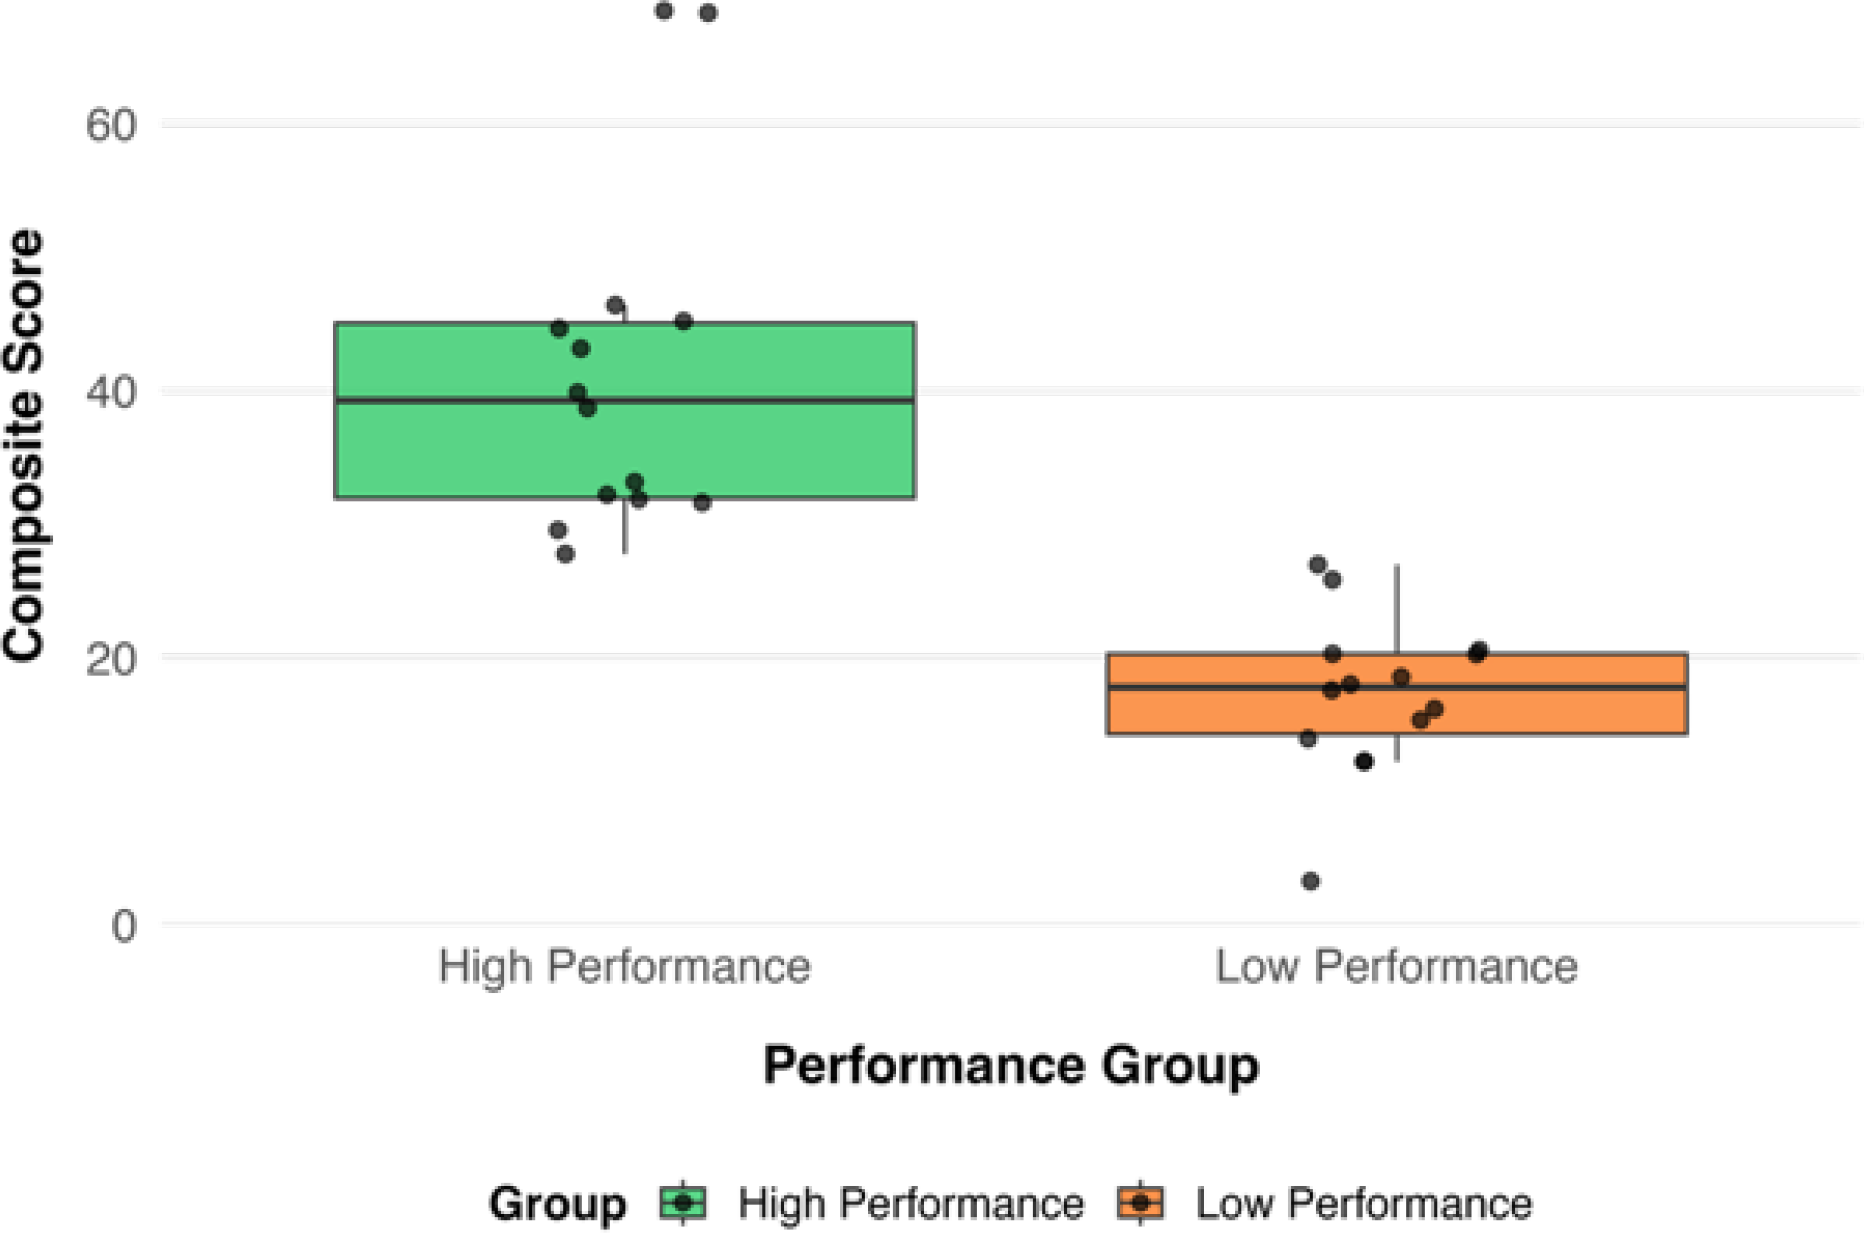
The descriptive statistics are summarized in Table 2 for high- and low-performing designers on the composite and the individual divergent-thinking metrics (fluency, flexibility, originality). Overall, the high-performing group (n = 14) exhibited higher scores across all measures compared to the low-performing group (n = 14). The mean composite score was substantially greater for high performers (M = 41.48, SD = 12.97) than for low performers (M = 17.21, SD = 5.96), reflecting nearly a twofold difference in overall ideation performance (Figure 1).
Descriptive statistics for divergent-thinking metrics

Across all measures, the range and standard deviations were larger in the high-performing group, indicating greater variability in performance among stronger designers. This variance difference may reflect heterogeneous strategies or cognitive styles within the high-performing cohort, though these interpretations should be made cautiously given the small sample size.
Distributions of composite scores for high- and low-performing designer

3.2. Qualitative topographic patterns
A qualitative visual inspection of the aggregated EEG power spectral density (PSD) maps (Figure 2) revealed distinct topographic patterns between high- and low-performing designers during the pen-and-paper ideation task. Both groups exhibited dominant activation over frontal and occipital regions, consistent with sustained attentional engagement, visual processing and executive processing during design ideation. The heatmap subtractions revealed that high-performing group showed relatively stronger power in frontal and right-frontal regions (Figure 2: High – Low; Low – High). The clearest differences were located around anterior frontal, right frontal, and left parieto-occipital regions. These qualitative patterns suggest that high-performing designers may engage additional frontal resources associated with cognitive control, mental integration, and goal maintenance during idea generation.
Group-averaged PSD topographies and difference maps for high- and low-performers

Figure 2 Long description
Panel A: A heat map titled High Performance. The heat map uses a color scale ranging from blue to red, indicating values from -60 to 60. The map shows a topographical distribution of performance values across a circular area with several contour lines. Higher values are represented by red and orange colors, while lower values are shown in blue and green. The highest performance values are concentrated in the upper right and lower left regions. Panel B: A heat map titled High - Low. This map uses a color scale ranging from blue to red, indicating values from -15 to 15. It shows the difference in performance values between high and low performers. The map features a circular area with contour lines, where higher values are represented by red and orange colors, and lower values are shown in blue and green. The highest differences are concentrated in the upper right and lower left regions. Panel C: A heat map titled Low Performance. This heat map uses a color scale ranging from blue to red, indicating values from -60 to 60. It shows a topographical distribution of performance values across a circular area with several contour lines. Higher values are represented by red and orange colors, while lower values are shown in blue and green. The highest performance values are concentrated in the upper right and lower left regions. Panel D: A heat map titled Low - High. This map uses a color scale ranging from blue to red, indicating values from -15 to 15. It shows the difference in performance values between low and high performers. The map features a circular area with contour lines, where higher values are represented by red and orange colors, and lower values are shown in blue and green. The highest differences are concentrated in the upper right and lower left regions.
3.3. Quantitative statistical results
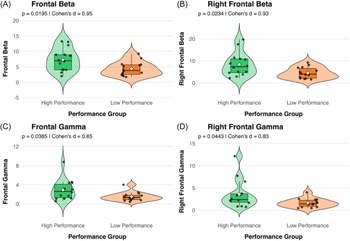
High-performing designers exhibited greater PSD in both Beta and Gamma frequency bands over frontal regions (Figure 3).
Violin and box plots of frontal and right-frontal Beta and Gamma

Specifically, uncorrected group differences were observed for frontal Beta and right-frontal Beta as well as for frontal Gamma and right-frontal Gamma. After Benjamini-Hochberg false discoverge control, these contrasts were not statistically significant (adjusted ps = .89), but effect sizes were large across all four comparisons (Cohen’s d ≥ 0.80) (Table 3).
Group differences in frontal and right-frontal Beta and Gamma power

4. Discussion
This study examined whether high- and low-performing designers exhibit distinct neural activation patterns during a design-relevant ideation task. By combining an ecologically grounded IKEA Hacking paradigm with EEG measures, the study extends prior creativity and design-cognition research that has largely relied on abstract tasks such as the AUT. We observed higher frontal and right-frontal Beta and Gamma frequency band power among high-performing designers with large effect sizes (Cohen’s d ≥ 0.80) though these contrasts did not remain statistically significant after false discovery rate control.
The enhanced Beta and Gamma power observed in the high-performing group aligns with neurocognitive accounts of executive control and associative integration during creative thought. Beta activity have been linked to sustained cognitive control, working-memory maintenance, and the top-down regulation of attentional focus (Reference Schmidt, Ruiz, Kilavik, Lundqvist, Starr and AronSchmidt et al., 2019; Reference Spitzer and HaegensSpitzer & Haegens, 2017), whereas Gamma activity has been associated with binding and integration of semantic information across distributed neural networks (Reference Canolty, Edwards, Dalal, Soltani, Nagarajan, Kirsch, Berger, Barbaro and KnightCanolty et al., 2006; Reference Fonteneau, Bozic and Marslen-WilsonFonteneau et al., 2015). In the context of design ideation, these oscillations may reflect a brain state that enables designers to actively maintain task goals while flexibly recombining stored knowledge to generate novel concepts. The predominance of right-frontal activity further supports this interpretation, as prior research suggests that right-hemispheric networks facilitate divergent thinking, insight, and associative processing (Reference Boccia, Piccardi, Palermo, Nori and PalmieroBoccia et al., 2015; Reference Fink and BenedekFink & Benedek, 2014). At the same time, because the effects did not survive multiple-comparison correction and the sample size was modest, the present interpretations should be viewed as provisional and best suited to motivating preregistered follow-up tests rather than supporting strong mechanistic claims.
From a cognitive-efficiency perspective, the stronger but more localized frontal activation in high performers may represent a neural-efficiency trade-off between an optimized engagement of executive resources that minimizes diffuse cortical activation and sustaining ideational fluency. This aligns with findings from creativity neuroscience showing that more creative individuals exhibit enhanced frontal synchronization during internally focused thought (Reference Benedek, Bergner, Könen, Fink and NeubauerBenedek et al., 2011).
4.1. Implications
These neural distinctions have implications for understanding individual differences in design cognition. High-performing designers may engage distinct metacognitive strategies, such as active monitoring of conceptual progress or flexible switching between divergent and convergent modes, which can manifest as right-frontal synchronization (Reference Beaty, Benedek, Silvia and SchacterBeaty et al., 2016; Reference Benedek, Bergner, Könen, Fink and NeubauerBenedek et al., 2011). Recognizing such neural signatures could help educators tailor instruction to different cognitive profiles. For instance, learners who demonstrate diffuse or low frontal activation during ideation may benefit from scaffolds that train focused attentional control, whereas highly controlled thinkers might require interventions that promote associative looseness or incubation. By bridging neural and behavioral measures, this work contributes to emerging frameworks that connect brain-based metrics with design pedagogy, offering an empirical foundation for adaptive, evidence-informed teaching strategies.
4.2. Limitation and future directions
Several limitations of the present study point toward important avenues for future work. First, the comparison between high- and low-performing designers was based on a composite performance index that averaged fluency, flexibility, and originality. While this approach provides an overall measure of ideation effectiveness, it may obscure neural patterns unique to each creative dimension. Future analyses will therefore examine high versus low performers separately for each metric. For example, fluency-related neural signatures may reflect rapid associative retrieval, whereas flexibility or originality may engage broader semantic and executive networks. Disaggregating these metrics could reveal whether distinct brain mechanisms underpin different forms of creative strength.
Second, performance groups were defined using a median split on the composite score. While this yields balanced groups and simplifies interpretation in a modest sample, dichotomizing a continuous measure can reduce statistical power and obscure graded relationships between performance and neural features. Future work will therefore model performance continuously (and separately by fluency, flexibility, and originality) to test whether EEG effects scale monotonically with ideation performance.
Third, although we applied standard preprocessing and artifact rejection procedures, EEG is inherently sensitive to motion or muscle related artifacts, and the residual movement effect may not be fully ruled out. Fourth, in our discussion, our analyses focused on localized brand frequency analysis. In complex tasks such as idea generation and design in general, the brain tends to work together to execute the task (Reference DietrichDietrich, 2024). To address this limitation, future work will employ functional connectivity analyses, such as phase-locking value (PLV) or weighted phase-lag index (wPLI), to quantify the degree and directionality of information flow between cortical regions. These measures will allow a deeper investigation into whether high-performing designers not only activate specific areas more efficiently but also integrate neural networks more effectively to support creative cognition.
Acknowledgement
This work is supported by funding from the University of Toronto Dean’s Spark Professorship.


 Open access

