

Introduction
In vitro gametogenesis is the next frontier of reproductive medicine and has the potential to revolutionize the field. It could give patients who would otherwise require donor gametes the opportunity to have genetically related offspring. Great progress has already been made in this endeavour, particularly with methods that coax in vitro differentiation of germline stem cells (GSCs), embryonic stem cells (ESCs), and induced pluripotent stem cells (iPSCs) into primordial germ cells (PGCs), eventually enabling their final maturation into gametes in vivo (Hendriks et al., Reference Hendriks, Dancet, van Pelt, Hamer and Repping2015). However, translating this methodology for use in human-assisted reproduction is limited by safety concerns; the difficulty in obtaining the genotyped stem cells; its reproducibility, which would require extended cell maturation culture and sophisticated laboratory skills; and its high cost.
An alternative and more direct method of producing artificial gametes would be by direct haploidization of diploid cells. With this approach, a diploid cell, either a somatic cell or stem cell, is transplanted into an enucleated oocyte, allowing it to take advantage of the oocyte’s intrinsic ability to induce reductive division and therefore remodel a diploid genome into a haploid one. Although the concept of haploidization has been demonstrated previously (Kubelka and Moor, Reference Kubelka and Moor1997; Tsai et al., Reference Tsai, Takeuchi, Bedford, Reis, Rosenwaks and Palermo2000), and has been attempted in mice (Fulka et al., Reference Fulka, Martinez, Tepla, Mrazek and Tesarik2002; Nagy et al., Reference Nagy, Chang, Tian, Abdelmassih and Yang2002; Palermo et al., Reference Palermo, Takeuchi and Rosenwaks2002a,b; Chang et al., Reference Chang, Nagy, Abdelmassih, Yang and Tian2004) and humans (Tesarik et al., Reference Tesarik, Nagy, Sousa, Mendoza and Abdelmassih2001; Fulka et al., Reference Fulka, Martinez, Tepla, Mrazek and Tesarik2002; Galat et al., Reference Galat, Ozen, Rechitsky, Kuliev and Verlinsky2005; Takeuchi et al., Reference Takeuchi, Neri and Palermo2005), its success was sporadic. Due to stringent federal regulation, the technique appears to have been overlooked for the past 15 years. As such, much remains unknown about the developmental potential of these embryos beyond the fact that they can form blastocysts with poor efficiency (Heindryckx et al., Reference Heindryckx, Lierman, Van der Elst and Dhont2004) and unknown viability. Recently, Hayashi et al. demonstrated the differentiation of embryonic and induced pluripotent stem cells into germ cells and eventually into apparently normal gametes, an accomplishment that has allowed us to learn a great deal about the process of somatic cell reprogramming and differentiation into the germ line (Hayashi et al., Reference Hayashi, Ohta, Kurimoto, Aramaki and Saitou2011).
This accomplishment has also reignited interest in neogametogenesis through somatic cell nuclear transfer that warrants being revisited and, with proper updates and modifications, considered for applications in human reproduction. The process of haploidization proposed here utilizes a well established mechanism of the oocyte to support the haploidization of a diploid nucleus. The promise of this technique for clinical applications is represented by the generation of offspring that carry the genetic makeup of their two parents.
In this context, our primary goal was to reproduce and modify the technique of direct haploidization of a female diploid cell using enucleated oocytes. Specifically, we sought to determine whether these generated constructs can fertilize normally, cleave adequately, and develop to blastocysts with a proper euploid genome.
Materials and methods
Overview of experimental design
Mature metaphase II (MII) oocytes were obtained from hyperstimulated mice. Some oocytes were allocated for the control group, which underwent piezo-actuated intracytoplasmic sperm injection (ICSI). The remaining oocytes were allocated for the experimental group and underwent enucleation, somatic cell nuclear transfer, assessment for incorporation of the donated nucleus into a ‘meiotic-like’ spindle, and piezo-actuated ICSI. Embryonic development of control and experimental embryos was observed using a time-lapse monitoring system, and the morphokinetic parameters were compared. On embryonic day 3.5, blastocysts were either cryopreserved whole for future genetic analysis or underwent trophectoderm biopsy for genetic analysis with the remainder of the embryo cryopreserved. Experiments were performed in this manner once a week over several months. Cryopreserved trophectoderm biopsy samples and whole embryos were stored until the end of the experiment period and analyzed together. This experiment was approved by our Institutional Animal Care and Use Committee (IACUC; protocol number 0605-493A).
Gamete collection
Eight-week-old B6D2F1 female mice (Jackson Laboratory, Bar Harbor, ME, USA) were intraperitoneally (i.p.) injected with 0.2 ml of ready-to-use pregnant mare serum gonadotropin and inhibin cocktail (CARD Hyperova, Cosmo Bio, Japan) for ovarian hyperstimulation. Final oocyte maturation and ovulation were triggered with an i.p. injection of 7.5 IU human chorionic gonadotropin (hCG) (CG10, Sigma-Aldrich, St. Louis, MO, USA) 48 h after the ovarian hyperstimulation. After 15–17 h from the hCG trigger, mice were euthanized by cervical dislocation, and oviducts were excised using standard surgical techniques. Retrieved oviducts were transported in potassium simplex optimized medium (KSOM) (CARD KSOM, Cosmo Bio., Japan) on a heated stage. Cumulus–oocyte complexes (COCs) were extracted from the ampulla, exposed to M2 medium with hyaluronidase (MR-051-F, Sigma-Aldrich, Saint Louis, MO, USA), and rinsed in three successive passages in KSOM. Denuded MII oocytes were incubated in KSOM covered by mineral oil (OVOIL, Vitrolife, Sweden) until use. The medium was calibrated at 37°C and 5.5% CO2 overnight. Cumulus cells were rinsed and placed in KSOM until nuclear transfer.
For sperm collection, a male CD-1 mouse (Charles River Laboratory, Catskill, NY, USA) was sacrificed and the abdomen was opened to dissect and excise the cauda epididymis. The excised tissue was placed in human tubal fluid (HTF; Irvine Scientific, Santa Ana, CA, USA) medium, and spermatozoa were released by microdissection of the cauda epididymis and allowed to incubate for at least 2 h prior to use.
Enucleation
MII oocytes were placed into a droplet of M2 medium (CARD M2 medium, Cosmo Bio, Japan) supplemented with 5 µg/ml cytochalasin B (C6762, Sigma-Aldrich, St. Louis, MO, USA) on a glass dish (FluoroDish 35mm, WPI, Sarasota, FL, USA) on a heated stage at 37°C for enucleation. The oocytes were held in the 9 o’clock position using a micropipette with an 80-µm outer diameter, 20-µm inner diameter, and a 30° tip angle (custom-made holding pipettes, Hamilton Thorne, Beverly, MA, USA). Polarizing light microscopy (Oosight® Imaging System, Hamilton Thorne, Beverly, MA, USA) was used to visualize the meiotic spindle, which was oriented at the 12 o’clock position (Figure 1). A laser (LYKOS®, Hamilton Thorne, Beverly, MA, USA) was used to breach the zona pellucida directly above the meiotic spindle. Pressure was applied on the zona pellucida at the 3 o’clock position with another pipette with a 25° tip angle, 6-µm inner diameter, and 6-mm flange (Piezo Drill Tip, Eppendorf, Enfield. CT, USA), which caused the meiotic spindle and a minimal amount of cytoplasm to protrude through the breach in the zona. The pipette was then used to gently cleave off the karyoplast. Successful removal was determined in real time with visualization of the entire meiotic spindle in the removed karyoplast (Figure 2). The enucleated oocytes were washed three times and incubated in KSOM for at least 30 min until nuclear transfer.
Image of meiotic spindle positioned at 12 o’clock, visualized using polarizing light microscopy, immediately prior to enucleation.

Enucleated oocytes. Two karyoplasts are noted at the right with the meiotic spindle present within that were removed from the adjacent ooplasts.

Donor cell preparation
Three types of diploid donor cells were used in this experiment: cumulus cells, fibroblasts, and mouse ESCs (mESCs). Cumulus cells were obtained at the time of oocyte preparation and placed in KSOM at room temperature until use. Fibroblasts (C57BL/6 mouse ovarian fibroblasts, ACCEGEN, Fairfield, NJ, USA) and mESCs (C57BL/6 Mouse ES, ATCC, Manassas, VA, USA) were plated and cultured in separate wells and passaged at least five times prior to use. At the time of the experiment, the fibroblasts and mESCs were dissociated using 0.25% trypsin (Trypsin-EDTA Solution 1X, ATCC, Manassas, VA, USA) and kept in culture medium until use.
Nuclear transfer
Enucleated oocytes were placed into a droplet of HEPES-buffered M2 medium. The donor cells were placed in another droplet of M2 medium. In addition, 7% polyvinylpyrrolidone (7% PVP; Vitrolife, Sweden) was loaded onto the dish to allow for controllable micromanipulation. Donor cells with a diameter of <10 μm were selected, loaded into the injection pipette, and expelled into a droplet of Sendai virus [Hemagglutinating Virus of Japan envelope (HVJ-E), Cosmo Bio, Japan]. The donor cell was then reloaded into the injection pipette along with a volume of HVJ-E roughly five times the volume of the donor cell. This pipette was then brought to the enucleated oocyte and, after entering through the same breach already created in the zona, was used for invaginating the oolemma and depositing the donor cell and HVJ-E. Deposition of the donor cell with HVJ-E in this fashion was critical for success, as it allowed more interaction of HVJ-E with the oolemma and optimized cell membrane fusion. The first polar body was also removed at this time so that it would not inadvertently be fused back into the oocyte in the presence of HVJ-E. Nuclear-transferred oocytes were washed and incubated in a KSOM culture dish for at least 2 h to allow time for incorporation of the donor nucleus.
Selection of reconstituted oocytes and ICSI
Approximately 2–3 h after nuclear transfer, reconstructed oocytes were visualized using polarizing light microscopy to assess for the presence of a ‘meiotic-like spindle’ at the periphery of the oocyte, indicating successful incorporation and assembly of chromosomes of the donor nucleus, in a manner similar to an MII oocyte (Figure 3). The donated nucleus taking on this structural conformation properly is what allows it to undergo a reductive division with the chromosome segregation that will ensue with fertilization and resumption of meiosis II.
Reconstituted oocyte with ‘meiotic-like’ spindle present.

Oocytes were divided into those with or without a proper meiotic-like spindle, and piezo-actuated ICSI was performed. Piezo-ICSI (PMM-150FU Piezo Impact Drive, Prime Tech, Japan or PiezoDrill®, Burleigh, Victor, NY, USA) was performed following a previously described protocol (Yoshida and Perry, Reference Yoshida and Perry2007). In brief, the microinjection pipette was first back loaded with Fluorinert (FC-770, Sigma-Aldrich, St. Louis, MO, USA). Mouse spermatozoa were placed in a droplet of 7% PVP, and a piezo drill was used to decapitate the sperm head, which was then suctioned into the injection pipette. The injection pipette was passed through the breach in the zona, and a gentle piezo pulse was applied to an invaginated oolemma to breach the membrane and deposit the sperm head at the 9 o’clock position, while the novel spindle complex was oriented at the 12 o’clock position to avoid damaging it.
A cohort of unmanipulated MII oocytes served as a control group and underwent piezo-ICSI in a similar fashion, with the exception that the zona was breached using a stronger piezo pulse instead of a laser.
Assessment of embryonic development
All control and reconstructed embryos that survived manipulation were loaded into micro-wells designed for the time-lapse monitoring system (EmbryoScope, Vitrolife, Sweden). Each micro-well was prepared earlier in the day with 26 µl of KSOM covered with 1.4 ml of mineral oil and incubated at 37°C and 5% CO2 to allow equilibration. The time-lapse system was set at 37°C, 5% CO2, and 5% O2, and embryos were loaded and left undisturbed for up to 96 h after insemination. Each culture dish only contained embryos of the same category (controls, nuclear transfer with cumulus cells, nuclear transfer with ESCs, etc.). The time-lapse system was set to obtain digital images every 10 min.
A single trained member of the research team reviewed and annotated time-lapse images. Specific milestones that were noted included second polar body extrusion (i.e., haploidization), pronuclear formation and the number of pronuclei visualized, pronuclear disappearance (syngamy), and progression to each subsequent cellular division until blastocyst hatching (Video 1). Comparisons were made between the timing of polar body extrusion, pronuclear appearance, and progression to the 2-cell, 4-cell, morula, and blastocyst stages between the control and experimental groups.
Next-generation sequencing
A genomic library of the B6D2F1 female mouse and CD-1 male mouse was prepared using the tail tips of parental mice that were sacrificed for the purposes of this experiment. Whole genome amplification was performed using the SurePlex DNA Amplification kit (Illumina, San Diego, CA, USA). A next-generation sequencing algorithm was prepared and used to determine copy number variation (CNV) of both the control and experimental embryos. For control embryos, the whole blastocyst was used. For experimental embryos, either the entire embryo or a biopsy of 4–8 trophectoderm cells was used.
All necessary labour for this portion of the experiment was performed by our centre’s Preimplantation Genetic Testing Laboratory for the processing and preparation of samples. Our centre’s Applied Bioinformatics Core Laboratory Facility performed all bioinformatic analyses.
Statistical analysis
Statistical analysis was completed using R statistical software, the chi-squared test for comparison of fertilization and development rates, and the Wilcoxon signed-rank test for time-lapse data.
Results
Experimental attrition
Over the course of 28 weeks, 1016 MII oocytes underwent enucleation, of which 84.2% (856/1016) survived. In total, 798 enucleated oocytes underwent nuclear transfer: 586 with cumulus cells (73.3%), 132 with fibroblasts (16.5%), and 80 with mESCs (10.2%). The survival rate for nuclear transfer was 94.6% (755/798). There were 656 reconstructed oocytes that were inseminated by ICSI, of which 56.5% survived (371/656), accounting for the largest attrition within micromanipulation steps. In total, 410 oocytes underwent ICSI for the control group, of which 73.4% (298/410) survived. Of note, some experimental oocytes were removed from the cohort after each step either for quality control purposes or to support concurrent ancillary experiments, explaining the discrepancies within each step in the experiment’s cohort.
Reconstitution, haploidization, and normal fertilization
Haploidization of a somatic nucleus has been empirically considered successful by the extrusion of a pseudo-polar body entailing the separation of a homologue related to the first polar body extrusion in normal oocyte maturation, indicating completion of meiosis I. However, successful reorganization and segregation of its allele into a metaphase II-like spindle was demonstrated by the visualization of a spindle under polarizing light microscopy. This phenomenon was observed in 50.1% of oocytes within 2 h from nuclear transfer. Successful meiotic-like spindle presence according to the female somatic cell nucleus used was at 58.0% (188/324) with cumulus cells, significantly higher than that observed with fibroblasts [37.9% (44/115), P = 0.0002] or with mESCs [31.7% (20/63), P = 0.0001].
The presence of a spindle predicted a higher incidence of pseudo-second polar body extrusion at the time of fertilization at a rate of 48.8% for spindle-positive oocytes versus 8.3% for spindle-negative oocytes (P < 0.0001); this trend held true based on donor cell type, i.e. cumulus cells (62.2% versus 10%, P < 0.001), fibroblasts (25.8% versus 0%, P < 0.0001), and mESCs (62.5% versus 10%, P < 0.0001).
Fertilization was considered normal when two distinct pronuclei appeared concurrently to the abovementioned pseudo-polar body extrusion resulting from the somatic cell haploidization and completed syngamy prior to cleavage. We observed an overall normal fertilization rate for all successfully reconstructed embryos of 31.2% (116/371) (Figure 4), somewhat lower than the 69.5% for control (P < 0.0001). As with the haploidization process, rates of normal fertilization were superior in zygotes derived from spindle-positive (45.2%) versus spindle-negative constructs (8.3%, P < 0.001). The presence of a spindle was associated with higher fertilization rates, even in relation to the donor cell used: cumulus cells (53.3% versus 10%, P < 0.0001), fibroblasts (35.5% versus 0%, P < 0.0001), and mESCs (37.5% versus 10%, P < 0.01). Indeed, no normally fertilized spindle-negative embryos progressed beyond the 2-cell stage.
Fertilization rates of experimental embryos, overall and by cell type.

Embryo cleavage and blastulation
Embryonic developmental milestones assessed for normally fertilized embryos, specifically the progression to the 2-cell, 4-cell, morula, and blastocyst stages, are reported in Figure 5. At the 2-cell stage, the cleavage of experimental embryos is comparable with the control. However, the 4-cell stage is somewhat comparable among the different donor nuclei, albeit lower than the control. From the morula stage, fibroblasts yielded the lowest compaction rate compared with the other two types of nuclei (P < 0.00001), and only oocytes generated by the injection of cumulus cells yielded blastocysts, albeit at a significantly lower rate (P < 0.00001) than a control.
Percentage of fertilized oocytes that developed to the 2-cell, 4-cell, morula and blastocyst stages.

Time-lapse microscopy
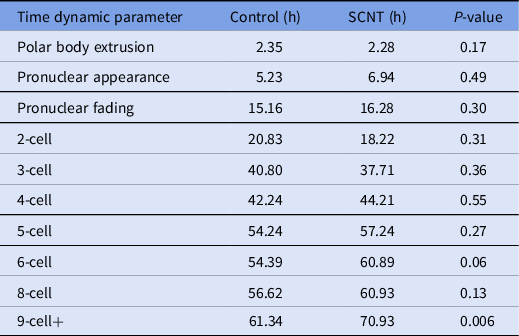
A review of the morphokinetic timing of developmental milestones revealed that the experimental embryos maintained similar timings as the unmanipulated control embryos up to the 4-cell stage; details related to the timing of polar body extrusion and pronuclear appearance followed by syngamy are depicted in Table 1. Notably, the timing of polar body extrusion and pronuclear appearance/disappearance was nearly identical between the experimental and control groups. Progression past the 8-cell stage was significantly delayed by an average of 9 h, and that delay persisted until blastulation. Blastomere fragmentation was also observed in the experimental cohort.
Time-lapse microscopy, average time in hours from ICSI for select developmental milestones in control and overall experimental groups including embryos generated from cumulus cells, fibroblasts and mESCs
Ploidy and heritage determination with next-generation sequencing
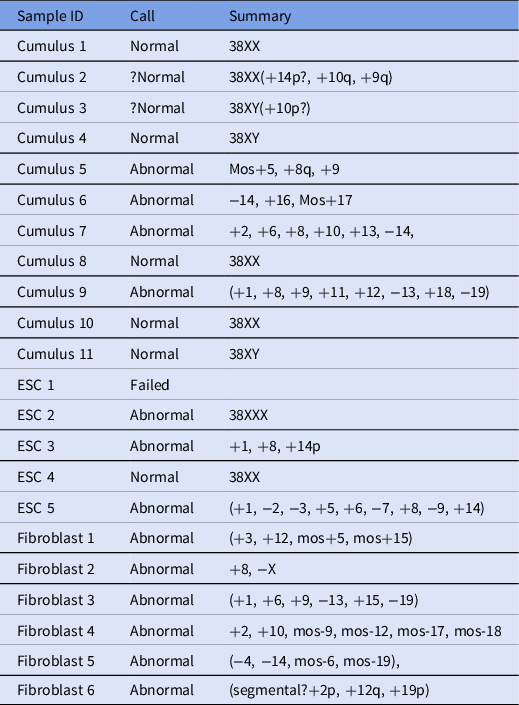
In total, 22 samples were processed and analyzed using next-generation sequencing (Table 2), and 6/22 embryos were found to be euploid (four female and two male). In addition, two embryos were thought to be borderline normal, but because euploidy could not be determined definitively, they were considered abnormal.
Next-generation sequencing results for analyzed samples
Further CNV analysis was performed to ensure that the euploid embryos inherited both parental haploid genomes. CNV analysis confirmed that experimental embryos received allelic contributions from both the paternal and donor maternal genomes (Figure 6).
Karyogram showing allelic contribution from both maternal (red) and paternal (blue) sources.

Discussion
During the last few decades, technological breakthroughs in the field of assisted reproduction have been marked. The most exceptional of these include the introduction of ICSI, which enables a single spermatozoon, regardless of its morphology or motility patterns, to be utilized to fertilize an oocyte (Palermo et al., Reference Palermo, Joris, Devroey and Van Steirteghem1992). More recently, preimplantation genetic testing, used to identify chromosomally normal embryos, has been extremely effective and widely adopted as part of routine infertility treatment (Munné, Reference Munné2002; Franasiak et al., Reference Franasiak, Forman, Hong, Werner, Upham, Treff and Scott2014). These technologies enable the successful treatment of couples with compromised gametes. Conversely, treatment options remain limited for couples with no available male gametes, an exhausted ovarian reserve, or persistent oocyte aneuploidy.
In 2000, some researchers proposed generating genotyped gametes by inducing haploidization of a somatic cell (Tsai et al., Reference Tsai, Takeuchi, Bedford, Reis, Rosenwaks and Palermo2000). This endeavour, however preliminary, was encouraging and energized the effort toward neo-gametogenesis among some reproductive centres (Fulka et al., Reference Fulka, Martinez, Tepla, Mrazek and Tesarik2002; Palermo et al., Reference Palermo, Takeuchi and Rosenwaks2002a; Galat et al., Reference Galat, Ozen, Rechitsky, Kuliev and Verlinsky2005). Nonetheless, many are apprehensive about the technique, and the FDA adopted a stance that inhibited these efforts. A primary criticism of the direct diploid cell haploidization technique was that it was unphysiological and prone to errors due to the inability of chromosomes to reliably segregate, generating artificial gametes with an approximate 10% haploid complement (Tesarik, Reference Tesarik2002). Moreover, the utilization of genetic tests such as Giemsa staining or FISH to assess ploidy, along with the missing information about the recipient ooplast’s ability to properly erase and re-establish imprinting in the donor nucleus, were part of the concern (Eichenlaub-Ritter, Reference Eichenlaub-Ritter2003; Tateno et al., Reference Tateno, Akutsu, Kamiguchi, Latham and Yanagimachi2003a, Reference Tateno, Latham and Yanagimachi2003b).
Recent developments in stem cell differentiation, whether derived from bone marrow, embryonic, or induced pluripotent stem cells, have reignited interest in the generation of haploid germ cells (Toyooka et al., Reference Toyooka, Tsunekawa, Akasu and Noce2003; Nayernia et al., Reference Nayernia, Lee, Drusenheimer, Nolte, Wulf, Dressel, Gromoll and Engel2006; Hayashi et al., Reference Hayashi, Ohta, Kurimoto, Aramaki and Saitou2011; Khampang et al., Reference Khampang, Ki Cho, Punyawai, Gill, Langmo, Nath, Greeson, Symosko, Fowler, Tian, Statz, Steves, Parnpai, White, Hennebold, Orwig, Simerly, Schatten and Easley2021). These studies have helped to clarify the process of halving in vitro a somatic nucleus in an apparently correct and safe manner, yielding virtually mature gametes, whether male or female. These advancements provide reproductive opportunities for infertile individuals with a complete absence of gametes of both genders (Hendriks et al., Reference Hendriks, Dancet, van Pelt, Hamer and Repping2015). Indeed, ASRM guidelines on this topic (Ethics in Embryo Research Task Force, 2020) together with an easing of ethical concerns about heteroplasmy have reset public opinion, as seen with the Wellcome Trust in the United Kingdom and the New Zealand law on three-parent reproduction for mitochondrial replacement therapy.
Our study focused on the process of in vitro gametogenesis and presents the first revised application of the oocyte-mediated female diploid cell haploidization method capable of generating blastocysts with a notable euploidy rate of 27.3%, markedly higher than prior reports (Tesarik Reference Tesarik2002). Indeed, our study was inspired by prior experience using a GV ooplast capable of haploidizing a G2/M-stage somatic nucleus alongside its in vitro maturation, representing a suitable method to prevent age-related oocyte aneuploidy (Palermo et al., Reference Palermo, Takeuchi and Rosenwaks2002a, 2002b). To avoid the maturation step, we have adopted a more direct approach towards neogametogenesis using a mature ooplast to haploidize a donor female somatic cell nucleus at the G0/G1 phase (Tesarik et al., Reference Tesarik, Nagy, Sousa, Mendoza and Abdelmassih2001; Galat et al., Reference Galat, Ozen, Rechitsky, Kuliev and Verlinsky2005).
The revised methodology described here utilizes an enucleation technique performed under real-time spindle visualization ensuring a satisfactory survival rate of 84.2%. Moreover, Sendai virus-mediated fusion (between the donor nucleus and recipient ooplast) achieved a reconstitution rate of 94.6%, somewhat better than in previous reports using electrofusion at 85.4% (Palermo et al., Reference Palermo, Takeuchi and Rosenwaks2002a) and certainly superior to the utilization of polyethylene glycol at a rate at 68% (Fulka et al., Reference Fulka, Martinez, Tepla, Mrazek and Tesarik2002). We reported a 15.6% blastocyst development rate using oocytes generated from the SCNT of cumulus cells as donor nuclei, which was clearly higher than the blastocyst rate of up to 9% reported previously using a similar approach (Heindryckx et al., Reference Heindryckx, Lierman, Van der Elst and Dhont2004). It should be noted that over one-quarter of these blastocysts had a normal euploid karyotype and complement, as demonstrated by the achievement of three healthy offspring from the transfers of 81 embryos. In this study, each stage of embryo development from the pronuclear appearance until the hatching of the blastocyst was meticulously evaluated under time-lapse microscopy. This allowed us to assess directly the embryonic progression of these constructed conceptuses – including the exact timing of polar body extrusion, pronuclear appearance, syngamy, as well as blastomere cleavage and divisional synchrony – and compare it to an unmanipulated control. In addition, we performed the genetic assessment of the conceptuses, once full preimplantation development was complete, by whole exome sequencing, which also provided information on the proper parental chromosomal complement.
We described the performance of different somatic cells as candidate donor female nuclei and their ability to undergo proper haploidization once into an MII ooplast and support the generation of euploid blastocysts. We have also demonstrated that identifying a meiotic-like spindle after nuclear transfer is critical for predicting successful pseudo-polar body extrusion (haploidization), normal fertilization, and subsequent embryonic cleavage. It is important to consider that, despite the improvement demonstrated in our study, the blastulation rate was still suboptimal. Whether this was due to inadequate nuclear reprogramming or the abnormal synchronization of the cell cycle, particularly in the fibroblast and stem cell nuclei utilized, remains to be clarified. Indeed, there was no actual assessment of cell cycle synchrony at the time of nuclear transfer. While no assessment of the epigenome on the resulting embryos was carried out, the ability to obtain healthy offspring with retained fertility somewhat addressed the issue (Lee et al., Reference Lee, Trout, Marti-Gutierrez, Kang, Xie, Mikhalchenko, Kim, Choi, So, Han, Xu, Koski, Ma, Yoon, Van Dyken, Darby, Liang, Li, Tippner-Hedges, Xu, Amato, Palermo, Mitalipov and Kang2022). Another aspect that needs to be evaluated to render this technique feasible for clinical application is the utilization of a genotyped nucleus that could be used in patients with compromised ovarian reserve.
Current research on histone modifications of the somatic donor nucleus to facilitate its reprogramming includes studying methylation patterns, testing a histone deacetylase inhibitor, and focusing on the utilization of a genotyped cell as a donor nucleus carrying the specific genetic makeup of the female partner. While this technology is currently investigational, it has the potential to significantly help women with impaired ovarian reserve or a high aneuploidy rate.
Supplementary material
To view supplementary material for this article, please visit https://doi.org/10.1017/S0967199423000096
Acknowledgements
We would like to thank the clinicians, scientists, embryologists, and nursing staff of the Ronald O. Perelman and Claudia Cohen Center for Reproductive Medicine. We would like to especially thank our centre’s Preimplantation Genetic Testing Laboratory led by Kangpu Xu, and Embryology Laboratory led by Nikica Zaninovic for providing technical support. We would also like to thank Alexandra MacWade for her help in editing the manuscript. Finally, we are especially grateful to Aysha Trout for her help in conducting micromanipulation experiments.
Author contributions
Conceptualization: R.S., P.X., G.D.P.; investigation: R.S., P.X.; writing, original draft: R.S., P.X.; writing, review and editing: R.S., P.X., Z.R., G.D.P.; supervision: Z.R., G.D.P; funding acquisition, G.D.P., Z.R.
Conflict of interest
All authors declare that they have no potential or actual conflicts of interest with respect to the work reported in the article.


 Open access