

1. Introduction
Focal segmental glomerulosclerosis (FSGS) is a descriptive term for a clinicopathological syndrome rather than a single diagnosis. Clinically, there is always proteinuria that is frequently nephrotic. The pathological hallmark is segmental glomerular consolidation or scarring but a wide variety of different histological patterns have been labelled as FSGS. Mutations in several genes have been shown as causes of familial autosomal dominant FSGS, including ACTN4, TRPC6 and INF2, with INF2 accounting for up to 17% of familial cases and ACTN4 and TRPC6 accounting for 3 and 2%, respectively in a recent study of 215 probands (Boyer et al., Reference Boyer, Benoit, Gribouval, Nevo, Tete, Dantal, Gilbert-Dussardier, Touchard, Karras, Presne, Grunfeld, Legendre, Joly, Rieu, Mohsin, Hannedouche, Moal, Gubler, Broutin, Mollet and Antignac2011; Barua et al., Reference Barua, Brown, Charoonratana, Genovese, Sun and Pollak2013).
Alport syndrome is an inherited (usually X-linked) disorder of type IV collagen, which usually presents with persistent microscopic haematuria in children or young adults. Sensorineural deafness is frequent and some patients have eye abnormalities such as anterior lenticonus or retinal flecks (Savige & Colville, Reference Savige and Colville2009). Proteinuria is typically mild at first and increases with age; reaching nephrotic proportions in some patients (Wang et al., Reference Wang, Ding, Guo and Yang2002). The median age of end-stage renal failure in male patients with X-linked disease is the mid-twenties. The clinical phenotype in females with X-linked disease is much milder although some patients do progress to end-stage renal failure (Temme et al., Reference Temme, Peters, Lange, Pirson, Heidet, Torra, Grunfeld, Weber, Licht, Muller and Gross2012). The most typical and significant diagnostic renal biopsy changes are only seen by electron microscopy (EM) where there is a thickening of the glomerular basement membrane (GBM) which has a ‘basketweave’ appearance (Hinglais et al., Reference Hinglais, Grunfeld and Bois1972). Light microscopy (LM) shows non-specific features in the glomerular and tubulointerstitial compartments. For example, the glomeruli may show a spectrum of changes including near-normal appearances, mild mesangial hypercellularity, mesangial proliferation and segmental and global sclerosing lesions. These latter features mimic other glomerular sclerosing lesions in other conditions and primary FSGS. Mutations in the type IV collagen genes, COL4A3, COL4A4 and COL4A5 have been shown to cause Alport syndrome, with mutations in the X-linked gene COL4A5 causing about 85% of the cases.
We describe a family with five generations affected by renal disease. Two individuals (I-1 and II-1, Fig. 1) had renal biopsies and were given a morphological diagnosis of FSGS. This led to the sequencing of the genes TRPC6, INF2 and ACTN4 but no abnormalities were detected. In the current study, we chose to sequence the exomes of two affected family members with the aim of identifying the genetic cause of kidney disease in this family.
Family pedigree diagram showing the results of the validation sequencing on all the family members to determine the presence or the absence of the COL4A5, COL4A4 and NPHS1 genetic changes initially detected by exome sequencing of the proband (III-1) and her grandmother (I-1).

Exome sequencing determines the DNA sequence of the protein coding regions (exons) of the genes across the genome (the ‘exome’). This technology allows rapid and cost-effective screening of all the genes to investigate the genetic basis of the disease and has already been proved to be successful in identifying novel causal mutations in an ever-growing list of both recessive and dominant rare Mendelian disorders (Ng et al., Reference Ng, Turner, Robertson, Flygare, Bigham, Lee, Shaffer, Wong, Bhattacharjee, Eichler, Bamshad, Nickerson and Shendure2009). The strategy has proven effective when very few or even singleton cases are available (Worthey et al., Reference Worthey, Mayer, Syverson, Helbling, Bonacci, Decker, Serpe, Dasu, Tschannen, Veith, Basehore, Broeckel, Tomita-Mitchell, Arca, Casper, Margolis, Bick, Hessner, Routes, Verbsky, Jacob and Dimmock2011), and also as methods for genetic diagnosis (Choi et al., Reference Choi, Scholl, Ji, Liu, Tikhonova, Zumbo, Nayir, Bakkaloglu, Ozen, Sanjad, Nelson-Williams, Farhi, Mane and Lifton2009). Although more than 3000 rare disorders currently have an identified genetic cause (OMIM), at present, UK diagnostic laboratories only provide genetic tests for 535 of these (UKGTN: NHS Directory of Genetic Testing). As the next generation sequencing and specifically exome analysis become more accessible, increasingly cost effective and proves its sensitivity in making diagnoses, it is gaining favour as a viable alternative to the standard methods.
2. Materials and methods
(i) Study subjects
The index patient (III-1) was referred aged 6 years (Fig. 1) following the incidental finding of persistent microscopic haematuria. Examination revealed a well-grown child with height on the 50th centile and weight on the 75th. Blood pressure and fundoscopic examination were normal.
The proband's sister (III-2) was first seen aged 5 years and was generally well with a normal height and weight (both on the 50th centile) and blood pressure. Fundoscopy was normal. Urine dipsticks showed microscopic haematuria and some proteinuria. The urinary protein/creatinine ratio was elevated at 45 mg/mmol and the albumin/creatinine ratio was also elevated at 16·2 mg/mmol. She was therefore started on enalapril.
The father (II-1) of these two girls was found to have proteinuria and chronic kidney disease (plasma creatinine 150 μmol/l) at the age of 32. By the age of 35, he was frankly nephrotic and a renal biopsy showed FSGS. No EM was performed. Four years later he started dialysis. His course was complicated by six episodes of dialysis-associated peritonitis treated with gentamicin and vancomycin. He received a renal transplant at the age of 42. Shortly after the renal transplant he became aware of hearing difficulties. This was attributed to the toxicity of the drugs used to treat his peritonitis. An audiogram at 48 years of age showed bilateral U-shaped sensorineural hearing loss with a threshold of 60–70 dB at 1000–2000 Hz but unexpectedly the threshold at 8000 Hz was only 20–30 dB. Ophthalmological examination was normal.
The index patient's paternal grandmother (I-1) was found to have nephrotic syndrome and renal impairment at the age of 57. A biopsy also showed FSGS. EM of the GBM was reported as showing ‘focal thinning with some disruption of the internal architecture but no definitive basketweave [appearance was] seen. The thin zones are too focal for a definite diagnosis of thin basement membrane disease (TBMD).’ A diagnosis of idiopathic FSGS was made. One year later she started dialysis and she received a transplant 3 years after that. Ophthalmic examination was normal. She has no symptomatic hearing loss and has not had audiology testing.
The great-grandmother of the index patient died of renal failure and a stroke aged 67. Her family doctor had treated her for a ‘kidney problem’ from the age of 35 years and at the age of 55 she started treatment for hypertension. The great-great grandfather of the index patient died of ‘chronic nephritis’ aged 57.
All the participants gave informed consent.
(ii) Exome sequencing
Of the available samples, the proband's sister (III-2) and her paternal grandmother (I-1) (Fig. 1), were selected as being maximally informative for exome sequencing. These are the two confirmed affected individuals most distantly related. Distantly related individuals who share less of their genomes due to relatedness but do share the causal variant allow the number of potential causal variants detected by exome analysis to be minimized.
DNA was extracted from the peripheral blood samples by the salting out method (Miller et al., Reference Miller, Dykes and Polesky1988). Exome capture and sequencing were conducted at the Wellcome Trust Centre for Human Genetics at Oxford University. Data analysis was performed by using an in-house software pipeline, consisting of Novoalign (Novocraft Technologies, Selangor, Malaysia) for read alignment, Samtools (Li et al., Reference Li, Handsaker, Wysoker, Fennell, Ruan, Homer, Marth, Abecasis and Durbin2009) for variant calling and Annovar (Wang et al., Reference Wang, Li and Hakonarson2010) for variant annotation. Full details of the exome sequencing and analysis are given in the supplementary information. The genetic variants detected were filtered to reduce the list to those that were non-synonymous, previously unreported (or flagged as clinically relevant) and present in both affected individuals.
(iii) Validation sequencing
Validation sequencing was conducted in the Wessex Regional Genetics Laboratory on eight family members to verify the variants and confirm segregation. PCR products were sequenced using the standard protocol of the Big-Dye® Terminator v1.1 Cycle Sequencing Kit (Applied Biosystems, USA) and separated on an ABI 3130×l Genetic Analyser (Applied Biosystems, USA). Subsequent data were analysed using the Mutation Surveyor (version 3.1) software (SoftGenetics, USA).
3. Results
(i) Exome sequencing
Both exomes sequenced had >90% of the target genome represented by coverage of at least 20 reads (Supplementary Table S1). A similar number of variants were called in each patient (III-2 = 24 181, I-1 = 24 013), of these they shared 12 162 variants (50%). After excluding the known and the synonymous variants but retaining the variants highlighted as ‘clinically significant’ in dbSNP, III-2 had 93 variants, I-1 had 84 variants and of these 21 were common to both patients (Table 1).
The list of 21 novel or clinical non-synonymous variants detected by exome sequencing which were shared by the two patients analysed

Chr, chromosome; HG19, human genome reference sequence USCS hg19 assembly. ‘Novel’, the variant is absent from the public databases; ‘Clinical’, the variant has been flagged as clinically significant in NCBI dbSNP.
On reviewing the list of 21 genetic variants shared by the two patients, a mutation in COL4A5 (p.G325R, rs104886088), which had previously been identified by Knebelmann et al. (Reference Knebelmann, Deschenes, Gros, Hors, Grunfeld, Zhou, Tryggvason, Gubler and Antignac1992) in a large family with X-linked Alport syndrome was noted. None of the other 20 genes appeared functionally relevant given the patients’ presentations.
To complete a comprehensive analysis, we further examined the exome data for the variants in the other known Alport syndrome or FSGS genes. We generated a list of six genes associated with Alport syndrome (COL4A3, COL4A4, COL4A5, COL4A6, MYH9 and PAX2) and 13 genes associated with FSGS (ACE, ACTN4, ARHGAP24, COL4A3, INF2, MMP14, MYH9, MYO1E, NPHP1, NPHS1, NPHS2, TRPC6, WT1 and WT1-AS) taken from The Human Gene Mutation Database (HGMD Professional 2012·4 – 14 Dec 2012). Exome data from the two patient samples were interrogated by identifying one novel variant in COL4A4 in the grandmother (I-1). This variant (p.R724C), is predicted by in-silico methods to be ‘damaging’ by SIFT and ‘probably damaging’ by Polyphen2. There were no other novel variants in the 19 genes of interest, but there were two rare variants (⩽1%). The first was a non-synonymous change in NPHS1 (p.N188I, rs145125791), which was present in III-2 but not her grandmother. This was predicted ‘probably damaging’ by Polyphen2 but ‘tolerated’ by SIFT. The second was a synonymous change in the ACE gene (p.S346S, rs34680431) in I-1. Since it does not change the amino acid the likelihood of this variant affecting the disease is low.
(ii) Validation sequencing
The COL4A5 Gly325Arg variant was sequenced in eight family members (Fig. 1) and confirmed to segregate with disease following the expected X-linked dominant pattern. This test also showed that the mutation was present in the proband (III-1) and was able to confirm her diagnosis of Alport syndrome.
The COL4A4 (p.R724C) and NPHS1 (p.N188I) variants were also sequenced in all the eight family members. The COL4A4 variant was confirmed in I-1 but did not segregate with the disease and was present in several unaffected family members who had no haematuria. The NPHS1 variant was confirmed to be present in III-1, III-2 and II-2 and absent in all the other family members showing that both the paediatric cases inherited this variant from their mother (Fig. 1).
(iii) Histopathology
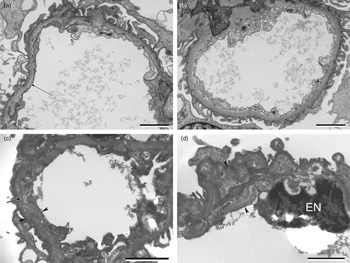
We re-examined the renal biopsy tissue from the wax block from the father (II-1) and the renal biopsy from the resin block from the paternal grandmother (I-1) at the ultrastructural level (Fig. 2). In the father's biopsy, the GBM in some capillary loops showed areas of internal laminations and irregular contouring (‘basketweave’ appearance), probably reflecting GBM damage. However, there are also focal areas of the GBM that appear within the normal limits (Supplementary Fig. S1). There was variability in appearance from abnormal to more normal-appearing areas. In the paternal grandmothers (I-1), renal biopsy but no typical multiple lamellae or granular bodies (‘basketweave’ pattern) were seen at the ultrastructural level. Other ultrastructural appearances are reported in Alport syndrome including thinning of the GBM to 100 nm (normal range approximately 250–350 nm in the UoS/UHS biomedical imaging unit). Interestingly, the possibility of TBMD was raised in the renal biopsy of the paternal grandmother at presentation aged 57 (I-1). We measured the GBM in this patient and found a mean GBM thickness of 379 nm (minimum 307 nm, maximum 512 nm and standard deviation 61 nm). TBMD is probably a heterogeneous group of diseases and in some cases is autosomal recessive with mutations in the COL4A3 and the COL4A4 genes indicating that TBMD is within the family of type IV collagen diseases (Lemmink et al., Reference Lemmink, Nillesen, Mochizuki, Schroder, Brunner, van Oost, Monnens and Smeets1996). The father's biopsy showed more progressive damage than the grandmother's, who presented with renal disease at a later age.
Electron micrographs of the renal biopsy from the grandmother (I-1) (A) and (B) (top), and the father (II-1) (C) and (D) (bottom). (A) and (B) Renal biopsy, grandmother (I-1). (A) Capillary loop showing GBM with subtle linear density (arrow) within the GBM (lamina densa) probably reflecting very minimal GBM splitting. Scale bar=2 μm. (B) Another capillary loop, the GBM appears within the normal limits. Scale bar = 2 μm. (C) and (D) Renal biopsy, father (II-1). EM of tissue retrieved from the wax block. (C) Capillary loop showing the widening of the GBM (arrow heads) with laminations and irregular contouring (arrow) within the GBM reflecting the GBM splitting/damage; the ‘basketweave’ pattern seen in the Alport syndrome. Scale bar = 2 μm. (D) Capillary loop showing an area of widening within the GBM (arrow heads). Endothelial cell nucleus marked EN. Scale bar = 2 μm.
4. Conclusions
The family were referred for exome sequencing querying a genetic cause of familial FSGS after known FSGS genes were ruled out. Exome analysis identified a COL4A5 variant previously implicated in X-linked Alport syndrome suggesting a diagnosis of Alport syndrome in this family rather than familial FSGS (Knebelmann et al., Reference Knebelmann, Deschenes, Gros, Hors, Grunfeld, Zhou, Tryggvason, Gubler and Antignac1992). In the kindred described by Knebelmann et al. the median age of the end-stage disease in the affected males was relatively high at 40 years and only 9 of the 13 affected males had deafness. These figures are consistent with the age of end-stage renal failure and the late onset of deafness in the proband's father in this family. There are no male-to-male transmissions in the family consistent with an X-linked disease. Mutations in the COL4A5 gene are the most frequent cause of Alport syndrome accounting for 85% of the cases (Gale, Reference Gale2013).
The term FSGS does not indicate a single diagnosis. The histological picture to which this name is applied is variable and can be caused by multiple underlying disorders, ranging from genetic abnormalities of the podocyte to hyperfiltration injury. FSGS can be primary or secondary to a wide variety of aetiologies (e.g. healing focal proliferative or necrotizing glomerulonephritis) but the morphological appearances are the same (Howie, Reference Howie2011). The family history in this instance was compatible with autosomal dominant or X-linked inheritance. The only known cause of X-linked FSGS at the time was Alport syndrome. Although the presentation of the index patient with microscopic haematuria was entirely compatible with this diagnosis, the presence of significant proteinuria in her 5-year-old sister, late onset of renal failure and late-onset of atypical deafness in their father, and the lack of typical features in their grandmother's biopsy, made this appear less likely. Very recently, a syndrome of X-linked FSGS with cardiac conduction disorder caused by the mutation of NFX5 has been described (Esposito et al., Reference Esposito, Lea, Maher, Moses, Cox, Magliocca, Angius, Nyholt, Titus, Kay, Gray, Rastaldi, Parnham, Gianfrancesco and Griffiths2013) but the current family did not fit the phenotype.
Autosomal dominant FSGS may be caused by mutations in several genes including INF2, ACTN4, TRP6 and CD2AP. Of these, the INF2 mutations are the most common causing up to 17% of familial cases of FSGS (Boyer et al., Reference Boyer, Benoit, Gribouval, Nevo, Tete, Dantal, Gilbert-Dussardier, Touchard, Karras, Presne, Grunfeld, Legendre, Joly, Rieu, Mohsin, Hannedouche, Moal, Gubler, Broutin, Mollet and Antignac2011). The median age of the end stage renal failure is about 36 years which was compatible with our family, but when sequenced, no mutations in this gene were found.
Patients with ACTN4 mutations typically develop mild proteinuria in the teenage years with some progressing slowly to end stage renal failure. Large, osmiophyllic aggregates within the podocyte cytoplasm have been described on electron microscopic examination of biopsies from these patients (Henderson et al., Reference Henderson, Alexander and Pollak2009). The TRPC6 mutations cause renal disease, which presents between the second and the sixth decades with progression to end stage renal failure about 10 years after presentation (Reiser et al., Reference Reiser, Polu, Moller, Kenlan, Altintas, Wei, Faul, Herbert, Villegas, Avila-Casado, McGee, Sugimoto, Brown, Kalluri, Mundel, Smith, Clapham and Pollak2005; Winn et al., Reference Winn, Conlon, Lynn, Farrington, Creazzo, Hawkins, Daskalakis, Kwan, Ebersviller, Burchette, Pericak-Vance, Howell, Vance and Rosenberg2005). Mutations of CD2AP are a rare cause of mostly sporadic FSGS (Gigante et al., Reference Gigante, Pontrelli, Montemurno, Roca, Aucella, Penza, Caridi, Ranieri, Ghiggeri and Gesualdo2009).
The histopathological diagnosis of Alport syndrome can be difficult because there are a wide variety of appearances depending on the stage of the disease and the progression. Usually, there is a mixed histological picture of glomerular and tubulointerstitial changes. Early in the course of Alport syndrome, the glomeruli may appear within the normal limits on light and EM. Later, there may be mesangial hypercellularity and then focal and segmental sclerosing lesions. Foam cells may appear in the tubulointerstitial compartment. EM is an important diagnostic tool in renal pathology, including the Alport syndrome where the typical lesion is thickening of the GBM, which contains multiple linear lamellae 30–100 nm wide and sometimes smaller round granules 20–50 nm diameter (the ‘basketweave’ pattern).
The reason that Alport disease may be missed is because it can masquerade as different diseases on renal microscopy and both the light and the electron microscopic appearances may not show typical lesions as in the case of this family.
In a recent series of 52 Alport syndrome patients who were initially given an incorrect diagnosis, a diagnosis of FSGS was made in ten patients. Of the female patients with X-linked Alport syndrome given the wrong diagnosis, 34·8% were labelled as FSGS (Yao et al., Reference Yao, Chen, Huang, Yu, Xu, Hu, Wang, Chen, Zeng, Ji, Hu, Tang and Liu2012). Retrospectively, presentation of the proband with haematuria and a family history compatible with X-linked inheritance were consistent with the diagnosis of Alport syndrome in this family.
The recommended treatment for childhood steroid resistant nephrotic syndrome is cyclosporine, followed by mycophenolate with or without high-dose steroids (Kidney Disease: Improving Global Outcomes (KDIGO) Glomerulonephritis Work Group, 2012). Both these treatments have significant toxicities. Recent studies have shown that the early treatment of patients with Alport syndrome using angiotensin converting enzyme (ACE) inhibitors significantly prolongs renal survival and extends life (Gross et al., Reference Gross, Licht, Anders, Hoppe, Beck, Tonshoff, Hocker, Wygoda, Ehrich, Pape, Konrad, Rascher, Dotsch, Muller-Wiefel, Hoyer, Knebelmann, Pirson, Grunfeld, Niaudet, Cochat, Heidet, Lebbah, Torra, Friede, Lange, Muller and Weber2012; Temme et al., Reference Temme, Peters, Lange, Pirson, Heidet, Torra, Grunfeld, Weber, Licht, Muller and Gross2012). Thus, accurate diagnosis allows early, effective treatment of low toxicity. We have also been able to offer a confirmed diagnosis to other family members even where this has not involved a change in treatment. More importantly, we have also been able to reassure unaffected individuals.
A filter-based exome analysis approach involves comparing the variants to databases of known genetic variation such as the Exome Sequencing Project, dbSNP and the 1000 genomes project. When analysing a rare Mendelian disorder, the known and the common variants are assumed to be non-causal and can therefore be excluded. This is a very powerful method to distinguish the causal mutation from a long list of variants produced. However, there are limitations to this approach, such as in later onset diseases where the pre-symptomatic cases may be included in the databases; or when considering interacting mutations which may not have an effect on their own and therefore may be present in unaffected individuals and common in the general population.
A novel variant was detected in the grandmother (I-1) in the COL4A4 gene. COL4A4 mutations cause the autosomal form of the Alport syndrome, though this particular variant has not been reported before. The Arg724Cys variant was predicted to be detrimental by several in-silico methods suggesting that it may be important in the disease. However, sequencing in the family members showed that this variant did not segregate with the disease. A rare (<1%) variant in the ACE gene was also detected in the grandmothers exome data, although did not alter the encoded protein. The clinical importance of these two variants remains unknown, and highlights the difficulty of dealing with variants of unknown significance detected by the next generation sequencing technology.
The median age of the end stage renal failure in the X-linked Alport syndrome in females (49 years) is much later than in males (25 years) and the lifetime risk of end-stage renal failure is also much reduced (Gale, Reference Gale2013). It is unusual then that III-2 in this family has such an early onset of proteinuria. An explanation for the increased severity could be the presence of the second mutation. A rare non-synonymous variant (N188I, rs145125791) in NPHS1 was detected in III-2 which was not present in the grandmother (I-1). Following the sequencing of this variant in all the available family members it was shown that both III-1 and III-2 had inherited this variant from their mother. Although rare (≤1%), this variant has been seen in the other exome cohorts with no disease phenotype reported. However, it has also been reported in several other publications in patients with various forms of nephrotic syndrome (Caridi et al., Reference Caridi, Gigante, Ravani, Trivelli, Barbano, Scolari, Dagnino, Murer, Murtas, Edefonti, Allegri, Amore, Coppo, Emma, De, Penza, Gesualdo and Ghiggeri2009; Buscher et al., Reference Buscher, Kranz, Buscher, Hildebrandt, Dworniczak, Pennekamp, Kuwertz-Broking, Wingen, John, Kemper, Monnens, Hoyer, Weber and Konrad2010; Abid et al., Reference Abid, Khaliq, Shahid, Lanewala, Mubarak, Hashmi, Kazi, Masood, Hafeez, Naqvi, Rizvi and Mehdi2012). Interestingly, this variant was also reported in two siblings with congenital FSGS who both also had truncating mutations in NPHS2 (Koziell et al., Reference Koziell, Grech, Hussain, Lee, Lenkkeri, Tryggvason and Scambler2002). The authors describe digenic inheritance involving the NPHS1 and the NPHS2 genes, requiring a ‘tri-allelic’ hit to modify the phenotype from later onset to congenital FSGS. Further support for the modification of the phenotype through genetic epistasis has recently been shown with NPHS1 and WT1 (McCarthy et al., Reference McCarthy, Bierzynska, Wherlock, Ognjanovic, Kerecuk, Hegde, Feather, Gilbert, Krischock, Jones, Sinha, Webb, Christian, Williams, Marks, Koziell, Welsh and Saleem2013). The proband (III-1) has a less severe phenotype (no proteinuria) than her younger sister who has a markedly earlier age of onset compared with her grandmother. There are many potential causes for clinical heterogeneity within families. Although speculative, it may be the case in this family, that the NPHS1 variant (predicted to be deleterious) is modifying the Alport syndrome phenotype, resulting in an early onset of the symptoms and confounding the effect of the known COL4A5 variant. Although the N188I variant in NPHS1 has not been proven to be sufficient to cause disease, its role is biologically plausible in that it disrupts an N-glycosylation site required for the localization of nephrin to the plasma membrane (Yan et al., Reference Yan, Khoshnoodi, Ruotsalainen and Tryggvason2002). The variation in severity in females may be due to skewed X-inactivation, however, without access to the biopsy material from the appropriate tissues from both individuals, this cannot be tested.
This study shows the power of exome sequencing in the diagnostics. In this family, we identified a mutation causing Alport syndrome. Sequencing only two individuals proved highly sensitive in discriminating potential disease-causing mutations from the many thousands of variants observed in the exome of every individual. Sequencing and Multiplex Ligation-dependent Probe Amplification (MLPA) of the COL4A5 gene currently costs £863 and the combined cost of the COL4A3 and the COL4A4 genes is £1366. Exome sequencing is substantially cheaper (∼£800 per sample) and robust to heterogeneous and non-specific clinical presentation. A limitation of exome sequencing is that it is estimated that about 13% of the X-linked Alport syndrome mutations are intronic, which would not be detectable by this method (King et al., Reference King, Flinter, Nihalani and Green2002). However, an advantage is the ability to detect novel epistatic relationships between the genes since, in a gene-by-gene approach, testing would normally be concluded after the first mutation was detected. In this family, the diagnosis of Alport syndrome has allowed appropriate treatment, testing of other family members, the early diagnosis in the proband's sister and the reassurance of the unaffected family members. Along with providing a diagnosis, identification of the underlying genetics causing disease may prove helpful in predicting the prognosis without the need for an invasive kidney biopsy (Gale, Reference Gale2013).
Supplementary material
The online data can be found available at http://dx.doi.org/10.1017/S0016672313000220.
The authors would like to thank Nikki J. Graham from the DNA Laboratory in Human Genetics & Genomic Medicine, University of Southampton; David Buck and Lorna Gregory from the Wellcome Trust Centre for Human Genetics, Oxford University; and Dave Robinson at the Wessex Regional Genetics Laboratory. The authors acknowledge the use of the IRIDIS High Performance Computing Facility, at the University of Southampton. Most importantly, the authors would like to thank the proband and her family members.
Financial support
Development of the next generation sequencing analysis pipeline utilized in this project was supported by funding (for JG) from Cancer Research UK.
Statement of Interest
None.
Ethical standards
The authors assert that all the procedures contributing to this work comply with the ethical standards of the relevant national and institutional committees on human experimentation and with the Helsinki Declaration of 1975, as revised in 2008.


